- 1Hydrographic and Oceanographic Department, Japan Coast Guard, Tokyo, Japan
- 2Institute of Industrial Science, University of Tokyo, Tokyo, Japan
Global Navigation Satellite System–Acoustic ranging combined seafloor geodetic technique (GNSS-A) has extended the geodetic observation network into the ocean. The key issue for analyzing the GNSS-A data is how to correct the effect of sound speed variation in the seawater. We constructed a generalized observation equation and developed a method to directly extract the gradient sound speed structure by introducing appropriate statistical properties in the observation equation, especially the data correlation term. In the proposed scheme, we calculate the posterior probability based on the empirical Bayes approach using the Akaike’s Bayesian Information Criterion for model selection. This approach enabled us to suppress the overfitting of sound speed variables and thus to extract simpler sound speed field and stable seafloor positions from the GNSS-A dataset. The proposed procedure is implemented in the Python-based software “GARPOS” (GNSS-Acoustic Ranging combined POsitioning Solver).
Introduction
Basic Configurations of the GNSS‐A Observation
Precise measurements of seafloor position in the global reference frame opens the door to the “global” geodesy in the true sense of the word. It extended the observation network for crustal deformation into the ocean and has revealed the tectonic processes in the subduction zone including megathrust earthquakes (e.g., Bürgmann and Chadwell, 2014; Fujimoto, 2014, for review). Many findings have been reported especially in the northwestern Pacific along the Nankai Trough (e.g., Yokota et al., 2016; Yasuda et al., 2017; Yokota and Ishikawa, 2020), and the Japan Trench (e.g., Kido et al., 2011; Sato et al., 2011; Watanabe et al., 2014; Tomita et al., 2015; Tomita et al., 2017). These achievements owe to the development of GNSS-A (Global Navigation Satellite System–Acoustic ranging combined) seafloor positioning technique, proposed by Spiess (1980).
Observers can take various ways to design the GNSS-A observation for the positioning of the seafloor benchmark. They have to solve the difficulties not only in the technical realizations of GNSS-A subcomponents such as the acoustic ranging and the kinematic GNSS positioning, but also in designing the observation configurations and analytical models to resolve the strongly correlated parameters. For example, because the acoustic ranging observations are performed only on the sea surface, the sound speed perturbations and the depth of the benchmark are strongly correlated.
In the very first attempt for the realization, Spiess et al. (1998) derived horizontal displacement using a stationary sea-surface unit which was approximately placed on the horizontal center of the array of multiple seafloor mirror transponders. They determined the relative positions and depths of the transponders in advance. The relative horizontal positions of the sea-surface unit to the transponder array can be determined by acoustic ranging data, to be compared with its global positions determined by space geodetic technique. In this “stationary” GNSS-A configuration, the temporal variation of sound speed is less likely to affect the apparent horizontal position under the assumption that the sound speed structure is horizontally stratified. Inversely, comparing the residuals of acoustic travel time from multiple transponders, Osada et al. (2003) succeeded in estimating the temporal variation of sound speed from the acoustic data. Kido et al. (2008) modified the expression to validate the stationary configuration for a loosely tied buoy even in the case where the sound speed has spatial variations. The stationary GNSS-A configuration is applied mainly by the groups in the Scripps Institution of Oceanography (e.g., Gagnon et al., 2005; Chadwell and Spiess, 2008) and in the Tohoku University (e.g., Fujimoto, 2014; Tomita et al., 2015; Tomita et al., 2017).
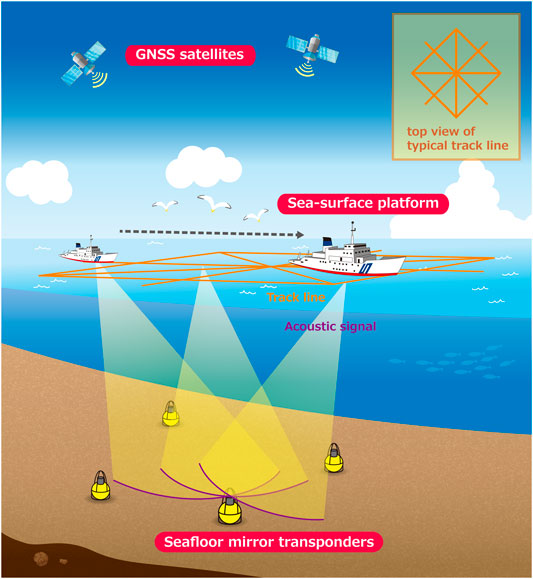
On the other hand, Obana et al. (2000) and Asada and Yabuki (2001) took a “move-around” approach where the 3-dimensional position of single transponder can be estimated by collecting the acoustic data from various relay points on the sea surface. Figure 1 shows the schematic image of move-around configuration. The move-around GNSS-A configuration is developed and practicalized mainly by the collaborative group of the Japan Coast Guard and the University of Tokyo, and the Nagoya University. Unlike the stationary configuration, the horizontal positions of transponders are vulnerable to bias errors of sound speed field. Fujita et al. (2006) and Ikuta et al. (2008) then developed the methods estimating both the positions and the temporal variations of sound speed.
Similar to the effects of distribution of the GNSS satellites on the positioning, well-distributed acoustic data is expected to decrease the bias errors of the estimated transponders’ positions in the move-around configuration. By implementing the sailing observations where the sea-surface unit sails over the transponder array to collect geometrically symmetric data, positioning accuracy and observation efficiency have improved (Sato et al., 2013; Ishikawa et al., 2020).
In order to enhance the stability of positioning, an assumption that the geometry of transponder array is constant over whole observation period is usually adopted (e.g., Matsumoto et al., 2008; Watanabe et al., 2014; Chen et al., 2018; Yokota et al., 2018). Misestimates of sound speed cause the positional biases parallel to the averaged acoustic-ray direction, which results in the distortion of the estimated array geometry. Constraining the array geometry contributes to reducing the bias error in the sound speed estimates and the transponders’ centroid position.
It should be noted that these two configurations are compatible under the adequate assumptions and constraints. Recently, the group in the Tohoku University uses not only the stationary but also the move-around observation data collected for determining the array geometry (Honsho and Kido, 2017).
Recent Improvements on GNSS-A Analytical Procedures
In the late 2010s, analytical procedures with the estimation of the spatial sound speed gradient for the move-around configuration have been developed. In the earlier stage of the move-around GNSS-A development, the spatial variations of sound speed were approximated as the temporal variations, because most of the sound speed change are confined in the shallowest portion along the acoustic ray paths (e.g., Watanabe and Uchida, 2016). Actually, Yokota et al. (2019) extracted the spatial gradient of the sound speed in the shallow layer from the estimated temporal sound speed variation. However, the smoothly modeled temporal variations cannot represent the transponder-dependent variation which is caused by the sound speed gradient in the relatively deeper portion. Therefore, Yokota et al. (2019) extracted the transponder-dependent correction term from the residuals of the results derived by the conventional method of Fujita et al. (2006).
Yasuda et al. (2017) took a different approach where the sound speed structure shallower than 1,000 m is assumed to be inclined in one direction due to the Kuroshio current flowing near their sites in the offshore region south of Kii Peninsula, Japan. Because their model reflects the specific oceanographic feature, the estimated parameters are easier to be interpreted than that of Yokota et al. (2019) which has higher degree of freedom to extract the oceanographic features.
Meanwhile, Honsho et al. (2019) showed a more general expression for one-directional sound speed gradient. As they mentioned, the gradient terms in their formulation correspond to the extracted features in Yokota et al. (2019). The work by Honsho et al. (2019) showed the possibility to connect all the GNSS-A configurations into a unified GNSS-A solver. However, due to the limitation in resolving the general gradient structure, an additional constraint was taken for the practical application, which is essentially the same formulation as Yasuda et al. (2017).
In this study, to overcome the limitation above, we propose a method to directly extract the gradient sound speed structure by introducing appropriate statistical properties in the observation equation. This paper first shows the reconstructed general observation equation for GNSS-A, in which the continuity of the sound speed field in time and space is assumed. The generalized formulation approximately includes the practical solutions in the previous studies by Yasuda et al. (2017), Yokota et al. (2019), and Honsho et al. (2019) as special cases. We then describe the analytical procedure to derive the posterior probability based on the empirical Bayes approach using the Akaike’s Bayesian Information Criterion (ABIC; Akaike, 1980) for model selection. We obtain the solution which maximizes the posterior probability under the empirically selected prior distribution. This is implemented in the Python-based software “GARPOS” (GNSS-Acoustic Ranging combined POsitioning Solver; Watanabe et al., 2020a, available at https://doi.org/10.5281/zenodo.3992688).
Methodology
Positioning of Sea-Surface Transducer
The key subcomponent of the GNSS-A is the global positioning of the transducer, generally realized by GNSS observation. Whereas acoustic measurement determines the relative position of the seafloor transponder and the sea-surface transducer, GNSS plays a role to align them to the earth-centered, earth-fixed (ECEF) coordinates such as the International Terrestrial Reference Frame (ITRF). When the transducer’s position,
It should be noted that the transponders’ positions are generally a function of time, including the solid earth tide as well as global and local crustal deformation (e.g., IERS Conventions, 2010). For the purpose of detecting crustal deformation, it is better to determine the seafloor positions in the solid-earth-tide-free coordinates. Because the observation area is limited to several-kilometers-width, solid-earth-tide-free solutions can be obtained when the trajectory of the transducer is determined in the solid-earth-tide-free coordinates. Hereafter, the positions are expressed in solid-earth-tide-free coordinates in this paper.
In order to determine
with,
The ATD offset values should be measured before the GNSS-A observation.
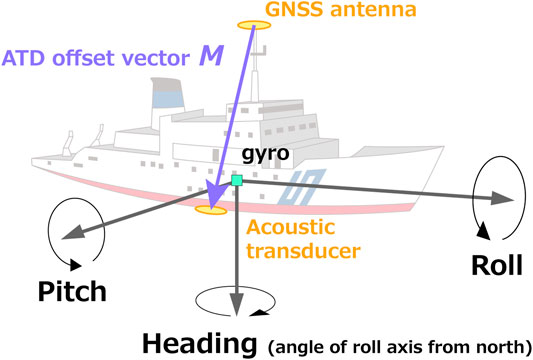
FIGURE 2. Definitions of the attitude parameters and the ATD offset vector for the sea-surface platform. Heading is zero when the roll axis directs to the north. The roll and pitch axes direct forward and rightward (portside) of the vessel, respectively.
Underwater Acoustic Ranging
Another key subcomponent is the technique to measure the acoustic travel time between the sea-surface transducer and the seafloor transponders. The techniques for the precise ranging using acoustic mirror-type transponders had been developed and practicalized in early studies (e.g., Spiess, 1980; Nagaya, 1995). Measuring round-trip travel time reduces the effect of advection of the media between the instruments.
The round-trip travel time for the
where
Although the concrete expression is provided as the eikonal equation (e.g., Jensen et al., 2011; Sakic et al., 2018), it requires much computational resources to numerically solve. When the sound speed structure is assumed to be horizontally stratified, we can apply a heuristic approach based on the Snell’s law (e.g., Hovem, 2013), which has an advantage in computation time (e.g., Chadwell and Sweeney, 2010; Sakic et al., 2018).
Therefore, we decomposed the 4-dimensional sound speed field into a horizontally stratified stational sound speed profile and a perturbation to obtain the following travel time expression:
where
In the right-hand side of Eq. 3,
Sound Speed Perturbation Model
In seawater, sound speed is empirically determined as a function of temperature, salinity, and pressure (e.g., Del Grosso, 1974). Because these variables strongly depend on the water depth, the vertical variation of the sound speed is much larger than the horizontal variation in the observation scale. Thus,
Recalling that the sound speed field is continuous and usually smooth in time and space within the observation scale, we can introduce a scalar field which is continuous with time and acoustic instruments’ positions, i.e.,
For simplification, we put the sound speed perturbation model as time-varying linear spatial function in space as follows:
where
Each coefficient can be represented by a linear combination of basis functions
where
Because the initial values for
Rigid Array Constraints
Usually, the local deformation within the transponders’ array is assumed to be sufficiently small, so that the same array geometry parameters can be used throughout all visits. Because the relative positions of the transponders in the array are strongly coupled with the sound speed estimates and the position of array centroid, constraining the array geometry is expected to stabilize the GNSS-A solutions. Matsumoto et al. (2008) developed the rigid-array constraint method, which has been adopted in the subsequent studies (e.g., Watanabe et al., 2014; Yokota et al., 2016) except in the cases where the rigid-array assumption is inadequate (e.g., Sato et al., 2011).
To implement the rigid-array constraint, slight change in the observation equation is needed. We divide the transponders’ positions as
Meanwhile,
Analytical Procedures
Observation Equation
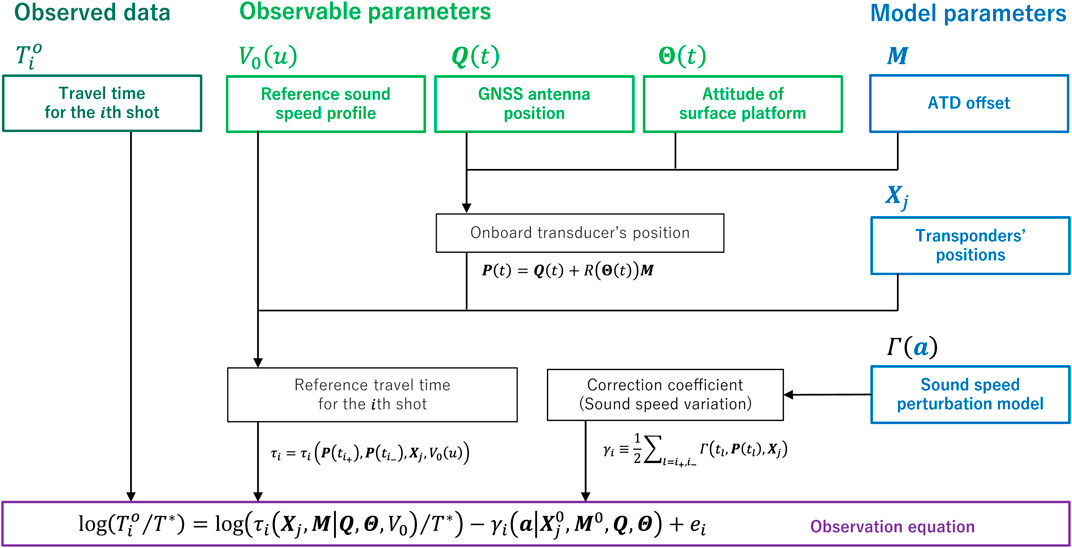
In the GNSS-A analysis, observed travel time,
or in the form with the rigid-array constraint,
where
This section shows the algorithm to estimate the model parameters from the nonlinear observation equation (Eq. 6). We took a Bayesian approach because of its simple expression when incorporating prior information. Furthermore, it provides a well-defined index for the model selection, i.e., the Akaike’s Bayesian Information Criterion (ABIC; Akaike, 1980). The expansion shown in this section is based on Tarantola and Valette (1982) and Matsu’ura et al. (2007).
Prior Information
The observation equation can be rewritten as,
where
where
where
For the model parameter
where,
Then, the prior pdf can be written using the hyperparameter
where
Combining these prior informations, we obtain the following prior pdf:
with
where
Variance-Covariance of Data Error
Now for the observed data, we take the assumption that
where
The major error sources for the measurement and calculation of travel time are 1) measurement error when reading the return signal, 2) transducer’s positioning error, and 3) modeling error of the sound speed field. Non-diagonal components of
whose formulation refers to Fukahata and Wright (2008). Eq. 14 means that the densely sampled data would have smaller weights in the model than the isolated data. A factor
Subsequently, we consider the diagonal component of
Posterior Probability
The posterior pdf after the data acquisition, which can be defined to be equal to the likelihood of the model parameter with the given data, can be written as,
with,
where
Defining
where
We can solve the nonlinear equation (Eq. 16) numerically by performing an iterative method, where
to satisfy the following convergence criteria:
Ignoring the term
Therefore, the linearized variance-covariance matrix around
Hyperparameter Tuning
The appropriate values of the hyperparameters can be determined by minimizing Akaike’s Bayesian Information Criteria (ABIC; Akaike, 1980),
where
where
which is derived from the condition that the partial derivative of ABIC with respect to
Features of “GARPOS”
GARPOS (Watanabe et al., 2020a; available at https://doi.org/10.5281/zenodo.3992688) has been developed to implement the GNSS-A analysis procedure. GARPOS is compatible with Python 3, with other packages NumPy, SciPy, pandas, and matplotlib. These packages are pre-installed in most of the Python distributions such as Anaconda. Sample scripts and data for testing GARPOS are also stored in the repository.
GARPOS is distributed as a series of files, which requires a driver script to run. The toolset consists of multiple Python files and a Fortran 90 library for ray tracing. GARPOS requires the following input files:
(I-1) Initial site parameter file (in Python’s configuration format),
(I-2) Acoustic observation data file (in csv format),
(I-3) Reference sound speed data file (in csv format),
(I-4) Setting file (in Python’s configuration format).
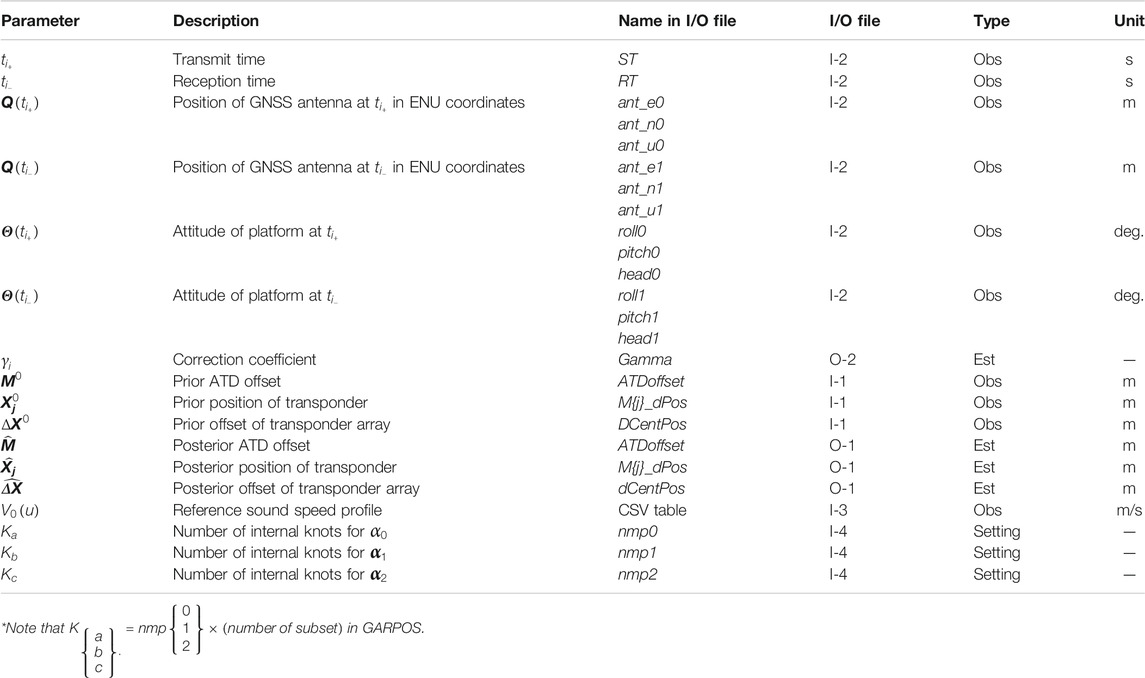
Initial site parameter file (I-1) contains the initial values of the transponders’ positions, the ATD offset and the relevant prior covariance information, as well as the metadata for the observation site and conditions. Acoustic observation data file (I-2) contains the list of the observation data associated with each acoustic ranging, such as travel time, positions, attitude and other metadata. Reference sound speed data file (I-3) contains the reference sound speed profile approximated into a polygonal curve. Setting file (I-4) contains the parameters to control the analysis procedures including the hyper parameters. Users can put the lists of candidates of hyperparameters in which the best combination may be within. The parameters
The results are written in the following output files:
(O-1) Estimated site parameter files (in Python’s configuration format),
(O-2) Modified acoustic observation data file (in csv format),
(O-3) Model parameter list file (in csv format),
(O-4) Posterior variance-covariance matrix file (in csv format).
Estimated site parameter files (O-1) is written in the same format as the file (I-1). Modified acoustic observation data file (O-2) contains the calculated travel time data and the coefficients of sound speed perturbation model, as well as the original data/metadata set in (I-2). Model parameter list file (O-3) and posterior variance-covariance matrix file (O-4) contain the whole estimated model parameter vector and its variance-covariance, respectively.
Major input/output parmeters and hyperparameters for GARPOS are listed in Tables 1 and 2, respectively.
We developed GARPOS to be compatible with both observation configurations. When handling the GNSS-A data collected in the stationary configurations, we should process data with some constraints on model parameters. Specifically, 1) upward components of transponders’ positions should be fixed to zero, and 2) spatial gradient components of the sound speed perturbation model should not be solved, i.e.,
Applications to the Actual Data
Data and Settings
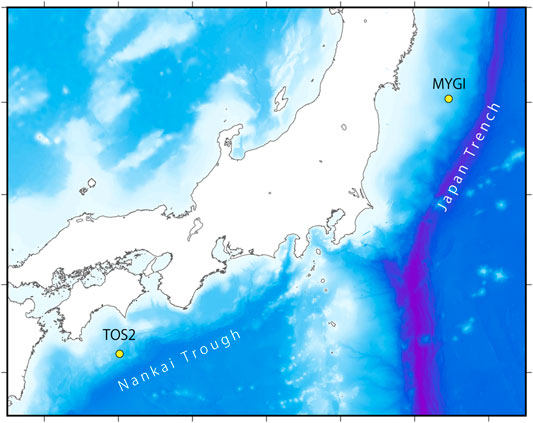
In order to verify the proposed analytical procedure, we reanalyzed the GNSS-A data at the sites named “TOS2” and “MYGI” (Table 3; Figure 4) in 2011–2019. The test sites were selected for several reasons: 1) whereas TOS2 is expected to move at almost constant rate, MYGI will show the transient displacement due to the postseismic crustal deformation of the 2011 Tohoku-oki earthquake; 2) the oceanographic environments are different, i.e., the effect of the Kuroshio current is dominant at TOS2; but 3) the depths of both sites are almost the same. The observation epochs used in this study is listed in Supplementary Tables S1 and S2. The datasets used in this study are available at https://doi.org/10.5281/zenodo.3993912 (Watanabe et al., 2020b).
Acoustic round-trip travel times were measured on the survey vessel using the hull-mounted acoustic transducer (e.g., Ishikawa et al., 2020). Processing delays in the acoustic devices were subtracted from the acoustic data beforehand.
Solid-earth-tide-free positions of GNSS antenna
Along with the acoustic observations, the profiles of temperature and/or conductivity were measured by CTD, XCTD or XBT probes several times. The reference sound speed profile,
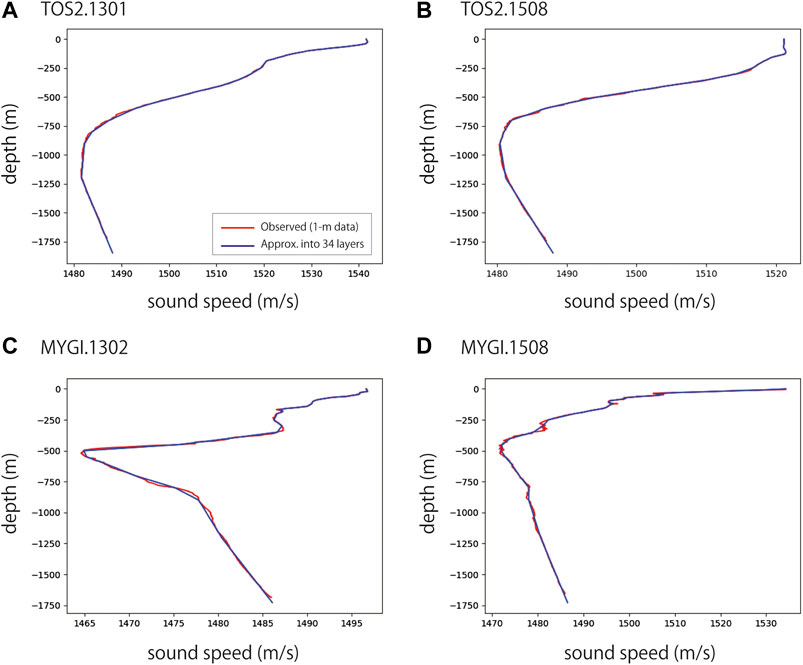
FIGURE 5. Reference sound speed profiles (blue lines) for epochs (A) TOS2.1301 (January 2013), (B) TOS2.1508 (August 2015), (C) MYGI.1302 (February 2013), and (D) MYGI.1508 (August 2015). Red lines indicate 1-m sound speed profiles obtained from the 1-m layered XBT/XCTD data.
During a GNSS-A survey, the vessel sails on a pre-determined track over the seafloor transponder array to collect geometrically balanced acoustic data (e.g., Figure 1). The along-track observation (called “subset”, hereafter) is repeated several times by reversing the sailing direction in order to reduce the bias due to the errors in the ATD offset.
During an observation cruise, it occasionally took more than a few weeks to collect sufficient acoustic data at a single site due to weather conditions or other operational restrictions. Even so, we compiled a single dataset per site per cruise for the static seafloor positioning in practice, because the positional changes should be too small to detect. We call the collection of a single GNSS-A dataset “observation epoch” or “epoch”, hereafter.
We set the parameters for the numbers of basis functions,
Array Geometry Determination
In order to calculate the proper array geometry
with,
where
The preliminary array-free positioning was also used for the verification of the collected data. We eliminated the outliers whose discrepancies from the preliminary solution were larger than the arbitrary threshold. We set the threshold to be 5 times as large as the root mean square value (RMS) of the travel time residuals.
Hyperparameter Search
In order to get the solution
In order to save the computational resources, we should further reduce the number of hyperparameters. We tentatively put
Results
Figure 6 shows the time series of the estimated positions at sites TOS2 and MYGI. The positions are aligned to the ITRF2014 (Altamimi et al., 2016) and transformed into local ENU coordinates. Comparing the time series derived by the existing scheme (SGOBS version 4.0.2; used in Yokota et al., 2019), GARPOS reproduced almost the same trends for both sites. GARPOS might have succeeded in slightly suppressing the dispersion around the averaged velocity extracted from the neighboring epochs. Whereas the previous method corrected the sound speed gradient structure with step-by-step procedure, the proposed method has an advantage in directly extracting the structure by simultaneous estimation of all parameters.
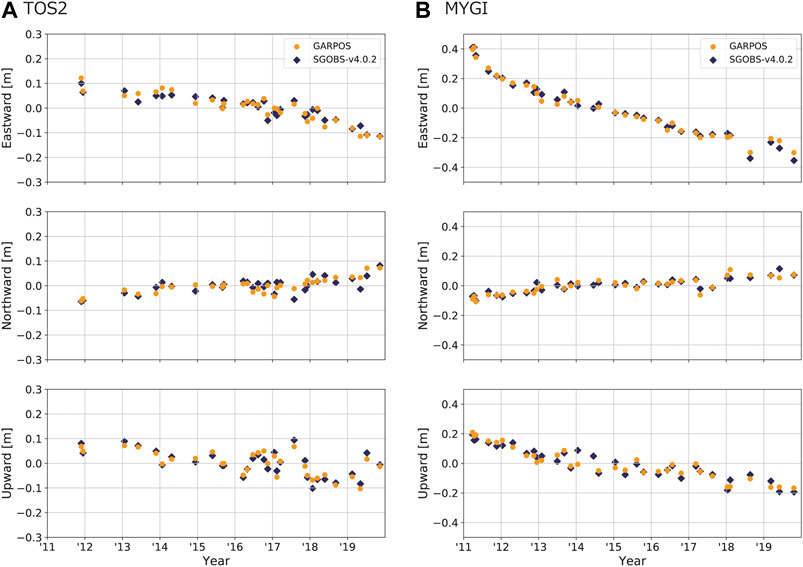
FIGURE 6. Time series of displacement at (A) TOS2 and (B) MYGI solved by GARPOS (orange circles) and SGOBS version 4.0.2 (blue squares). The positions are aligned to the ITRF 2014.
TOS2 is located offshore in the south of Shikoku Island, southwestern Japan, above the source region of the 1946 Nankaido earthquake (e.g., Sagiya and Thatcher, 1999) along the Nankai Trough. According to Yokota and Ishikawa (2020), who investigated the transient deformations at the GNSS-A sites along the Nankai Trough, no significant signal was detected at TOS2. The results by the proposed method show the same trends as the conventional results. Although the trend of horizontal displacement seems to be changed in 2018 or 2019, careful inspection is needed because the transponders had been replaced during this period.
MYGI is located in the offshore east of Miyagi Prefecture, northeastern Japan, which experienced the 2011 Tohoku-oki earthquake (Sato et al., 2011). After the earthquake, significant westward postseismic movement and subsidence due to the viscoelastic relaxation has been observed at MYGI (Watanabe et al., 2014). The postseismic movements continue but appear to decay. It is true that the changes in the displacement rate at these sites are crucial in seismic and geodetic researches, but discussing these matters is beyond the scope of the present paper. The point is that the seafloor positioning results were well reproduced by the proposed method.
Discussions
Interpretations for the Correction Coefficient
As mentioned in Sound Speed Perturbation Model, it is convenient to relate the correction coefficient to the sound speed perturbation by assuming the case for
The early models by Fujita et al. (2006) and Ikuta et al. (2008) took only the term
In addition to estimating the term identical to
In order to show the relationship with other conventional models, we expand the proposed formulation to those by Yasuda et al. (2017), Honsho et al. (2019), and Kinugasa et al. (2020). Because Honsho et al. (2019) practically assumed 1-directional sound speed gradient, they constructed the model basically in the 2-dimensional plane spanned by the gradient direction and vertical direction.
For simplification, we assume that the ray path is a straight line connecting both ends. Putting
Furthermore, assuming that the transmit/reception positions are the same and that the difference between transmit/reception time is so small that
Because
where
Considering the case where
From Eqs 26 and 29, the following relationships are derived:
In Honsho et al. (2019),
Similarly, when extending
though they consequently use the assumption that
Honsho et al. (2019) supposed the physical model where a spatially homogeneous 1-directional gradient of slowness lies in the certain layer, from sea-surface to the depth
In the proposed method, the sound speed field is approximately interpreted by their models when the unit vector of
When
In addition to the simple model above, the proposed method can extract more complicated sound speed field, which partly described by Yokota and Ishikawa (2019). Extracted parameters for the sound speed perturbation indicate the complicity of oceanographic structure, as shown in the next section.
Validity of Extracted Sound Speed Perturbation Model
Typical examples for the estimation results for each observation, i.e., the time series of travel time residuals, and sound speed perturbation interpreted from the correction coefficient, are shown in Figure 7. Results for all the datasets are available in Supplementary Figure S1.
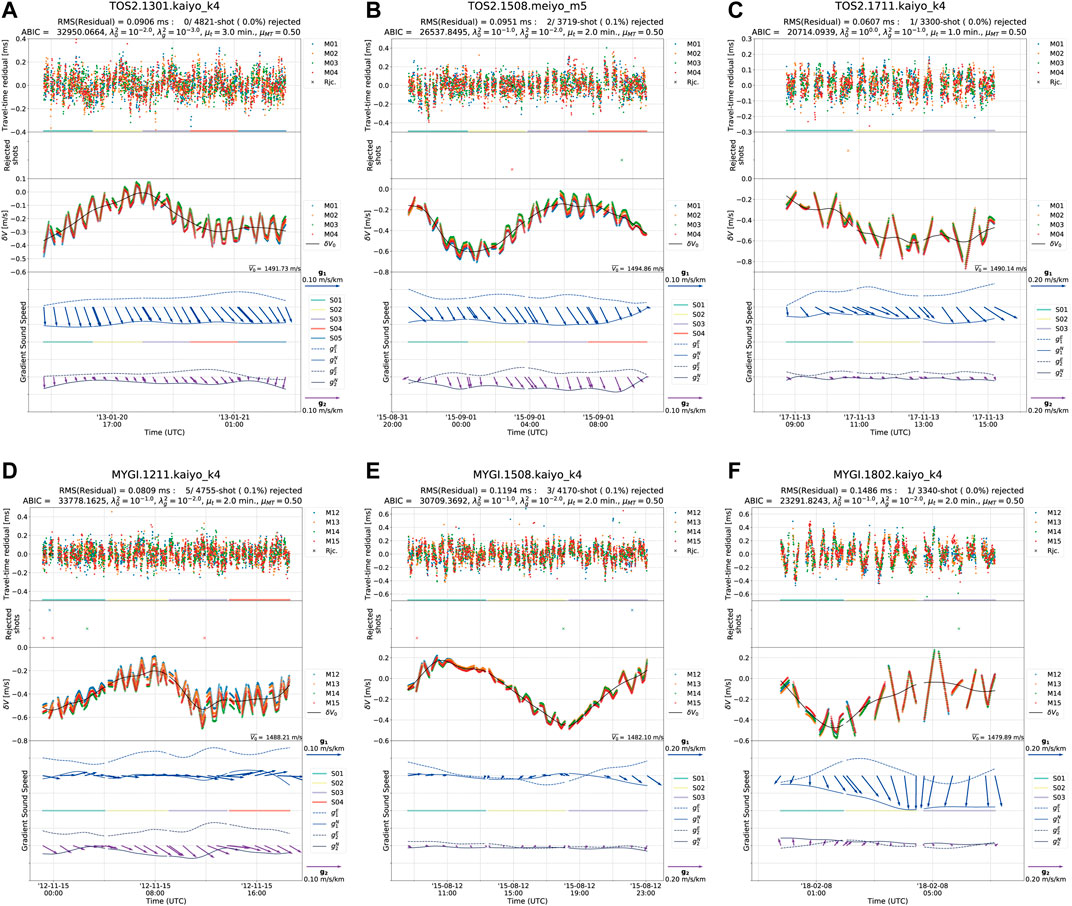
FIGURE 7. Estimated results of the most preferred model for epochs (A) TOS2.1301.kaiyo_k4, (B) TOS2.1508.meiyo_m5, and (C) TOS2.1711.kaiyo_k4, (D) MYGI.1211.kaiyo_k4, (E) MYGI.1508. kaiyo_k4, and (F) MYGI.1802. kaiyo_k4. The top panels show the model residuals of the round-trip travel time. The second panels show the rejected acoustic data in the preprocessing step for determining the array geometry. The third panels indicate the sound speed perturbations, i.e.,
In the most cases for site TOS2, both terms of the estimated sound speed gradient vector stably direct south to southeast. Because the sound speed increases with the water temperature, it means that the water temperature is higher in the southern region. The results that
In contrast, the directions of gradient terms at MYGI have less constancy than TOS2. Unlike the area around TOS2 where the Kuroshio current dominantly affects the seawater structure, MYGI is located in an area with a complicated ocean current system (e.g., Yasuda, 2003; Miyazawa et al., 2009). Watanabe and Uchida (2016) have also shown that the temperature profiles at MYGI vary widely with observation epochs. These features cannot be resolved by the simpler model with single sound speed gradient parameter.
The complexity in the sound speed variation at MYGI tends to lead to large variations in the residual travel time. Nevertheless, the proposed method successfully extracted the smooth sound speed structure for many observation epochs, except a few epochs such as June 2013 (MYGI.1306.kaiyo_k4) and June 2019 (MYGI.1906.meiyo_m5) shown in Supplementary Figure S1. In these epochs, relatively larger values for the hyperparameter
Preferred models for all the tested epochs had positive values for data correlation length,
In order to discuss the effects of the data covariance, we tested the cases for the models without assuming the data correlation, i.e.,
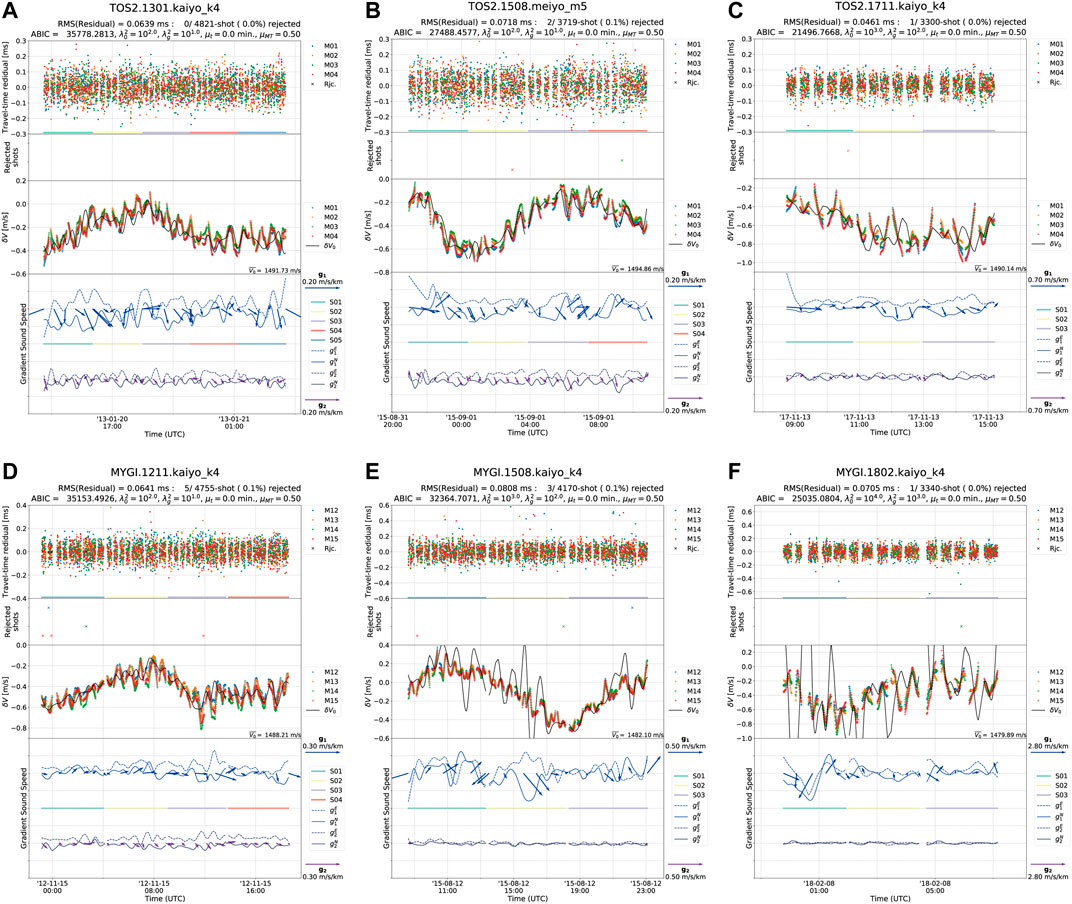
FIGURE 8. Same as Figure 7, but for the most preferred model in the models with
To confirm the stability of the seafloor positioning results, the differences of seafloor position for the tested models from the most preferred models are summarized in Figure 9. The differences in estimated positions for most of the tested models converged in several centimeters. For both sites, variations in the vertical component tend to be larger for larger values of
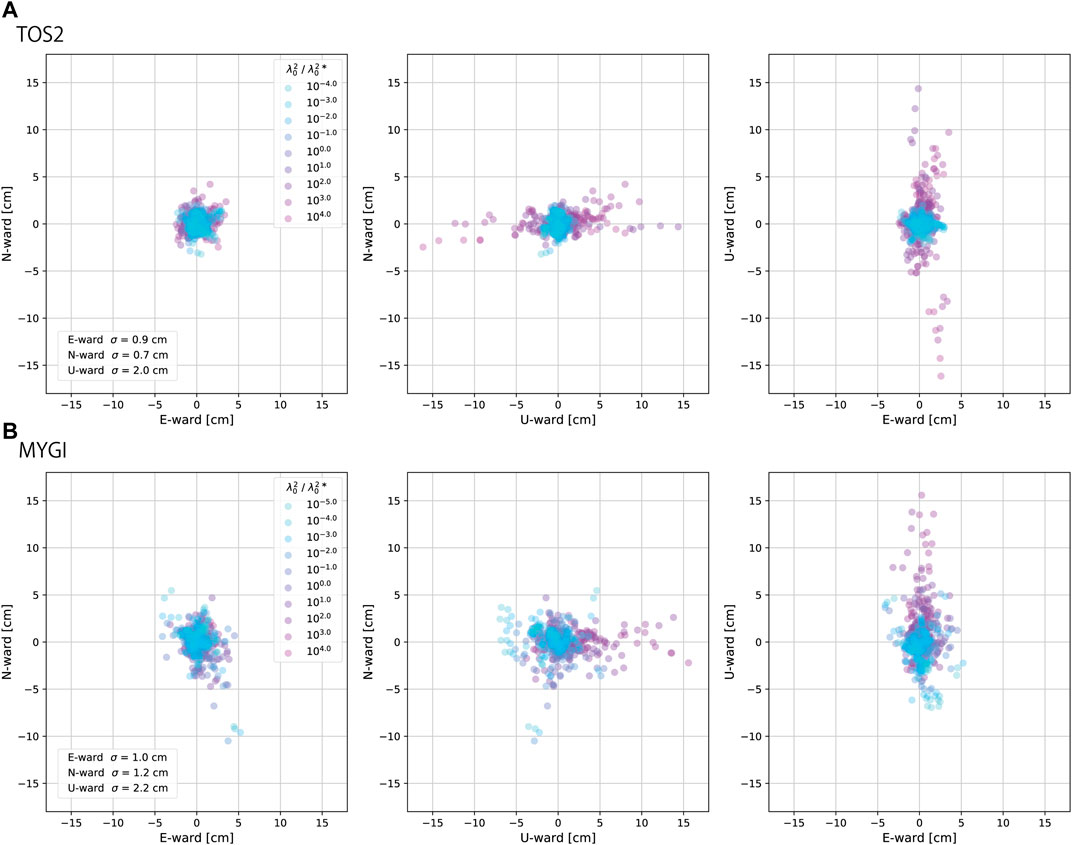
FIGURE 9. Distributions of differences of positions of the tested models from the preferred ones at (A) TOS2 and (B) MYGI for northward-eastward (left), northward-upward (center), and upward-eastward (right) components. The colors of circles indicate the value of
As another application of GNSS-A to oceanography, temporal changes of the oceanographic structure within the observation epoch can be extracted using the proposed method. For example, the estimated sound speed gradient
Conclusion
We reconstructed the GNSS-A observation equation and developed the Python-based software GARPOS to solve the seafloor position as well as the sound speed perturbations using the empirical Bayes approach. It provides a stable solution for a generally ill-posed problem caused by the correlation among the model parameters, by introducing the hyperparameter tuning based on the ABIC minimization and data covariance to rationalize the normalization constant of the posterior pdf.
The most important point is that the proposed method succeeded in directly extracting the time-dependent sound speed field with two end members of spatial gradient terms, which are roughly characterized by depths, even when the observers used only one sea-surface unit. Statistical approach allowed us to suppress the overfitting and thus to obtain simpler sound speed field from densely collected dataset. It successfully reproduced the stationary southward sound speed gradient at TOS2, which is consistent with the Kuroshio current.
On the other hand, model overfits were shown in several epochs. These overfits can be caused not only by the actually complicated sound speed field but also by other error sources which were not well included in the model. It means that the hyperparameter tuning also plays a role in the verification of dataset and model. Error analyses in such cases might rather help improving the GNSS-A accuracy and methodology.
We suggested a simplified formatting for the GARPOS input files. Researchers can enter into the field of seafloor geodesy by collecting the listed data with adequate precision. Since each subcomponent of GNSS-A technique, i.e., GNSS positioning, acoustic ranging, and so on, has been well established, observers can combine them on their platform. Especially, GNSS-A is expected to be practicalized in the near future with an unmanned surface vehicle (Chadwell, 2016) or a buoy (e.g., Kinugasa et al., 2020; Tadokoro et al., 2020). Even in the case of the stationary observation due to small cruising speed, GARPOS may provide the solutions by making a slight modification in the prior variance-covariance matrix.
There is a room for improvement in setting the prior information for transponders’ positions,
Data Availability Statement
The datasets presented in this study can be found in online repositories. The names of the repository/repositories and accession number(s) can be found below: GARPOS v0.1.0 (https://zenodo.org/record/3992688); GNSS‐A data obtained at the sites “TOS2” and “MYGI” in 2011-2019 (https://doi.org/10.5281/zenodo.3993912).
Author Contributions
SW designed the study and wrote the manuscript. SW developed “GARPOS” and processed the data. SW, TI, YY, and YN discussed about the methodology and commented to improving the manuscript.
Funding
The submission of the manuscript was funded by the Japan Coast Guard.
Conflict of Interest
The authors declare that the research was conducted in the absence of any commercial or financial relationships that could be construed as a potential conflict of interest.
Acknowledgments
We thank many staff members from the Hydrographic and Oceanographic Department, Japan Coast Guard, including the crew of the survey vessels Takuyo, Shoyo, Meiyo, and Kaiyo for their support in our observations and technological developments. We especially thank the active senior staff members from the Geodesy and Geophysics Office, Hydrographic and Oceanographic Department, Japan Coast Guard, for their devoted maintenance and management of the equipment. We also thank the reviewers for their comments and suggestions for improving the manuscript.
Supplementary Materials
The Supplementary Material for this article can be found online at: https://www.frontiersin.org/articles/10.3389/feart.2020.597532/full#supplementary-material
References
Akaike, H. (1980). “Likelihood and the Bayes procedure”, In Bayesian statistics. Editors J. M. Bernardo, et al. , (Valencia, Spain: University Press), 143–166.
Altamimi, Z., Rebischung, P., Métivier, L., and Collilieux, X. (2016). ITRF2014: a new release of the International Terrestrial Reference Frame modeling nonlinear station motions. J. Geophys. Res. Solid Earth 121, 6109. doi:10.1002/2016JB013098.
Asada, A., and Yabuki, T. (2001). Centimeter-level positioning on the seafloor. Proc. Jpn. Acad. Ser. B Phys. Biol. Sci. 77, 7–12. doi:10.2183/pjab.77.7.
Bürgmann, R., and Chadwell, D. (2014). Seafloor geodesy. Annu. Rev. Earth Planet Sci. 42(1), 509–534. doi:10.1146/annurev-earth-060313-054953.
Chadwell, C. D. (2016). “Campaign-style GPS-Acoustic with wave gliders and permanent seafloor benchmarks”, in Proceedings of the subduction zone observatory workshop. (Boise, ID:Boise Center), Sep. 29 – Oct. 1 2016.
Chadwell, C. D., and Spiess, F. N. (2008). Plate motion at the ridge-transform boundary of the south Cleft segment of the Juan de Fuca Ridge from GPS-Acoustic data. J. Geophys. Res. 113, B04415. doi:10.1029/2007JB004936.
Chadwell, C. D., and Sweeney, A. D. (2010). Acoustic ray-trace equations for seafloor geodesy. Mar. Geodes. 33(2–3), 164–186. doi:10.1080/01490419.2010.492283.
Chen, H.-Y., Ikuta, R., Lin, C.-H., Hsu, Y.-J., Kohmi, T., Wang, C.-C., et al. (2018). Back-arc opening in the western end of the Okinawa Trough revealed from GNSS/Acoustic Measurements. Geophys. Res. Lett. 45, 137–145, doi:10.1002/2017GL075724.
Del Grosso, V. A. (1974). New equation for the speed of sound in natural waters (with comparisons to other equations). J. Acoust. Soc. Am. 56, 1084–1091. doi:10.1121/1.1903388.
Fujimoto, H. (2014). Seafloor geodetic approaches to subduction thrust earthquakes, Monogr. Environ. Earth Planets 2, 23–63. doi:10.5047/meep.2014.00202.0023.
Fujita, M., Ishikawa, T., Mochizuki, M., Sato, M., Toyama, S., Katayama, M., et al. (2006). GPS/acoustic seafloor geodetic observation: method of data analysis and its application. Earth Planets Space 58, 265–275. doi:10.1186/BF03351923.
Fukahata, Y., and Wright, T. J. (2008). A non-linear geodetic data inversion using ABIC for slip distribution on a fault with an unknown dip angle. Geophys. J. Int. 173, 353–364. doi:10.1111/j.1365-246X.2007.03713.x.
Gagnon, K., Chadwell, C. D., and Norabuena, E. (2005). Measuring the onset of locking in the Peru-Chile trench with GPS and acoustic measurements. Nature 434(7030), 205–208. doi:10.1038/nature03412.
Honsho, C., and Kido, M. (2017). Comprehensive analysis of traveltime data collected through GPS-acoustic observation of seafloor crustal movements. J. Geophys. Res. Solid Earth 122, 8583–8599. doi:10.1002/2017JB014733.
Honsho, C., Kido, M., Tomita, F., and Uchida, N. (2019). Offshore postseismic deformation of the 2011 Tohoku earthquake revisited: application of an improved GPS‐acoustic positioning method considering horizontal gradient of sound speed structure. J. Geophys. Res. Solid Earth 124, 5990. doi:10.1029/2018JB017135.
Hovem, J. M. (2013). “Ray trace modeling of underwater sound propagation”, in Modeling and measurement methods for acoustic waves and for acoustic microdevices. M. G. Editor Beghi. (Rijeka, Croatia: IntechOpen). doi:10.5772/55935.
IERS Conventions (2010). Editors. G. Petit and B. Luzum. (IERS technical note; 36) frankfurt am main: Verlag des Bundesamts fr Kartographie und Geodsie, 179, ISBN 3-89888-989-6
Ikuta, R., Tadokoro, K., Ando, M., Okuda, T., Sugimoto, S., Takatani, K., et al. (2008). A new GPS-acoustic method for measuring ocean floor crustal deformation: application to the Nankai Trough. J. Geophys. Res. 113, B02401. doi:10.1029/2006JB004875.
International GNSS Service (a). GNSS final combined orbit solution product, Greenbelt, MD, USA: NASA Crustal Dynamics Data Information System (CDDIS). doi:10.5067/gnss/gnss_igsorb_001.
International GNSS Service (b). GNSS final combined satellite and receiver clock solution (30 second) product, Greenbelt, MD, USA: NASA Crustal Dynamics Data Information System (CDDIS). doi:10.5067/GNSS/gnss_igsclk30_001.
Ishikawa, T., Yokota, Y., Watanabe, S., and Nakamura, Y. (2020). History of on-board equipment improvement for GNSS-A observation with focus on observation frequency, Front. Earth Sci. 8, 150. doi:10.3389/feart.2020.00150.
Jensen, F. B., Kuperman, W. A., Porter, M. B., and Schmidt, H. (2011). Computational ocean acoustics, Vol. 97. New York, NY: Springer New York, ISBN:978-1-4419-8677-1.
Kido, M., Osada, Y., Fujimoto, H., Hino, R., and Ito, Y. (2011). Trench-normal variation in observed seafloor displacements associated with the 2011 Tohoku-Oki earthquake. Geophys. Res. Lett. 38, L24303. doi:10.1029/2011GL050057.
Kido, M., Osada, Y., and Fujimoto, H. (2008). Temporal variation of sound speed in ocean: a comparison between GPS/acoustic and in situ measurements. Earth Planets Space 60(3), 229–234, doi:10.1186/BF03352785.
Kinugasa, N., Tadokoro, K., Kato, T., and Terada, Y. (2020). Estimation of temporal and spatial variation of sound speed in ocean from GNSS-A measurements for observation using moored buoy. Prog. Earth Planet. Sci. 7, 21. doi:10.1186/s40645-020-00331-5.
Matsu'ura, M., Noda, A., and Fukahata, Y. (2007). Geodetic data inversion based on Bayesian formulation with direct and indirect prior information Geophys. J. Int. 171(3), 1342–1351. doi:10.1111/j.1365-246X.2007.03578.x.
Matsumoto, Y., Fujita, M., and Ishikawa, T. (2008). Development of multi-epoch method for determining seafloor station position [in Japanese], Rep. Hydrogr. Oceanogr. Res. 26, 16–22| .
Miyazawa, Y., Zhang, R., Guo, X., Tamura, H., Ambe, D., Lee, J.-S., et al. (2009). Water mass variability in the western North Pacific detected in a 15-year eddy resolving ocean reanalysis. J. Oceanogr. 65, 737–756. doi:10.1007/s10872-009-0063-3.
Nagaya, Y. (1995). Basic study on a sea floor strain measurement using acoustic techniques [in Japanese with English abstracts]. Rep. Hydrogr. Res. 31, 67–76.
Obana, K., Katao, H., and Ando, M. (2000). Seafloor positioning system with GPS-acoustic link for crustal dynamics observation-a preliminary result from experiments in the sea-. Earth Planets Space. 52, 415–423. doi:10.1186/BF03352253.
Osada, Y., Fujimoto, H., Miura, S., Sweeney, A., Kanazawa, T., Nakao, S., et al. (2003). Estimation and correction for the effect of sound velocity variation on GPS/Acoustic seafloor positioning: an experiment off Hawaii Island. Earth Planets Space 55, e17–e20. doi:10.1186/BF03352464.
Sagiya, T., and Thatcher, W. (1999). Coseismic slip resolution along a plate boundary megathrust: the Nankai Trough, southwest Japan. J. Geophys. Res. 104(B1), 1111–1129. doi:10.1029/98JB02644.
Sakic, P., Ballu, V., Crawford, W. C., and Wöppelmann, G. (2018). Acoustic ray tracing comparisons in the context of geodetic precise off-shore positioning experiments. Mar. Geodes. 41(4), 315–330. doi:10.1080/01490419.2018.1438322.
Sato, M., Fujita, M., Matsumoto, Y., Saito, H., Ishikawa, T., and Asakura, T. (2013). Improvement of GPS/acoustic seafloor positioning precision through controlling the ship's track line. J. Geodyn. 87, 825–842. doi:10.1007/s00190-013-0649-9.
Sato, M., Ishikawa, T., Ujihara, N., Yoshida, S., Fujita, M., Mochizuki, M., et al. (2011). Displacement above the hypocenter of the 2011 Tohoku-oki earthquake. Science 332, 1395. doi:10.1126/science.1207401.
Spiess, F. N. (1980). Acoustic techniques for marine geodesy, Mar. Geodes. 4(1), 13–27. doi:10.1080/15210608009379369.
Spiess, F. N., Chadwell, C. D., Hildebrand, J. A., Young, L. E., Purcell, G. H., and Dragert, H. (1998). Precise GPS/Acoustic positioning of seafloor reference points for tectonic studies. Phys. Earth Planet. In. 108(2), 101–112. doi:10.1016/s0031-9201(98)00089-2.
Tadokoro, K., Kinugasa, N., Kato, T., Terada, Y., and Matsuhiro, K. (2020). A marine-buoy-mounted system for continuous and real-time measurment of seafloor crustal deformation. Front. Earth Sci. 8, 123. doi:10.3389/feart.2020.00123.
Takasu, T. (2013). RTKLIB ver. 2.4.2: an open source program package for GNSS positioning, http://www.rtklib.com/
Tarantola, A., and Valette, B. (1982). Generalized nonlinear inverse problems solved using the least squares criterion. Rev. Geophys. 20(2), 219–232. doi:10.1029/RG020i002p00219.
Tomita, F., Kido, M., Honsho, C., and Matsui, R. (2019). Development of a kinematic GNSS-Acoustic positioning method based on a state-space model. Earth Planets Space 71, 102. doi:10.1186/s40623-019-1082-y.
Tomita, F., Kido, M., Ohta, Y., Iinuma, T., and Hino, R. (2017). Along-trench variation in seafloor displacements after the 2011 Tohoku earthquake. Sci. Adv. 3(7), e1700113. doi:10.1126/sciadv.1700113.
Tomita, F., Kido, M., Osada, Y., Hino, R., Ohta, Y., and Iinuma, T. (2015). First measurement of the displacement rate of the Pacific Plate near the Japan Trench after the 2011 Tohoku-Oki earthquake using GPS/acoustic technique. Geophys. Res. Lett. 42, 8391–8397, doi:10.1002/2015GL065746.
Watanabe, S., Sato, M., Fujita, M., Ishikawa, T., Yokota, Y., Ujihara, N., et al. (2014). Evidence of viscoelastic deformation following the 2011 Tohoku-oki earthquake revealed from seafloor geodetic observation. Geophys. Res. Lett. 41, 5789–5796. doi:10.1002/2014GL061134.
Watanabe, S., Ishikawa, T., Yokota, Y., and Nakamura, Y. (2020a). GARPOS v0.1.0: analysis tool for GNSS-Acoustic seafloor positioning. Zenodo. Version 0.1.0. doi:10.5281/zenodo.3992688.
Watanabe, S., Ishikawa, T., Yokota, Y., and Nakamura, Y. (2020b). GNSS-A data obtained at the sites “TOS2” and “MYGI” in 2011-2019. Zenodo. doi:10.5281/zenodo.3993912.
Watanabe, S., and Uchida, T. (2016). Stable structures of temperature and salinity validated by the repeated measurements in the few-miles square regions off Japan coast in the western Pacific [in Japanese with English abstract]. Rep. Hydro. Ocean. Res. 53, 57–81.
Watanabe, S., Yokota, Y., and Ishikawa, T. (2020c). Stability test to validate the GNSS-A seafloor positioning with kinematic precise point positioning [in Japanese with English abstract and captions]. J. Geod. Soc. Japan 66, 1–7. doi:10.11366/sokuchi.66.1.
Yasuda, I. (2003). Hydrographic structure and variability in the kuroshio-oyashio transition area. J. Oceanogr. 59, 389–402. doi:10.1023/A:1025580313836.
Yasuda, K., Tadokoro, K., Taniguchi, S., Kimura, H., and Matsuhiro, K. (2017). Interplate locking condition derived from seafloor geodetic observation in the shallowest subduction segment at the Central Nankai Trough, Japan. Geophys. Res. Lett. 44, 3572–35790. doi:10.1002/2017GL072918.
Yokota, Y., and Ishikawa, T. (2019). Gradient field of undersea sound speed structure extracted from the GNSS-A oceanography: GNSS-A as a sensor for detecting sound speed gradient. SN Appl. Sci. 1, 693. doi:10.1007/s42452-019-0699-6.
Yokota, Y., and Ishikawa, T. (2020). Shallow slow slip events along the Nankai Trough detected by GNSS-A, Sci. Adv. 6(3), eaay5786. doi:10.1126/sciadv.aay5786.
Yokota, Y., Ishikawa, T., and Watanabe, S. (2019). Gradient field of undersea sound speed structure extracted from the GNSS-A oceanography. Mar. Geophys. Res. 40(4), 493–504. doi:10.1007/s11001-018-9362-7.
Yokota, Y., Ishikawa, T., and Watanabe, S. (2018). Seafloor crustal deformation data along the subduction zones around Japan obtained by GNSS-A observations. Sci. Data 5, 180182. doi:10.1038/sdata.2018.182.
Keywords: GNSS-A, seafloor geodesy, sound speed structure, GNSS-A methodology, GNSS-A oceanography
Citation: Watanabe S-i, Ishikawa T, Yokota Y and Nakamura Y (2020) GARPOS: Analysis Software for the GNSS‐A Seafloor Positioning With Simultaneous Estimation of Sound Speed Structure. Front. Earth Sci. 8:597532. doi: 10.3389/feart.2020.597532
Received: 21 August 2020; Accepted: 07 October 2020;
Published: 20 November 2020.
Edited by:
Keiichi Tadokoro, Nagoya University, JapanCopyright © 2020 Watanabe, Ishikawa, Yokota and Nakamura. This is an open-access article distributed under the terms of the Creative Commons Attribution License (CC BY). The use, distribution or reproduction in other forums is permitted, provided the original author(s) and the copyright owner(s) are credited and that the original publication in this journal is cited, in accordance with accepted academic practice. No use, distribution or reproduction is permitted which does not comply with these terms.
*Correspondence: Shun-ichi Watanabe, cy13YXRhbmFiZUBqb2RjLmdvLmpw
 Shun-ichi Watanabe
 Tadashi Ishikawa
 Yusuke Yokota
 Yuto Nakamura