- 1Key Laboratory of Marine Hazards Forecasting, National Marine Environmental Forecasting Center, Ministry of Natural Resources, Beijing, China
- 2College of Global Change and Earth System Science (GCESS), Beijing Normal University, Beijing, China
In this paper, the features and possible causes of extreme precipitation in the winter of 2019/2020 in China are investigated based on the observational station daily dataset provided by the China Meteorological Administration and the ECMWF ERA5 reanalysis dataset. Record-breaking precipitations are found in most areas of China in the winter of 2019/2020, particularly for the north of China. The magnitude of precipitation in south (north) of China in 2019/2020 increase 0.39 mm/day (0.15 mm/day), about 39.0% (105.5%) compared with the climatological mean. Moisture budget analysis shows that contributions of atmospheric circulation anomaly on horizontal moisture advection and total moisture flux convergence are primarily responsible for the positive anomalies of precipitation in China. Further analysis suggests that the weakened East Asian Trough and the anti-cyclone circulation anomaly over the Sea of Japan favor the transportation of low-level warm and humid airflow from the Northwest Pacific and the East China Sea to the north of China. Meanwhile, the westward movement of the Subtropical High and the Southern Branch Trough anomalies transport low-level warm and humid air from the Bay of Bengal and the South China Sea to south of China. The warm moist air flows northeastward from the East China Sea, Bay of Bengal and the South China Sea while the climatological cold wind flows southeastward, which causes the increase of local precipitation in the winter of 2019/2020. In consideration of the fact that stratospheric polar vortex anomaly has a process of downward propagation to the troposphere, it is of great significance to study the changes of the stratosphere and the relationships between stratosphere and troposphere.
Introduction
Precipitation is one of the most direct meteorological elements in the natural system, and also one of the foci in the weather forecast/research. Due to the fact that winter precipitation is generally much less than the summer precipitation in China, it is usually less concerned. In fact, abnormal winter precipitation can seriously affect agriculture and society, for instance, the severe snow and freezing rain occurred in China in January 2008 caused economic losses about 151.6 billion yuan. (Tao and Wei, 2008).
Recently, there are more and more studies on winter precipitation in China (Xu and Chan, 2002; Li et al., 2008; Tao and Wei, 2008; Zhu and Hua, 2010; Wang and Feng, 2011). The distribution characteristic of winter precipitation in China shows more in the Southeast and less in the Northwest (Chen et al., 2013), and there are obvious interannual and interdecadal variations (Xu and Chan, 2002). Meanwhile, China’s winter precipitation has an increasing trend, while the number of precipitation days has a significant decrease trend, but the trend is not significant (Li et al., 2008). Wang and Feng (2011) pointed out that the dominant mode of interannual variation of winter precipitation in China presents the characteristics of consistent change in the south of the Yangtze River, and has a significant 2–4-years periodic variation. The results of Zhu and Hua (2010) show that the spatial distribution of winter precipitation in North China is consistent, while there are also differences from north to south and from around Bohai Bay to other regions, respectively.
Many factors are leading to abnormal winter precipitation in China. Some studies have investigated the relationship between sea surface temperature (SST) anomaly and winter precipitation anomaly in China. It is found that due to the difference of local response to diabatic heating, there is more winter precipitation in southern China in El Niño years, but less in La Niña years and ENSO Modoki years (Tao and Zhang, 1998; He et al., 2006; Feng et al., 2010; Zhou et al., 2010; Zhou and Wu, 2010; Li and Ma, 2012; Yuan and He, 2013; Guo et al., 2018; Wang et al., 2019). Also, it is found that there is a significant positive correlation between the SST in the East Indian Ocean and the winter precipitation in South China during the same period (Peng, 2012). Moreover, a good correlation is found between the winter SST anomalies in the Kuroshio area and the winter precipitation in some parts of China (Li and Sun, 2004; Zhao et al., 2007). Others have focused on the impact of atmospheric circulation anomalies on winter precipitation anomalies in China. As one of the most important circulation systems in the Northern Hemisphere winter, the polar vortex anomaly has a significant impact on the winter weather in China and even in Asia (Jeong and Ho, 2005; Jeong et al., 2006). In strong polar vortex years, the winter temperature in China is generally higher which is accompanied by more precipitation than normal years, and vice versa in the weak polar vortex years (Xiong et al., 2012). This is mainly because the anomalous activity of the polar vortex propagates downward and cooperates with the blocking high, the East Asian trough, the East Asian winter monsoon and other circulation systems in the lower atmosphere, thus having an important influence on the weather and climate changes in the troposphere (Baldwin and Dunkerton, 1999; Kodera et al., 2000; Baldwin and Dunkerton, 2001; Zhou et al., 2002; Rao et al., 2018). The downward propagation of polar vortex anomaly leads to the anomalies of the Arctic Oscillation (AO) and the East Asian winter monsoon (Wang and Chen, 2010; Cao et al., 2019; Liu et al., 2019). When the AO is strong, the East Asian trough and the Siberian high are always weak, which results in the weak East Asian Winter Monsoon and the anticyclone anomaly in Northeast China, which is conducive to the water vapor transport from the Northwest Pacific to China, and then causes more precipitation in the central and eastern regions of China (Shuai et al., 2010). The East Asian Winter Monsoon also plays an important role in the winter precipitation in China. The winter precipitation in China is less in the strong winter monsoon years and more in the weak winter monsoon years, and this response becomes more obvious with the strengthening of the East Asian winter monsoon (Shi, 1996; He et al., 2006; Chen et al., 2009; Zeng et al., 2010). The South Branch trough is another important synoptic system that affects winter precipitation in China. There is a significant positive correlation between the activity frequency index of the South Branch trough and the winter precipitation in the south of China (Suo and Ding, 2009; Wu et al., 2020).
According to the statistical results of the National Climate Center, the winter precipitation of 2019/2020 is the fifth highest in China over the same period, and the precipitation in many places in the North China (such as Beijing) breaks the historical record. It is of typical significance to study the causes of winter precipitation anomalies in China based on this event. Based on the precipitation data of 166 stations of China Meteorological Administration (CMA) and ERA5 reanalysis data, this paper analyzes the characteristics of winter precipitation anomaly in China in the winter of 2019/2020 and analyzes the causes of this winter precipitation anomaly from the perspective of circulation anomaly.
Data and Methods
Data
The following observational and reanalysis datasets were used: 1) The observation daily precipitation from the Daily Climate Data Set of China Ground International Exchange Station (V3.0) provided by the National Meteorological Information Center (NMIC), China Meteorological Administration (CMA). This dataset cover 166 observation stations in China from January 1951 to the near present; 2) the European Center for Medium Range Weather Forecasts (ECMWF) ERA5 reanalysis dataset (Hersbach et al., 2020), which has a horizontal resolution of 0.25 × 0.25. It is available monthly and daily datasets and covers 1979–2020. Meteorological elements used in this paper include air temperature, geopotential height, absolute humidity, horizontal wind speed, surface pressure, etc.; 3) the monthly mean Asia Polar Vortex Intensity Index derived from the 130 monthly monitoring atmospheric circulation characteristics index in the website of the National Climate Center (NCC), CMA (https://cmdp.ncc-cma.net/Monitoring/cn_index_130.php).
East Asian Trough Index and East Asian Winter Monsoon Index
East Asian Trough Index (EATI): The intensity of the East Asian Trough is defined by the 500hPa geopotential height anomalies in the average over 30°N-50°N, 120°E-150°E (Mu and Li, 2000). It is calculated based on the EAR5 reanalysis dataset. A positive (negative) EATI represents a weak (strong) East Asian Trough.
East Asian Winter Monsoon Index (EAWMI): Considering that the East Asian monsoon is mainly caused by the zonal sea-land thermal forcing contrast in East Asia, the intensity of the East Asian winter monsoon is defined as the sum of the standardized sea-level air pressure differences (110° E minus 160° E) at seven parallels between 50°–20° N and then the sum is standardized again (Shi, 1996). The index is calculated based on the EAR5 reanalysis dataset. The equation is written as follows:
Where
The Moisture Flux and Moisture Budget Analysis
The vertically integrated moisture flux is defined as:
Where
Moisture budget analysis (Seager et al., 2010; Chou and Lan, 2012) is used to investigate quantitatively possible mechanisms responsible for the changes of precipitation over China in the winter of 2019/2020. The equation can be expressed as:
where P, E, and q are precipitation, evaporation and specific humidity respectively, V is wind vector.
The first (second) term in the right-hand side of each equation is defined as the thermodynamic (dynamic) component of the horizontal/vertical moisture advection term, while the last term denotes the nonlinear component. The thermodynamic term is associated with the changes in specific humidity mainly directly induced by temperature changes as atmosphere circulations are fixed, while the dynamic term reflects the contribution of atmospheric circulation changes on precipitation. The third term is a nonlinear term including the contributions of both the moisture and circulation changes. The subscript “clm” means climatological mean.
Features of the Precipitation Anomalies in China
Figure 1 shows the distribution of precipitation and precipitation anomalies of 166 observation stations in China during the winter of 2019/2020. According to the observation result, the average precipitation in 166 stations is about 0.75 mm/day. Excessive precipitations are found in the south (east) of China while less precipitation is found in the north (west) of China during the winter of 2019/2020. The magnitude of precipitation in East China, Central China, south of Southwest China, south of North China and south of Northeast China was increased, while the total rainfall in Guangdong and Fujian Province was decreased.
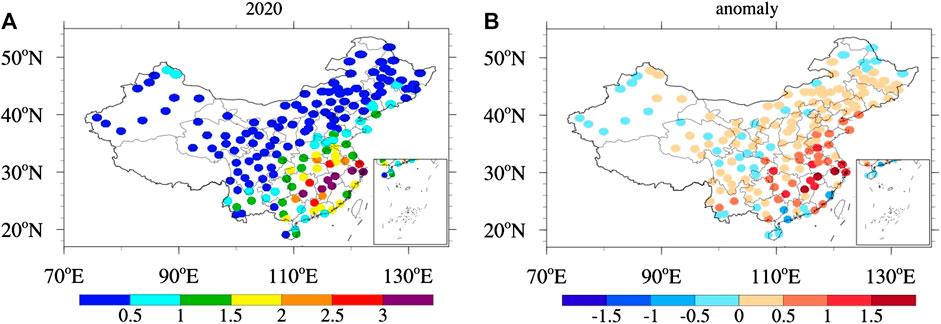
FIGURE 1. (A) The precipitation and (B) precipitation anomalies (2019/2020 minus the climatological mean) of 166 observation stations average in China during the winter (December January and February, DJF) of 2019/2020, unit: mm/day.
Precipitation anomalies in China during the winter of 1951–2020 are shown in Figure 2. Precipitation anomalies of 166 stations average in China during the winter of 2019/2020 (Figure 2A) is 0.25 mm/day, which increases about 48.2% compared with the climatological mean. The precipitation in the south of China (Figure 2C) during the winter of 2019/2020 increase 0.39 mm/day (about 39.0%) than that of the climatological mean. Meanwhile, the precipitation in the north of China (Figure 2B) increase 0.15 mm/day (about 105.5%) compared with the climatological mean. Remarkably, the precipitation increases 0.26 mm/day in North China (Figure 2D), which is the largest change area (about 157.6%) in China.
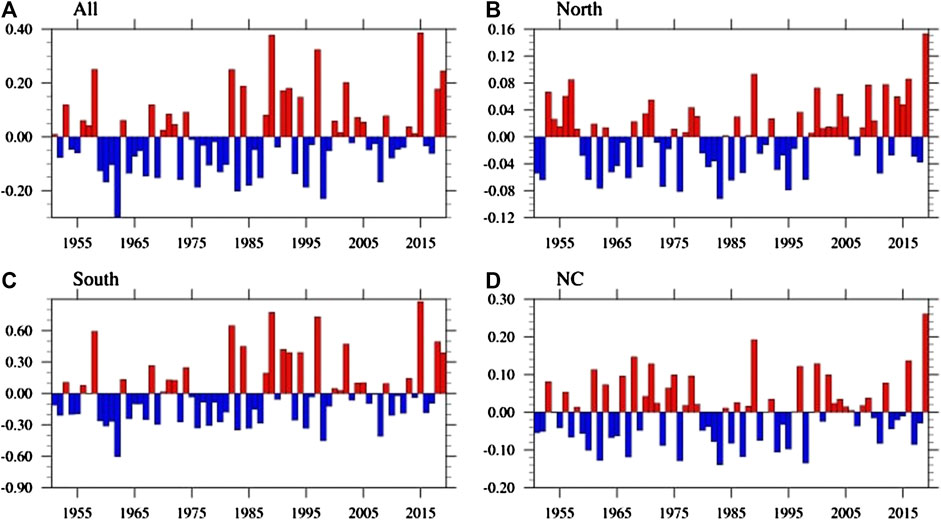
FIGURE 2. Time series of precipitation anomalies in 166 observation stations during the winter of 1951–2020 (Unit: mm/day). The areas contain: (A) all of China (All: 18°–54° N; 72°–135° E), (B) north areas in China (North: 34°–54° N; 72°–135° E), (C) south areas in China (South: 18°–34° N; 72°–135° E) and (D) the North China (NC: 34°–43° N; 110°–119° E).
The Possible Causes of Precipitation Anomalies
Water vapor transport plays a crucial role in determining the major rain band. Figure 3A shows the vertically integrated DJF mean moisture fluxes and the corresponding average divergences of ERA5 reanalysis datasets from 1979 to 2020. There are two main channels remotely supplying water vapor to China. One is the moisture transport associated with the Subtropical Westerly Jet, which brings a large amount of water vapor from the Northern Indian Ocean across the Indochina Peninsula into the south of China; the other water vapor source is derived from eastern wind flow over the western North Pacific (WNP). The moisture fluxes converge in the south of China, which afford favorable conditions for local rainfall. The spatial distributions of the vertically integrated moisture flux in the winter of 2019/2020 (Figure 3B) is similar to that of the climatological mean (Figure 3A), but the convergence of moisture flux over the south of China shows a large amplitude. On the one hand, the Subtropical Westerly Jet in 2019/2020 is stronger than that in climatological mean, transports more warm water vapor from the north of Arabian Sea and Bay of Bengal to south of China; on the other hand, the southwest wind anomaly over the low-latitude regions bring more warm and moist air from the South China Sea to China (Figure 3C). Both of the moisture flux anomalies mentioned above play a crucial role in the precipitation anomalies over China in the winter of 2019/2020.
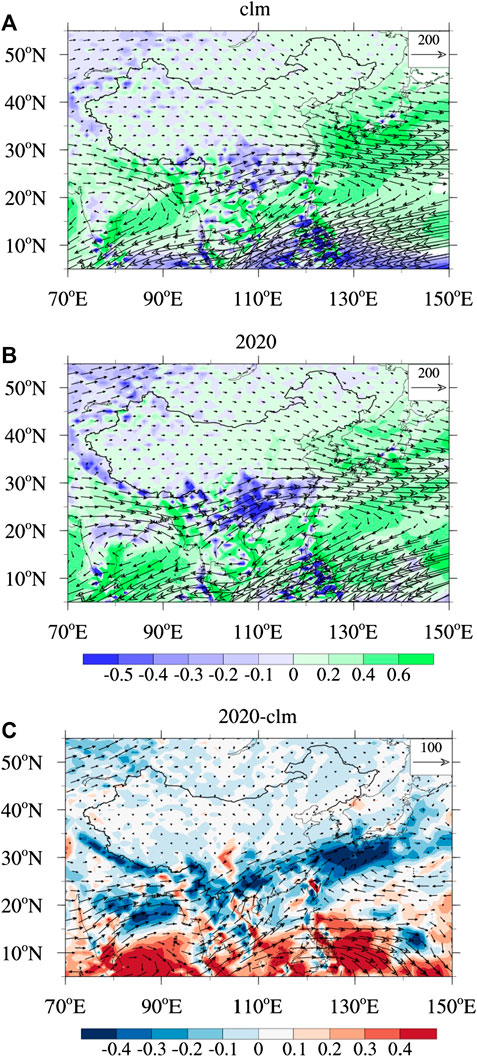
FIGURE 3. The spatial distributions of the vertically integrated DJF mean moisture flux (vector, units:
According to the moisture budget analysis (Figure 4), evaporation anomaly (0.056 mm/day), horizontal moisture advection (0.082 mm/day) and total moisture flux convergence anomaly (0.095 mm/day) are responsible for the precipitation anomaly to a certain extent. Moreover, the dynamic components contributed to horizontal moisture advection (0.167 mm/day, Figure 4B) and total moisture flux convergence (0.135 mm/day, Figure 4C) are primarily responsible for the increases in total rainfall, while the thermodynamic component have a negative effect on the precipitation (−0.083 mm/day, Figure 4B; −0.052 mm/day, Figure 4C). The above analysis shows that the contribution of atmospheric circulation anomaly (the dynamic component) on horizontal moisture advection and total moisture flux convergence is primarily responsible for the positive anomalies of precipitation in China during the winter of 2019/2020. In addition, how did the circulation anomaly affect precipitation in China during the winter of 2019/2020?

FIGURE 4. Moisture processes responsible for the DJF mean precipitation over the main rainfall area (20°–50° N; 100°–135° E) in China. (A) Evaporation anomalies, horizontal moisture advection and total moisture flux convergence contributed to the precipitation anomalies. (B) The contributions of moisture, circulation changes and nonlinear term to the moisture advection. (C) The contributions of moisture, circulation changes and nonlinear term to the moisture flux convergence. Unit: mm/day.
The East Asian Trough and Southern Branch Trough play a crucial role in the weather change of China in winter. The changes in their shape and intensity can be judged by the 500 hPa geopotential height and the corresponding circulation anomalies. Huang et al. (2013) found that the strong East Asian Trough tends to induce higher surface air temperature and less precipitation in central China. Figure 5 shows the spatial distributions of climatological DJF mean 500 hPa geopotential height, horizontal wind and 850 hPa air temperature. Strengthening of the East Asian Winter Monsoon and the East Asian Trough are favorable to transport the cold and dry air from north of the Eurasian continent to China, while the changing of the Southern Branch Trough is favorable to transport the warm and moist air from the Bay of Bengal and the South China Sea to China. The cold northwesterly wind and the warm southwesterly wind meet in China, which causes the local widespread weather changes.
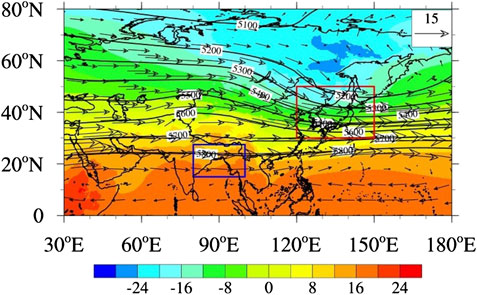
FIGURE 5. Spatial distributions of climatological DJF mean 500 hPa geopotential height (contour, unit: m), horizontal wind (vectors; m/s) and 850 hPa air temperature (shaded; unit: °C). Blue rectangular means Southern Branch Trough area, red rectangular means the East Asian Trough area.
The spatial distributions of 2019/2020 DJF 500 hPa geopotential height, horizontal wind and 850 hPa air temperature anomalies are shown in Figure 6. Except for the Tibetan Plateau, warm air temperature anomalies (higher than 2.5°C) are found in lower troposphere over most areas in China, especially in North China and Northeast China. The negative (positive) anomaly of 500 hPa geopotential height in the Ural Mountains area (the Baikal-Balkhash Lake area) proves that the Siberian High and the East Asian Winter Monsoon is weakened in 2019/2020 winter. On the one hand, the intensity of East Asian Trough is weakened and the surface wind over the Sea of Japan is characterized by anomalous anti-cyclone circulation, which favors the transportation of low-level warm and humid air-flow from the Northwest Pacific and the East China Sea to the north of China. On the other hand, the south-west wind anomaly in front of the trough caused by the westward movement of the Subtropical High and the Southern Branch Trough anomalies transports the warm and humid air from the Bay of Bengal and the South China Sea to the south of China. The warm moist air flows northward. Meanwhile, the water storage capacity of atmosphere is enhanced as the lower atmosphere gets warmer. The warm moist air flows northward from the East China Sea, the Bay of Bengal and the South China Sea, which contributes to the increased of local precipitation in the winter of 2019/2020.
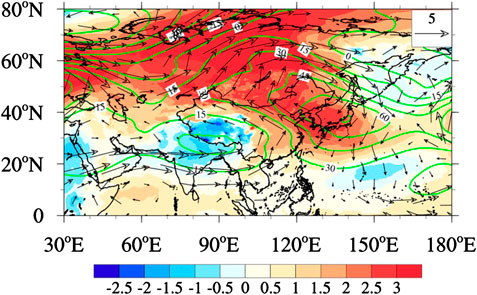
FIGURE 6. As in Figure 5 but for the 2019/2020 DJF anomalies.
Figure 7 shows the spatial distributions of climatological mean 10 hPa geopotential height and the anomalies of 10 hPa geopotential height in 2019/2020 in winter. There is a closed elliptical low-pressure vortex in the Arctic in winter. The long axis of the vortex extends from northern Eurasia to the north of North America, with its center near the North Pole and located between the Taymyr peninsula of Siberia and northern Greenland. In the winter of 2019/2020, the intensity of polar vortex is stronger than usual. The central value of the polar vortex is more than 600 geopotential meters lower than that in previous years, and the long axis of the polar vortex deflects toward the East Asian continent. The polar vortex anomalies can propagate downward from the stratosphere. The time-altitude cross-sections of the zonal mean zonal wind anomalies and the zonal mean geopotential height anomalies over the Northern Hemisphere are shown in Figure 8. A positive zonal mean zonal wind anomaly propagates downward from the stratosphere from mid-December 2019 to mid-January 2020. Meanwhile, a negative zonal mean geopotential height anomaly propagates downward from late-December 2019 to mid-January 2020. The results show that the stratospheric polar vortex anomalies in high latitudes of the Northern Hemisphere have a process of downward propagation to the troposphere starting from mid-December 2019. Previous studies show that the downward propagations of positive anomalies of the polar vortex will cause the low-level AO positive anomaly. It will weaken the Siberian High, the East Asian Winter Monsoon (Wu and Wang, 2002) and the East Asian trough (Chen and Kang, 2006), which create favorable conditions for more precipitation in China. Meanwhile, Rao et al. (2020) reported that the 2017/2018 weak stratospheric polar vortex is accompanied with less rainfall in South China. In order to study the correlationships between stratosphere polar vortex and the climate system of troposphere, the scatterplots of the Asia Polar Vortex Intensity Index and East Asian Winter Monsoon Index, East Asian Trough Index from 1979 to 2020 in winter are shown in Figure 9. There is a negative correlation between the Asia Polar Vortex Intensity Index and the East Asian Winter Monsoon Index, while a positive correlation between the Asia Polar Vortex Intensity Index and the East Asian Trough Index. The correlation coefficients are −0.47 and 0.31, respectively, which passed the 99% statistical significance test. Meanwhile, the East Asian Winter Monsoon Index and the East Asian Trough Index is −0.43 and 1.38, respectively, in the winter of 2019/2020, which means that the intensity of the East Asian winter monsoon and the East Asian trough is weaker than that in the climatological mean. The statistical result indicates that there is a close relationship between the stratosphere polar vortex and the East Asian Trough and the East Asian Winter Monsoon.
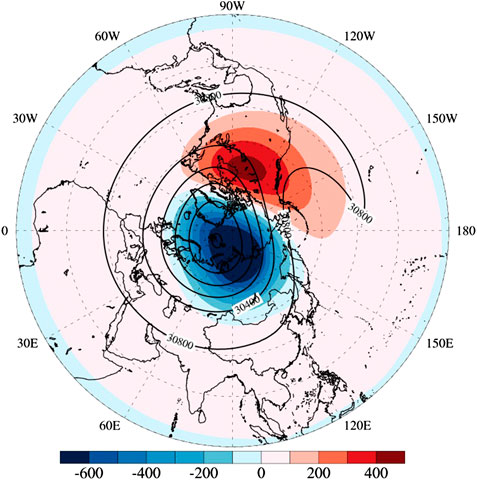
FIGURE 7. Spatial distributions of climatological DJF mean 10 hPa geopotential height (contour, unit: m) and 2019/2020 DJF mean 10 hPa geopotential height anomalies (shaded, unit: m).
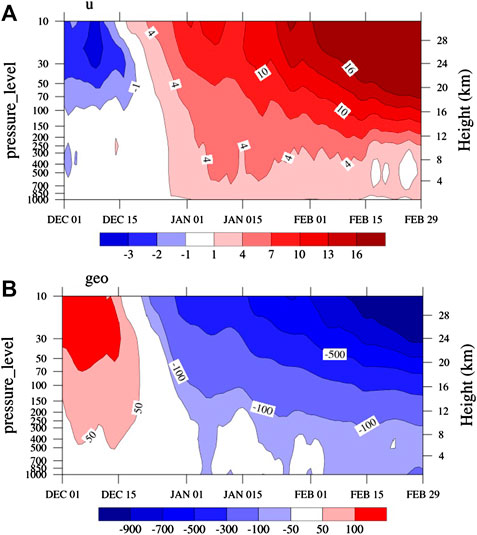
FIGURE 8. Time-altitude cross-sections of (A) the zonal mean zonal wind anomalies along 60° N (units: m/s) and (B) the zonal mean geopotential height anomalies along 70°–90° N (units: m) over the Northern Hemisphere from Dec 2019 to Feb 2020.
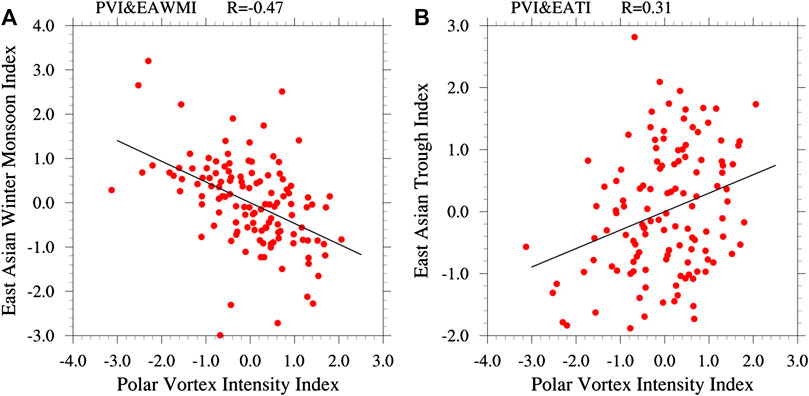
FIGURE 9. Scatterplots and correlation coefficients between the monthly Asia Polar Vortex Intensity Index and (A) East Asian Winter Monsoon Index; (B) East Asian Trough Index from 1979 to 2020 in winter.
Summary and Discussion
In this study, we investigated the features of precipitation anomalies in the winter of 2019/2020 in China by using the daily rainfall dataset of 166 stations provided by the National Meteorological Information Center in China. The possible causes of these precipitation anomalies were also discussed based on the ERA5 reanalysis dataset. The major conclusions are summarized as follows:
(1) Precipitation in East China, Central China, south of Southwest China, south of North China and south of Northeast China was increased, while the total rainfall in South China and Fujian Province decreased during the winter of 2019/2020. The magnitude of precipitation in the south of China increase by 0.39 mm/day (about 39.0%) compared with the climatological mean. Meanwhile, the precipitation in the north of China increase by 0.15 mm/day (about 105.5%) compared with the climatological mean. The largest anomalies appear in North China with a 157.6% increase in total rainfall.
(2) Moisture budget analysis shows that contributions of atmospheric circulation anomalies (the dynamic component) on horizontal moisture advection and total moisture flux convergence are primarily responsible for the positive anomalies of precipitation in China during the winter of 2019/2020.
(3) There is a negative correlation between the Asia Polar Vortex intensity and the East Asian Winter Monsoon and the East Asian Trough intensity. The positive anomalies of the stratosphere polar vortex in high latitudes of the Northern Hemisphere have a process of downward propagation to the troposphere in the winter of 2019/2020, which weakens the East Asian Winter Monsoon and the East Asian Trough.
(4) The weakened East Asian Trough and the anti-cyclone circulation anomaly over the Sea of Japan favor the transportation of low-level warm and humid air-flow from the Northwest Pacific and the East China Sea to the north of China. The westward movement of the Subtropical High and the Southern Branch Trough anomalies cause the southwesterly wind anomalies before the trough, which transport the low-level warm and humid air from the Bay of Bengal and the South China Sea to the south of China. The warm moist air flows northward. Meanwhile, the water storage capacity of the atmosphere is enhanced with as the lower atmosphere gets warmer. The warm moist air flows northeastward from the East China Sea, Bay of Bengal and the South China Sea while the climatological cold wind flows southeastward, which causes the increase of local precipitation in the winter of 2019/2020.
In consideration of the fact that stratospheric polar vortex anomaly has a process of downward propagation to the troposphere and thus affects the tropospheric weather system, it is of great significance to study the changes of the stratosphere and the relationships between stratosphere and troposphere. In addition, it’s a case study regarding the precipitation anomalies in China during the winter of 2019/2020, the generalization of our conclusions needs further research.
Data Availability Statement
The original contributions presented in the study are included in the article/supplementary materials, further inquiries can be directed to the corresponding author/s.
Author Contributions
LX and WQ is responsible for the major research and writing work; LJ and SC take part in paper discussion and give some usefull suggestions; ZF and WJ make contributions to the data collection and data processing.
Conflict of Interest
The authors declare that the research was conducted in the absence of any commercial or financial relationships that could be construed as a potential conflict of interest.
Funding
This work was jointly supported by the National Key R&D Program of China (2019YFC1408004 and 2016YFC1401408), the National Program on Global Change and Air-Sea interaction (GASI-IPOVAR-06), National Natural Science Foundation of China (41806003).
Acknowledgments
The authors wish to thank for anonymous reviewers for their constructive comments that significantly improved the quality of this paper.
References
Baldwin, M. P., and Dunkerton, T. J. (1999). Propagation of the arctic oscillation from the stratosphere to the troposphere. J. Geophys. Res. 104(D24), 30937–30946. doi:10.1029/1999jd900445 CrossRef Full Text
Baldwin, M. P., and Dunkerton, T. J. (2001). Stratospheric harbingers of anomalous weather regimes. Science 294(5542), 581–584. doi:10.1126/science.1063315 \CrossRef Full Text | Pubmed
Cao, C., Chen, Y.-H., Rao, J., Liu, S.-M., Li, S.-Y., Ma, M.-H., et al. (2019). Statistical characteristics of major sudden stratospheric warming events in CESM1-WACCM: a comparison with the JRA55 and NCEP/NCAR reanalyses. Atmosphere 10, 519. doi:10.3390/atmos10090519 CrossRef Full Text
Chen, W., and Kang, L. (2006). Linkage between the arctic oscillation and winter climate over East Asia on the interannual timescale: roles of quasi-stationary planetary waves. Chin. J. Atmos. Sci. 30(5), 863–870. doi:10.3878/j.issn.1006-9895.2006.05.15
Chen, W., Wang, L., Xue, Y., and Sun, S. (2009). Variabilities of the spring river runoff system in East China and their relations to precipitation and sea surface temperature. Int. J. Climatol. 29(10), 1381–1394. doi:10.1002/joc.1785 CrossRef Full Text
Chen, Y., Cao, J., and Wang, C. (2013). Precipitation variation over southeastern China in winter and its circulation pattern (in Chinese). Trans. Atmos. Sci. 36(3), 323–330. doi:10.3969/j.issn.1674-7097.2013.03.008
Chou, C., and Lan, C. (2012). Changes in the annual range of precipitation under global warming. J. Climate. 25, 222–235. doi:10.1175/JCLI-D-11-00097.1 CrossRef Full Text
Feng, J., Wang, L., Chen, W., Fong, S. K., and Cheng, L. K. (2010). Different impacts of two types of Pacific Ocean warming on Southeast Asian rainfall during boreal winter. J. Geophys. Res. Atmos. 115(24), D24122. doi:10.1029/2010jd014761 CrossRef Full Text
Guo, L., Zhu, C.-W., Liu, B.-Q., and Ma, S.-M. (2018). Subseasonal variation of winter rainfall anomalies over South China during the mature phase of super El Niño events. Atmos. Oceanic Sci. Lett. 11(5), 396–403. doi:10.1080/16742834.2018.1505404 CrossRef Full Text
He, X., Ding, Y., He, J., and Li, Q. (2006). An analysis on anomalous precipitation in southern China during winter monsoons (in Chinese). Acta Meteorol. Sin. 64(5), 594–604 doi:10.11676/qxxb2006.058.
Hersbach, H., Bell, B., Berrisford, P., Hirahara, S., Horányi, A., Muñoz-Sabate, J., et al. (2020). The ERA5 global reanalysis. Q. J. R. Meteorol. Soc. 146(730), 1999–2049. doi:10.1002/qj.3803
Huang, X., Guan, Z., Dai, Z., and Mei, H. (2013). A further look at the interannual variations of East Asian trough intensity and their impacts on winter climate of China (in Chinese). Acta Meteorol. Sin. 71(3), 416–428. doi:10.11676/qxxb2013.042
Jeong, J.-H., and Ho, C.-H. (2005). Changes in occurrence of cold surges over east Asia in association with Arctic Oscillation. Geophys. Res. Lett. 32(14), L14704. doi:10.1029/2005gl023024 CrossRef Full Text
Jeong, J.-H., Kim, B.-M., Ho, C.-H., Chen, D., and Lim, G.-H. (2006). Stratospheric origin of cold surge occurrence in East Asia. Geophys. Res. Lett. 33(14), L14710. doi:10.1029/2006gl026607 CrossRef Full Text
Kodera, K., Kuroda, Y., and Pawson, S. (2000). Stratospheric sudden warmings and slowly propagating zonal-mean zonal wind anomalies. J. Geophys. Res. 105(D10), 12351–12359. doi:10.1029/2000jd900095 CrossRef Full Text
Li, C., and Ma, H. (2012). Relationship between ENSO and winter rainfall over Southeast China and its decadal variability. Adv. Atmos. Sci. 29(6), 1129–1141. doi:10.1007/s00376-012-1248-z CrossRef Full Text
Li, S., Chen, L., and Ren, Y. (2008). Changes of winter precipitation during 1951/1952∼2004/2005 in China (in Chinese). J. Trop. Meteorol. 24(1), 94–98. doi:10.3724/SP.J.1047.2008.00014
Li, Z., and Sun, Z. (2004). Relationship between autumn Kuroshio SST and east asian winter monsoon (in Chinese). J. Nanjing Inst. Meteorol. 27(2), 145–152. doi:10.3969/j.issn.1674-7097.2004.02.001
Liu, S.-M., Chen, Y.-H., Rao, J., Cao, C., Li, S.-Y., Ma, M.-H., et al. (2019). Parallel comparison of major sudden stratospheric warming events in CESM1-WACCM and CESM2-WACCM. Atmosphere 10(11), 679. doi:10.3390/atmos10110679 CrossRef Full Text
Mu, M., and Li, C. (2000). Interdecadal variations of atmospheric CirculationI. Observational analyses (in Chinese). Climat. Environm. Res. 5 (3), 233–241. doi:10.3969/j.issn.1006-9585.2000.03.001
Peng, J. (2012). Influence of the Sea surface temperature in the eastern Indian ocean on the wintertime rainfall in the southern part of China (in Chinese). Climat. Environm. Res. 17(3), 327–338. doi:10.1007/s11783-011-0280-z
Rao, J., Garfinkel, C. I., and White, I. P. (2020). Predicting the downward and surface influence of the February 2018 and January 2019 sudden stratospheric warming events in subseasonal to seasonal (S2S) models[J]. J. Geophys. Res. Atmos. 125(2). doi:10.1029/2019jd031919 CrossRef Full Text
Rao, J., Ren, J., Chen, H., Yu, Y., and Zhou, Y. (2018). The stratospheric sudden warming event in February 2018 and its prediction by a climate system model. JGR Atmos. 123, 13332–13345. doi:10.1029/2018JD028908
Seager, R., Naik, N., and Vecchi, G. A. (2010). Thermodynamic and dynamic mechanisms for large-scale changes in the hydrological cycle in response to global warming. J. Climate. 23, 4651–4668. doi:10.1175/2010JCLI3655.1
Shi, N. (1996). Features of the East Asian winter monsoon intensity on multiple time sacle in recent 40 years and their relation to climate (in Chinese). Q. J. Appl. Meteorol. 7(2), 175–182.
Shuai, J.-b., Guo, P., and Pang, Z. (2010). Interdecadal variation of the relationship between AO and winter precipitation in China (in Chinese). Plateau Meteorol. 29(5), 1126–1136.
Suo, M., and Ding, Y. (2009). The structures and evolutions of the wintertime southern Branch trough in the subtropical westerlies (in Chinese). Chin. J. Atmos. Sci. 33(3), 425–442. doi:10.2174/1874210600903010085
Tao, S., and Wei, J. (2008). Severe snow and freezing-rain in January 2008 in the southern China (in Chinese). Climat. Environm. Res. 13(4), 337–350. doi:10.3724/SP.J.1047.2008.00014
Tao, S., and Zhang, Q. (1998). Response of the asian winter and summer monsoon to ENSO events (in Chinese). Sci. Atmos. Sin. 22(4), 3–5. doi:CNKI:SUN:DQXK.0.1998-04-001
Wang, L., and Chen, W. (2010). Downward Arctic Oscillation signal associated with moderate weak stratospheric polar vortex and the cold December 2009. Geophys. Res. Lett. 37(9), L09707. doi:10.1029/2010gl042659 CrossRef Full Text
Wang, L., and Feng, J. (2011). Two major modes of the wintertime precipitation over China (in Chinese). Chin. J. Atmos. Sci. 35(6), 1105–1116. doi:10.3878/j.issn.1006-9895.2011.06.10
Wang, Q., Cai, W., Zhong, W., Zeng, L., Wu, L., and Wang, D. (2019). Response of southern China winter rainfall to El Niño diversity and its relevance to projected southern China rainfall change. J. Clim. 32(11), 3343–3356. doi:10.1175/jcli-d-18-0571.1 CrossRef Full Text
Wu, B., and Wang, J. (2002). Possible impacts of winter arctic oscillation on siberian high, the East asian winter monsoon and sea-ice extent. Adv. Atmos. Sci. 19(2), 297–320. doi:10.1007/s00376-002-0024-x
Wu, S., Zhang, C., Wang, W., Wang, M.-m., and Chen, X. (2020). Interannual relationship between the Southern Branch Trough activity in winter and the precipitation in southern China (in Chinese). Mid-low Lat. Mountain Meteorol. 44(2), 53–58.
Xiong, G., Chen, Q., Zhu, K., and Fan, G. (2012). Relationship between stratospheric polar vortex change and temperature, precipitation in winter of China (in Chinese). Plateau Meteorol. 31(4), 1001–1006.
Xu, J., and Chan, J. C. L. (2002). Interannual and interdecadal variability of winter precipitation over China in relation to global sea level pressure anomalies. Adv. Atmos. Sci. 19(5), 914–926. doi:10.1007/s00376-002-0055-3 CrossRef Full Text
Yuan, L., and He, J. (2013). Different impacts of two types of ENSO on winter rainfall over south China (in Chinese). J. Arid Meteorol. 31(1), 24–31. doi:10.11755/j.issn.1006-7639(2013)-01-0024
Zeng, J., Zhang, Q., and Wang, T. (2010). Analysis on relationship of East-asian winter monsoon intensity and winter precipitation in southern China (in Chinese). Plateau Meteorol. 29(4), 975–981.
Zhao, F., Zhu, X., Li, F., Wang, Z., Gu, J., and Wang, M. (2007). Relationship between SSTA in Japan current region and temperature and precipitation in China winter (in Chinese). Meteorol. Environm. Sci. 30(z1), 28–31. doi:10.3969/j.issn.1673-7148.2007.z1.008
Zhou, L.-T., Tam, C.-Y., Zhou, W., and Chan, J. C. L. (2010). Influence of South China sea SST and the ENSO on winter rainfall over south China. Adv. Atmos. Sci. 27(4), 832–844. doi:10.1007/s00376-009-9102-7 CrossRef Full Text
Zhou, L.-T., and Wu, R. (2010). Respective impacts of the East Asian winter monsoon and ENSO on winter rainfall in China. J. Geophys. Res. Atmos. 115(2), D02107. doi:10.1029/2009jd012502 CrossRef Full Text
Zhou, S., Miller, A. J., Wang, J., and Angell, J. K. (2002). Downward-Propagating temperature anomalies in the preconditioned polar stratosphere. J. Clim. 15(7), 781–792. doi:10.1175/1520-0442(2002)015<0781:dptait>2.0.co;2 CrossRef Full Text
Keywords: precipitation anomaly, polar vortex, east asian winter monsoon, east asian trough, arctic oscillation
Citation: Xiang L, Chenqi W, Ling T, Sun C, Zhang Y and Wang J (2020) Features and Possible Causes of the Extreme Precipitation Anomaly in China During Winter 2019/2020. Front. Earth Sci. 8:596753. doi:10.3389/feart.2020.596753
Received: 20 August 2020; Accepted: 12 October 2020;
Published: 10 November 2020.
Edited by:
Zhiwei Zhu, Nanjing University of Information Science and Technology, ChinaReviewed by:
Jian Rao, Nanjing University of Information Science and Technology, ChinaQing Yang, Institute of Atmospheric Physics (CAS), China
Copyright © 2020 Li, Wang, Ling, Sun, Zhang and Wang. This is an open-access article distributed under the terms of the Creative Commons Attribution License (CC BY). The use, distribution or reproduction in other forums is permitted, provided the original author(s) and the copyright owner(s) are credited and that the original publication in this journal is cited, in accordance with accepted academic practice. No use, distribution or reproduction is permitted which does not comply with these terms.
*Correspondence: Wang Chenqi, d2FuZ2NxQGxhc2cuaWFwLmFjLmNu
 Li Xiang
 Wang Chenqi
 Tiejun Ling1
 Cheng Sun
 Yunfei Zhang