 Piyaphong Chenrai
94% of researchers rate our articles as excellent or good
Learn more about the work of our research integrity team to safeguard the quality of each article we publish.
Find out more
PERSPECTIVE article
Front. Earth Sci., 15 January 2021
Sec. Structural Geology and Tectonics
Volume 8 - 2020 | https://doi.org/10.3389/feart.2020.590062
This article is part of the Research Topic3D Printing in Geology and Geophysics: A New World of Opportunities in Research, Outreach, and EducationView all 7 articles
Applying three-dimensional (3D) printing technology to a geoscience classroom provides an alternative way to teach students. This brief report describes an educational innovation for the geoscience classroom by 3D printing technology to develop structural interpretation skill in high education level in Thailand. In comparison to traditional classrooms, this teaching method enables students to more easily comprehend how geological structures and features occur in nature through a project-based learning in seismic interpretation course. 3D printing models are constructed based on student interpretation through three different software packages. The observations in this study indicate that the ability to create the 3D models based on digital seismic data can enhance structural interpretation skill of students. The benefit of freely orientating and viewing in different angles of the 3D models leads to a construction of cognitive abstract space and spatial visualization ability. Therefore, 3D printing technology plays an important role in changing and developing the geoscience education system in Thailand at present and in the future. This teaching method could potentially benefit any science classroom and have applications in other disciplines requiring similar skill.
In traditional geoscience education, learning activities include lectures by teacher, assigned textbook reading, laboratory exercises, or classroom discussion. Geoscience teaching methods commonly use maps, diagrams, and photographs as the primary learning media to illustrate geological structures. However, flat or two-dimensional (2D) media can potentially limit classroom learning, especially in the case of geoscience education; this is because studying geological phenomena and structures mostly require spatial and object visualization abilities. In addition, images illustrated in textbooks and lecture slides are sometime unrepresented in the real geometries of geological structures (Alcalde et al., 2017). Thus, traditional teaching media cannot always successfully demonstrate the scope and idea of geological structures and features in a three-dimension (3D) view. Nowadays, computer technology offers a more effective teaching and learning experience than that of the traditional classroom. 3D printing technology may facilitate the transformation of geological structures and features into 3D models, which can be used to demonstrate in the geoscience classroom that is easily comparable to textbooks and conceptual structural models. The 3D model helps students to interact with geological structures by allowing them to touch and view from any angle under real-word conditions and helps students acquire spatial visualization of these geological structures (Carneiro et al., 2018). Berra et al. (2014) documented that skill in geological mapping of students is increased after using 3D software packages to model geological bodies. Moreover, 3D geological models have been successfully used in geoscience education in several cases and are suggested to enhance the teaching experience in the future (Caumon et al., 2009; Ward, 2011).
Geoscience is an interpretation-based field of science and requires students to read geological maps, classify Earth materials and interpret structural geology and tectonic setting (Frodeman, 1995). Structural interpretation is a fundamental skill at all academic levels (from students to experts) in this field of science. The teaching and learning of structural interpretation improve not only just the student ability to visualize structures in space but also the spatial distribution of rock layers based on geological data (Carneiro et al., 2018). There are several data types that are used for this purpose, such as core, well, outcrop, and seismic data. However, the data used to interpret geological structures are, often, incomplete in terms of their spatial continuity. Students, therefore, must use their knowledge and spatial visualization skill in the interpretation of data to propose a structural concept model. Seismic interpretation is a fundamental method for understanding geological structures and features by determining the geometry and displacement of seismic reflections in the subsurface (e.g., Rotevatn and Jackson, 2014; Harding and Huuse, 2015; Alcalde et al., 2017; Chenrai and Huuse, 2020). The advantage of seismic data is allowing students to view 3D geometry of geological structures, especially in the case of digital seismic data. Recently, free software that can be easily downloaded for teaching in geoscience has been developed. Using these software packages, seismic data can be interpreted using a personal computer; in other words, geological structures can be viewed and explored simply with the use of a computer monitor. A traditional teaching and learning method in seismic interpretation class involves the use of 2D and 3D diagrams extracted from textbooks for a comparison of the interpreted results. However, when using such software, understanding and interpreting the relationships between subsurface structure, topography, and geological process may be challenging for some students. One reason could be that the geological images displayed on the computer monitor are the 2D and 3D transformations of the structures. These images are often incapable of demonstrating the extent of geological structures in the 3D field and therefore do not lead to the improvement of the student’s spatial visualization skill (Stieff et al., 2005). Thus, it is important for teacher to use new technology that helps in the development of the spatial visualization and structural interpretation skills in their students.
Nowadays, 3D printing technology is becoming increasingly popular in geoscience education system as it allows for the demonstration of various objects in classrooms in a fun, easy to understand, and interactive manner (Horowitz and Schultz, 2014; Hasiuk and Harding 2016; Ford and Minshall, 2017). 3D printing technology allows students to print 3D objects based on geological structures and features to demonstrate complex structures in a comprehensive manner (e.g., Hasiuk, 2014; Hasiuk and Harding 2016; Ishutov et al., 2018). Moreover, combination of visual and touch interaction enables students to understand the difficult concepts underlying geological structures. Notably, 3D printers are gaining popularity all over the world in the field of geoscience education; however, there are only a few case study publications in Thailand. Thus, the current study presents a case study of the effectiveness of 3D printing in demonstrating a variety of geological structures by project-based teaching in the geoscience classroom at Chulalongkorn University in Thailand. Project-based teaching allows students to learn faster through practice and be more productive through a hands-on experience. The use of 3D printing in project-based teaching is reported in numerous articles (Abreu et al., 2014; Carpenter et al., 2016; Ghotbi, 2017; Lin et al., 2018). The aim of the current study is to investigate the potential of 3D printing in the development of structural interpretation skills in students who are at high education level and in supporting innovative ways of geoscience education through project-based teaching.
3D printing technology is ideally suitable for project work or project-based teaching, where learning takes place naturally through practice and experience that comes from doing a project. Students studying at universities are familiar with this type of teaching, where they spend time on group and individual project works. The project output involves the creation of 3D geological structure models based on student interpretation of geological structures and features. Students, then, print out the 3D model to support their own interpretation because multiple concept structural models can be interpreted and created from a single project area. Furthermore, students are then required to present their works including geological structure interpretation, tectonic setting, and 3D model construction in the final project study. This method of teaching is different from the traditional ones that are adopted in the geoscience classroom, as student-centered learning moves power within the learning experience from the lecturer to the student treating the student as a co-creator in the teaching and learning process (Barr and Tagg, 1995).
A 3 -h-per-week course in “seismic interpretation” comprises 1 h of lecture and 2 h of exercise. Every lecture was followed by an exercise, in which the students were asked to interpret seismic data (in the context of geological structure) as a project. The lectures focused on theories and basic seismic interpretation and the exercises on constructivism, social constructivism, and experiential learning. The project involved practice in structural interpretation skill and the development of 3D printing technology using computer-aided software. The students enrolled in this course are third- and fourth-year undergraduate students with a gender-balanced mix classroom and have no previous experience on 3D printing technology. Each student was assigned an individual project and asked to give a short discussion, summary, or progress of the project including concepts of geological structures, 3D geological models, and 3D printing model designs. The development of the teaching with 3D printing technology includes three steps: 1) student project setting, 2) seismic and structural interpretation, 3) model exporting, and 4) student project discussion.
In this teaching method, digital datasets of 2D and 3D seismic reflections are used to interpret a geological structure. Different datasets, with different tectonic settings (i.e., extensional, compressional, strike-slip, inversion, igneous intrusion, and salt tectonics), are randomly provided to the students. Data sources include several locations such as New Zealand, Myanmar, Congo, Norway, and Gulf of Mexico in order to allow students to see various types of geological structures. In addition, there are many open source data that can be downloaded (for teaching) at the university level via internet. Students obtain the data to be interpreted in the “SEG-Y” (.segy) format. The quality of the seismic data is good enough for students to interpret geological structures, such as fault, fold, thrust, salt dome, and igneous intrusion. Students are asked, individually, to import seismic data into an interpretation software package and identify a geological structure in the project area.
Seismic data can be interpreted with a variety of software including free and commercial packages. Free and open source software called “OpendTect” is used to interpret the seismic data and generate surface models containing x, y, and z data (Figure 1A). Faults and horizons (reference surfaces) are interpreted in this software (Figure 1B). In this study, visualization techniques, including time slices, seismic attributes, and vertical seismic displays, are chosen to visualize the changes in seismic characters across the project area. Seismic attribute techniques, such as similarity and dip attributes, are used for observing a geological structure, especially in cases of fault and fracture. During reconnaissance, fault edges are highlighted by the similarity attribute in the seismic data (Figure 1C). Then, careful horizon and fault picking was performed for all the available seismic data in the project area.
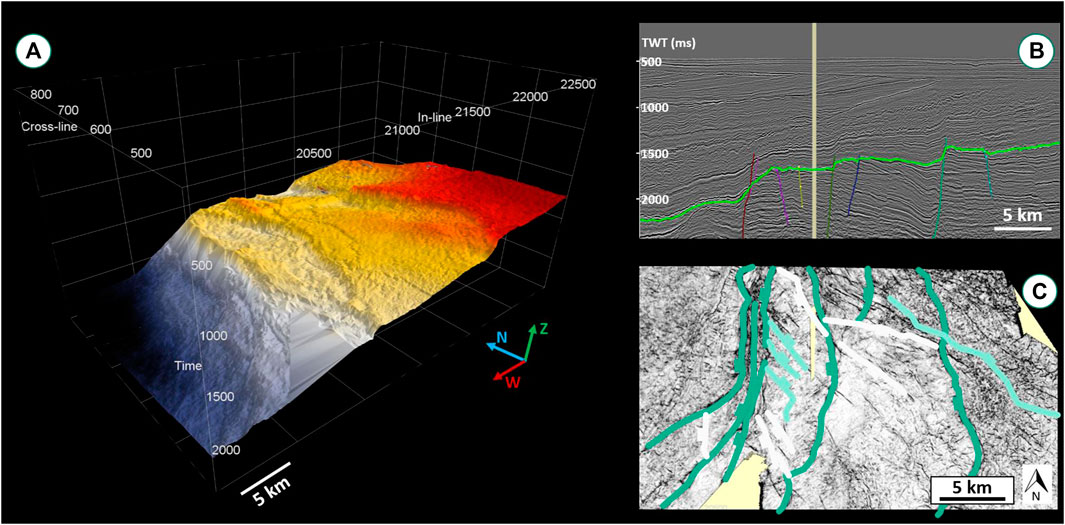
FIGURE 1. Seismic data are interpreted by using OpendTect software. (A) Reference surface of the geological structure model highlighted in the light green line in Figure 1B. (B) Horizon and fault interpretation in cross section. (C) Fault interpretation on the reference surface.
Creating a 3D structural model from seismic data is not typically an automated interpretation process but requires multiple steps involving several software packages. The data used in the student projects are in an SEG-Y format, which is not amenable to 3D printing. 3D printing requires the distance data of three axes (x, y, z) to construct a 3D shape, which is usually presented in a wave front object (.obj) or stereolithography (.stl) format. Thus, three software packages are involved in this study to convert an interpreted image from the student projects from .segy to .stl format. The data are firstly imported into the OpendTect software to interpret geological structures in the project area. However, an overlap surface or curvature surface interpreted from a salt dome and an igneous intrusion is sometime problematic, which is seen as gaps or holes in surface models. Thus, these gaps need to be refined in the Midland Valley’s 3D Move software. In addition, the 3D geological structure model exported from the OpendTect tends to be substantially high resolution. This 3D model should reduce the grid resolution within the Midland Valley’s 3D Move in order to reduce file size, making the model available online.
The Midland Valley’s 3D Move software allows basic modifications to be made to the model, such as scaling, rotation, and variable print density and also allows access to the final model configuration preview, as presented in Figure 2A. Then, the model is exported as .dxf format to SketchUp software. The conversion from .dxf format to .stl format can be carried out using the SketchUp software, which is a 3D drawing tool designed for architectural applications. However, it can be used to create a 3D model and convert the geological model into .stl format. It is also capable of adding objects and editing 3D models to construct printable stereolithography models. This is an important process because separate faults, sometime, are needed to stick together or a prop is used as a supporter to keep the surface in position and printable for the 3D model. The final .stl model is then exported for translation into a physical model (Figure 2B). However, many free software packages are also capable of creating and editing 3D models to construct printable stereolithography models. Examples given in this study are based on the student projects using digital seismic data; other software packages can be adjusted for different learning objectives.
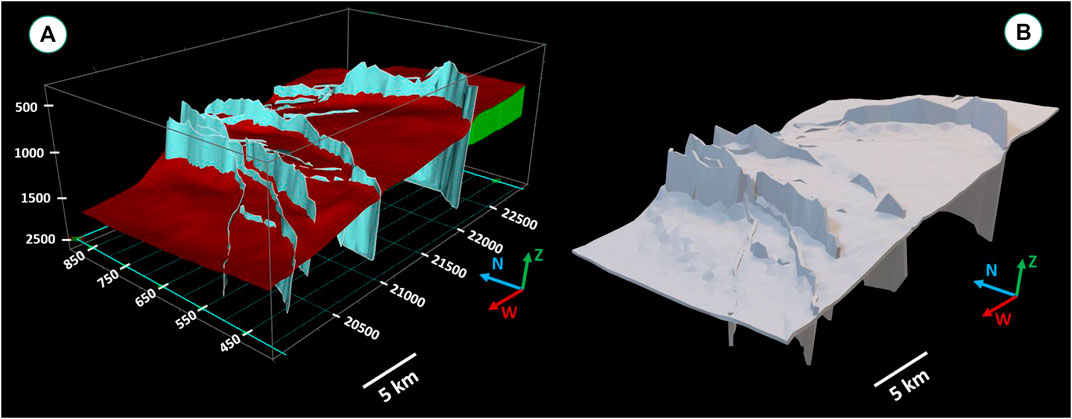
FIGURE 2. (A) 3D geological structure model from 3D Move software. (B) Final 3D geological structure model from SketchUp software.
During the short discussion at the end of the class, students were asked to answer key questions related to the learning objectives of the course that they had understood from the lectures and exercises. The questions were asked to encourage students to apply, summarize, explain, or identify an important aspect or geological structure related to their 3D printing project. For example, the students are asked to identify geological structures and explain how they could demonstrate the geological structure from the project. These questions were used to evaluate the teaching method and its effectiveness in learning. An example of one of the 3D models in .stl format can be found in Supplementary Presentation 1.
From classroom observations, the students were found to be extremely concerned with interpretation of 3D geological structure models. They were highly interested in 3D model interpretation and creation and were found to be willing to spend 60–90 min in the classroom adjusting the overview of the geological structures. Some students spent their free time outside the classroom developing the 3D models as it allowed them to work individually on their personal computers. It seems that the students are better understanding on how geological structure develops through geological times compared to the previous academic year. At the beginning of the structural interpretation, the students usually interpret a simple structure without concerning tectonic concepts. However, when creating the 3D structural model, geological characteristics and the structural geometry became concrete when visualized. This may be due to the fact that the students had to visualize the structure and deformation events by considering spatial continuity in a 3D field during the interpretation. If the interpretation is incorrect, the students were faced with a problem of connecting the structural planes or surfaces such as fault and fold. Thus, they were required to rethink and revise their own concepts of 3D model interpretation. Furthermore, it also appeared that the students were confident drawing these geological structures into seismic data with poor quality seismic area. In comparison to the previous academic year, if students do not know where the problem of the interpretation is, they would not know where they should correct the interpretation. This prevented them from fully understanding the complex geological structure processes leading to misconceptions that hindered the development of their spatial visualization and structural interpretation skills. The students helped each other solve the problems and even discussed the challenges they faced during their projects in classroom. The students seemed to be influenced by the ability to view and rotate the geological structure model from different angles (Figure 3). After printing the 3D models, the students were able to verify the minor inaccuracies in their structural interpretations when the geological structures were provided as 3D models. They were also able to integrate their observations from the dataset into their 3D models during the presentation and discussion sessions. Based on personal interview, the students felt that the benefit of free orientation helped them explain their interpretation in a very easy manner. Thus, cognitive abstract space and spatial visualization ability can be constructed when students need to view the 3D model from different angles (Huang and Lin, 2017). Observations also indicate that the use of the 3D printing model can lead to the enhancement of the structural interpretation skill better than those developed using the traditional teaching method. The current study therefore provides guidance for the development of innovative teaching methods appropriate for the development of students’ structural interpretation skill.
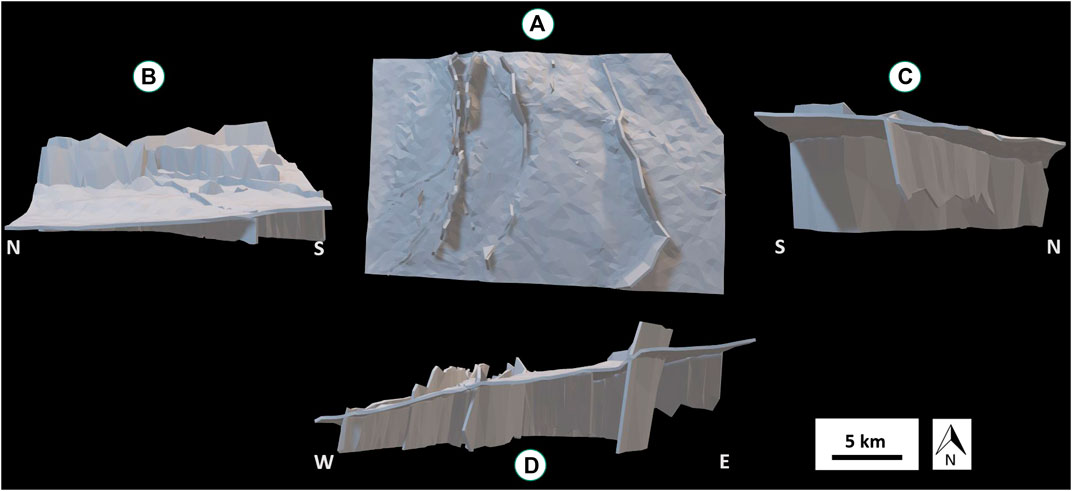
FIGURE 3. 3D printing model. (A) Plan view location of fault orientations. (B–D) Side view of the 3D model.
The advantage of using 3D printing in geoscience teaching includes improved structural interpretation skill, self-direct learning, and student attitude. In addition, with the use of this technology, students can interpret the various concepts with an increased level of confidence. The disadvantages of this teaching method include the additional time required to develop the 3D structural models, lack of student-to-lecturer interactions, and high cost of the printing models. Furthermore, the method used in this study requires lecturers to have computer and software skills. Additionally, minor faults cannot be added in 3D models owing to the connectivity of the 3D printed area.
However, only a few students participated in this study; thus, the observations may not be representative of a complete quantitative analysis. Furthermore, 3D printing in geoscience education was used in this study to give it a global appeal. For example, there remains a need to perform a study using a group project using 3D printing technology to compare the result obtained in this study. Although the teaching method used in this study provides an innovative way for teaching geoscience to undergrad students, it cannot be used to replace some existing learning objectives such as rock classification and stratigraphy; this limits the utility of 3D printing technology.
The 3D printing models created from student projects have been garnering the interest of teachers and students in geoscience classrooms. Construction of 3D printing models can enhance new teaching methods and present novel models of teaching media. The 3D models will be further tested and refined before giving to public domain, thus being accessible to external lectures, students, and interested people. Although the focus of the current study was only on teaching methods adopted in the geoscience classroom, the findings and observations can also benefit other disciplines that adopt similar learning methods.
The original contributions presented in the study are included in the article/Supplementary Material; further inquiries can be directed to the corresponding author.
The author confirms being the sole contributor of this work and has approved it for publication.
The author gratefully acknowledge the financial support from Ratchadaphiseksomphot Endowment Fund, Chulalongkorn University (RLI_2561_001_01_23).
The author declares that the research was conducted in the absence of any commercial or financial relationships that could be construed as a potential conflict of interest.
Petroleum Experts (Petex) is thanked for academic use of Midland Valley’s 3D Move. Reviewers are thanked for their useful and constructive comments.
The Supplementary Material for this article can be found online at: https://www.frontiersin.org/articles/10.3389/feart.2020.590062/full#supplementary-material.
Abreu, P., Restivo, M. T., Quintas, M. R., de Fátima Chouzal, M., Santos, B. F., Rodngues, J., et al. (2014). “On the use of a 3D printer in mechatronics projects,” in 2014 International conference on interactive collaborative learning, Dubai, United Arab Emirates, December 3–6, 2014, 995–999.
Alcalde, J., Bond, C. E., Johnson, G., Butler, R. W. H., Cooper, M. A., and Ellis, J. F. (2017). The importance of structural model availability on seismic interpretation. J. Struct. Geol. 97, 161–171. doi:10.1016/j.jsg.2017.03.003
Barr, R. B., and Tagg, J. (1995). From teaching to learning—a new paradigm for undergraduate education. Change 27 (6), 12–26. doi:10.1080/00091383.1995.10544672
Berra, F., Felletti, F., and Zucali, M. (2014). 3D geological modelling and education: teaching geological cross sections with a 3D modelling software to improve spatial thinking skills in geoscience students. Rendiconti. Online Soc. Geol. Ital. 30, 5–11. doi:10.3301/rol.2014.02
Carneiro, C. D. R., dos Santos, K. M., Lopes, T. R., dos Santos, F. C., da Silva, J. V. L., and de Camargo Harris, A. L. N. (2018). Three-dimensional physical models of sedimentary basins as a resource for teaching-learning of geology. Terrae Didatica 14 (4), 379–384. doi:10.20396/td.v14i4.8654098
Carpenter, M. S., Yakymyshyn, C., Micher, L. E., and Locke, A. (2016). “Improved student engagement through project-based learning in freshman engineering design,” in 2016 ASEE annual conference and exposition, New Orleans, Louisiana, June 26–29, 2016, 25602.
Caumon, G., Collon-Drouaillet, P. L. C. D., De Veslud, C. L. C., Viseur, S., and Sausse, J. (2009). Surface-based 3D modeling of geological structures. Math. Geosci. 41 (8), 927–945. doi:10.1007/s11004-009-9244-2
Chenrai, P., and Huuse, M. (2020). Sand injection and polygonal faulting in the great south basin, New Zealand. Geol. Soc. Spec. Publ. 493. doi:10.1144/SP493-2018-107
Ford, S., and Minshall, T. (2017). 3D printing in teaching and education: a review of where and how it is used. Addit. Manuf. 25, 131–150. doi:10.1016/j.addma.2018.10.028
Frodeman, R. (1995). Geological reasoning: geology as an interpretive and historical science. Geol. Soc. Am. Bull. 107 (8), 960–968. doi:10.1130/0016-7606(1995)107<0960:grgaai>2.3.co;2
Ghotbi, E. (2017). “Applying 3D printing to enhance learning in undergraduate kinematic and dynamic of machinery course,” in 2017 ASEE annual conference and exposition, Columbus, OH, June 24–27, 2017.
Harding, R., and Huuse, M. (2015). Salt on the move: multi stage evolution of salt diapirs in Netherlands North Sea. Mar. Petrol. Geol. 61, 39–55. doi:10.1016/j.marpetgeo.2014.12.003
Hasiuk, F. (2014). Making things geological: 3-D printing in the geosciences. GSA Today 24 (8), 28–29. doi:10.1130/gsatg211gw.1
Hasiuk, F., and Harding, C. (2016). Touchable topography: 3D printing elevation data and structural models to overcome the issue of scale. Geol. Today 32 (1), 16–20. doi:10.1111/gto.12125
Horowitz, S. S., and Schultz, P. H. (2014). Printing space: using 3D printing of digital terrain models in geosciences education and research. J. Geosci. Educ. 62 (1), 138–145. doi:10.5408/13-031.1
Huang, T.-C., and Lin, C.-Y. (2017). From 3D modeling to 3D printing: development of a differentiated spatial ability teaching model. Telemat. Inform. 34 (2), 604–613. doi:10.1016/j.tele.2016.10.005
Ishutov, S., Jobe, T. D., Zhang, S., Gonzalez, M., Agar, S. M., Hasiuk, F. J., and Chalaturnyk, R. (2018). Three-dimensional printing for geoscience: fundamental research, education, and applications for the petroleum industry. AAPG Bull. 102 (1), 1–26. doi:10.1306/0329171621117056
Mackay, K. Y., Hsiao, H. S., Chang, Y. S., Chien, Y. H., and Wu, Y. T. (2018). The effectiveness of using 3D printing technology in STEM project-based learning activities. Eurasia J. Math. Sci. Technol. Educ. 14 (12), em1633. doi:10.29333/ejmste/97189
Rotevatn, A., and Jackson, C. A.-L. (2014). 3D structure and evolution of folds during normal fault dip linkage. J. Geol. Soc. 171 (6), 821–829. doi:10.1144/jgs2014-045
Stieff, M., Bateman, R. C., and Uttal, D. H. (2005). “Teaching and learning with three-dimensional representations,” in Visualization in science education. Dordrecht, Netherlands: Springer, 93–120.
Keywords: 3D printing, teaching innovation, structural interpretation skill, seismic interpretation, geoscience education
Citation: Chenrai P (2021) Case Study on Geoscience Teaching Innovation: Using 3D Printing to Develop Structural Interpretation Skill in Higher Education Levels. Front. Earth Sci. 8:590062. doi: 10.3389/feart.2020.590062
Received: 31 July 2020; Accepted: 03 November 2020;
Published: 15 January 2021.
Edited by:
Derek Keir, University of Southampton, United KingdomReviewed by:
Luigi Jovane, University of São Paulo, BrazilCopyright © 2021 Chenrai. This is an open-access article distributed under the terms of the Creative Commons Attribution License (CC BY). The use, distribution or reproduction in other forums is permitted, provided the original author(s) and the copyright owner(s) are credited and that the original publication in this journal is cited, in accordance with accepted academic practice. No use, distribution or reproduction is permitted which does not comply with these terms.
*Correspondence: Piyaphong Chenrai, UGl5YXBob25nLkNAY2h1bGEuYWMudGg=
Disclaimer: All claims expressed in this article are solely those of the authors and do not necessarily represent those of their affiliated organizations, or those of the publisher, the editors and the reviewers. Any product that may be evaluated in this article or claim that may be made by its manufacturer is not guaranteed or endorsed by the publisher.
Research integrity at Frontiers
Learn more about the work of our research integrity team to safeguard the quality of each article we publish.