
94% of researchers rate our articles as excellent or good
Learn more about the work of our research integrity team to safeguard the quality of each article we publish.
Find out more
TECHNOLOGY AND CODE article
Front. Earth Sci. , 11 November 2020
Sec. Volcanology
Volume 8 - 2020 | https://doi.org/10.3389/feart.2020.586955
This article is part of the Research Topic Seismicity in Volcanic Areas View all 20 articles
Volcanic tremor is a sustained seismic signal associated with volcanic unrest and is often linked to movement of magmatic fluids in the subsurface. However, signals with similar spectral content can be generated by other surface processes. Hence, one of the best ways of distinguishing between different possible mechanisms is by tracking the location of its source, which is also important for mitigating volcanic risk. Due to its emergent nature, tremor cannot be located using travel-time based methods, therefore alternatives such as amplitude-based techniques or array analysis must be used. Dense, small-aperture arrays are particularly suited for analyzing volcanic tremor, yet costs associated with installation and maintenance have meant few long-term or permanent seismic arrays in use for routine monitoring. Given the potential for wider usage of arrays, this work presents a python-based software tool that uses array data and array processing techniques to analyze and locate volcanic tremor signals. RETREAT utilizes existing routines from the open-source ObsPy framework to carry out analysis of seismic array data in real-time and performs f-k (frequency-wavenumber) analysis, or Least-Squares beamforming, to calculate the backazimuth and slowness in overlapping time windows, which can help track the location of volcanic tremor sources. A graphical, or web-based, interface is used to configure a set of input parameters, before fetching chunks of waveform data and performing the array analysis. On each update the tool returns several plots, including timeseries of the backazimuth and slowness, a polar representation of the power and a map of the array with dominant backazimuth overlaid. The tool has been tested using real-time seismic data from the small-aperture SPITS array in Spitsbergen, as well as on data from an array deployed during the 2014 eruption of Bárðarbunga volcano, Iceland. Configuration files and waveform data for these examples are supplied with the distribution. RETREAT can also be used for infrasound and has been tested on infrasonic array data recorded at Mt. Etna, Italy. RETREAT is intended for use in real-time monitoring settings and it is hoped that it will facilitate greater use of arrays in tracking volcanic tremor sources in real-time, thereby enhancing monitoring capabilities.
Volcanoes exhibit a very broad range of seismic source types (see e.g., Wassermann (2012)). Monitoring seismicity remains at the core of most volcano observatories (Sparks et al., 2012), and in a crisis, one of the key challenges for monitoring agencies is identifying the source type and tracking its location. This can be difficult to achieve with a sparse seismic network or when seismic signals have an emergent onset or lack of clear phase arrivals and in particular for continuous signals such as volcanic tremor.
Widely observed at many volcanoes (McNutt, 2011), volcanic tremor is a sustained seismic signal associated with eruptions and is often linked to movement of magmatic fluids in the subsurface (Julian, 1994; Hellweg, 2000; Jellinek and Bercovici, 2011). However, it can occur pre-, syn- and post-eruption and signals with similar spectral content can be generated by several other processes such as subglacial flooding (Eibl et al., 2020), lahars (Kumagai et al., 2009) other surficial mass flows (Allstadt et al., 2018) or even tectonic sources such as deeper slow slip earthquakes in subduction zones (Beroza and Ide, 2011). Hence one of the best ways of distinguishing between the processes underlying tremor generation is by determining and tracking its spatial location. As tremor cannot be located using classical travel-time methods, because of its emergent and sustained nature and lack of clear body-wave phases, its source must be determined using alternatives such as amplitude-based techniques (Battaglia et al., 2005; Taisne et al., 2011; Morioka et al., 2017) or, as in this tool, seismic array analysis.
A seismic array is a cluster of stations lying outside the seismic source area which can be used to point to the source location by measuring the back azimuth of the arriving signal (Rost and Thomas, 2002). An array can therefore be used to estimate lateral and vertical migration of tremor sources (Almendros et al., 1997; Di Lieto et al., 2007; Eibl et al., 2017a; Eibl et al., 2017b). Seismic arrays are frequently used for research, but not often as an operational tool for volcano monitoring in real-time, although arrays of infrasound sensors have been used for real-time alarms, e.g., at the Alaska Volcano Observatory (Coombs et al., 2018). Hence, this software aims to provide a convenient tool to facilitate processing and interpretation of both seismic, and potentially infrasonic, array data in real-time, to allow such data to be used more routinely for volcano monitoring.
This software has been developed within the framework of the EUROVOLC project, which aims to promote an integrated and harmonized European volcanological community (Vogfjörd et al., 2019). One of the major themes of the project focuses on understanding sub-surface processes, since early identification of magma moving toward the surface is very important for the mitigation of risk from volcanic hazards. Joint research activities within the project aim to develop volcano pre-eruptive detection schemes, in particular through the use of tremor as a real-time unrest indicator.
Given this context, we present RETREAT–a REal-time TREmor Analysis Tool–that uses seismic array data and array processing techniques to help detect, quantify and locate volcanic tremor signals.
In developing this software several choices had to be made–such as the programming language and type of user-interface–keeping in mind that its intended use is in real-time monitoring settings. The overall aim was to produce a tool that was as open and flexible as practicable, hence the choice to use the popular open source and platform independent python programming language, so as to keep the software as generic and as widely compatible as possible. Using python allowed us to build upon the popular ObsPy framework (The ObsPy Development Team, 2020b), which is widely used within the seismological community. This approach has the advantage of drawing on a large library of existing processing routines, with no reinvention of the wheel required (Megies et al., 2011). The disadvantage is that some flexibility is perhaps sacrificed by making it more difficult to design and implement custom processing routines, but the goal was to produce a tool that was easy to use and could be quickly and easily installed with as little additional packages required as possible. This and other limitations of the current implementation are further explored in Limitations of the Current Implementation. Since it is intended as a real-time tool, rapid processing of the array data becomes important, and computationally intensive tasks have been minimized where possible, with process-based parallelism exploited through python’s multiprocessing capabilities.
The choice of python as the development language also makes the tool theoretically platform independent, again offering flexibility, and the software has been successfully tested in both Linux and Microsoft Windows environments.
RETREAT requires python3 to be installed, and a list of required python modules is contained in the requirements.txt file supplied with the distribution. These are also summarized in Table 1.
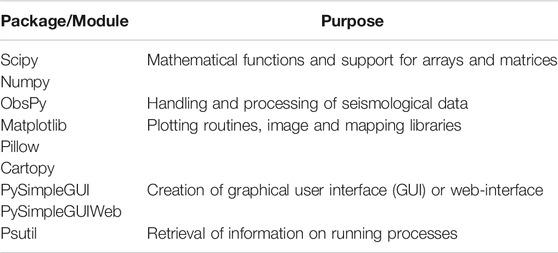
TABLE 1. List of external python modules and packages required by RETREAT software and their purposes.
The key modules utilized by the tool are those that create the GUI or web interface and those that perform the data handling and array analysis.
The user interface for the RETREAT code was built using the PySimpleGUI python package, (PySimpleGUI.org, 2020), that allows creation of simple but powerful GUIs as well as web interfaces that can run within a web browser window. More information on PySimpleGUI is available from https://pysimplegui.readthedocs.io/en/latest/.
Pre-processing and analysis of the seismic array data in RETREAT is performed by ObsPy (The ObsPy Development Team, 2020) an open-source framework for processing seismological data using python. The framework provides parsers for reading common seismic data and metadata formats, clients to access data centers and servers (for the real-time analysis) and seismological signal processing routines which allow processing and array analysis of the seismic data (Beyreuther et al., 2010).
Plotting of the output figures is handled by the matplotlib (Hunter, 2007) python plotting library, with array maps produced using Cartopy (Elson et al., 2020).
A schematic overview of the software workflow is shown Figure 1. A GUI or web-based interface, built using the PySimpleGUI python module, provides the first strand of input: a set of highly configurable input parameters. These include options for choosing and configuring the data source, pre-processing, timing and update options as well as the parameters for the seismic array analysis, which must be carefully selected and tuned for the specific array. The GUI also starts and controls the analysis. The other strand of input into the software is the seismic waveform data, which can be retrieved from either a real-time source or an existing data archive. These two input strands feed into the main data processing section, which utilizes ObsPy to perform the pre-processing and array analysis. The output from the software is a set of figures, produced using the matplotlib plotting libraries, that display the updated results of the array analysis.
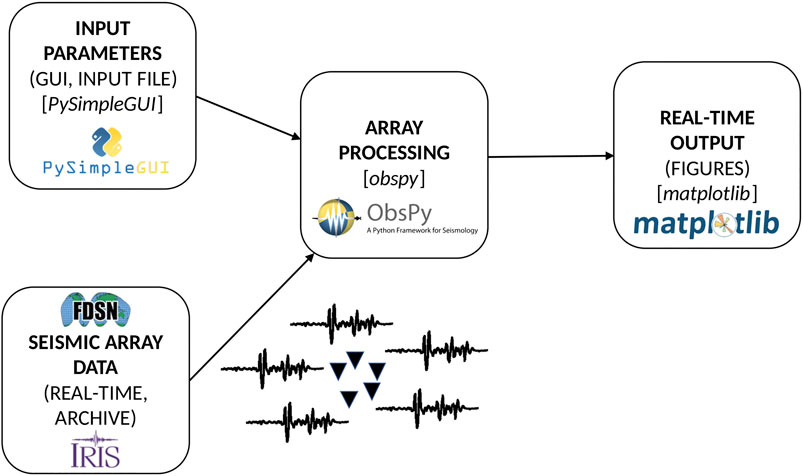
FIGURE 1. Schematic overview of the RETREAT software package. Input parameters and configuration are collected from the GUI or web interface that was built using the PySimpleGUI module. Next, these settings allow seismic array data (real-time data from external sources, e.g. IRIS or any other server, or existing archive data) to be processed and analyzed using the standard array processing routines in ObsPy. Output figures displaying the results of the array analysis are then produced using the matplotlib python module and are continuously updated as new data is processed.
The array processing performed by this software uses the standard array analysis routines that are supplied with ObsPy to retrieve estimates of the back azimuth and slowness values from a series of overlapping sub-windows.
Array processing methods utilize beamforming techniques, which enhance the signal-to-noize ratio (SNR) by stacking coherent parts of the input signals in order to suppress noise in the data (Rost and Thomas, 2002). A widely used array method to estimate the slowness of seismic waves arriving at an array is frequency wavenumber (f-k) analysis (Capon and Bolt, 1973; Harjes and Henger, 1973) which uses multi-dimensional Fourier Transforms to transform the wave-field to the frequency-wavenumber domain. The slowness vector is then estimated by using the absolute power as a measure of coherency, with the analysis performed in the frequency domain for a number of different slowness values in a pre-defined grid (Schweitzer et al., 2012). This particular beamforming method was chosen for this initial version of the software for convenience, as it is a commonly used, well-tested and readily available method built into ObsPy. This was a deliberate design choice as the primary aim was to produce a working tool that can easily be applied to real-time data.
The analysis procedure performed by RETREAT largely follows the ObsPy tutorial on “Beamforming - FK Analysis” (The ObsPy Development Team, 2020a), and the software carries out the f-k analysis based on the parameters supplied from the GUI interface. These parameters, which must be carefully selected for a particular array, include: the array geometry (calculated from station location metadata), the frequency range of interest in the signal and the grid of slowness values on which to evaluate the beam power.
Additionally, there is also an option to use Least-Squares beamforming, using cross-correlation to calculate delay times, as an alternative to f-k analysis (e.g., for infrasound data). Low velocity (and therefore high slowness) values for infrasonic data mean a large slowness grid is required which can affect the computation time. The implementation in this code follows exactly the method described by De Angelis et al. (2020) and allows for significantly faster computation as well as explicit uncertainty estimates for the back azimuth and velocity (slowness). More details and an example comparing this method to f-k analysis for an infrasound dataset are discussed in Application to Infrasound Data.
Prior to the array analysis the waveform data may be pre-processed to facilitate the computation. This includes options to remove the instrument response, demean or detrend the data and to filter to the input signals to the frequency range of interest. Since minimizing the processing time becomes important for real-time analysis, there is also an option to decimate the data to a lower sampling rate while still retaining relevant frequencies.
The GUI interface allows input parameters to be defined which configure and control the software. These parameters include options for choosing and configuring the data source, pre-processing, timing and update options and the parameters for the array analysis. The parameters are divided into several sections, as shown in the screenshot of the GUI interface in Figure 2.
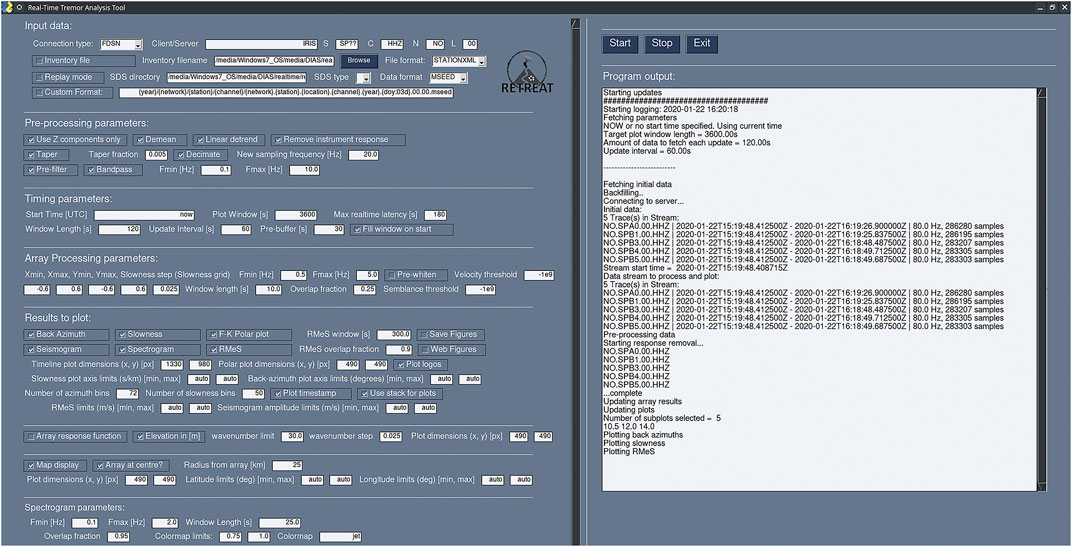
FIGURE 2. Example screenshot of the GUI interface for the RETREAT tool, showing the program controls, configurable input parameters and program output window.
All parameters that can be set using the GUI or web interface can also be defined in advance of runtime. This is controlled by a text file containing a simple python dictionary comprised of pairs of parameters and their default values, which can be edited to change the values as desired. The repository contains two example files containing default values that can be used to run the two examples described in Example Configuration and Datasets Included With the Distribution.
More detailed information for each input parameter is provided in the documentation supplied with the software distribution.
These parameters define the source and properties of the input seismic data. The software operates in two modes, depending on whether the data source is real-time or archive data.
In real-time mode, the user can choose their data source from either an FDSN client or a SeedLink server. Other sources supported by ObsPy are possible, but have not yet been implemented. Data are fetched at regular intervals controlled by parameters in the timing section. The other mode is a “replay” mode for archive data, that must be supplied in a (customizable) Seiscomp Directory Structure (SDS). All seismic data formats supported by ObsPy can be used, and in both modes station metadata containing the station coordinates must be supplied in order to perform the array analysis.
This set of parameters define any pre-processing applied to the data before the array analysis is carried out. This includes options to demean, detrend, taper and filter the input data, as well as to decimate the signals to a lower sampling rate to reduce the computation time.
This set of parameters define the amount of data to be processed, by defining the length of the window and how often it is updated (in real-time mode). Updates of new data are managed by the python code, with the update interval specified by the user as an input parameter. If the processing for each update step takes longer than this update interval to complete, the software will warn the user that real-time processing may lag. For non-real-time archive data in “replay” mode, this parameter is ignored and the next chunk of data is processed immediately.
Latency and buffering options can also be set, as well as the start time for analysis if running in replay mode.
This section sets parameters for the array processing, using either the standard array analysis routines in ObsPy or a Least-squares beamforming method. These include the frequency range of interest and the slowness grid over which to perform the f-k analysis, with the choice of these values depending on the specific array. To provide a timeseries output, the beamforming for both methods is performed by using shorter time windows, with a defined amount of overlap, and sliding these windows across the entire input signal.
The parameters in this section allow the output figures to be selected from the choices outlined in Array Processing Parameters, as well as various settings for these plots such as the axis limits and plot dimensions. The results can also be displayed in a web browser instead of a GUI window, and images can be stored with unique filenames based on their timestamp.
These settings control where the output produced by the software is stored on the system, including the figures, log file and array processing results. The GUI interface also includes an output pane to the right of the input parameters (Figure 2) that displays diagnostic and (any) error messages in the log file in real-time.
Once configured and launched, the tool fetches chunks of waveform data (in real time or from files) and updates its output accordingly. On each update the tool returns a choice of plots, as shown in the schematic in Figure 3. The results of the array processing are presented as timeseries of the back azimuth and slowness values determined in each sub-window of the input data, with the temporal resolution dependent on the window length of each sub-window and desired amount of overlap. A timeseries of the relative power (f-k) or mean correlation (Least-Squares beamforming) can also be plotted, which may be a useful threshold parameter for event detection or alarm triggering. Alongside these array analysis results, the seismic waveform, its envelope (root-median-square is used to remove transients) and a spectrogram can optionally be plotted on a common timebase. Additionally, a separate plot displays the relative power (or correlation for Least-Squares) returned by the array processing in polar form, as a histogram of the back azimuth and slowness values, which can also be normalized. A third optional panel can display either the array response function, or, a map of the array locale overlain by a line representing the back azimuth derived from the maximum relative power in the histogram. Maps are produced by the Cartopy package using topographic data from the OpenTopoMap project, with tiles automatically downloaded for the geographic area of the array at the chosen zoom level. Output figures for the example datasets supplied with the distribution are shown in Example Configuration and Datasets Included With the Distribution.
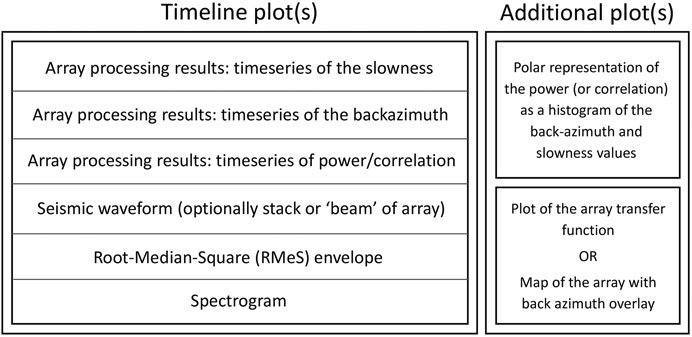
FIGURE 3. Schematic diagram showing the possible output figures that can be produced by RETREAT. The left-hand pane features timeseries of several parameters (slowness, back azimuth, power/correlation, waveform, envelope, spectrogram) plotted on a common timebase. The right-hand plots show a polar representation of the back azimuth and slowness values as well an optional plot of either the Array Response Function or a map of the array.
Configuration files and data to run processing of two examples, of both real-time and archive data, are included with the software distribution. Due to financial and technical constraints seismic arrays are not often used routinely for volcano monitoring, and therefore real-time data from such arrays are not available from many volcanoes. Hence, we opted to use freely available real-time data from the small aperture SPITS array as a development and demonstrator dataset for our real time application. Archived data from a deployment in Iceland, carried out during the 2014–2015 Bárðarbunga eruption as part of the FUTUREVOLC project, were used to develop and test the application of this tool on archived data (Bean and Vogfjörd, 2020).
As we currently do not have any real time seismic array data from a volcano available within the EUROVOLC project or its partners, the tool has been tested using both the FDSN and SeedLink clients of ObsPy to fetch data from the IRIS datacenter, using example real-time data from the small-aperture SPITS seismic array (Gibbons et al., 2011) in Spitsbergen, Svalbard, as shown in Figure 4. This small-aperture array comprising nine stations is part of the larger NORSAR array, but with an aperture of around 1 km is more typical of the size and characteristics of seismic arrays deployed in volcanic environments.
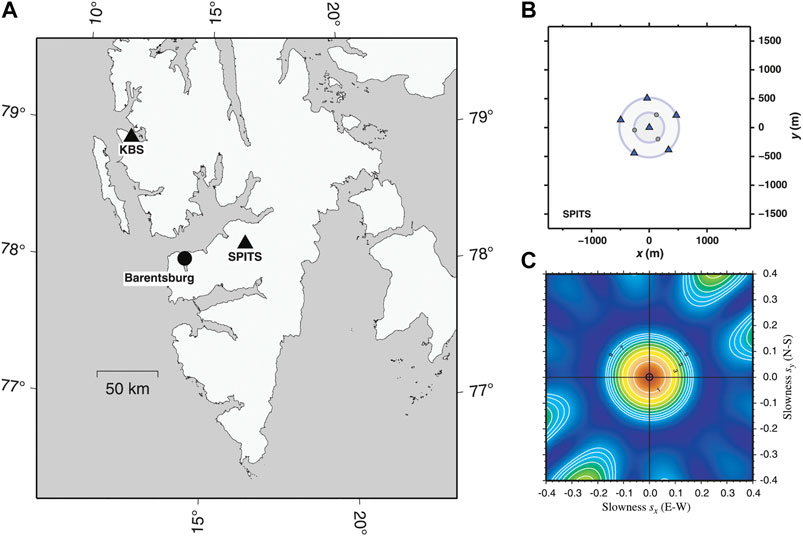
FIGURE 4. (A) Map showing the location of the small-aperture SPITS array (black triangle) on Spitsbergen; (B) station locations showing the nine-station array design with approximate 1 km aperture, with three-component stations shown by triangles and single component stations by circles; and (C) the associated array response as a function of the horizontal slowness evaluated at 4 Hz. Map and figures taken from Gibbons (2006) and Gibbons et al. (2011).
To run the real-time example, the end-user can choose the appropriate default values file (NO array) before starting the software. This should begin analysis of real-time data, with results similar to those shown in the screenshot of an example output window in Figure 5.
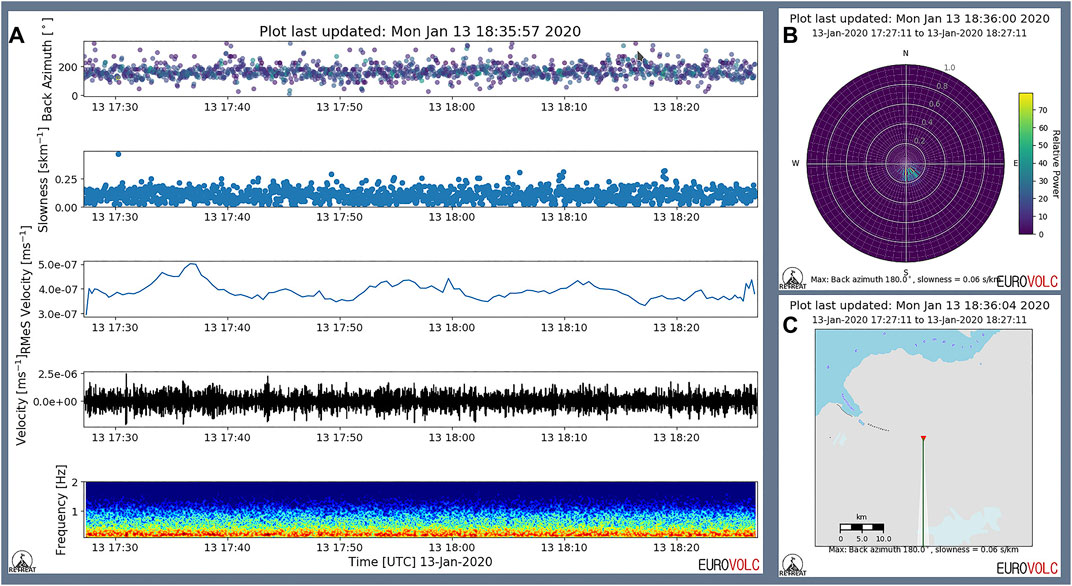
FIGURE 5. Example of the output figures produced by the RETREAT software tool, showing (A) timeseries of the slowness and backazimuth calculated from the f-k analysis, alongside the seismic waveform, envelope and spectrogram and (B) a polar representation of the array processing results. Also shown is (C) a map of the area surrounding the SPITS array, with the resulting back azimuth overlaid. The azimuth error is illustrative only, determined from the resolution of the histogram. Implementation of uncertainty estimation for the back azimuth values is discussed further in Discussion.
As mentioned previously, for real-time or near real-time use, the processing and computation time for any data analysis becomes critically important, as data must be able to be processed rapidly enough to match the acquisition. While care has been taken to minimize computationally intensive tasks, including making use of python’s multiprocessing capabilities, the code has not been formally optimized. The approach taken with this tool is to acquire data in chunks (of a size and at a frequency defined by the user) and then update the array results with each new acquisition of data. The processing time for each update will vary depending on many factors, including: the window length or amount of data analyzed, the download speed of the data over the network or internet, the number of stations and channels in the array, the sampling rate, whether the data are decimated, other pre-processing steps and finally the hardware capabilities of the machine on which the software is run. Therefore, some experimentation will be required to determine the limitations for any particular dataset and configuration. For this example, using data from the SPITS array, five stations with a sampling rate of 80 Hz are used, with the data decimated to 20 Hz before the array analysis. The tool is configured to analyze 1 h of data, updating every minute. The processing time for each update for this configuration is approximately 18 s on a modern desktop machine (12x Intel Xeon W-2135, 64 GB RAM) and around 30 s on a laptop with similar specifications (4x Intel Core i7-6600U, 32 GB RAM). This is therefore adequate for an update interval of 60 s in this example.
An example dataset and configuration that uses archive seismic array data has also been included with the distribution, to demonstrate analysis of non-real-time datasets. This second example uses array data from the 2014–2015 eruption of Bárðarbunga volcano in Iceland (Sigmundsson et al., 2015), collected as part of the FUTUREVOLC project. Several hours of data from the UR array between 00:00 and 08:00 UTC on September 03, 2014 are included with the distribution, corresponding to part of the time period analyzed in Eibl et al. (2017b). The map in Figure 6 shows the geometry and location of the seven station UR array in Iceland, relative to the erupted lava flow field in Holuhraun and Bárðarbunga volcano. Example results of the analysis of these data using RETREAT are shown in Figure 7.
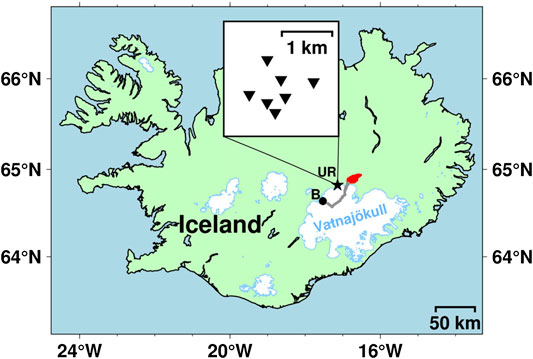
FIGURE 6. Map showing location and geometry of the seven station UR seismic array deployed as part of FUTUREVOLC to collect data during the 2014–2015 eruption at Bárðarbunga volcano in Iceland. The location of the erupted lava flow field in Holuhraun is indicated in red, Bárðarbunga volcano by the black letter B and the approximate propagation path of the dyke intrusion below the glacier by the gray line.
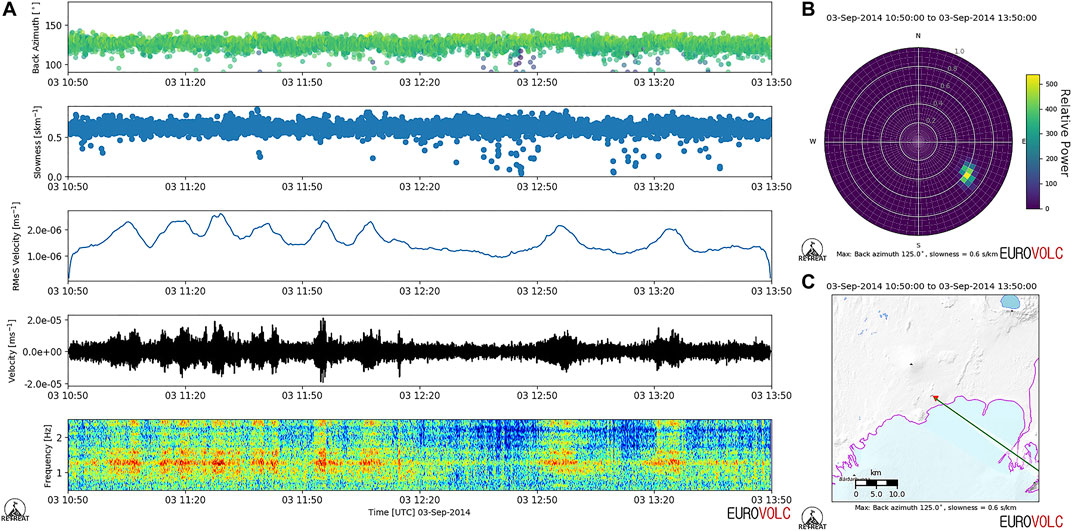
FIGURE 7. Output figures produced by the RETREAT software for the archive data example. (A) Time series of slowness and backazimuth calculated from f-k analysis, alongside the seismic waveform, envelope and spectrogram and (B) a polar representation of the array processing results. Also shown is (C) a map of the area surrounding the UR array, with the resulting back azimuth overlaid, closely matching the results found by Eibl et al. (2017b).
The configuration for this example closely follows the parameters used by Eibl et al. (2017b), with the data from the seven station array filtered between 0.8 and 2.6 Hz after being downsampled to 20 Hz. The time period analyzed represents pre-eruptive tremor prior to a suspected sub-glacial eruption, based on observed cauldron formation approximately, 12 km from the UR array. The tremor signal is centered around 1.3 Hz, with harmonic overtones at 0.25 Hz spacing, and the upper end of measured slowness values of 0.6–0.75 skm−1 from the array analysis support a strong surface wave component. Array analysis and location of the tremor signal, along with mapping of the slowness changes to depth changes by modeling the tremor as a comb function, is interpreted by Eibl et al. (2017b) as the tremor representing microseismicity resulting from brittle failure in the weak uppermost crust, marking the onset of shallow dyke formation.
The particular suitability of seismic arrays for the analysis of volcanic tremor has been long noted (Chouet, 1996), yet seismic arrays and array processing are not routinely or widely used operationally in volcano monitoring, with local monitoring networks often being distributed and wide aperture to maximize spatial coverage (Allstadt et al., 2018). As Wassermann (2012) notes, most of the barriers to greater operational use of denser, smaller aperture arrays are technical in nature, and include the comparatively higher costs of installation and maintenance, as well the need for expertize, requiring significant economic and human resources. This has meant array installations on volcanoes have often been short-term campaign deployments, with few long-term or permanent seismic arrays in use for routine monitoring purposes. However, with increasing instrumentation and monitoring of volcanic systems there is potential and scope for more routine use. The software developed and presented in this manuscript is intended to ease and facilitate greater use of seismic arrays for such operational purposes, but we reiterate here that arrays should be seen as complementary to, and not a replacement for, existing seismic networks.
The current implementation of the software is intended specifically for: 1) seismic array data, for 2) arrays away from the target tremor source, i.e., the source is outside of the array or network and 3) real-time applications. RETREAT is not intended as a comprehensive solution for tremor analysis, and its limitations are to some extent controlled by the availability and quality of the input data. Specific constraints, such as the optimum frequency range and slowness resolution, will depend on the geometry and number of stations in the end-user’s specific array and how these compare to the characteristics of the recorded signals.
Dealing with error estimates of the slowness and azimuth values retrieved from f-k analysis is not straightforward (La Rocca et al., 2008) as the uncertainties depend on multiple factors; including aspects of the array characteristics (geometry, number of stations) and data quality (coherence, noise, site effects). One method of estimation is to use the size or width of the peak around the maximum power in the f-k plot (Schweitzer et al., 2012), but this method cannot easily be extended across a timeseries of shorter windows into a single uncertainty value. How errors should be calculated and displayed within RETREAT is an unresolved problem, and a fuller treatment of uncertainties may increase the computation time and compromise the ability to process data fast enough to achieve real-time results. However, improved error estimation is an important feature that is in development and it is intended to implement this feature in future versions of the software. One alternative could be to use a Least-Squares beamforming method, such as that described in the next section.
The use of infrasound to monitor volcanic activity has become increasingly common, and infrasound sensors are often deployed alongside existing seismic and deformation networks as part of a multi-disciplinary monitoring approach (e.g., Fee and Matoza, 2013; McNutt et al., 2015). In a similar manner to seismology, as well as more widely distributed networks, tight clusters of stations or small aperture arrays of infrasound sensors have been used extensively (e.g., Ripepe and Marchetti, 2002; Yamakawa et al., 2018; De Angelis et al., 2020) to monitor and track the location of sub-aerial volcanic phenomena, such as explosions, gas and ash emission, dome or sector collapses, pyroclastic density currents and lahars. Analysis of data from infrasonic arrays has also been used to implement automated early warning systems for explosive eruptions (Ripepe et al., 2018).
Although designed specifically for seismic array data (with a particular focus on volcanic tremor), RETREAT can also be applied to data from an array of infrasound sensors, using f-k analysis in the same way as for seismic data to retrieve the azimuth and slowness of infrasonic acoustic waves arriving at the array (Figure 8). However, due to the lower velocity of acoustic waves compared to seismic waves (and therefore higher slowness–up to 3 skm−1 and beyond), a larger slowness grid is required for the analysis. Therefore, a larger grid, while keeping a small enough slowness step to maintain adequate resolution, is far less computationally efficient and results in significantly longer processing times.
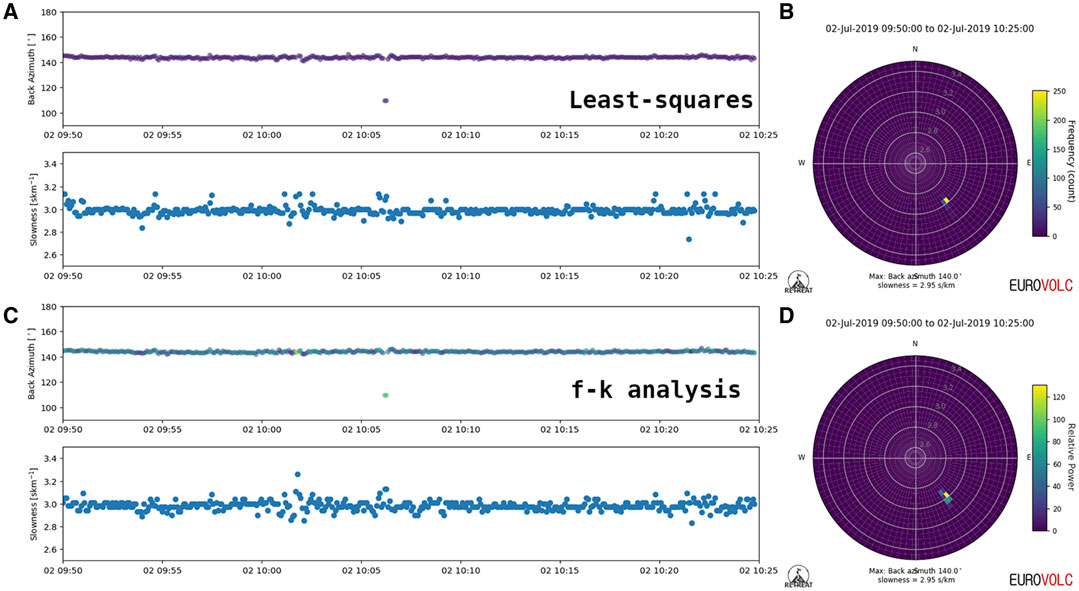
FIGURE 8. Comparison of RETREAT applied to infrasonic array data using two different beamforming methods. (A) Timeseries of backazimuth and slowness values derived using Least-Squares inversion and (B) corresponding histogram of slowness and backazimuth values in polar form. Note that this is weighted by the MCCM (mean cross-correlation maxima) rather than the relative power as in the f-k case. (C) Timeseries of backazimuth and slowness values derived using f-k analysis and (D) the corresponding histogram of slowness and backazimuth values in polar form, weighted by the relative power.
With this in mind, RETREAT also contains a python implementation of a time-domain Least-Squares inversion method that uses cross-correlation to compute time delays between station pairs to carry out the beamforming and derive an estimate of the apparent horizontal velocity. This method (Olson and Szuberla, 2005; Haney et al., 2018) is also applied on a series of overlapping sub-windows to produce timeseries of the back azimuth and slowness, and has the advantage of being faster to compute, while developments by De Angelis et al. (2020) also allow for direct estimates of the uncertainties of these measurements. It also returns a timeseries of the mean cross-correlation maxima (MCCM), which by choosing a certain threshold can be a useful parameter for event detection, or even alarm triggering.
In order to illustrate the capability of RETREAT to analyze infrasonic array data in addition to seismic data, Figure 8 shows a comparison between the two beamforming methods. The data analyzed are from a 2019 deployment of two 6-sensor infrasound arrays at Mt. Etna in Italy, and are exactly the same as those analyzed and presented in Figure 4 of De Angelis et al. (2020), containing 35 min of data from July 2, 2019 at the ENEA array, approximately 1 km to the NW of the summit. The dominant activity is from deep intra-crater explosions at the more southerly Bocca Nuova crater (∼145°), occurring consistently across the timeseries, with a brief interruption from a larger ash-rich explosion at the North East Crater (∼110°) at around 10:06 UTC. Data are pre-processed by filtering between 0.7 and 15 Hz, and a 10 s window with 50% overlap is used. The results of the analysis in Figure 8 show that both methods are capable of reproducing the results of De Angelis et al. (2020) and resolving the change in location of activity at around 10:06 UTC; however the Least-Squares method is much faster, which is a key advantage for real-time applications. This method also produces more tightly clustered values, particularly in slowness, and with a step of 0.05 skm−1 in the slowness grid limiting the resolution, the f-k analysis takes around two orders of magnitude longer to complete than the Least-Squares inversion.
As discussed earlier, the choice to use f-k analysis as the basis for determining the tremor source in this software was a deliberate one, as it is a widely used and well tested technique, and as a standard component of ObsPy it is easily and readily available.
Another advantage of using f-k analysis is that multiple simultaneous sources can theoretically be resolved, appearing as multiple peaks at different points in the slowness grid. An example of analysis using RETREAT where there are multiple simultaneous sources is shown in Figure 9, where 2.5 h of data from September 03, 2014 during the Bárðarbunga eruption, using the same UR array as previously, are shown. In this example, the tremor source attributed to the shallow sub-glacial dyke to the south-east of the array is still visible, but a second source to the north-east, corresponding to lava flows and fountaining at the surface, also appears from around 20:45 UTC and becomes the dominant source from 21:30 onwards (see Eibl et al. (2017a) for more details of multiple simultaneous tremor sources during this eruption).
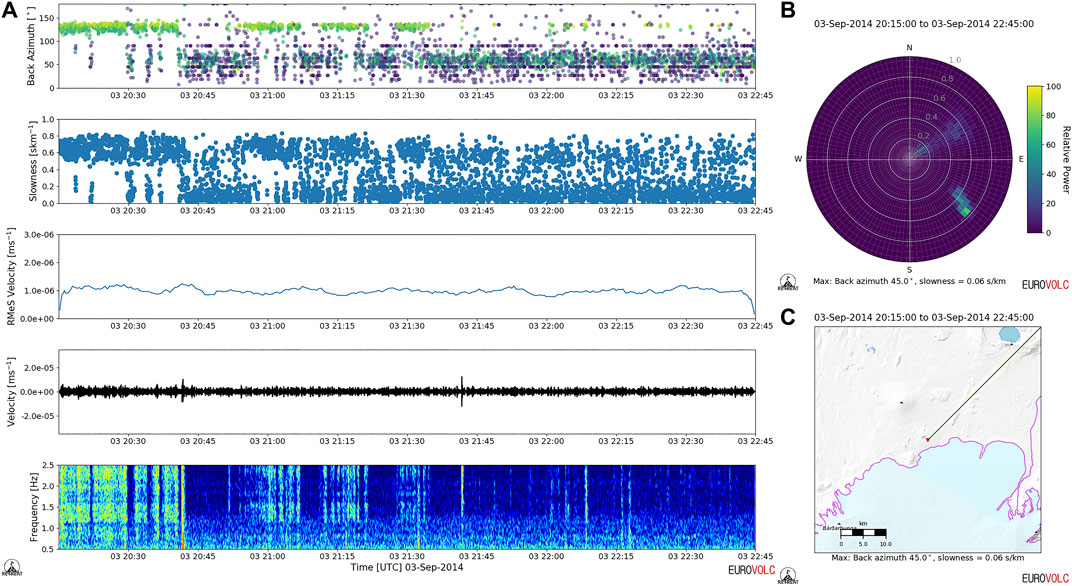
FIGURE 9. Output figures produced by the RETREAT software that illustrate its capacity to analyze time periods containing multiple tremor sources. (A) Time series of slowness and backazimuth calculated from f-k analysis, alongside the seismic waveform, envelope and spectrogram showing a switch from one dominant source to another during this time period. (B) A polar representation of the array processing results, with the histogram highlighting the two tremor sources to the north-east and south-east of the array. Also shown is (C) a map of the area surrounding the UR array, with the azimuth of the more dominant source, associated with lava flows at the surface, overlaid.
However, this analysis is not strictly utilizing a unique capacity of the f-k technique, as identification of the two sources arises from visualization of the data in the timeseries and histogram, where single values for the slowness and azimuth returned for each sub-window, derived from choosing a single peak (corresponding to the maximum power) in the slowness grid, are not averaged out, but appear as distinct separate sources. A modified version of the f-k analysis routine could therefore be developed to search for and choose multiple peaks in power from the slowness grid, and while this moves away from using the standard version supplied with ObsPy, it could prove a useful addition in complex areas with multiple potential sources of tremor. But whether this offers a sufficient advantage over the current capabilities, as shown in Figure 9, would need to be tested. One obvious disadvantage of using the f-k method is that by searching over a grid it is not optimally efficient, particularly for infrasonic data, and may struggle to produce results in real-time for large datasets.
In addition to the f-k analysis, the software could be extended with further or alternative methods for beamforming and tremor location. As described above, a Least-Squares inversion beamforming method has already been implemented, with particular applications for infrasound array data in mind. The advantages of this method are that it gives faster results (important for real-time analysis) and also direct error and uncertainty estimates, but at the cost of assuming a single plane-wave (and hence single source) in the time window analyzed. It is intended mainly for infrasonic data as further testing and benchmarking would be required to fully compare the performance of the two methods for a variety of seismic datasets.
Besides the two beamforming methods already implemented in this software, other approaches for locating and analyzing tremor signals that could be developed and integrated into RETREAT are:
- Three-component beamforming (e.g., Löer et al., 2018), which can help to identify the types of waves arriving at the array by providing information on the polarization of the wavefield. This, alongside the location from more traditional beamforming approaches, could help place further constraints on the characteristics of the tremor source.
- Improvements on the least-squares inversion method by using more robust estimators (e.g., Bishop et al. (2020)) that can handle outliers, such as timing or polarity errors.
- Amplitude Source Location (ASL) or other amplitude based methods (e.g., Battaglia et al., 2005; Taisne et al., 2011; Morioka et al., 2017) that use amplitudes at different stations or radiated seismic intensity ratios to determine the source location.
- Back-projection methods (e.g., Haney, 2014; Li et al., 2017) which use time-reversal to refocus energy at the location of the source.
The latter two techniques in particular could well be useful complements and would provide powerful additional constraints on the tremor location and dynamics when used in conjunction with array-based beamforming methods. However, such methods generally require a more distributed seismic network, with the source inside the network, and are hence moving beyond the scope of this initial version of the RETREAT tool that is specifically focused on arrays and real-time array data.
Due to the inherent nature of the signals and often sparse monitoring networks, accurate tracking of volcanic tremor sources is a challenging task. Seismic arrays, however, are a powerful additional tool that can provide unique insights into the source dynamics of volcanic tremor at active volcanoes.
In this manuscript we have introduced RETREAT, a python-based software tool that utilizes existing routines from the open-source ObsPy framework to carry out analysis of seismic array data in real-time by performing either f-k analysis, or optionally Least-Squares beamforming, to determine the back azimuth that points toward the source. Although RETREAT has been designed for deployment as part of volcano monitoring systems and provides the ability to track tremor sources in real-time, it also has the capability to analyze existing datasets for testing, comparison and research purposes.
These abilities have been demonstrated using real-time data from the small aperture SPITS seismic array in Spitsbergen, Svalbard, as well as on archive data from an array deployed during the 2014–2015 eruption of Bárðarbunga volcano in Iceland.
While primarily intended as a tool for utilizing seismic array data to locate and track volcanic tremor, RETREAT also has the capability to analyze infrasonic array data to track acoustic sources, and has been successfully tested on and applied to data from two infrasound arrays deployed close to the summit of Mt. Etna, Italy, in 2019.
We suggest that the implementation of real-time software applications such as RETREAT is crucial to fully exploit the power of seismic arrays as a volcano monitoring tool and to improve our ability to detect, monitor and understand unrest at active volcanoes.
RETREAT is available from a GitLab repository at https://git.dias.ie/paddy/retreat (Smith, 2020), and is compatible with Windows, Linux, and Apple operating systems. The repository includes configuration files for the specified examples in this paper, along with the accompanying waveform data for the archive example. See also Bean and Vogfjörd (2020) for more details on this dataset.
The software is freely available and is licensed under the open-source European Union Public Licence (EUPL), v1.2. More information is available in the LICENCE.txt file supplied with the distribution.
PS developed the RETREAT software package. Both authors contributed to the preparation of the manuscript.
The research leading to the development of the RETREAT software tool was carried out as part of the EUROVOLC project (https://eurovolc.eu) and received funding from the European Union’s Horizon 2020 research and innovation program under grant agreement No. 731070.
The authors declare that the research was conducted in the absence of any commercial or financial relationships that could be construed as a potential conflict of interest.
The authors wish to thank colleagues at DIAS for internal testing and review of the software and its documentation, as well as the two reviewers for their time in providing critical reading and suggestions which helped to improve both this manuscript and the software. The data used in the archive example were collected as part of the FUTUREVOLC project, which received funding from the European Union’s Seventh Program for research, technological development and demonstration under grant agreement No. 308377.
Allstadt, K. E., Matoza, R. S., Lockhart, A. B., Moran, S. C., Caplan-Auerbach, J., Haney, M. M., et al. (2018). Seismic and acoustic signatures of surficial mass movements at volcanoes. J. Volcanol. Geotherm. Res. 364, 76–106. doi:10.1016/j.jvolgeores.2018.09.007
Almendros, J., Ibáñez, J. M., Alguacil, G., Del Pezzo, E., and Ortiz, R. (1997). Array tracking of the volcanic tremor source at Deception Island, Antarctica. Geophys. Res. Lett. 24 (23), 3069–3072. doi:10.1029/97GL03096
Battaglia, J., Aki, K., and Ferrazzini, V. (2005). Location of tremor sources and estimation of lava output using tremor source amplitude on the Piton de la Fournaise volcano: 1. location of tremor sources. J. Volcanol. Geoth. Res. 147 (3), 268–290. doi:10.1016/j.jvolgeores.2005.04.005
Bean, C. J., and Vogfjörd, K. S. (2020). Seismic array data for monitoring and tracking tremor sources during subglacial floods and volcanic eruptions at Vatnajökull (Vatna Glacier), Iceland. GFZ Data Services.. doi:10.14470/0Y7568667884
Beroza, G. C., and Ide, S. (2011). Slow earthquakes and nonvolcanic tremor. Annu. Rev. Earth Planet Sci. 39 (1), 271–296. doi:10.1146/annurev-earth-040809-152531
Beyreuther, M., Barsch, R., Krischer, L., Megies, T., Behr, Y., and Wassermann, J. (2010). ObsPy: a Python toolbox for seismology. Seismol Res. Lett. 81 (3), 530–533. doi:10.1785/gssrl.81.3.530
Bishop, J. W., Fee, D., and Szuberla, C. A. L. (2020). Improved infrasound array processing with robust estimators. Geophys. J. Int. 221 (3), 2058–2074. doi:10.1093/gji/ggaa110
Capon, J., and Bolt, B. A. (1973). “Signal processing and frequency-wavenumber spectrum analysis for a large aperture seismic array,” in Methods in computational physics (Amsterdam, Netherlands: Elsevier), 13, 1–59.
Chouet, B. A. (1996). “New methods and future trends in seismological volcano monitoring,” in Monitoring and mitigation of volcano hazards. Editors R. Scarpa, and R.I. Tilling,(Berlin, Heidelberg: Springer Berlin Heidelberg), 23–97.
Coombs, M. L., Wech, A. G., Haney, M. M., Lyons, J. J., Schneider, D. J., Schwaiger, H. F., et al. (2018). Short-term forecasting and detection of explosions during the 2016–2017 eruption of bogoslof volcano, Alaska. Front. Earth Sci. 6, 122. doi:10.3389/feart.2018.00122
De Angelis, S., Haney, M. M., Lyons, J. J., Wech, A., Fee, D., Diaz-Moreno, A., et al. (2020). Uncertainty in detection of volcanic activity using infrasound arrays: examples from Mt. Etna, Italy. Front. Earth Sci. 8, 169. doi:10.3389/feart.2020.00169
Di Lieto, B., Saccorotti, G., Zuccarello, L., Rocca, M. L., and Scarpa, R. (2007). Continuous tracking of volcanic tremor at Mount Etna, Italy. Geophys. J. Int. 169 (2), 699–705. doi:10.1111/j.1365-246X.2007.03316.x
Eibl, E. P. S., Bean, C. J., Einarsson, B., Pàlsson, F., and Vogfjörd, K. S. (2020). Seismic ground vibrations give advanced early-warning of subglacial floods. Nat. Commun. 11 (1), 2504. doi:10.1038/s41467-020-15744-5
Eibl, E. P. S., Bean, C. J., Jónsdóttir, I., Höskuldsson, A., Thordarson, T., Coppola, D., et al. (2017a). Multiple coincident eruptive seismic tremor sources during the 2014-2015 eruption at Holuhraun, Iceland. J. Geophys. Res. Solid Earth. 122 (4), 2972–2987. doi:10.1002/2016jb013892
Eibl, E. P. S., Bean, C. J., Vogfjörd, K. S., Ying, Y., Lokmer, I., Möllhoff, M., et al. (2017b). Tremor-rich shallow dyke formation followed by silent magma flow at Bárðarbunga in Iceland. Nat. Geosci. 10 (4), 299–304. doi:10.1038/ngeo2906
Elson, P., de Andrade, E. S., Hattersley, R., Campbell, E., May, R., Dawson, A., et al. (2020). SciTools/cartopy. Cartopy. doi:10.5281/zenodo.3783894
Fee, D., and Matoza, R. S. (2013). An overview of volcano infrasound: from Hawaiian to Plinian, local to global. J. Volcanol. Geotherm. Res. 249, 123–139. doi:10.1016/j.jvolgeores.2012.09.002
Gibbons, S. J. (2006). On the identification and documentation of timing errors: an example at the KBS station, spitsbergen. Seismol Res. Lett. 77 (5), 559–571. doi:10.1785/gssrl.77.5.559
Gibbons, S. J., Schweitzer, J., Ringdal, F., Kvaerna, T., Mykkeltveit, S., and Paulsen, B. (2011). Improvements to seismic monitoring of the European Arctic using three-component array processing at SPITS. Bull. Seismol. Soc. Am. 101 (6), 2737–2754. doi:10.1785/0120110109
Haney, M. M. (2014). Backprojection of volcanic tremor. Geophys. Res. Lett. 41 (6), 1923–1928. doi:10.1002/2013GL058836
Haney, M. M., Van Eaton, A. R., Lyons, J. J., Kramer, R. L., Fee, D., and Iezzi, A. M. (2018). Volcanic thunder from explosive eruptions at bogoslof volcano, Alaska. Geophys. Res. Lett. 45 (8), 3429–3435. doi:10.1002/2017GL076911
Hellweg, M. (2000). Physical models for the source of Lascar’s harmonic tremor. J. Volcanol. Geotherm. Res. 101 (1), 183–198. doi:10.1016/s0377-0273(00)00163-3
Hunter, J. D. (2007). Matplotlib: a 2D graphics environment. Comput. Sci. Eng. 9 (3), 90–95. doi:10.1109/mcse.2007.55
Jellinek, A. M., and Bercovici, D. (2011). Seismic tremors and magma wagging during explosive volcanism. Nature 470 (7335), 522–525. doi:10.1038/nature09828
Julian, B. R. (1994). Volcanic tremor: nonlinear excitation by fluid flow. J. Geophys. Res. 99 (B6), 11859–11877. doi:10.1029/93JB03129
Kumagai, H., Palacios, P., Maeda, T., Castillo, D. B., and Nakano, M. (2009). Seismic tracking of lahars using tremor signals. J. Volcanol. Geotherm. Res. 183 (1), 112–121. doi:10.1016/j.jvolgeores.2009.03.010
La Rocca, M., Galluzzo, D., Malone, S., McCausland, W., Saccorotti, G., and Del Pezzo, E. (2008). Testing small-aperture array analysis on well-located earthquakes, and application to the location of deep tremor. Bull. Seismol. Soc. Am. 98 (2), 620–635. doi:10.1785/0120060185
Li, K. L., Sadeghisorkhani, H., Sgattoni, G., Gudmundsson, O., and Roberts, R. (2017). Locating tremor using stacked products of correlations. Geophys. Res. Lett. 44 (7), 3156–3164. doi:10.1002/2016GL072272
Löer, K., Riahi, N., and Saenger, E. H. (2018). Three-component ambient noise beamforming in the Parkfield area. Geophys. J. Int. 213 (3), 1478–1491. doi:10.1093/gji/ggy058
McNutt, S. R., Thompson, G., Johnson, J., Angelis, S. D., and Fee, D. (2015). “Chapter 63—seismic and infrasonic monitoring,” in The encyclopedia of volcanoes. 2nd Edn, Editor H. Sigurdsson (Amsterdam, Netherlands: Academic Press), 1071–1099.
Megies, T., Beyreuther, M., Barsch, R., Krischer, L., and Wassermann, J. (2011). ObsPy—what can it do for data centers and observatories? Ann. Geophys. 54 (1), 47–58. doi:10.4401/ag-4838
Morioka, H., Kumagai, H., and Maeda, T. (2017). Theoretical basis of the amplitude source location method for volcano-seismic signals. J. Geophys. Res. Solid Earth. 122 (8), 6538–6551. doi:10.1002/2017JB013997
Olson, J. V., and Szuberla, C. A. L. (2005). Distribution of wave packet sizes in microbarom wave trains observed in Alaska. J. Acoust. Soc. Am. 117 (3), 1032–1037. doi:10.1121/1.1854651
PySimpleGUI.org (2020). PySimpleGUI, GitHub. Available at: https://github.com/PySimpleGUI/PySimpleGUI (Accessed June, 2020).
Ripepe, M., and Marchetti, E. (2002). Array tracking of infrasonic sources at Stromboli volcano. Geophys. Res. Lett. 29 (22), 33–34. doi:10.1029/2002GL015452
Ripepe, M., Marchetti, E., Delle Donne, D., Genco, R., Innocenti, L., Lacanna, G., et al. (2018). Infrasonic early warning system for explosive eruptions. J. Geophys. Res. Solid Earth. 123 (11), 9570–9585. doi:10.1029/2018JB015561
Rost, S., and Thomas, C. (2002). Array seismology: methods and applications. Rev. Geophys. 40 (3), 2-1–2-27. doi:10.1029/2000rg000100
Schweitzer, J., Fyen, J., Mykkeltveit, S., Gibbons, S. J., Pirli, M., Kühn, D., et al. (2012). “Seismic arrays,” in New manual of seismological observatory practice 2 (NMSOP-2). Editor P. Bormann (Potsdam, Brandenburg: Deutsches GeoForschungsZentrum GFZ), 1–80.
Sigmundsson, F., Hooper, A., Hreinsdóttir, S., Vogfjörd, K. S., Ófeigsson, B. G., Heimisson, E. R., et al. (2015). Segmented lateral dyke growth in a rifting event at Bárðarbunga volcanic system, Iceland. Nature 517 (7533), 191–195. doi:10.1038/nature14111
Smith, P. (2020). Retreat—a REal-time TREmor analysis tool. Zenodo. doi:10.1109/rams48030.2020.9153706 Available at: http://dx.doi.org/10.5281/zenodo.3820867
Sparks, R. S. J., Biggs, J., and Neuberg, J. W. (2012). Monitoring volcanoes. Science 335, 1310–1311. doi:10.1126/science.1219485
Taisne, B., Brenguier, F., Shapiro, N. M., and Ferrazzini, V. (2011). Imaging the dynamics of magma propagation using radiated seismic intensity. Geophys. Res. Lett. 38 (4). doi:10.1029/2010GL046068
The ObsPy Development Team (2020a). Beamforming—FK Analysis [Online]. Available at: https://docs.obspy.org/tutorial/code_snippets/beamforming_fk_analysis.html (Accessed June 01, 2020).
Vogfjörd, K. S., Puglisi, G., and Sigmundsson, F. (2019). Eurovolc—a European network of observatories and research infrastructures for volcanology. Geophys. Res. Abstr. 21, 11920.
Wassermann, J. (2012). “Volcano seismology,” in New manual of seismological observatory practice 2 (NMSOP-2). Editor. P. Bormann (Potsdam, Brandenburg: Deutsches GeoForschungsZentrum GFZ), 1–77.
Keywords: volcano seismology, software, volcanic tremor, seismic arrays, real-time monitoring, infrasound arrays
Citation: Smith PJ and Bean CJ (2020) RETREAT: A REal-Time TREmor Analysis Tool for Seismic Arrays, With Applications for Volcano Monitoring. Front. Earth Sci. 8:586955. doi: 10.3389/feart.2020.586955
Received: 24 July 2020; Accepted: 16 October 2020;
Published: 11 November 2020.
Edited by:
Luigi Passarelli, King Abdullah University of Science and Technology, Saudi ArabiaReviewed by:
Eisuke Fujita, National Research Institute for Earth Science and Disaster Resilience (NIED), JapanCopyright © 2020 Smith and Bean. This is an open-access article distributed under the terms of the Creative Commons Attribution License (CC BY). The use, distribution or reproduction in other forums is permitted, provided the original author(s) and the copyright owner(s) are credited and that the original publication in this journal is cited, in accordance with accepted academic practice. No use, distribution or reproduction is permitted which does not comply with these terms.
*Correspondence: Patrick J. Smith, cHNtaXRoQGNwLmRpYXMuaWU=
Disclaimer: All claims expressed in this article are solely those of the authors and do not necessarily represent those of their affiliated organizations, or those of the publisher, the editors and the reviewers. Any product that may be evaluated in this article or claim that may be made by its manufacturer is not guaranteed or endorsed by the publisher.
Research integrity at Frontiers

Learn more about the work of our research integrity team to safeguard the quality of each article we publish.