- 1Global Ocean Observation Research Center, Japan Agency for Marine-Earth Science and Technology (JAMSTEC), Yokosuka, Japan
- 2Disaster Prevention Research Institute, Kyoto University, Kyoto, Japan
- 3Research and Development Center for Earthquake and Tsunami Forecasting, JAMSTEC, Yokohama, Japan
- 4Faculty of Environmental Earth Science, Hokkaido University, Sapporo, Japan
- 5Graduate School of Science, Tohoku University, Sendai, Japan
- 6Earthquake Research Institute, The University of Tokyo, Tokyo, Japan
The Kuroshio takes a greatly southward displaced path called a large-meander (LM) path off the southern coast of Japan on interannual to decadal time scales. The transition of the current path from a non-large-meander path to an LM path is the most salient ocean current variation south of Japan. The change in pressure on the seafloor due to the formation of the LM path in September 2017 is of critical importance to understand the dynamics of the LM path and to distinguish the change due to the Kuroshio path variation from changes due to crustal deformation. Hence, we examined the seafloor pressure across the continental slope off the eastern coast of Kyushu for the period March 2014 to April 2019. The pressure and its cross-slope gradient over the continental slope shallower than 3,000 m beneath near the Kuroshio are invariable. As a mesoscale current path disturbance, called a small meander, passed over the observation stations, the pressure decreased by approximately 0.1 dbar on the continental slope deeper than 3000 m and was kept low until the end of the observation period (April 2019). The pressure decrease is consistent with the changes in sea surface height and subsurface water density and is caused by the baroclinic enhancement of the Shikoku Basin local recirculation. This seafloor pressure change implies a strengthening of the deep southwestward current, possibly as a part of a deep cyclonic circulation in the Shikoku Basin. The present study demonstrated that, in addition to altimetric sea surface height data, hydrographic data are useful to distinguish the ocean variation in seafloor pressure from the variation due to crustal deformation, and vice versa.
1 Introduction
Winds blowing over the whole subtropical North Pacific drive a basin-scale anticyclonic circulation, which is referred as the North Pacific subtropical gyre. Because of the combined effect of the Earth’s rotation and curvature, so-called the β-effect, the subtropical gyre current is concentrated on the western boundary of the basin, forming the western boundary current, i.e., the Kuroshio (e.g., Stommel, 1948; Munk, 1950; Pedlosky, 1996). The Kuroshio originates in the region to the east of the Philippines. It then flows northeastward in the East China Sea, and after passing the Tokara Strait, proceeds eastward in the region south of Japan (e.g., Nitani, 1972). Since the Kuroshio transports a huge amount of heat and materials northward, the variations in the Kuroshio have great influence on the global climate (e.g., Latif and Barnett, 1994; Kuwano-Yoshida and Minobe, 2017), fisheries (e.g., Tian et al., 2014; Kobari et al., 2020), and so on.
Furthermore, the variations of the Kuroshio flowing over the Nankai Trough, where the Philippine Sea Plate subducts beneath the Eurasia Plate and the seismic activity is particularly high (e.g., Ando, 1975; Ishibashi, 2004), are of great concern for seismologists to monitor the change in pressure on the seafloor due to crustal deformation caused by slow slip events (e.g., Schwartz and Rokosky, 2007) by using data collected by ocean bottom pressure gauges (OBPs) (e.g., Ariyoshi et al., 2014; Suzuki et al., 2016). The durations of slow slip events are days to years (e.g., Schwartz and Rokosky, 2007), which are similar to the timescales of the variations of the Kuroshio (Kawabe, 1987). To distinguish the seafloor pressure change due to crustal deformation from that related to the Kuroshio variation, it should be essential to reveal the characteristics of the seafloor pressure variations related to the Kuroshio.
It is well-known that to the south of Japan, the Kuroshio follows either of two types of paths: large-meander (LM) and non-large-meander (NLM) paths (Figure 1) (Yoshida, 1964; Taft, 1972; Kawabe, 1985; Kawabe, 1995). The LM path is located relatively offshore and is associated with a cyclonic eddy south of Japan (Taft, 1972; Kawabe, 1985), whereas the NLM path is located near the coast to the west of the Kii Peninsula and takes nearshore NLM (nNLM) or offshore NLM (oNLM) paths from the south of the Kii Peninsula to the Izu-Ogasawara Ridge (Kawabe, 1985; Kawabe, 1995). The transitions from the NLM path to the LM path are preceded by the occurrences of mesoscale current path disturbances, called small meanders, southeast of Kyushu and their developments (e.g., Shoji, 1972; Nagano and Kawabe, 2004).
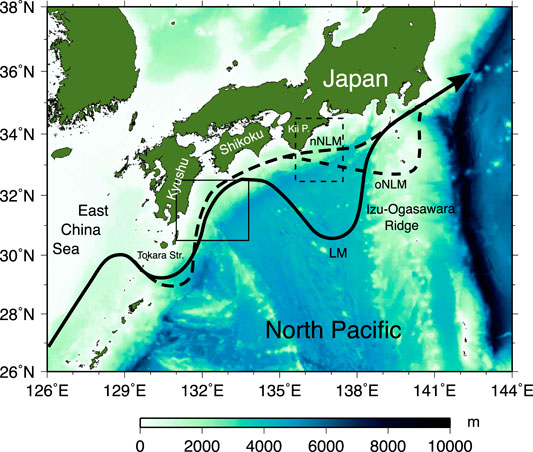
FIGURE 1. Schematic diagram of the Kuroshio south of Japan with bottom topography. Solid and dashed lines show large-meander (LM) and offshore non-large-meander (oNLM) and nearshore non-large-meander (oNLM) paths, respectively. Ocean bottom pressure gauges (OBPs) were deployed in the regions east of Kyushu (solid square) and southeast of the Kii Peninsula (dashed square).
Nagano et al. (2019) reported that the LM paths from 1981 to 1984 and from 2017 to the present have characteristics different from other past LM paths. The peculiarity of the 1981–1984 LM path had been reported by Kawabe (2005). Nagano et al. (2019) called the LM paths except for the 1981–1984 and 2017–present LM paths the stable type. The stable-type LM path is formed from the nNLM path through the development of a small meander (e.g., Kawabe, 1986; Kawabe, 1995; Nagano et al., 2013; Nagano et al., 2018). The development of the small meander is caused by the baroclinic instability of the small meander eddy in association with the forward-shifted (eastward-shifted) deep cyclonic eddy (Nagano et al., 2018). While the Kuroshio takes the LM path of this type, the current path is quite stable to the west of the Izu-Ogasawara Ridge as in the case of the 2004–2005 LM path.
Meanwhile, the 1981–1984 and 2017–present LM paths are called the unstable type by Nagano et al. (2019). The unstable-type LM path is formed from the oNLM path after the coalescence of the small meander eddy with a cyclonic eddy east of the Kii Peninsula (Kawabe, 2005; Nagano et al., 2019). The formation of the unstable-type LM path is not attributed to the baroclinic instability of the deep eddy (Nagano et al., 2019). The large meander of the unstable type has a greater zonal scale than that of the stable type and protrudes from the eastern boundary of the Shikoku Basin (Nagano et al., 2019). The LM path of this type is accompanied by fluctuations on the timescale of months, so that the sea levels at Miyake-jima and Hachijo-jima Islands are greatly variable.
The characteristics of the stable- and unstable-type LM paths are attributed to differences in the deep current structure, but these differences are unidentifiable from sea surface observations by tide gauges and satellites. Temporal changes in deep current velocity have been conventionally observed by current meters installed to mooring lines; such observations were made by Taft (1978); Taira and Teramoto (1985); Fukasawa and Teramoto (1986), and others. However, because of the present active fishing operations around Japan, there are concerns that subsurface mooring systems be damaged or destroyed by vandalism, and hence, such long-term mooring observations are now impracticable. On the other hand, deployment of platform equipped with instruments on the seabed is feasible even in the Kuroshio region around Japan. Around the Nankai Trough, megathrust earthquakes have repeatedly occurred at intervals of approximately 100–150 years (Ando, 1975; Ishibashi, 2004). Because the latest megathrust earthquake occurred approximately 70 years ago, the next devastating earthquake is anticipated to occur in the near future (Nakano et al., 2018). Therefore, in addition to seismometers, many OBPs have been deployed on the seabed to monitor earthquakes and tsunamis around the trough slope off the southern coast of Japan.
Besides current velocity, hydrostatic pressure is a fundamental parameter for understanding the physical mechanisms of ocean current variations (e.g., Gill, 1982). Seafloor pressure, in particular, is a quantity that is integrated from the sea surface to the bottom, and therefore, retains useful information on variations in sea surface height (SSH) and water density from the sea surface to the bottom. Because ocean circulation currents are mostly in geostrophic balance, the variations of the deep currents are linked to the variations in seafloor pressure. In addition, the Kuroshio is considered strongly affected by the steep continental-side slopes of the Nankai Trough; Nagano et al. (2013) reported that the offshore border of the Kuroshio and the bathymetric contour of 4000 m are coincident. The effects of the bottom topography on the Kuroshio will be revealed from an examination of the seafloor pressure variations.
Nagano et al. (2018) examined the seafloor pressure change in the region south of Shikoku associated with the 2004–2005 LM path of the Kuroshio, a stable-type LM path. They demonstrated that after the eastward propagation of a deep cyclonic eddy leading to the small meander propagation, the deep Kuroshio current was enhanced in the LM period. The enhancement of the deep Kuroshio current indicates the strengthening of the vertically uniform flow component of the Kuroshio, which has a tendency to follow the isobaths of the continental slope because of potential vorticity conservation (e.g., Cushman-Roisin and Beckers, 2011). Hence, the stability of the stable-type LM path is attributed to the enhancement of the topographic steering of the current due to the strengthened deep Kuroshio current.
A small meander of the Kuroshio occurred to the southeast of Kyushu in February 2017, propagated to the south of the Kii Peninsula, and was coalesced with a cyclonic eddy east of the Kii Peninsula in August 2017. The meander trough of the Kuroshio began to stay just to the east of the Izu-Ogasawara Ridge in early September (i.e., the onset of the LM path) and, then, the sea level difference between Kushimoto and Uragami, the index of the LM path, became stable and small (Nagano et al., 2019). The LM path is active at present as of November 2020 although the cyclonic LM eddy has been separated from the Kuroshio. It is unknown whether or not the unstable-type LM path of the Kuroshio is associated with the substantial deep current following the isobaths of the continental slope and is influenced by the topographic steering. The OBP observation during the unstable-type LM period will reveal how seafloor pressure changes by the LM formation. In addition, the mechanism may be inferred using the OBP data along with hydrographic data as revealed from acoustic data (Nagano et al., 2018) and in situ hydrographic data (Hasegawa et al., 2019). Further, knowledge on the seafloor pressure changes due to variations in the Kuroshio will help distinguish these changes from the seafloor pressure variation due to crustal deformation.
In this study, we analyzed the variations in seafloor pressure across the Kuroshio from March 2014 to April 2019 to reveal the characteristics of seafloor pressure changes off the eastern coast of Kyushu in association with the formation of the 2017–present LM path of the Kuroshio. During the whole observation period, no significant crustal deformation was observed; hence, this observation is favorable for obtaining information on the influence of the Kuroshio current variations on seafloor pressure in advance to distinguish them from the variations due to crustal deformation. Consequently, we found a seafloor pressure change related to the formation of the LM path. In addition, by using altimetric SSH and hydrographic data collected during the period 2017–2019, we revealed that the seafloor pressure change is attributable to the change of the vertical water density distribution associated with the formation of the LM path and demonstrated that hydrographic data in combination with SSH data are useful to identify the seafloor pressure variation due to the Kuroshio variation and to distinguish it from the variation due to crustal deformation.
2 Observations and Data
2.1 OBP Data
As described by Nagano et al. (2019), the OBP observation off the eastern coast of Kyushu was initiated on March 12, 2014. Until now, the OBPs have been replaced five times (Table 1). Figures 2A, 3 show the locations and periods of the OBP observations east of Kyushu of which we analyzed the data in this study, respectively. We used the OBP data in the first to fourth observation periods collected at the sites indicated by an open circle in Figure 2A (the first three observation periods) and a triangle (the fourth observation period). In the fifth observation period, the OBP data were obtained at stations crossing the slope from P1 to P4 indicated by crosses. Each OBP was equipped with a digiquartz pressure transducer (Models 8B4000-2 and 8B7000-2) manufactured by Paroscientific, Inc., Redmond, USA. The accuracy and resolution of the sensors were 0.01% of the full-scale range and 10 ppb, respectively (Houston and Paros, 1998). After taking into account the maximum pressure in the observations, the absolute accuracies for the fourth observation period and other observation periods were 0.04 and 0.07 dbar, respectively.

TABLE 1. Locations and water depths (m) of the OBP stations, and regression coefficients A (
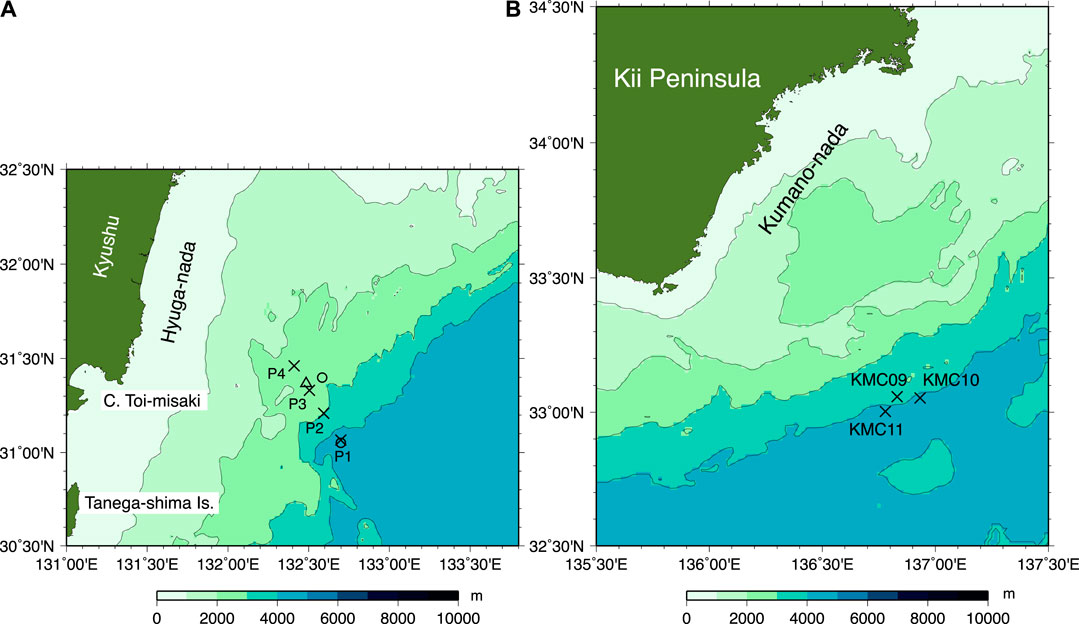
FIGURE 2. (A) Locations of ocean bottom pressure gauges (OBPs) deployed in the solid square shown in Fig. 1. Open circles, a triangle, and crosses show the OBP sites in the first three observation periods, fourth observation period, and fifth observation period, respectively (Table 1). (B) Locations of OBP stations KMC09, KMC10, and KMC11 (crosses) of the Dense Oceanfloor Network system for Earthquakes and Tsunamis (DONET) off the southeastern coast of the Kii Peninsula in the dashed square shown in Figure 1. Contour intervals of the bottom topography are 1000 m.

FIGURE 3. First to fifth observation periods at OBP stations P1, P2, P3, and P4 listed in Table 1.
The OBP data are known to include substantial sensor drifts in some cases. In the present data, substantial sensor drifts are included, as shown for the data in the fifth observation period by solid thin lines in Supplementary Figure S1. Accordingly, following to Watts and Kontoyiannis (1990); Polster et al. (2009); Nagano et al. (2018); Hasegawa et al. (2019); Nagano et al. (2019) we estimated the sensor drift
where t is time (days). Thus, we obtained the coefficients A, B, C, and D (Table 1). The coefficients for the data in the fifth observation period are comparable to those in the first four observation periods estimated by Nagano et al. (2019). Then, the sensor drifts (as shown for the fifth observation period by solid thick lines in Supplementary Figure S1) were removed from the OBP data. Further, we suppressed tidal variations by using the tide-eliminating filter of Thompson (1983) and calculated the daily mean values in dbar. Assuming a Gaussian error distribution, the errors of the daily mean values are less than approximately 0.002 dbar. These values are smaller than the natural range of variation (>0.05 dbar) (Figure 4).
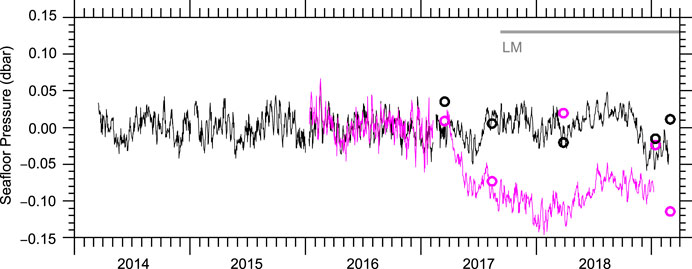
FIGURE 4. Variations in OBP-measured seafloor pressure at stations P1 (magenta lines) and P3 (black lines) and estimated seafloor pressure based on CTD/XCTD and altimetric SSH data at P1 (magenta open circles) and P3 (black open circles). The fifth time series (March 2017–January 2019) at P1 is shown after subtracting 0.086 dbar to connect with the time series until February 2017. For comparison with the OBP-measured time series, 1.05 dbar was added to the estimated pressure values. Gray horizontal line denotes the LM period.
The OBP stations in the first three (open circle) and fourth (triangle) observation periods were located within an approximate spatial scale of mesoscale disturbances of the Kuroshio current path, i.e., small meanders, from station P3 in the fifth observation period. Therefore, we combined the data of these stations into a single time series at P3 from March 2014 to March 2019 (black lines in Figure 4). Note that the time series until March 2017 at P3 is the same as that examined by Nagano et al. (2019). There seems to be no remarkable discontinuity of the seafloor pressure variation between the observation periods at P3.
The seafloor pressure time series data at station P1 were obtained in the third (an open circle in Figure 2) and fifth observation periods. seafloor pressure at P1 steeply decreased by ∼0.1 dbar within approximately 3 months after the deployment of the OBP in March 2017. A remarkable discontinuity of the seafloor pressure variation is present at P1 between the third and fifth observation periods. We subtracted the discrepancy between the ends of these time series (0.086 dbar) from the time series in the fifth observation period to connect them. Thus, we obtained the time series at P1 from January 2016 to January 2019 (magenta lines in Figure 4). As explained in Section 3.2, we estimated the seafloor pressure change at P1 from altimetric SSH and hydrographic data (described below in this section), and examined the validity of the OBP-measured pressure change by comparing them with each other. The estimated pressure decrease from March 17 to August 12, 2017 (0.08 dbar) (magenta open circles in Figure 4 and Table 2) is found to be coincident with the measured pressure decrease (magenta line in Figure 4). Also, a similar steep pressure decrease was observed at P2 after the deployment in March 2017. Therefore, the steep pressure decreases measured by the OBPs at P1 and P2 are considered to be caused not by sensor drifts but by the ocean variation.
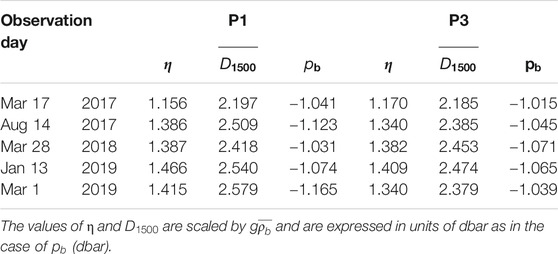
TABLE 2. Altimetric SSH η, geopotential distance
In addition, we used the OBP data from July to October 2017 at stations KMC09 (
2.2 Hydrographic Data
From 2017 to 2019, five sets of hydrographic observations were obtained at stations P1 to P4 (Figure 2) by using conductivity-temperature-depth (CTD) and expendable CTD (XCTD) profilers. In the March 2017, March 2018, January 2019, and March 2019 cruises, we obtained the vertical profiles of temperature and salinity down to depths greater than 1500 m by using XCTD-4 probes (Tsurumi-Seiki Co., Ltd., Yokohama, Japan). In the August 2017 cruise, temperature and salinity profiles were collected down to depths of approximately 2000 dbar by using a CTD SBE 911plus (Sea-Bird Electronics, Inc., Bellevue).
The nominal accuracies for CTD temperature and conductivity are 0.001°C and 0.0003 Sm−1, respectively, which is equivalent to 0.003 in practical salinity unit (psu). The differences between CTD and XCTD values are 0.05°C for temperature and 0.05 (psu) for salinity (Mizuno and Watanabe, 1998). It should be noted that, because XCTD probes have no pressure sensors, sensor depths are inferred from the fall rate and the inferred values can be biased. For CTD-4 probes, the depth bias is approximately 5 m (Tsurumi-Seiki Co., Ltd.).
2.3 Altimetric SSH Data
We used daily absolute SSH values from February 1, 2014 to March 31, 2019, which were obtained by adding the mean dynamic height topographic values (MDT_CNES-CLS13, Rio et al., 2011) to the Archiving, Validation and Interpretation of Satellite Oceanographic (AVISO) delayed-time updated mapped SSH anomaly data (AVISO, 2008). The SSH data are publicly available through the Copernicus Marine and Environment Monitoring Service (CMEMS).
3 Results and Discussion
3.1 Seafloor Pressure Change due to the Formation of the Kuroshio LM Path
Throughout the whole observation periods from 2014 to 2019, the most remarkable seafloor pressure change was observed at station P1 prior to the formation of the 2017–present LM path (Figure 4). Therefore, we focused on the seafloor pressure changes in the fifth observation period from March 2017 to April 2019. Figure 5 shows the daily mean anomaly in seafloor pressure across the continental slope to the east of Kyushu in this period. As shown in the SSH map for February 17, 2017 (Figure 6A), the Kuroshio current, indicated by a sharp SSH gradient between 80 and 120 cm, was located to the west of station P4 prior to the transition to the LM path. There exists a discontinuity of the pressure variations between stations P2 (Figure 5C) and P3 (Figure 5B). In particular, the steep pressure decrease of approximately 0.1 dbar from March to May 2017 was commonly observed at offshore stations P1 (Figure 5D) and P2 (Figure 5C) over the lower continental slope between depths of approximately 3000 and 4000 m.
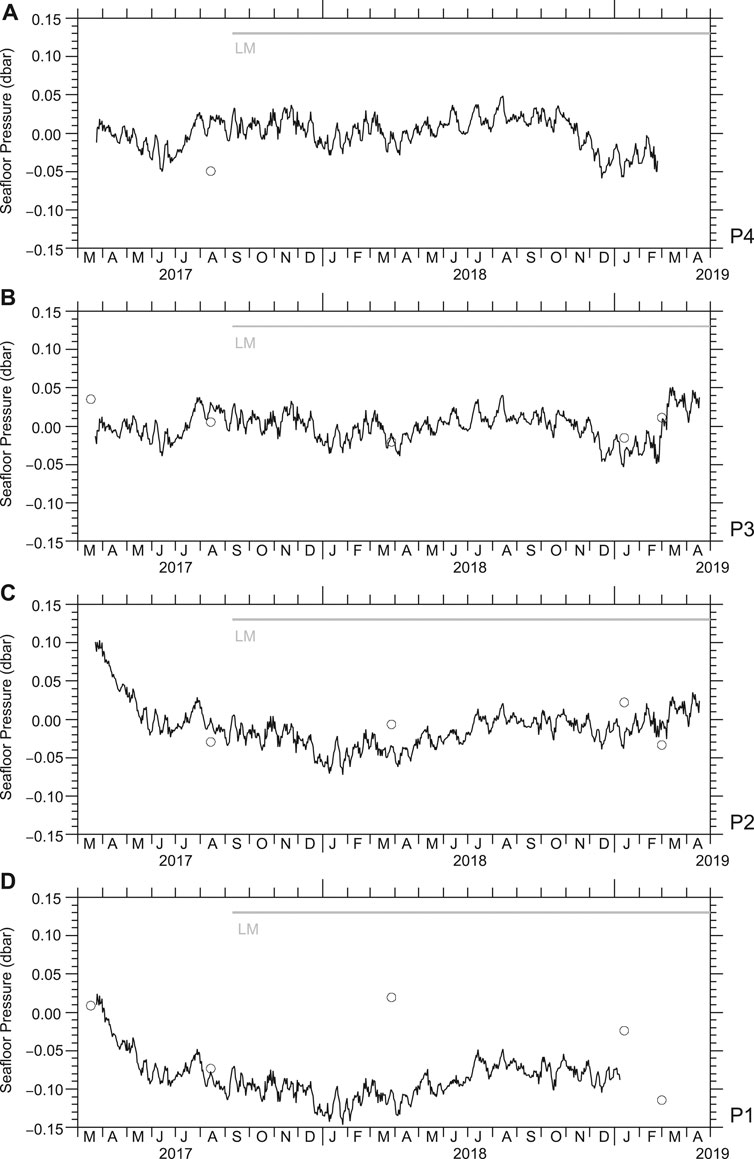
FIGURE 5. OBP-measured seafloor pressure variations from March 2017 to April 2019 (fifth observation period) at the OBP stations: (A) P4, (B) P3, (C) P2, and (D) P1 (solid thin lines); and seafloor pressure estimated from CTD/XCTD and altimetric SSH data (open circles). For comparison between the OBP-measured time series and estimated values, the estimated values are shown after adding 1.05 dbar, and OBP-measured pressure at P1 and P2 are shown after subtraction of 0.086 and 0.010 dbar, respectively. The Kuroshio LM period is denoted by the horizontal gray line.
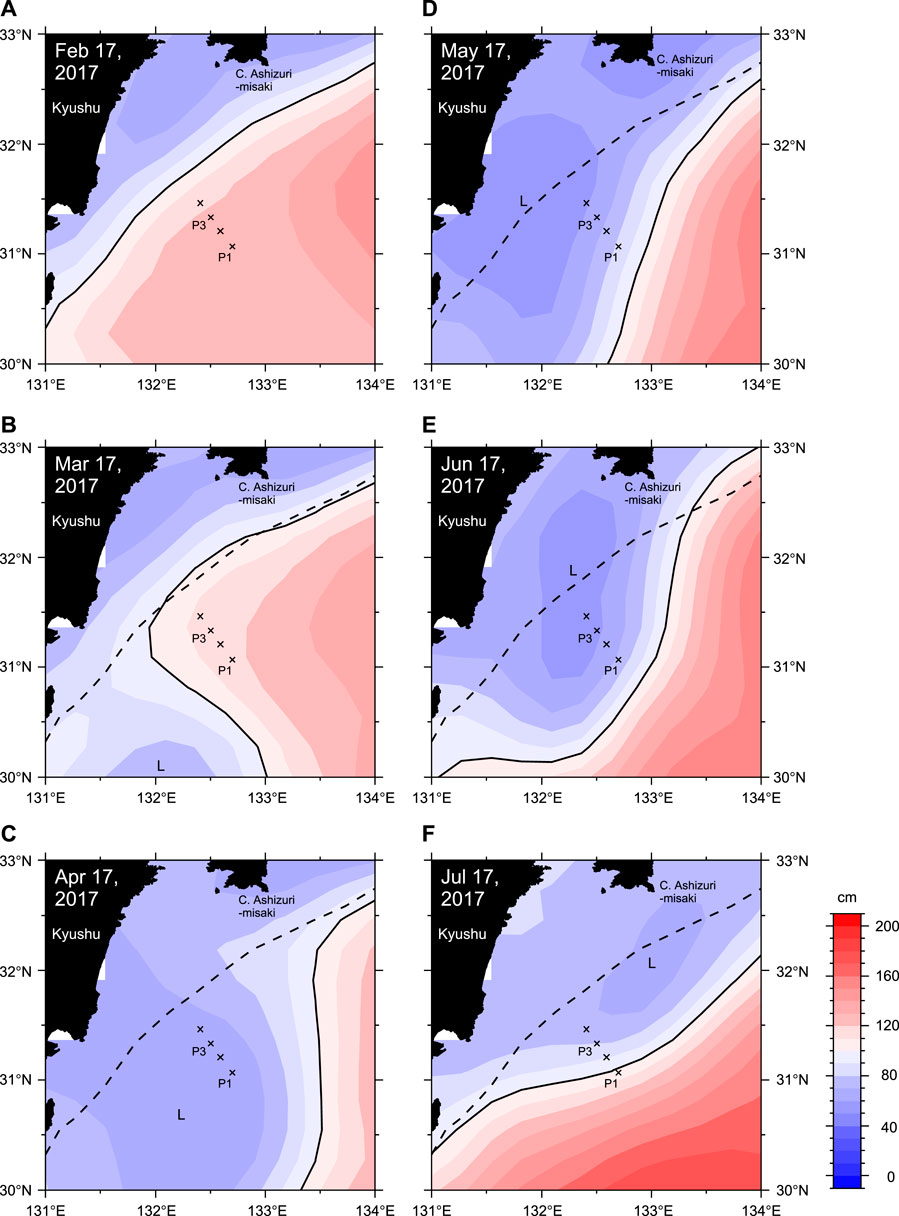
FIGURE 6. Maps of absolute SSH (cm) off the eastern coast of Kyushu from (A) February 17 to (E) July 17, 2017 every one month. Paths of the Kuroshio current, defined as 100 cm contours of daily SSH, are delineated by the black solid curves. The current path on February 17, 2017 is shown in panels (B) to (F) by the black dashed curve as a representative NLM path prior to the transition to the LM path. Crosses indicate the locations of the OBP sites. The SSH depression associated with the small meander is denoted by letter L.
During the period of the pressure decrease over the lower slope, SSH also varies in association with the northeastward propagation of a small meander, which brought about the LM path after coalesced with a cyclonic eddy off the eastern coast of the Kii Peninsula as reported by Nagano et al. (2019). Just before the decrease in pressure over the lower continental slope (March 2017), a negative SSH disturbance due to the small meander reached the south of the OBP stations (Figure 6B). Subsequently, as the small meander propagated northward in April, the SSH at the OBP sites decreased greatly (Figure 6C). SSH continued to be low until June (Figures 6D,E) and returned to higher values in August (Figure 7A). Meanwhile, the pressure over the lower slope was maintained low until the end of the OBP observation at least (Figures 5C,D).
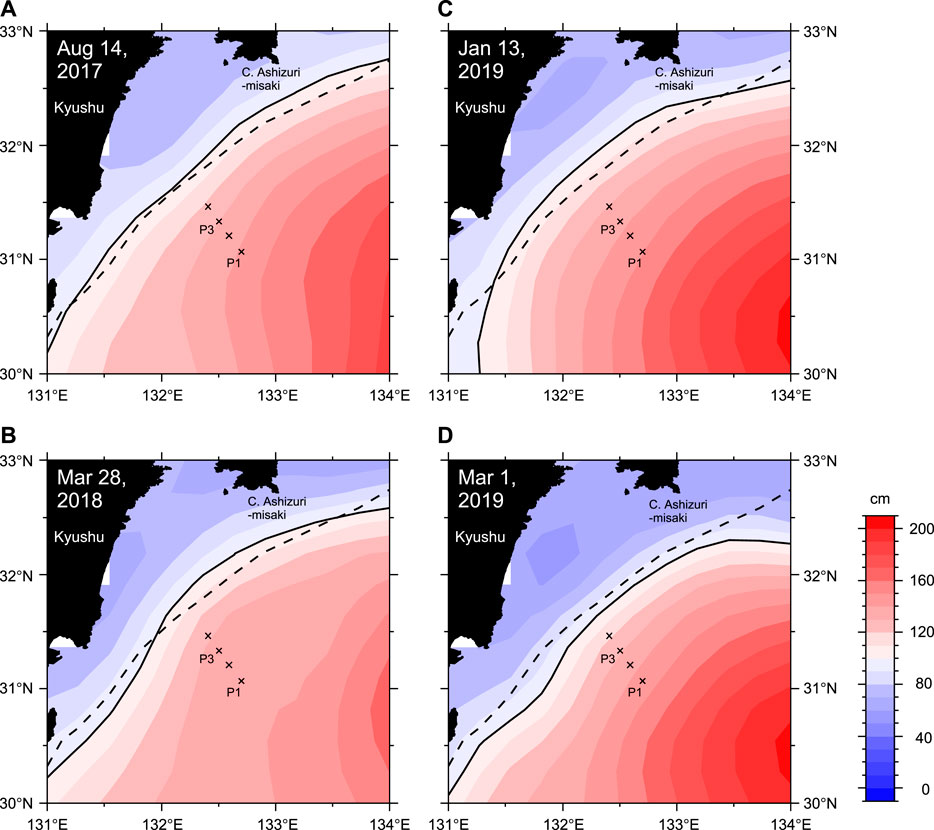
FIGURE 7. Same as in Fig. 6, but for (A) August 14, 2017, (B) March 28, 2018, (C) January 13, 2019, and (D) March 1, 2019.
At onshore stations P3 and P4 over the mid-continental slope, there was no remarkable pressure change though SSH greatly decreased by ∼50 cm from February 2017 over these stations in June (Figure 6E) and July (Figure 6F) 2017. This no remarkable seafloor pressure change in the formation of the unstable-type LM path is different from the fact that in association with a large seafloor pressure depression, the small meander developed to the stable-type 2004–2005 LM path through the baroclinic instability (Nagano et al., 2018). In fact, the SSH depression related to the formation of the 2017–present LM path has a peculiar horizontal structure in the June SSH map (Figure 6E); the area of the SSH depression i.e., the perturbation streamline, is “leaned” against the Kuroshio current so as to attenuate the onshore cyclonic shear, as illustrated for the case of anticyclonic shear current in Figure 7 of Pedlosky (1987). Judging from this horizontal structure of the SSH depression, the kinetic energy of the disturbance is likely derived from the kinetic energy of the Kuroshio current. In other words, the barotropic instability is effective for the moderate development of the disturbance. Numerical examinations by Nagano and Kawabe (2005) support the theory that the barotropic instability is effective in the initial stage of development of small meanders in the region southeast of Kyushu.
The cross-slope variation in seafloor pressure is indicative of the geostrophic deep current velocity variation in the direction parallel to the isobaths of the slope. Note that the temperature and salinity, and therefore, water density below the main pycnocline are quite uniform and do not change greatly during the study period. To evaluate the geostrophic current velocity based on seafloor pressure gradient between two neighboring OBP stations with different depths, we assumed that the pressure variation above the deeper station at a depth of the shallower station will be approximate to the variation at the seafloor pressure variation at the deeper station. Thus, the geostrophic current velocity variation can be expressed as,
The seafloor pressure decrease over the lower slope caused a rapid decrease in pressure difference between P2 and P3, i.e., the northeastward bottom velocity anomaly on the slope between 2300 and 3000 m depths (red line in Figure 8). The velocity anomaly decreased by more than 80 cms−1 over approximately 3 months from March to May 2017. Fukasawa and Teramoto (1986) observed an abrupt reversal of a deep current of approximately 40 cms−1 from the west to the east during the formation of the 1981–1984 LM path by current meters installed at levels deeper than approximately 2,000 m over the lower slope deeper than 3,000 m off Cape Shiono-misaki, which is the southern tip of the Kii Peninsula. The maximal variation range of deep current velocity along the slope observed by Fukasawa and Teramoto (1986) was ∼80 cms−1. The magnitudes and the depth ranges of the deep current changes are coincident in both unstable-type LM paths during the periods 1981–1984 and 2017–present, although the observation areas are approximately 400 km apart. We confirmed that, approximately 5 months after the seafloor pressure drop southeast of Kyushu, seafloor pressure was depressed over the lower continental slope deeper than 4000 m to the southeast of the Kii Peninsula, as discussed in Section 3.3. Therefore, the formation of the unstable-type LM path is anticipated to intensify the cyclonic deep circulation along the northern periphery of the Shikoku Basin as suggested its existence by Fukasawa et al. (1987).
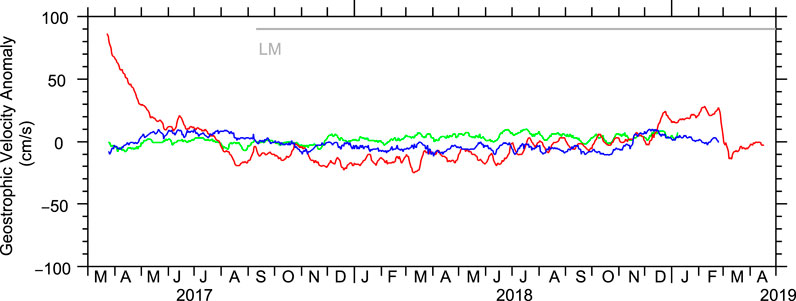
FIGURE 8. Geostrophic velocity anomalies in the fifth observation period (March 2017–April 2019) estimated from the seafloor pressure difference between P1 and P2 (blue line), P2 and P3 (red line), and P3 and P4 (green line). Positive anomalies show northeastward current anomalies. The LM period is indicated by the horizontal gray line.
Nagano et al. (2018) also found a decrease in the upslope seafloor pressure gradient over the 2000–4000 m depth slope off Shikoku during the formation of the 2004–2005 stable-type LM path, but the magnitude (equivalent to ∼10
If the LM path of the Kuroshio is controlled by the bottom slope, the enhancement in seafloor pressure gradient, or geostrophic deep current velocity, over the mid-continental slope, i.e., P3 and P4, should be observed in association with the formation of the LM path, as explained in Section 1 and demonstrated by Nagano et al. (2018) for the case of the stable-type LM during the period 2004–2005. However, during the LM period from 2017 to the present, no salient deep Kuroshio current intensification, i.e., increase in seafloor pressure gradient, was observed beneath the Kuroshio between P3 and P4 (green line in Figure 8). The topographic steering is likely to be less effective for the 2017–present LM path than for the stable-type LM for 2004–2005. The weak topographic steering may be responsible for the unstable character of the 2017–present LM path.
3.2 Hydrographic Changes Related to Changes in Seafloor Pressure
The potential density at the OBP observation line changed corresponding to the seafloor pressure change in the transition to the LM path (Figure 9). On March 17, 2017, the head of a small meander approached the observation line (black contour in Figure 6B), and the main pycnocline denoted by a layer between isopycnal surfaces of approximately 25–27
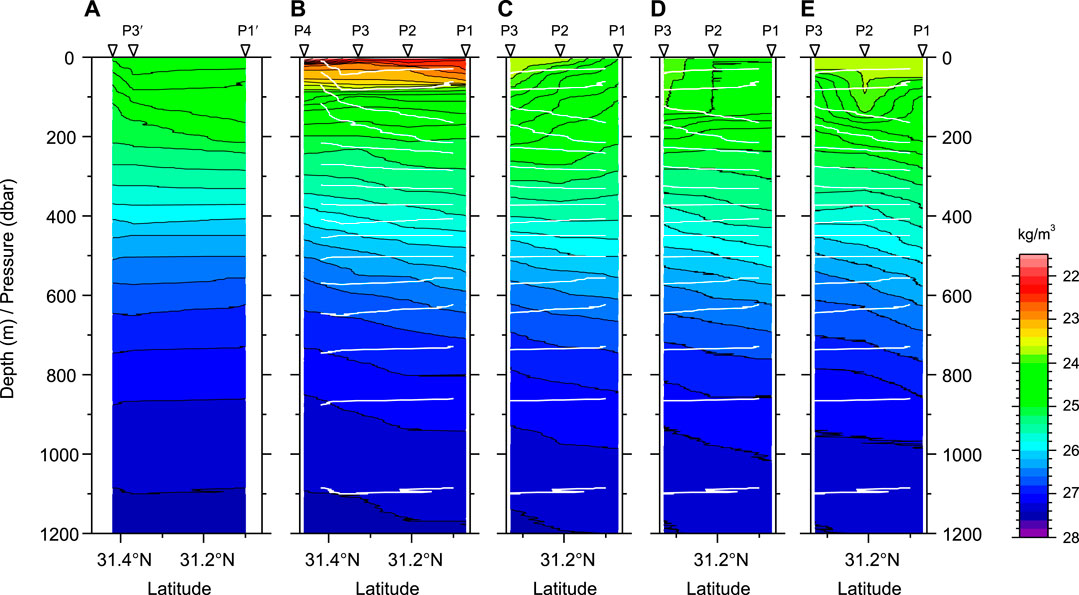
FIGURE 9. Snapshot sections of potential density
In Figures 10A–C, we show the vertical profiles of potential temperature, salinity, and potential density collected at the offshore-most station P1, respectively. The main pycnocline was approximately 100 m shallower in March 2017 than in other periods (Figures 10C); it was also ∼3°C colder (Figures 10A) and ∼0.1 (psu) fresher (Figures 10B) around a depth of approximately 600 m, as derived from the North Pacific intermediate water characterized by the salinity minimum (approximately 700 m depth) in the LM period.
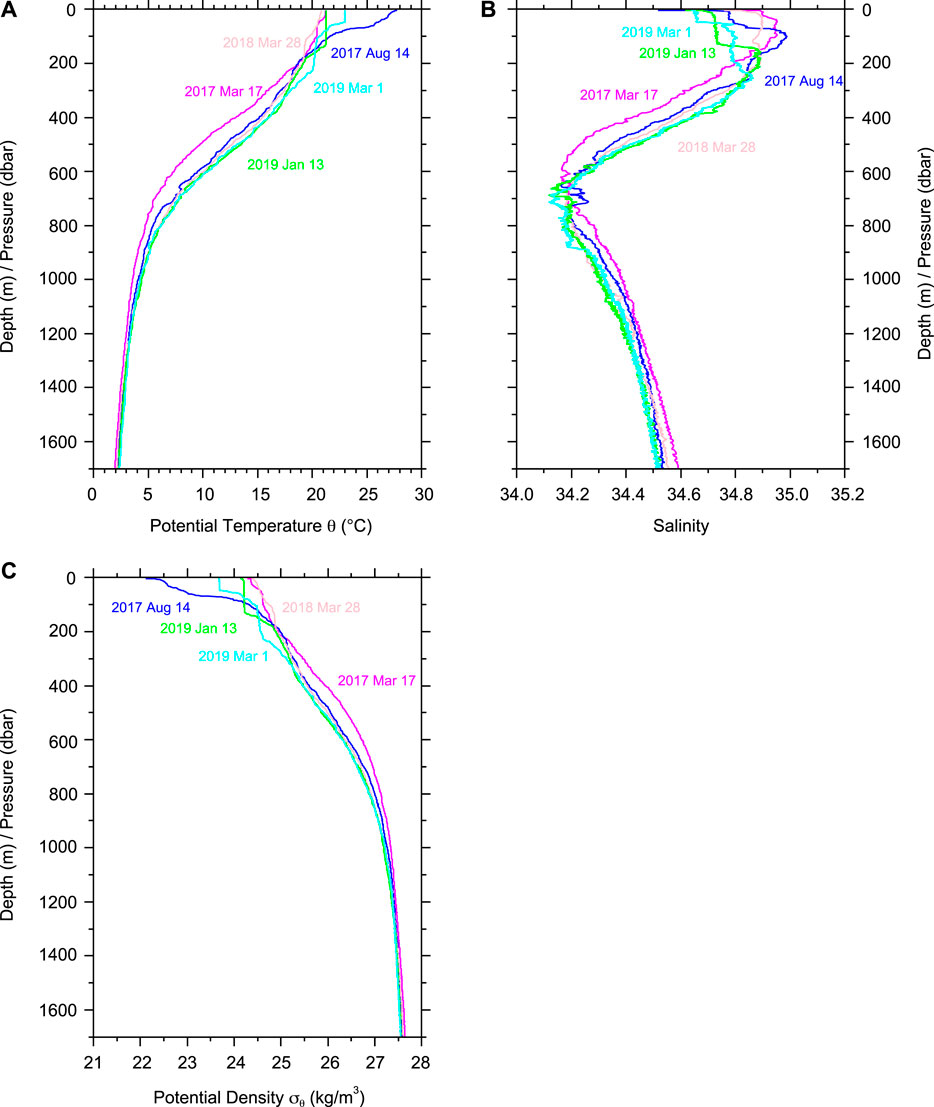
FIGURE 10. Vertical distributions of (A) potential temperature θ (°C), (B) salinity in psu, and (C) potential density
Using the hydrographic data, we computed the geopotential distance (m) at a depth of 1500 m or dbar relative to the sea surface as follows:
where z is the upward vertical coordinate; g = 9.81
where
Just before the pressure drop over the lower slope (March 17, 2017), the values of seafloor pressure at P1 and P3 estimated from the altimetric SSH and hydrographic data are −1.041 and −1.015 dbar, respectively (Table 2). Taking into account the error of altimetric SSH observation (∼3 cm) and lack of calculations below a depth of 1,500 m, their difference (0.026) may be insignificant. After the passage of the small meander off the eastern coast of Kyushu (August 14, 2017), the estimated seafloor pressure at P1 was decreased to −1.123 dbar. The decrease in seafloor pressure is similar to that in the pressure measured by the OBP (Figure 5D) and is principally due to the increase in
However, possibly because the resolution of altimetric SSH data is too low in space and time to resolve the small-scale and high-frequency SSH fluctuations, the estimated seafloor pressure was sometimes not in agreement with the measured seafloor pressure as in the case of March 28, 2018. For example, in March 2018, the isopycnal surfaces in the top 200 m shoals southeastward (Figure 9C). An SSH fluctuation associated with this submesoscale (<25 km) density fluctuation cannot be fully detected by the satellite altimetry. The amplitudes of such small-scale SSH fluctuations are considered to be of the order of 10 cm, which is nearly equivalent to the discrepancy of the seafloor pressure values in March 2018, as expected from the root-mean-square differences between altimetric SSH and dynamic height based on hydrographic data in the subtropical gyre interior region calculated by Nagano et al. (2016). Meanwhile, at P3, the estimated seafloor pressure varied within a smaller range of ∼0.06 dbar. Small-scale and high-frequency fluctuations may be more frequently present at P1 than P3.
3.3 Relation to the Seafloor Pressure Change South of the Kii Peninsula
In Figure 11A, the red curves show the deep currents that flow to the south of Shikoku (Worthington and Kawai, 1972; Taft, 1978; Fukasawa et al., 1987) and to the east of the Kyushu-Palau Ridge (Fukasawa et al., 1995) seeing the center of the Shikoku Basin to the left. It is reasonable that the offshore deepening of the main pycnocline and low seafloor pressure due to the strengthening of the Shikoku Basin local recirculation during the LM period should intensify the deep currents south of Shikoku and east of Kyushu as in Figure 11B. However, because the deep current south of the Kii Peninsula observed by Fukasawa and Teramoto (1986) is close to the cyclonic eddy south of the Kii Peninsula rather than the Shikoku Basin local recirculation, the deep current change off the Kii Peninsula is not under the direct influence of the local recirculation (Figure 11B). Considering that the main pycnocline shoals toward the center of the cyclonic eddy south of the Kii Peninsula (Nagano et al., 2010), the pressure disturbance originating from the recirculation may be advected by the deep Kuroshio current and also propagate along the cyclonic eddy south of the Kii Peninsula (pink dotted curve in Figure 11B). The transmitted pressure change may generate the westward deep current to the south of the Kii Peninsula.
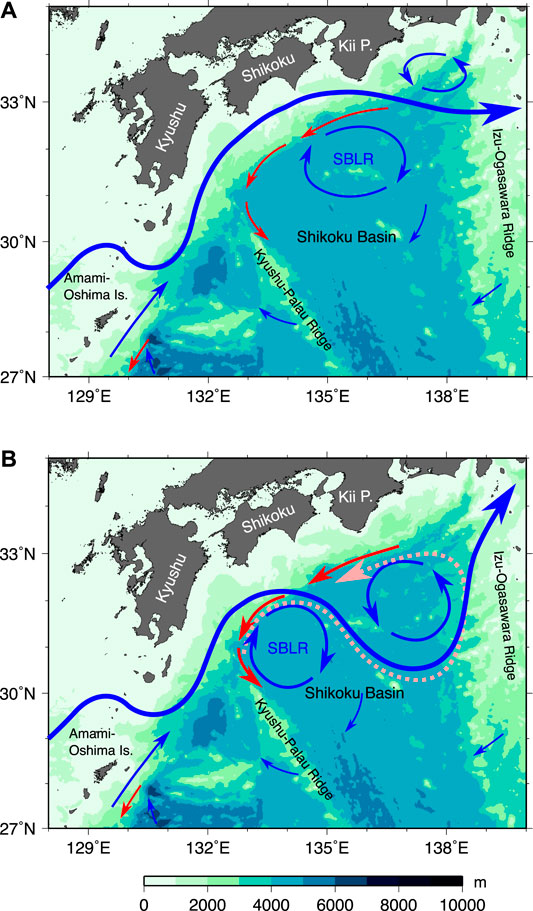
FIGURE 11. Schematic diagrams of the sea surface (blue curve) and deep (red curve) currents for the (A) NLM and (B) LM paths. The expected propagation path of the fluctuation of the seafloor pressure decrease originated in the western limb of the Shikoku Basin local recirculation (SBLR) associated with the formation of the LM path is indicated by pink dotted curve.
To the southeast of the Kii Peninsula, seafloor pressure was depressed by ∼0.05 dbar from late July to early August 2017 and continued to be low fluctuating on time scales of ∼10–20 days, which is similar to the current velocity oscillation at the period of ∼25 days observed by Fukasawa and Teramoto (1986), thereafter based on the data collected at stations KMC10 and KMC11 of DONET over the lower continental slope deeper than 4,000 m (Figures 12B,C). Meanwhile, no corresponding step-like decrease in pressure was identified at the shallower KMC09 station despite that a large peak (>0.15 dbar) was observed in late July (Figure 12A). The time lag between the decrease in seafloor pressure to the east of Kyushu and southeast of the Kii Peninsula is approximately 5 months. Taking into the consideration the distance along the LM path (∼500 km), the propagation speed is estimated as 3.9 cms−1.
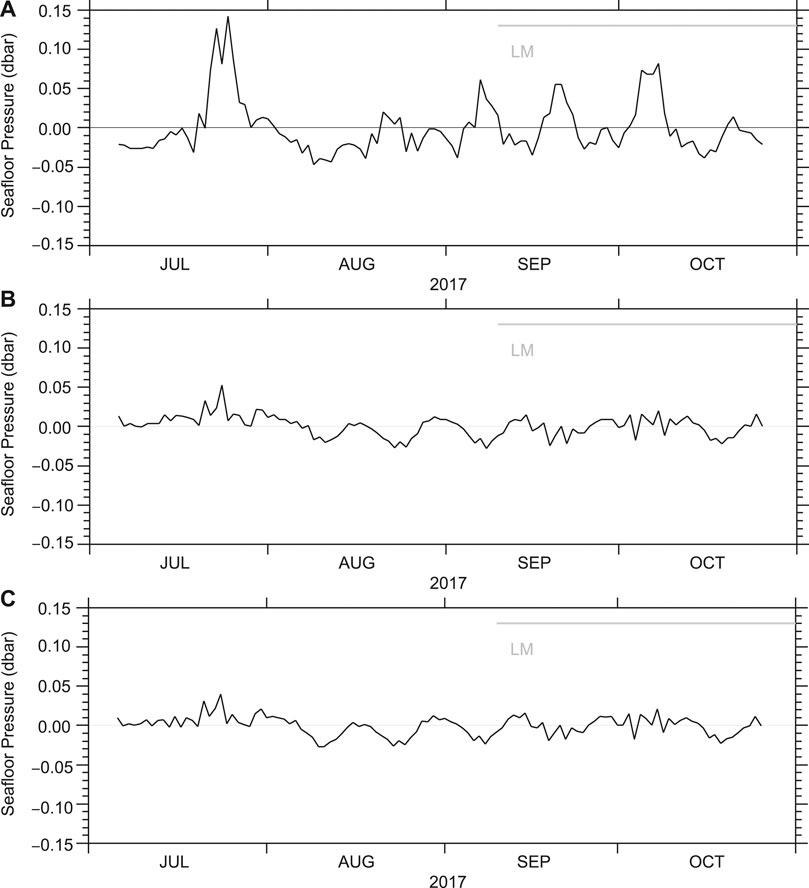
FIGURE 12. OBP-measured daily mean seafloor pressure variations from July to October 2017 at (A) KMC09, (B) KMC10, and (C) KMC11. The Kuroshio LM period is shown by the horizontal gray line. Thin horizontal line indicates zero.
Disturbances trapped in a deep flow below the main pycnocline are thought to propagate with the propagation speed of Doppler-shifted Rossby waves:
where U is the advection speed; λ, the internal Rossby radius of deformation; β, the latitudinal variation of the Coriolis parameter f; and
4 Summary and Conclusions
To the south of Japan, the Kuroshio takes either the LM or NLM paths on interannual to decadal timescales. Nagano et al. (2019) classified the LM paths into the stable and unstable types based on the stability of the current path. The Kuroshio has taken the LM path since September 2017, and the LM path is active at present as of November 2020 although the cyclonic LM eddy has been separated from the Kuroshio. The 2017–present LM path is the unstable-type LM path because the current path greatly fluctuates on the timescale of months. In this study, we examined the characteristics of the seafloor pressure variation across the continental slope off the eastern coast of Kyushu in association with the formation of the 2017–present LM path in comparison with the stable-type LM path during the period 2004–2005. Additionally, we collected the five sets of hydrographic data from 2017 to 2019 by using CTD and XCTD profilers. By using the hydrographic data, we verified the seafloor pressure change related to the LM path formation is caused not by the sensor drift but by the ocean variation.
Before the formation of the 2017–present LM path, seafloor pressure rapidly decreased from March to May 2017 by approximately 0.1 dbar over the lower continental slope between depths of approximately 3000 and 4000 m (stations P1 and P2), accompanied by an SSH depression due to the passage of the small meander. While the SSH became high again in association with the intensification of the Shikoku Basin local recirculation, the seafloor pressure continued to be low until the end of the observation period (April 2019). Beneath the unstable-type LM path, no significant pressure change was observed over the onshore mid-continental slope (stations P3 and P4) and the topographic steering of the current was not effective unlike the 2004–2005 LM path of the Kuroshio. The pressure drop over the lower continental slope caused an attenuation of the northeastward geostrophic current anomaly over the continental slope between depths of approximately 2300 and 3000 m and the magnitude of the velocity variation reached approximately 80 cms−1. This is similar to that observed south of the Kii Peninsula during the formation of the 1981–1984 unstable-type LM path (Fukasawa and Teramoto, 1986) but much larger than that observed to the south of Shikoku during the formation of the 2004–2005 stable-type LM path (Nagano et al., 2018). It is suggested that the formation of the unstable-type Kuroshio LM path greatly intensifies the cyclonic deep circulation along the northern periphery of the Shikoku Basin.
Corresponding to the pressure depression over the lower continental slope, the main pycnocline was found to be substantially deepened. The pressure depression over the lower slope off the eastern coast of Kyushu was attributed to the baroclinic intensification of the Shikoku Basin local recirculation. The seafloor pressure depression from March to May 2017 in association with the deepening of the main pycnocline generated in the recirculation is hypothesized to be advected by the deep Kuroshio current and to propagate along the outer edge of the cyclonic eddy south of the Kii Peninsula. Approximately 5 months after the seafloor pressure drop in March 2017, we found a seafloor pressure decrease of approximately 0.05 dbar in early August 2017 and a subsequent low seafloor pressure from the data of the DONET OBPs deployed over the lower slope deeper than 4000 m southeast of the Kii Peninsula. The 5-months time lag is consistent with the hypothesis that the seafloor pressure depression propagates along the outer edge of the cyclonic eddy south of the Kii Peninsula as a baroclinic Rossby wave advected in the deep Kuroshio current.
The magnitude of the seafloor pressure change (∼0.1 dbar) and the rate of seafloor pressure change (0.0011 dbar day−1) associated with the LM formation are equivalent to or larger than those due to slow slip events near the Nankai Trough expected from numerical simulation (Ariyoshi et al., 2014) and observed by the DONET (Suzuki et al., 2016) and near the Hikurangi subduction zone (Wallace et al., 2016). The LM-related decrease in seafloor pressure possibly occurs along the periphery of the Shikoku Basin and can not be identified by the SSH change alone. Thus, in addition to SSH data, in situ hydrographic measurements down to depths deeper than the main pycnocline base (∼1,500 m) as in the present study or full-depth acoustic observation (Nagano et al., 2018) are helpful to distinguish the seafloor pressure change due to crustal deformation from those caused by the Kuroshio and recirculation variations.
Data Availability Statement
The OBP and hydrographic observations of Hyuga-nada were conducted as part of “Research project for compound disaster mitigation on the great earthquakes and tsunamis around the Nankai Trough region,” a project of Ministry of Education, Culture, Sports, Science and Technology and the data are available on request to the corresponding author. The DONET OBP data were provided by National Research Institute for Earth Science and Disaster Prevention (NIED) and JAMSTEC. The AVISO delayed-time updated mapped data (DT-SLA-H) and absolute SSH values were computed by adding the mean dynamic topography values (MDT_CNES-CLS13) analyzed for this study can be found in the FTP site of the CMEMS.
Author Contributions
AN estimated sensor drifts of the OBP data and corrected the data, analyzed the OBP, hydrographic, altimetric SSH data, and wrote the manuscript. YY designed and performed the OBP observations. KA provided XCTD probes for the hydrographic observations. TH and HM decided the locations of hydrographic observations in cooperation with AN, YY, and KA. MS conceived and promoted this project. All coauthors collaborated with the corresponding author (AN) in the construction of the manuscript and approved the final manuscript.
Funding
This work was partly supported by the Japan Society for the Promotion of Science, Grant-in-Aid for Scientific Research (Grant Numbers: JP15H04228, JP16H06473, JP17K05660, JP20K04072, JP20H02236).
Conflict of Interest
The authors declare that the research was conducted in the absence of any commercial or financial relationships that could be construed as a potential conflict of interest.
The handling editor declared a past co-authorship with several of the authors (MS and KA).
Acknowledgments
The authors thank the scientists, technicians, and crew on board the T/V Nagasaki Maru (Nagasaki University), R/V Kaiyo Maru No.2, R/V Kaiyo Maru No. 7 (Kaiyo Engineering Co., Ltd.), and R/V Kaiko Maru No. 7 (Offshore Operation Co., Ltd.) for deployment and recovery operations of OBPs and collecting hydrographic data. The authors are deeply grateful to the editor, Ryota Hino (Tohoku University), and anonymous reviewers for constructive review comments.
Supplementary Material
The Supplementary Material for this article can be found online at: https://www.frontiersin.org/articles/10.3389/feart.2020.583481/full#supplementary-material.
References
Ando, M. (1975). Source mechanisms and tectonic significance of historical earthquakes along the Nankai trough, Japan. Tectonophysics 27, 119–140. doi:10.1016/0040-1951(75)90102-X
Ariyoshi, K., Nakata, R., Matsuzawa, T., Hino, R., Hori, T., Hasegawa, A., et al. (2014). The detectability of shallow slow earthquakes by the Dense Oceanfloor Network system for Earthquakes and Tsunamis (DONET) in Tonankai district, Japan. Mar. Geophys. Res. 35, 295–310. doi:10.1007/s11001-013-9192-6
AVISO (2008). SSALTO/DUACS user handbook: (M)SLA and (M)ADT near-real time and delayed time products. Ramonville St Agnes: CLS.
Cushman-Roisin, B., and Beckers, J.-M. (2011). Introduction to Geophysical fluid dynamics. 2nd Edn. Cambridge, Massachusetts: Academic Press.
Fukasawa, M., and Teramoto, T. (1986). Characteristics of deep currents off Cape Shiono-misaki before and after formation of the large meander of the Kuroshio in 1981. J. Oceanogr. Soc. Japan 42, 53–68. doi:10.1007/BF02109192
Fukasawa, M., Teramoto, T., and Taira, K. (1987). Abyssal current along the northern periphery of Shikoku Basin. J. Oceanogr. Soc. Japan 42, 459–472. doi:10.1007/BF02110196
Fukasawa, M., Teramoto, T., and Taira, K. (1995). Hydrographic structure in association with deep boundary current in the north of the Shikoku Basin. J. Oceanogr. 51, 187–205. doi:10.1007/bf02236524
Hasegawa, T., Nagano, A., Matsumoto, H., Ariyoshi, K., and Wakita, M. (2019). El Niño-related sea surface elevation and ocean bottom pressure enhancement associated with the retreat of the Oyashio southeast of Hokkaido, Japan. Mar. Geophys. Res. 40, 505–512. doi:10.1007/s11001-019-09392-8
Houston, M. H., and Paros, J. M. (1998). “High accuracy pressure instrumentation for underwater applications,” in Proceedings of 1998 International Symposium on Underwater Technology, Tokya, Japan, April 17, 1998, (IEEE). doi:10.1109/UT.1998.670113
Kawabe, M. (1985). Sea level variations at the Izu Islands and typical stable paths of the Kuroshio. J. Oceanogr. Soc. Japan. 41, 307–326.
Kawabe, M. (1986). Transition processes between the three typical paths of the Kuroshio. J. Oceanogr. Soc. Japan 42, 174–191. doi:10.1007/BF02109352
Kawabe, M. (1987). Spectral properties of sea level and time scales of Kuroshio path variations. J. Oceanogr. Soc. Japan 43, 111–123.
Kawabe, M. (1995). Variations of current path, velocity, and volume transport of the Kuroshio in relation with the large meander. J. Phys. Oceanogr. 25, 3103–3117. doi:10.1175/1520-0485(1995)025<3103:VOCPVA>2.0.CO;2
Kawabe, M. (2005). Variations of the Kuroshio in the southern region of Japan – condition for large meander of the Kuroshio. J. Oceanogr. 61, 529–537. doi:10.1007/s10872-005-0060-0
Kobari, T., Honma, T., Hasegawa, D., Yoshie, N., Tsutsumi, E., Matsuno, T., et al. (2020). Phytoplankton growth and consumption by microzooplankton stimulated by turbulent nitrate flux suggest rapid trophic transfer in the oligotrophic Kuroshio. Biogeosciences 17, 2441–2452. doi:10.5194/bg-17-2441-2020
Kuwano-Yoshida, A., and Minobe, S. (2017). Storm-track response to SST fronts in the northwestern Pacific region in an AGCM. J. Climate 30, 1081–1102. doi:10.1175/JCLI-D-16-0331.1
Latif, M., and Barnett, T. (1994). Causes of decadal climate variability over the north pacific and north America. Science 266, 634–637. doi:10.1126/science.266.5185.634
Mizuno, K., and Watanabe, T. (1998). Preliminary results of in-situ XCTD/CTD comparison test. J. Oceanogr 54, 373–380.
Munk, W. H. (1950). On the wind-driven ocean circulation. J. Meteor. 7, 79–93. doi:10.1175/1520-0469(1950)007<0080:OTWDOC>2.0.CO;2
Nagano, A., Hasegawa, T., Matsumoto, H., and Ariyoshi, K. (2018). Bottom pressure change associated with the 2004–2005 large meander of the Kuroshio south of Japan. Ocean Dynam. 68, 847–865. doi:10.1007/s10236-018-1169-1
Nagano, A., Ichikawa, K., Ichikawa, H., Konda, M., and Murakami, K. (2013). Volume transports proceeding to the Kuroshio extension region and recirculating in the Shikoku Basin. J. Oceanogr. 69, 285–293. doi:10.1007/s10872-013-0173-9
Nagano, A., Ichikawa, K., Ichikawa, H., Tomita, H., Tokinaga, H., and Konda, M. (2010). Stable volume and heat transports of the North Pacific subtropical gyre revealed by identifying the Kuroshio in synoptic hydrography south of Japan. J. Geophys. Res. 115, 5747. doi:10.1029/2009JC005747
Nagano, A., and Kawabe, M. (2004). Monitoring of generation and propagation of the Kuroshio small meander using sea levels along the southern coast of Japan. J. Oceanogr. 60, 879–892. doi:10.1007/s10872-004-5780-z
Nagano, A., and Kawabe, M. (2005). Coastal disturbance in sea level propagating along the south coast of Japan and its impact on the Kuroshio. J. Oceanogr. 61, 885–903. doi:10.1007/s10872-006-0007-0
Nagano, A., Kizu, S., Hanawa, K., and Roemmich, D. (2016). Heat transport variation due to change of North Pacific subtropical gyre interior flow during 1993–2012. Ocean Dynam. 66, 1637–1649. doi:10.1007/s10236-016-1007-2
Nagano, A., Yamashita, Y., Hasegawa, T., Ariyoshi, K., Matsumoto, H., and Shinohara, M. (2019). Characteristics of an atypical large-meander path of the Kuroshio current south of Japan formed in September 2017. Mar. Geophys. Res. 40, 525–539. doi:10.1007/s11001-018-9372-5
Nakano, M., Hyodo, M., Nakanishi, A., Yamashita, M., Hori, T., Kamiya, S., et al. (2018). The 2016 MW5.9 earthquake off the southeastern coast of Mie Prefecture as an indicator of preparatory processes of the next Nankai Trough megathrust earthquake. Prog. Earth Planet Sci. 5, 3. doi:10.1186/s40645-018-0188-3
Nishiyama, K., Konaga, S., and Ishizaki, H. (1980). Warm water regions off Shikoku associated with the Kuroshio meander. Pap. Meteor. Geophys. 31, 43–52.
Nishiyama, K., Konaga, S., and Ishizaki, H. (1981). Some considerations on the Kuroshio meander and the surrounding oceanographic conditions. Pap. Meteor. Geophys. 32, 109–117.
Nitani, H. (1972). “Beginning of the Kuroshio,” in Kuroshio-its physical aspects, Editors. H. Stommel, and K. Yoshida Tokyo, Japan: University of Tokyo Press, 129–163.
Pedlosky, J. (1987). Geophysical fluid dynamics. 2nd Edn. New York: Springer-Verlag. doi:10.1007/978-1-4612-4650-3
Pedlosky, J. (1996). Ocean Circulation theory. New York: Springer-Verlag. doi:10.1007/978-3-662-03204-6
Polster, A., Fabian, M., and Villinger, H. (2009). Effective resolution and drift of Paroscientific pressure sensors derived from long-term seafloor measurements. Geochem. Geophys. Geosyst. 10, 2532. doi:10.1029/2009GC002532
Rio, M. H., Guinehut, S., and Larnicol, G. (2011). New CNES-CLS09 global mean dynamic topography computed from the combination of GRACE data, altimetry, and in situ measurements. J. Geophys. Res. 116, 6505. doi:10.1029/2010JC006505
Schwartz, S. Y., and Rokosky, J. M. (2007). Slow slip events and seismic tremor at circum-pacific subduction zones. Rev. Geophys. 45, 208. doi:10.1029/2006RG000208
Shoji, D. (1972). “Time variation of the Kuroshio south of Japan,” in Kuroshio-its physical aspects. Editors. H. Stommel, and K. Yoshida, Tokyo, Japan: University of Tokyo Press. 217–234.
Stommel, H. (1948). The westward intensification of wind-driven ocean currents. Trans. Am. Geophys. Union 29, 202–206.
Suzuki, K., Nakano, M., Takahashi, N., Hori, T., Kamiya, S., Araki, E., et al. (2016). Synchronous changes in the seismicity rate and ocean-bottom hydrostatic pressures along the Nankai trough: a possible slow slip event detected by the Dense Oceanfloor Network system for Earthquakes and Tsunamis (DONET). Tectonophysics 680, 90–98. doi:10.1016/j.tecto.2016.05.012
Taft, B. (1972). “Characteristics of the flow of the Kuroshio south of Japan,” in Kuroshio-its physical aspects, Editors. H. Stommel, and K. Yoshida, Tokyo, Japan: University of Tokyo Press, 165–216.
Taira, K., and Teramoto, T. (1985). Bottom currents in Nankai Trough and sagami trough. J. Oceanogr. Soc. Japan 41, 388–398.
Thompson, R. (1983). Low-pass filters to suppress inertial and tidal frequencies. J. Phys. Oceanogr. 13, 1077–1083. doi:10.1007/BF02109033
Tian, Y., Uchikawa, K., Ueda, Y., and Cheng, J. (2014). Comparison of fluctuations in fish communities and trophic structures of ecosystems from three currents around Japan: synchronies and differences. ICES Journal of Marine Science 71, 19–34. doi:10.1093/icesjms/fst169
Wallace, L. M., Webb, S. C., Ito, Y., Mochizuki, K., Hino, R., Henrys, S., et al. (2016). Slow slip near the trench at the Hikurangi subduction zone, New Zealand. Science 352, 701–704. doi:10.1126/science.aaf2349
Watts, D. R., and Kontoyiannis, H. (1990). Deep-ocean bottom pressure measurement: drift removal and performance. J. Atmos. Oceanic Technol. 7, 296–306. doi:10.1175/1520-0426(1990)007<0296:DOBPMD>2.0.CO;2
Worthington, L., and Kawai, H. (1972). “Comparison between deep sections across the Kuroshio and the Florida current and gulf stream,” in Kuroshio-its physical aspects, Editors H. Stommel, and K. Yoshida Tokyo, Japan: University of Tokyo Press. 371–385.
Keywords: Kuroshio, recirculation, sea surface height, ocean bottom pressure, large meander, Shikoku basin
Citation: Nagano A, Yamashita Y, Ariyoshi K, Hasegawa T, Matsumoto H and Shinohara M (2021) Seafloor Pressure Change Excited at the Northwest Corner of the Shikoku Basin by the Formation of the Kuroshio Large-Meander in September 2017. Front. Earth Sci. 8:583481. doi: 10.3389/feart.2020.583481
Received: 15 July 2020; Accepted: 30 November 2020;
Published: 14 January 2021.
Edited by:
Ryota Hino, Tohoku University, JapanReviewed by:
Daisuke Inazu, Tokyo University of Marine Science and Technology, JapanShusaku Sugimoto, Tohoku University, Japan
William Wilcock, University of Washington, United States
Erik Fredrickson, University of Washington, United States, in collaboration with reviewer [WW].
Copyright © 2021 Nagano, Yamashita, Ariyoshi, Hasegawa, Matsumoto and Shinohara. This is an open-access article distributed under the terms of the Creative Commons Attribution License (CC BY). The use, distribution or reproduction in other forums is permitted, provided the original author(s) and the copyright owner(s) are credited and that the original publication in this journal is cited, in accordance with accepted academic practice. No use, distribution or reproduction is permitted which does not comply with these terms.
*Correspondence: Akira Nagano, bmFnYW5vQGphbXN0ZWMuZ28uanA=
 Akira Nagano
 Yusuke Yamashita
 Keisuke Ariyoshi
 Takuya Hasegawa
 Hiroyuki Matsumoto
 Masanao Shinohara