 M. Wilks
 N. Rawlinson
 J.-M. Kendall
 A. Nowacki
 J. Biggs
 A. Ayele5
 J. Wookey
94% of researchers rate our articles as excellent or good
Learn more about the work of our research integrity team to safeguard the quality of each article we publish.
Find out more
ORIGINAL RESEARCH article
Front. Earth Sci., 14 October 2020
Sec. Volcanology
Volume 8 - 2020 | https://doi.org/10.3389/feart.2020.579699
This article is part of the Research TopicSeismicity in Volcanic AreasView all 20 articles
Seismicity can be used to better understand interactions between magma bodies, hydrothermal systems and their host rocks—key factors influencing volcanic unrest. Here, we use earthquake data to image, for the first time, the seismic velocity structure beneath Aluto, a deforming volcano in the Main Ethiopian Rift. Traveltime tomography is used to jointly relocate seismicity and image 3D P- and S-wave velocity structures and the ratio between them (VP/VS). At depths of 4–9 km, the seismicity maps the top of a large low velocity zone with high VP/VS, which we interpret as a more ductile and melt-bearing region. A shallow (<3 km) hydrothermal system exhibits low seismic velocities and very low VP/VS (∼1.40), consistent with the presence of gases exsolved from a deeper melt-rich mush body. The Artu Jawe fault and fracture system provides the migration pathway that connects the deeper mush body with the shallow hydrothermal system. Together, these observations demonstrate that the interaction between magmatic and hydrothermal systems, driven by the exchange of fluids, is responsible for the restless behavior of Aluto.
Interactions between magmatic and hydrothermal systems beneath volcanoes are poorly understood, but play a crucial role in eruptions, especially those that are phreatomagmatic (Pritchard et al., 2019; Troise et al., 2019). This interaction is also important for successful geothermal energy production in high-enthalpy volcanic systems (Reinsch et al., 2017). Seismic methods offer insights into the nature of these thermo-magmatic systems (e.g., Greenfield et al., 2016; Hooft et al., 2019; Wespestad et al., 2019). Seismicity indicates fluid movements through faults and conduits (e.g., Prejean et al., 2002; Hudson et al., 2017; Greenfield et al., 2019a), but can also be used to image their subsurface structure. For example, seismic velocities and their ratio (VP/VS), can be used to image fault structures and regions of partial melt and over-pressured gases (e.g., Johnson and Polland, 2013; Muksin et al., 2013). Such observations have implications for understanding volcanic unrest, assessing volcanic hazard and optimizing geothermal exploration.
The dynamic nature of the volcanoes of the Main Ethiopian Rift (MER) has only recently been realized (Biggs et al., 2011). The population exposure index for these volcanos is high (PEI five or greater), as nearly 10 million people live in the region (Brown et al., 2015). Over the past decade, a number of studies have sought to better understand the dynamics and eruptive histories of these volcanoes. Experiments have revealed a rich complexity of seismicity beneath Corbetti (Lloyd, et al., 2018a; Lavayssière et al., 2019), Bora–Tulu Moye (Greenfield et al., 2019a; Greenfield et al., 2019b) and Aluto (Wilks et al., 2017). Satellite imaging suggests frequently recurring and shallow magmatic activity (Biggs et al., 2011; Hutchison et al., 2016b; Lloyd et al., 2018a), and a role for pre-existing structures in the development of volcanism (Lloyd et al., 2018b). Magnetotellurics (Samrock et al., 2015; Lloyd et al., 2018a; Hübert et al., 2018) and gravity (Gottsmann et al., 2020) offer further insights into melt storage and migration beneath these volcanoes. However, the location of magmatic and hydrothermal reservoirs is still somewhat elusive. Here we focus on Aluto volcano, which lies just south of the town of Ziway, between Lake Ziway and Lake Langano (Figure 1).
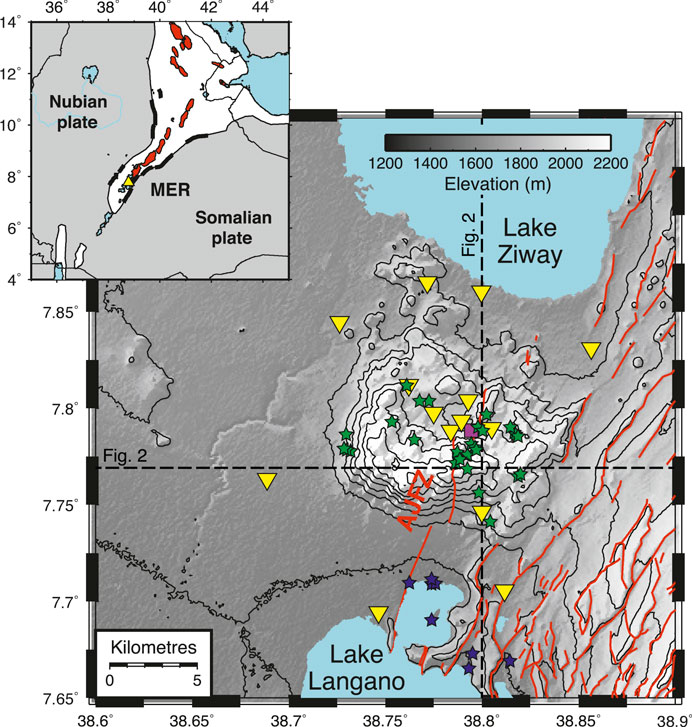
FIGURE 1. The ARGOS seismic network (yellow triangles), faults (red lines) (Agostini et al., 2011; Hutchison et al., 2015) and the Artu Jawe Fault Zone. Green and blue stars are fumaroles and hot springs, respectively (Braddock et al., 2017; Hochstein et al., 2017). Black dashed lines indicate the location of the north-south and east-west profiles shown in Figure 2. Inset: Aluto and the study region (yellow triangle) within the Main Ethiopian Rift with rift regions (white), border faults (thick black lines) and magmatic segments (red) marked.
Aluto is a silicic volcanic center that is thought to have begun erupting at about 0.5 Ma in association with the development of the regional Wonji Fault Belt (Hutchison et al., 2016a; Agostini et al., 2011), and whose most recent volcanic deposits are dated to 0.4 ka (Hutchison et al., 2016a). Regional earthquake catalogs (Keir et al., 2006) suggest that earthquakes up to magnitude three occur along the relatively low-seismicity Aluto–Gedemsa magmatic segment, but are likely associated with the border faults to the east of our study region (Figure 1) rather than volcanic activity itself. The volcano has however displayed episodic surface deformation (Biggs et al., 2011; Hutchison et al., 2016b). Two pulses of rapid uplift were observed in 2003 and 2008 (15 cm in 10 months and 10 cm in 6 months), but since then the volcano has been slowly subsiding at rates <3 mm/yr (Biggs et al., 2011; Birhanu et al., 2019).
A series of recent experiments have provided further insights into the active nature of Aluto. Seismicity (Wilks et al., 2017) and observations of fracture-induced seismic anisotropy (Nowacki et al., 2018) reveal a complex fault system and fracture network that extends well below an active hydrothermal system. The pattern of seismicity is seasonal, with the peak of seismicity occurring 2–3 months after the heavy rainy season coincident with lake loading and subsidence (Birhanu et al., 2019). Surface and satellite mapping and CO2 flux surveys have shown that magmatic and hydrothermal upwelling follows recent faults and fracture networks generated by Quaternary to Recent rifting, namely the Wonji Fault Belt and the associated Artu Jawe Fault Zone (AJFZ) (ELC Electroconsult, 1986; Hutchison et al., 2015; Hutchison et al., 2016a; Braddock et al., 2017). The high temperature gradient and active hydrothermal system has made Aluto a viable and productive geothermal resource; Ethiopia’s first, and at present only, geothermal power plant was built within the caldera in 1999 (Hochstein et al., 2017).
In this study, we image the seismic structure beneath Aluto using local earthquake tomography, providing new insight into the magmatic and hydrothermal processes that drive volcanic unrest. Earthquake locations reveal the dynamic nature of the volcano, whilst seismic velocities can be used to map fluids. Fluid-rich rocks exhibit reduced shear moduli, but their bulk moduli are sensitive to the gas content of the fluid. Gases are compressible, whilst liquids are less so. Therefore, tomographic images of VP/VS ratios can be used to further highlight fluid-rich regions, but also provide information about the nature of the fluid. Broad, high VP/VS regions have been identified beneath volcanic arcs (Syracuse et al., 2008), while small pockets of VP/VS >1.8 at depths less than 5 km have been interpreted as individual melt reservoirs beneath volcanoes (Koulakov et al., 2009; Jaxybulatov et al., 2011). Smaller elevated VP/VS anomalies (1.7–1.8), have been interpreted as fluid-rich sediments (Hansen, 2004; Muksin et al., 2013) and shallow steam condensates (Chiarabba and Moretti, 2006). In contrast, shallow, low VP/VS ratios (∼1.6) have been observed within geothermal areas such as Mammoth Mountain and the Geysers, California (Julian et al., 1998; Dawson et al., 2016). Theoretical considerations (Mavko and Mukerji, 1995), experimental results (Dvorkin et al., 1999) and insights from the hydrocarbon industry (e.g., Harris et al., 1996; Yu et al., 2015) show that VP/VS ratios are sensitive to pore-fluid compressibility through its effect on VP, and suggest that low VP/VS regions represent gas-rich reservoirs. Thus, 3-D images of VP/VS are extremely useful in mapping melt (in mush or magma), fluids and gases within geothermal and volcanic environments.
We use local earthquakes from the Aluto Research and Geophysical ObservationS (ARGOS) event catalog (Wilks et al., 2017) that were recorded at 14 sites between January 2012 and January 2014 (Figure 1), during which time the volcano was slowly subsiding. Event detection was performed manually for P- and S-wave arrivals, with the arrival picks given weightings that reflect the clarity of their onsets (Wilks et al., 2017).
Initially, hypocentral locations and origin times were determined using NONLINLOC (Lomax et al., 2000), a nonlinear probabilistic global search algorithm, as outlined in Wilks et al. (2017). Since seismic tomography is heavily reliant on travel time accuracy, we restrict the number of events we use from this catalog based on NONLINLOC location statistics, pick weightings and a minimum detection threshold of six stations per event; this leaves 161 events and 1,672 arrivals (1,038 P- and 634 S-waves). A 1-D starting velocity model was initially developed by combining well-log data in the uppermost 2–3 km (Gianelli and Teklemariam, 1993; Gizaw, 1993) with a regional tomographic model derived from earthquakes in the Main Ethiopian Rift and Ethiopian Plateau (Daly et al., 2008). This 1-D model is further refined via joint hypocenter and velocity inversion using FMTOMO (Rawlinson and Urvoy, 2006)—see Supplementary Section 2.0, for further details. This refinement reveals that in general the velocity structure beneath Aluto is much slower (up to 20% for P-waves and up to 11% for S-waves; see Supplementary Figure 2.1) than the velocity model for the wider region (i.e., that of Daly et al., 2008).
For the seismic tomography, we use a modified version of the FMTOMO code of Rawlinson and Urvoy (2006), which was originally developed to permit the joint inversion of multiple data types (teleseismic, local earthquake, active source) for several classes of unknowns, including layer velocity, interface geometry and hypocenter location. A grid based eikonal solver known as the Fast Marching Method (Rawlinson and Sambridge, 2003) is used to solve the forward problem of traveltime prediction, and a subspace inversion method (Kennett et al., 1988) is used to adjust the unknowns at each step of the iterative non-linear solution process. Pilia et al. (2013) modified FMTOMO to permit recovery of VP, VS and VP/VS and fully non-linear location of hypocenters (via a grid search). We use this modified version of FMTOMO, but further develop it to produce robust estimates of hypocenter uncertainty based on computing the 95% confidence region around each event. The additional computational effort required to retrieve this information is minimal, because the objective function is already computed at every point during the grid search.
For the 3-D seismic tomography we perform six iterations, each of which involves: 1) solution of the forward problem through the current model; 2) inversion for velocity parameters using a 20-D (the number of orthogonal search directions in model space) subspace inversion scheme; 3) hypocenter relocation, based on both P- and S- wave arrival times, using a fully non-linear grid search in the presence of the updated velocity model (Pilia et al., 2013). The inversion for P- and S-wave velocities is done together, along with hypocenter location, since both P-wave and S-wave arrival times are used to constrain velocity and location. The inversion for VP/VS is done separately, since it is a linear inversion performed along the ray paths from the S-wave model.
Structure is defined on a cubic B-spline grid that spans 0.8° horizontally and 44 km in depth, with an approximately uniform node spacing in all three dimensions of ∼2.2 km (42,527 nodes in total). Within our inversion grid, nodes which are relatively undersampled by the data will take values close to the initial reference model, and appear to have ∼0% deviation. These tend to lie at the edges of the model where few events or receivers are present. This attraction to the reference values is due to two features of our inversion approach: 1) regularization, which penalizes changes to model parameters not required by the data, and 2) the subspace inversion scheme, which only modifies parameters that have an effect on the data fit. For a more complete description of FMTOMO and its modifications for local earthquake tomography, refer to de Kool et al. (2006), Rawlinson and Urvoy (2006), and Pilia et al. (2013).
We consider the trade-off between the complexity of the final model (which is a function of the model roughness and model variance) and the accuracy of the data fitting by performing numerous inversions with a range of damping and smoothing parameters (e.g., Eberhart-Phillips, 1986). This is performed using the following trade-off curves: data fit (variance of the residuals) vs. model roughness, while varying the smoothing parameter; data fit vs. model variance, while varying the damping parameter. The details of how we choose the damping and smoothing parameters are included the Supplementary Material. The final variance reduction for each model is: 56% for the VP model; 49% for the VS model; and 34% for the VP/VS model.
The non-linear inverse problem that we solve is to find the location of each earthquake such that the differences between the observed and predicted arrival times (through a 3-D velocity model) are minimized. This is formalized by specifying an objective function S(m), where m is a vector that defines the latitude, longitude and depth of the earthquake, such that
where dobs is a set of N observed arrival times (from a given hypocenter) with the mean subtracted,
We locate the minimum of S(m) using a grid-search, which is a fully non-linear technique capable of locating the global minimum of S(m) and providing valuable information on location uncertainty [see Lomax et al. (2000) for a comprehensive review of nonlinear earthquake location methods]. The method works by computing S(m) at a regular grid of points in latitude, longitude and depth. This regular sampling of the objective function in 3-D space means that the point of minimum misfit, which coincides with our preferred earthquake location, can be readily identified. A nested grid search is used to locate the hypocenters. In the first step, a coarse step size of 1 km is used, but once the optimum location is found, the search is repeated in the neighborhood of this point using a step size of 100 m.
One advantage of heavily sampling the objective function across a dense 3-D grid is that hypocenter uncertainty information can be obtained with little additional computational effort. Here, we adopt the approach described by Sambridge and Kennett (1986) for defining the 95% confidence region around the solution
where N is the number of data picks and
which has a chi-square distribution with N–M degrees of freedom, where M = 3 is the number of model parameters. Equation 3 accounts for the effect of errors in the velocity model (which are usually unclear) by rescaling S so that
In our application of this approach, we use the boundary of the 95% confidence region as a proxy for location uncertainty and summarize our results in terms of uncertainty in depth, latitude and longitude, as shown in Figure 2. As expected, uncertainty in depth tends to be larger in comparison to uncertainty in latitude and longitude, although for most events it is well below 5 km. A number of events cluster near the upper boundary of the model, and of these a noticeable proportion have depth uncertainties that are larger than average. This occurs because shallow events that are not well constrained in depth cannot be relocated above the model, and hence are forced to reside immediately below the surface. The upper surface of the model is set to be 2.5 km above sea level, which means that all receivers and sources lie within the model volume. While it would be possible to exclude these events from the inversion, they are no less valid than deeper events, which have a similar location uncertainty. Overall, these results suggest that the distribution of seismicity that we interpret in terms of volcanic processes is robust, including the observation that the zone of earthquake activity tends to deepen as we move away from the volcanic center.
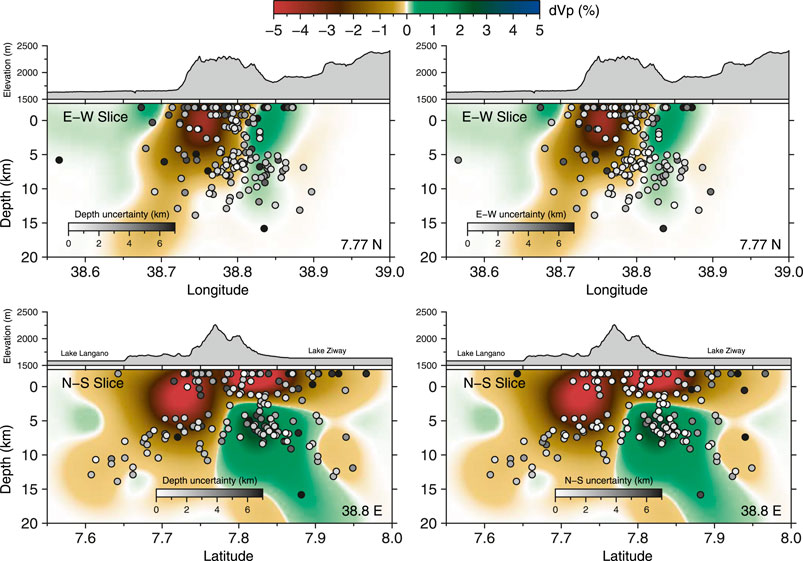
FIGURE 2. Relocated earthquake uncertainties. East–west (upper) and north–south (lower) slices through the P-wave solution model with all earthquakes superimposed. Earthquakes are shaded using a grey-scale that indicates uncertainty in depth (left) and uncertainty in longitude/latitude (right). The top profiles are along a latitude of 7.77 N and the bottom profiles are along a longitude of 38.8 E.
Since geophysical inverse problems are almost invariably underdetermined and hence solutions are nonunique, it is useful to evaluate the robustness of model solutions derived by seismic tomography. Inherent uncertainties in the data and varying raypath coverage mean that it is important to assess which features of a model are required by the data and which are not, so that a model’s robustness can be quantified. Therefore, using the optimized regularization parameters described previously, we evaluate solution robustness using the so-called “checkerboard test” (Glahn and Granet, 1993; Rawlinson and Sambridge, 2003). In this test, the source-receiver configurations of the observational dataset are used to compute a synthetic travel time dataset. This is calculated through an artificial “checkerboard” structure, which is overlain on the original input model. Gaussian noise with a standard deviation of 20 ms is also added to the synthetic datasets to simulate the assumed picking errors in the “real” data.
The checkerboard comprises a 3-D region of alternating high and low velocity anomalies, where the perturbations are set to be ±0.5 km/s for VP (±6.6–16.2%) and ±0.2 km/s (±4.8–9.6%) for VS. The VP/VS input checkerboard is obtained by dividing the VP checkerboard by the VS checkerboard. The tomography is then run with the 1-D reference model as the starting model (whilst also relocating hypocenters) in an attempt to recover the checkerboard pattern. Regions of the solution model that sufficiently recover the checkerboard pattern are considered to be “well-resolved.”
A known weakness of checkerboard tests is that it is possible for small-scale structures to be well retrieved in comparison to larger scale structures (Léveque et al., 1993); consequently, we generate checkerboards with differing scale lengths of ∼8.8, ∼4.4, and ∼2.2 km. By adopting this approach, we are well positioned to interpret both larger and smaller scale structure in regions of good recovery. We also include a spike test to determine the resolution of discrete velocity anomalies. The input spike is comprised of a low VP, high VS and low VP/VS anomaly centered at approximately 7.78N, 28.8E and ∼1 km depth.
The input checkerboard model for VP/VS is shown in Figure 3 and the recovered model is shown in Figure 4. Details of the synthetic recovery tests for VP and VS velocity structure, and the spike test, are presented in Supplementary Section 4 (Supplementary Figures 4.1–4.5). The results of the synthetic testing using a checkerboard structure for the 161 events is presented in horizontal and vertical slices. For the coarse checkerboard (Figure 4A), it is evident that VP/VS anomalies are well resolved within the seismic network and down to at least 10 km depth. Outside of the array and below 10 km depth, however, smearing distorts the recovery and highlights that these regions of the model are much less well resolved. The same features are evident in the intermediate checkerboards (Figure 4B), where the lack of events and poor raypath coverage restrict resolution outside of the network and deeper than 8 km. At a finer scale [Figure 4C], the checkerboard is even less well defined with restricted recovery below sea level and toward the periphery of the array. Cumulatively this suggests we cannot recover structure on length scales finer than 3 km. With respect to the spike test, as expected, the recovered spike exhibits a decrease in amplitude and a larger footprint compared to the input spike (Supplementary Material 4.5); in the E–W direction this is minimal, but is more noticeable in the N–S direction, which is consistent with the raypath coverage. Nevertheless, this test clearly shows that the anomalies recovered at this location in the final model are likely correct.
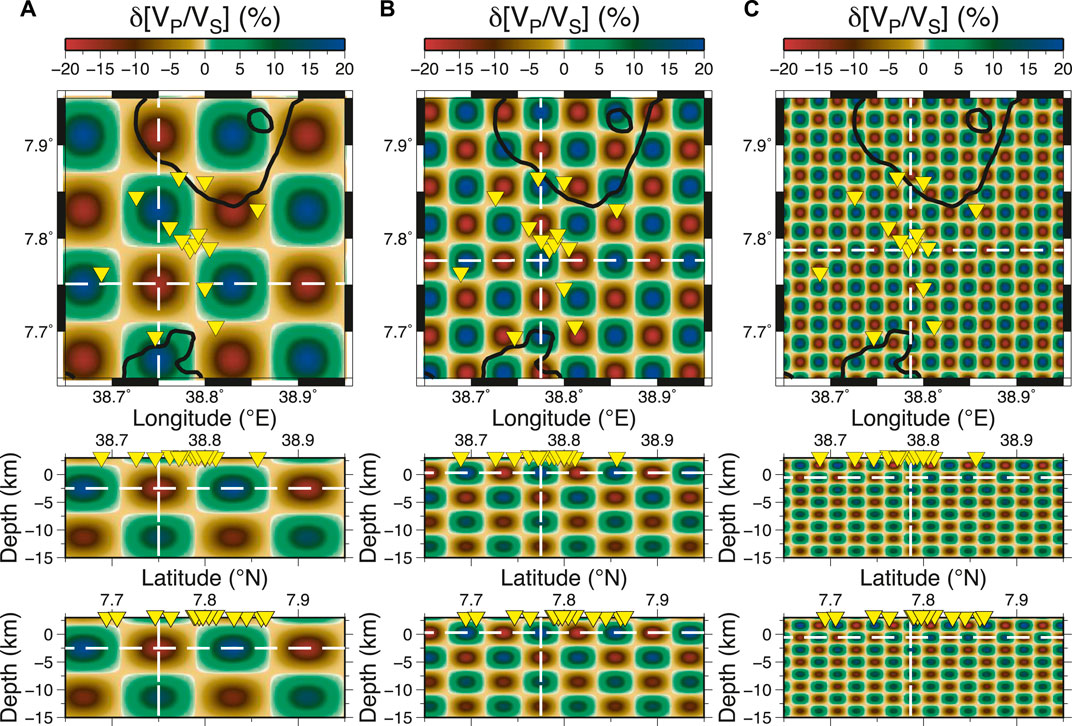
FIGURE 3. Input VP/VS checkerboard models for resolution testing. Slices are taken through the maximum perturbations of (A) coarse (∼8.8 km), (B) intermediate (∼4.4 km) and (C) fine checkerboards (∼2.2 km), to constrain the resolving power at differing scale lengths.
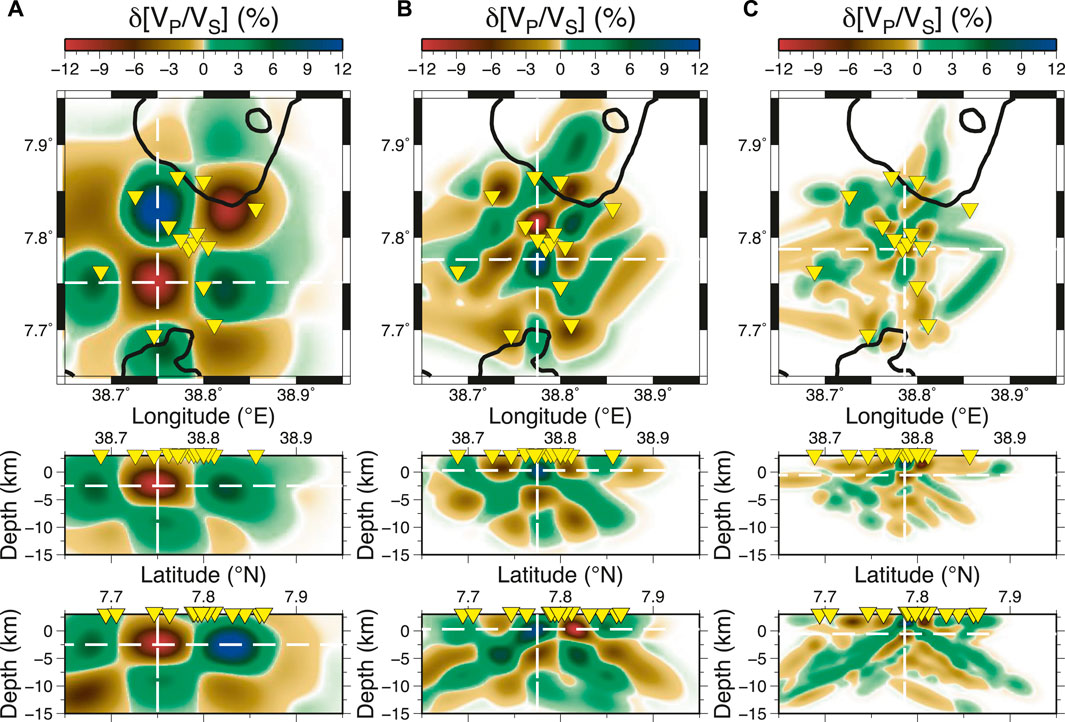
FIGURE 4. Checkerboard recovery results for VP/VS of differing checkerboard scale lengths (A–C). Compare with input checkerboard structure shown in Figure 3. See Supplementary Figures 4.1–4.5 for equivalent VP and VS checkerboard test results.
The observed lack of resolution at depth is caused by the predominance of events occurring between the surface and 10 km depth, with the region beneath relatively aseismic in comparison. Lateral smearing is particularly evident in the north-south depth slices due to the high concentrations of events to the north and south of the caldera and the increased density of ray paths orientated in that direction. The poor recovery of the checkerboard at the edges of the east-west cross-sections is caused by the relative lack of events to the east and west of the network (i.e., toward the border faults). At all scale lengths, the amplitudes of the perturbations are underestimated in comparison to the input checkerboards. This occurs due to the damping and smoothing regularization parameters implemented in the inversion, which favor a conservative solution (in terms of amplitude and wavelength of structure) unless required by the data.
Over a 2-year period between 2012 and 2014, Wilks et al. (2017) located 1,361 earthquakes within 15 km of the center of the caldera. As discussed, in an effort to use only the best located events for imaging and to stabilize the inversions, we use a subset of these data comprised of 161 events and 1,672 source-receiver raypaths. Nevertheless, the resulting patterns in seismicity are similar between the original 1,361 events and the final relocated 161 events. Figure 5 shows how the relocated events change with respect to the original locations and Figure 2 shows the uncertainties in the new event locations. In agreement with Wilks et al. (2017), most events are located above sea level, beneath the volcano edifice. Beneath this lies a gap in seismicity until a depth of roughly 5 km. Figures 2 and 5 show how this seismicity deepens to the north and south, capping what Wilks et al. (2017) interpret as a ductile deeper region. There is a weak bimodal distribution, with more events lying beneath the north and south rim of the volcano. Furthermore, the events cluster along the north-south trend of the AJFZ, which was a particularly clear feature in the original seismicity catalog.
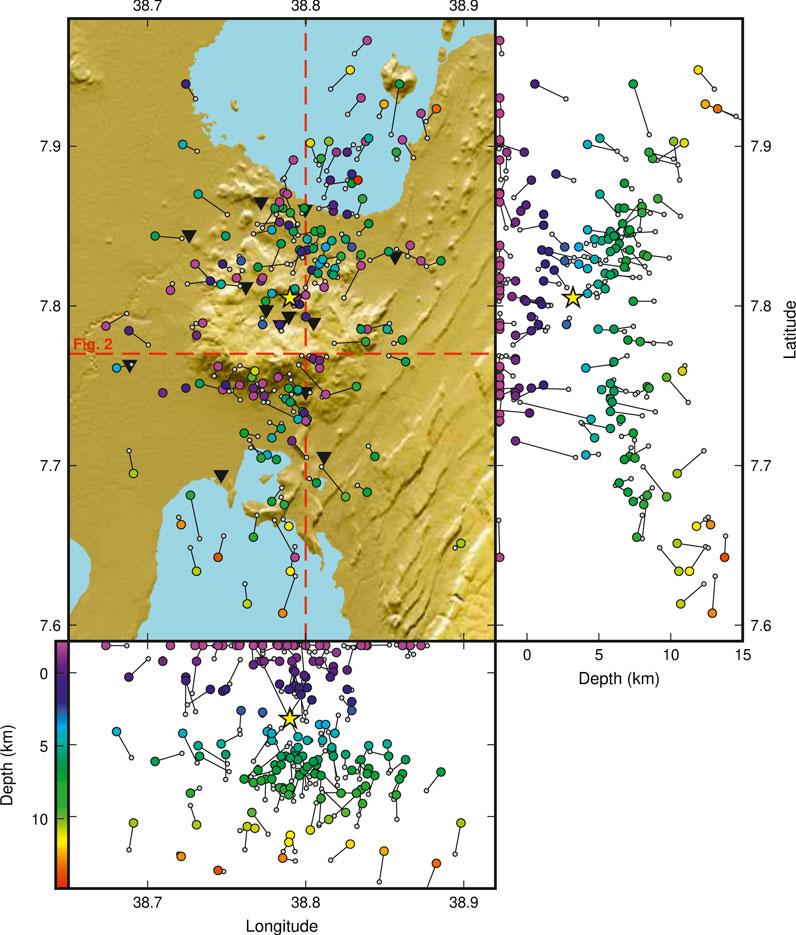
FIGURE 5. Map of original and relocated hypocenters found by joint inversion for velocity structure and earthquake location. Small white circles show the starting location from Wilks et al. (2017), whilst larger circles show the final relocations. Lines connect the original and relocated hypocenters. Color shows the depth of the relocations. The yellow star shows the inferred subsidence source found by Hutchison et al. (2016b). Red dashed lines indicate the location of the north-south and eastwest profiles shown in Figure 2.
Figure 6 shows the VP/VS model obtained from the inversion; the VP and VS models are presented in the Supplementary Material, but Figure 2 shows two cross-sections through the VP model. Poorly constrained regions of the model are masked according to the sum of the absolute values of the Fréchet derivatives, which is a similar approach to the so-called Derivative Weight Sum method (e.g., Biryol et al., 2013). Reduced seismic velocities are more prominent in the P-wave model and in the shallow regions. Low VP/VS ratios of 1.45–1.65 (a Poisson’s ratio of ν = 0.05–0.21) and a negative VP anomaly (up to −5%) extend across the entire range of the volcano that lies above sea level (Figures 2 and 6). The checkerboard tests (Figures 3 and 4; Supplementary Section 3) show that this is a robust and well resolved feature. Deeper than this, average to elevated VP/VS ratio are observed. It is particularly high (>2.0) in the well resolved region beneath the central stations of the caldera between 5 and 8 km deep (Figure 6). Furthermore, we observe an additional high VP/VS region to the south of the caldera at ∼3 km depth (Figure 6). We note that this region is located toward the periphery of the receiver array, but our synthetic resolution tests suggest that it is reasonably well resolved. Due to a lack of deep seismicity, resolution in these models decreases rapidly below ∼10 km.
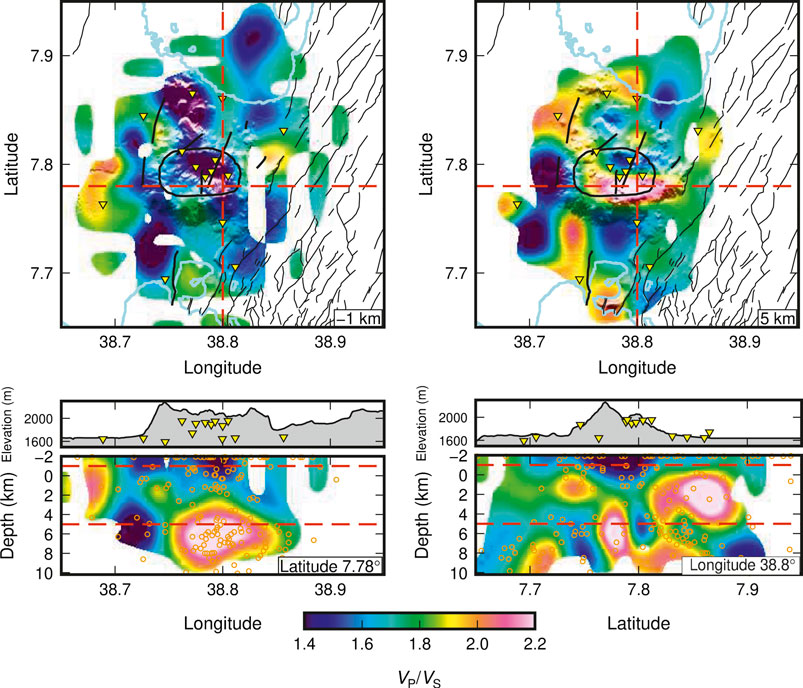
FIGURE 6. Depth slices (at 1 km above sea level and 5 km below sea level) and east–west and north–south cross-sections through the tomographic solution model of the VP/VS structure (shown as an absolute value). The model is only plotted in regions where there is resolution based on Fréchet derivatives (see Supplementary Material). Yellow triangles indicate station locations, black lines on the depth slices indicate mapped fault locations and small open circles on the cross-sections indicate event locations. Topography is shown above the cross-sections and indicated by hillside shading on the depth slices. See Supplementary Material for the VP and VS models.
In summary, a shallow region above sea level and beneath the volcano is characterized by abundant seismicity that follows the trend of faults and fractures in the region. It exhibits low seismic velocities and a low VP/VS ratio. Beneath this lies a region of decreased seismicity with evidence for a narrow high- VP/VS region beneath the volcano. There is also evidence for a high VP/VS region to the south of the volcano. Deeper seismicity marks a brittle region that envelops a more ductile region, deepening to south and north of the caldera. There is some evidence for high VP/VS in this region, but resolution is lacking. In the next section we interpret the shallow region in terms of an active hydrothermal system and the deeper region as magmatic in nature.
A conceptual interpretation of the results is shown in Figure 7. Here we discuss characteristics of the hydrothermal system and the deeper magmatic system and how they interact.
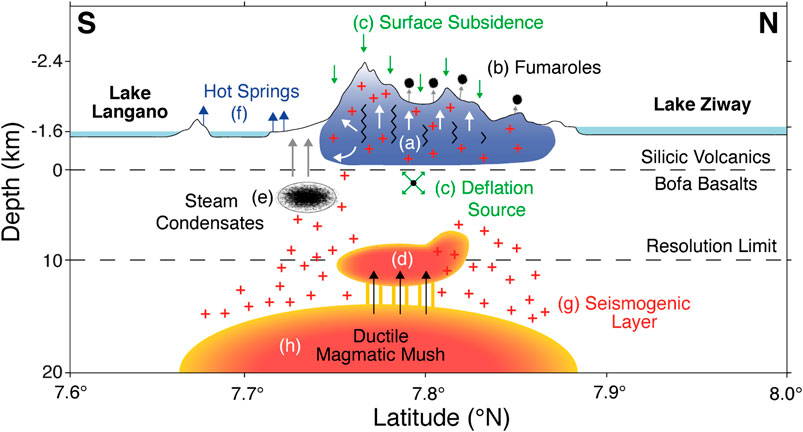
FIGURE 7. Schematic diagram of the interpreted subsurface structure and processes at Aluto, based on the new results and constraints from previously published studies. The key features are: (A) high seismicity within a low VP/VS region of over-pressurized gas at/close to a supercritical state, associated with (B) fumarolic activity and causing (C) outflow driven surface deflation; (D) a high VP/VS region with a significant melt component that has ascended from below; (E) shallow high VP/VS regions of steam condensates that release volatiles to the surface via (F) hot springs; (G) a deeper seismogenic region, convex with latitude; (H) a ductile reservoir of magmatic mush.
We interpret the region of low VP/VS ratios that lies above sea level in terms of an over-pressurized gas-rich volume (e.g., Dvorkin et al., 1999; Lees and Wu, 2000) occupying highly fractured and hydrothermally altered volcanic products. Low Poisson’s ratios are likely amplified by the presence of aligned cracks, fractures and faults, as Poisson’s ratios below 0.1 are uncommon in unfractured isotropic materials (Walsh, 1965). Such structural heterogeneities have been shown to decrease Poisson’s ratio and VP/VS in low stress environments. We suggest that structures such as ring faults and the AJFZ contribute to the low ratios that we observe (Hutchison et al., 2015). These are linked to fumarolic activity around the volcanic edifice and at the surface (see Figures 1; Braddock et al., 2017). This inference is also supported by shear-wave splitting observations, which imply that the volcanic center above sea level is highly fractured due to at least two dominant fracture sets (Nowacki et al., 2018). The sharp transition from low to higher VP/VS at around sea level may also be influenced by the change in lithology from the silicic volcanic rhyolites of Aluto’s recent effusive volcanism and lacustrine sediments to the underlying unit of Bofa Basalt, as observed in well log data (Teklemariam, 1996; Teklemariam et al., 1996). The magnetotelluric (MT) study of Samrock et al. (2015) shows a high conductivity (1–2 Ω m) layer above sea level, which they interpret as a hydrothermally altered clay cap.
Experiments show that the compressibility of supercritical fluids bears a greater resemblance to steam than liquid and can also produce low VP/VS anomalies in the subsurface (Burnham et al., 1969). At Aluto, deep well data (to 2,500 m below the surface) have shown that temperatures reach a maximum of 360°C at pressures greater than 22 MPa (Gizaw, 1993), conditions at or above the threshold required for water to become supercritical (e.g., Chouet et al., 2008; Zollo et al., 2008). Under the assumption that this maximum temperature is exceeded, we suggest that supercritical fluids might also contribute to the low VP/VS anomaly.
High VP/VS ratios in volcanic regions are commonly associated with the presence of partial melt in the crust (e.g., Hammond and Kendall, 2016). Fluids have a shear modulus of zero, which reduces VS in partially molten rocks. In the absence of gas there is little change in fluid compressibility and therefore little change in VP. Hence, the high VP/VS regions beneath sea level in our inversion results suggests a region of partial melt at depth beneath the hydrothermal system. A crystalline mush zone has also been suggested by Gleesen et al. (2017), who through phase equilibria modeling proposed a magma storage depth of 5.6 ± 1 km below the surface. However, it is difficult to convert VP/VS ratios to melt volume fraction, as seismic velocities are as sensitive to the shape of melt inclusions as they are to volume fraction (Hammond and Kendall, 2016).
Due to the underlying physics and differences in array geometries, there are often differences between seismic and magnetotelluric images of melt reservoirs (e.g., Whaler and Hautot, 2016; Pritchard et al., 2018). Seismic velocities are sensitive to volume fraction of melt and the shape of the melt inclusions (wetting angle) whereas MT is most sensitive to the connectivity, composition and amount of melt. Previous MT studies show the Aluto upper crust that lies beneath sea level to be relatively resistive (>100 Ω m) and hence melt-poor (Samrock et al., 2015; Hübert, et al., 2018), whereas we see localized regions of high (>2.0) VP/VS values suggesting the presence of partial melt. A suggested explanation for some discrepancy between MT and seismic results is that the melt exists in isolated pockets which are not sufficiently connected for the rock to be conductive. Alternatively, low temperature peralkaline melts with a low wt% H2O are relatively resistive and consistent with the observed values (Guo et al., 2016; Hübert, et al., 2018). Such low water content could be achieved following repeated cycles of melting and recrystallisation within a long-lived crystal mush zone. However, the more recent study of Samrock et al. (2020), which reprocessed the same data using the method of Grayver et al. (2019), but accounts for topography and galvanic distortion, shows evidence of moderately conductive (10–20 Ω m) regions in an otherwise resistive crust below sea level. These values can be explained with higher temperature and melt fractions.
The hypocentral relocations improve the delineation of the convex lower boundary of seismicity, which corresponds to the brittle-ductile transition. This boundary is roughly 5 km beneath the edifice, but deepens to 15 km to the north and south (Figure 7G). Our error analysis of the relocations suggest, with most events having <3 km uncertainties both laterally and in depth, that the pattern of seismicity is robust. While a contribution to hypocenter depth uncertainty may also come from the velocity-depth trade-off, the simple convex shape of seismicity spans the entire model in the N–S direction, which would require a very broad, coherent and high amplitude velocity anomaly to explain the convexity (noting that at 10 km depth, a 1 km increase in hypocenter depth would require a ∼10% increase in the overlying velocity, assuming a background velocity of 5 km/s). As such, we propose that the general increase in depth of the seismicity zone away from the volcanic center is meaningful. Deepening of seismicity away from volcanic centers has also been observed at Corbetti (Lavayssière, et al., 2019) and at Fentale and Dofen, which are volcanoes in the northern MER (Keir et al., 2006), where earthquakes occurred between 8 and 10 km depth beneath each volcano but as deep as 16 km elsewhere in the magmatic segment. Similarly, Hudson et al. (2017) see a similar pattern directly beneath Bárðarbunga caldera in Iceland.
A lack of seismicity more than 10 km below the center of the volcano implies a hot, ductile crust, which in turn may suggest a melt-rich mush storage region, consistent with petrological observations (Hutchison, et al., 2016a). There is also some suggestion of a conductive body at these depths beneath Aluto (Samrock et al., 2020). We also see some evidence for high VP/VS ratios in this region, but note that the resolution of our VP/VS inversions is poor below 10 km depth. However, these results together with the convex pattern of deep seismicity observed at Aluto suggests that the seismicity delineates the upper boundary of a region of higher heat flux (spanning ∼20 km laterally), which has a more ductile rheology and little seismicity (Figure 7H). This is also consistent with the models of the upper crustal plumbing systems at other rift calderas such as Corbetti (Gottsmann et al., 2020).
Aluto is a rapidly deforming volcano which shows episodic ground deformation (Biggs, et al., 2011; Hutchison et al., 2016b). Hutchison et al. (2016b) proposed that the uplift was caused by injection of new material into the magmatic system, and subsidence was associated with the magmatic degassing and depressurization of the hydrothermal system. Based on MT results that show a clay cap ∼500 m thick and ∼2–3 km wide, Samrock et al. (2015) also propose that swelling clays and freshwater incursion may be agents for uplift and subsidence at Aluto. Our model, however, suggests the presence of velocity anomalies of significantly larger dimensions and hence supports the hypothesis that the driver of deformation is deeper in origin. Proximal seismicity and high VP/VS ratios delineate a narrow region that connects a deeper magmatic body to the hydrothermal system. Support for this comes from carbon isotope sampling, which shows that Aluto’s magmatic and hydrothermal systems are physically connected, where deep (>2 km), hot (>250°C) geothermal fluids receive ongoing input of magmatic volatiles from beneath (Hutchison et al., 2016b). We therefore propose that it is episodic pulses of magma injection at depth that drives this volatile release, which then causes the uplift-subsidence events observed at the surface in this coupled system. Similar mechanisms have been proposed at other volcanoes (e.g., Bárðarbunga, Iceland—Hudson et al., 2017; Corbetti, Ethiopia—Lloyd et al., 2018b).
Reservoir seismicity occurs with deformation, which can be associated with inflation (e.g., Stork et al., 2015) or deflation (e.g., Segall, 1989; van Thienen-Visser and Breunese, 2015), both of which can be at play in a coupled magmatic and hydrothermal system. A sudden release of volatiles from the deeper magmatic system can lead to over-pressured gases within the hydrothermal system (Battaglia et al., 2006), which in turn leads to inflation. The subsequent outflow of volatiles and hydrothermal fluids from the geothermal system generates subsidence at the surface (De Natale et al., 2001), which at Aluto was observed for the majority of the seismic experiment (Wilks et al., 2017). The sources responsible for significant (>4.3 cm) subsidence prior to 2012 have been located in the uppermost 2–3 km (Biggs et al., 2011; Hutchison et al., 2016b), which correlates with the base of our low VP/VS region (Figure 6). We note that there may also be subsidence effects associated with cooling.
Campi Flegrei, another young, geothermally-active caldera in a state of unrest, exhibits similar gaseous controls in a shallow seismogenic zone (Di Vito et al., 1999; Chiarabba and Moretti, 2006; Battaglia et al., 2008; Chiodini et al., 2012; De Siena et al., 2017). The values of the low VP/VS anomaly are similar in magnitude to those observed at Aluto (∼1.45), with an accompanying low VP anomaly, estimated to be the primary source location of subsidence. At Campi Flegrei, it has been suggested that supercritical fluids beneath a more rigid clay cap are responsible for uplift (Vanorio and Kanitpanyacharoen, 2015). We suggest that shallow hydrothermal processes at Aluto are comparable to Campi Flegrei in terms of the structure and the processes that drive seismicity and deformation. However, the low VP/VS anomaly at Aluto seems to be within or above the clay cap (Samrock et al., 2015). We attribute high-pressure gas phases and the subsequent outflow from the geothermal reservoir as the primary cause of subsidence in the absence of any eruptive behavior. As these are the first seismic images of the volcanoes of the MER, it is not clear how unique Aluto is with respect to other volcanoes in the MER.
The high VP/VS (Figure 6) region to the south of the caldera at 3 km depth may represent steam condensates (Figure 7E) that manifest at shallower depths, away from the main volcanic edifice where temperatures are reduced (Aster and Meyer, 1988; Simiyu, 1999). Samrock et al. (2020) observe a highly conductive anomaly at the same depth but more to the east of the volcano. Condensates may form brines that then migrate toward the surface due to increasing pore pressure along fracture networks associated with the AJFZ (Hutchison et al., 2016b). These may feed or heat the hot springs seen at the surface near Lake Langano (Figures 1 and 7F) (Kebede et al., 1985; Hutchison et al., 2015; Braddock et al., 2017; Hochstein et al., 2017). This is also compatible with the elevation-driven, southerly groundwater flow direction from Lake Ziway to Lake Langano (Bernacsek et al., 1992).
Aluto, one of numerous calderas in the MER, is a surface expression of magma-assisted continental rifting. As rifting progresses, strain is localised in magmatic segments rather than the border faults. However, how magma at depth (e.g., as tomographically imaged, for example, by Bastow et al., 2005 and Gallacher et al., 2016) feeds the axial magmatic segments of the MER is still to be determined.
Our study has produced the first seismic images of Aluto, a geothermally active volcano in the Main Ethiopian Rift, which was only recently discovered to be in a state of unrest. These images, coupled with the relocated earthquake hypocenters, provide constraints on the plumbing system beneath the volcano, which has provided new insight into its possible pre-eruptive behavior. Major findings include: 1) a volatile-rich ductile “magmatic mush” region below 10 km depth, which is capped by a convex layer of seismicity; 2) a region of elevated VP/VS at intermediate depths (5–8 km), also defined by an absence of seismicity, which likely represents the storage of partially molten material from below; 3) the presence of shallow and localized high VP/VS zones away from the volcano, which may represent concentrations of steam condensates that release volatiles to the surface; and 4) a shallow volume of rock (above sea level) containing over-pressurized gas at or close to supercritical conditions (defined by abundant seismicity, low VP and low VP/VS). Together, these findings demonstrate that unrest at Aluto is driven by the coupling between magma ascent and hydrothermal response, which produce the inflationary and deflationary episodes that have been recently observed. This model is likely applicable to other hydrothermally active volcanoes in a state of unrest.
The seismic dataset analyzed for this study is open access and available on IRIS (Network Code XM). See Wilks et al. (2017) for more information on the ARGOS seismic project. Files containing the final VP, VS and VP/VS solution models and the relocated hypocenters are available at https://doi.org/10.6084/m9.figshare.5892775.v4.
MW processed the data, performed the analysis and wrote the first draft of the paper, as part of his PhD, which was supervised by JK and JW. JK and JB formulated the project. NR developed the inversion code and provided guidance on its use and implementation, and interpretations. MW, JK, AA, AN, and JB acquired the field data. All authors contributed to the interpretation of the results and the writing of the paper. MW, NR, and AN prepared the Figures.
The Bristol University Microseismic ProjectS (BUMPS) provided funding for the seismic experiment and the equipment was loaned from SEIS-UK, a NERC Service and Facility (GEF loan 962). MW was funded by an EPSRC studentship. AN was funded by BUMPS, a Leverhulme Early Career Fellowship, and a NERC standard grant (NE/R001154/1, REMIS: Reliable Earthquake Magnitudes for Induced Seismicity). JW and AN received funding from the European Research Council under the European Union’s Seventh Framework Program (FP7/2007–2013)—ERC Grant agreement 240473, CoMITAC. JB was funded by NERC COMET. JB and JMK were funded by the Natural Environment Research Council (NERC) RiftVolc Large Grant (NE/L013932/1, Rift volcanism: past, present, and future).
The authors declare that the research was conducted in the absence of any commercial or financial relationships that could be construed as a potential conflict of interest.
The handling editor declared a past co-authorship with one of the authors NR.
We thank Tom Hudson for useful discussions and helpful comments on the manuscript. Comments from two reviewers, the guest editor, LD, and the chief editor, Valerio Acocella, helped improve the presentation; we thank them for their time and efforts.
The Supplementary Material for this article can be found online at: https://www.frontiersin.org/articles/10.3389/feart.2020.579699/full#supplementary-material
Agostini, A., Bonini, M., Corti, G., Sani, F., and Mazzarini, F. (2011). Fault architecture in the Main Ethiopian Rift and comparison with experimental models: implications for rift evolution and Nubia-Somalia kinematics. Earth Planet. Sci. Lett. 301, 479–492. doi:10.1016/j.epsl.2010.11.024
Aster, R. C., and Meyer, R. P. (1988). Three-dimensional velocity structure and hypocenter distribution in the Campi Flegrei caldera, Italy. Tectonophysics 149, 195–218. doi:10.1016/0040-1951(88)90173-4
Bastow, I. D., Stuart, G. W., Kendall, J.-M., and Ebinger, C. J. (2005). Upper‐mantle seismic structure in a region of incipient continental breakup: northern Ethiopian rift. Geophys. J. Int. 162 479–493. doi:10.1111/j.1365-246X.2005.02666.x
Battaglia, J., Zollo, A., Virieux, J., and Dello Iacono, D. (2008). Merging active and passive data sets in traveltime tomography: the case study of Campi Flegrei caldera (Southern Italy). Geophys. Prospect. 56, 555–573. doi:10.1111/j.1365-2478.2007.00687.x
Battaglia, M., Troise, C., Obrizzo, F., Pingue, F., and De Natale, G. (2006). Evidence for fluid migration as the source of deformation at Campi Flegrei caldera (Italy). Geophys. Res. Lett. 33, a. doi:10.1029/2005GL024904
Bernacsek, G. M., Hughes, J. S., and Hughes, R. H. (1992). A directory of African Wetlands, Cambridge: IUCN, UNEP and WCMC, 820.
Biggs, J., Bastow, I. D., Keir, D., and Lewi, E. (2011). Pulses of deformation reveal frequently recurring shallow magmatic activity beneath the Main Ethiopian Rift. Geochem. Geophys. Geosyst. 12, 1–11. doi:10.1029/2011GC003662
Birhanu, Y., Wilks, M., Biggs, J., Kendall, J. M., Ayele, A., and Lewi, E. (2019). Seasonal patterns of seismicity and deformation at the Alutu geothermal reservoir, Ethiopia, induced by hydrological loading. J. Volcanol. Geother. Res. 356, 175–182. doi:10.1016/j.jvolgeores.2018.03.008
Biryol, C. B., Leahy, G. M., Zandt, G., and Beck, S. L. (2013). Imaging the shallow crust with local and regional earthquake tomography. J. Geophys. Res. Solid Earth. 118, 2289–2306. doi:10.1002/jgrb.50115
Braddock, M., Biggs, J., Watson, I. M., Hutchison, W., Pyle, D. M., and Mather, T. A. (2017). Satellite observations of fumarole activity at Aluto volcano, Ethiopia: implications for geothermal monitoring and volcanic hazard. J. Volcanol. Geothermal Res. 341, 70–83. doi:10.1016/j.jvolgeores.2017.05.006
Brown, S. K., Sparks, R. S. J., Mee, K., Vye-Brown, C., Ilyinskaya, E., Jenkins, S. F., et al. (2015). “Country and regional profiles of volcanic hazard and risk,” in Global volcanic hazards and risk, Editors S. C. Loughlin, R. S. J. Sparks, S. K. Brown, S. F. Jenkins, and C. Vye-Brown. Cambridge: Cambridge University Press.
Burnham, C. W., Holloway, J. R., and Davis, N. F. (1969). Thermodynamic properties of water to 1,000° C and 10,000 bars. Geo. Soc. Am. Spec. Paper. 132, 1–96. doi:10.1130/SPE132-p1
Chiarabba, C., and Moretti, M. (2006). An insight into the unrest phenomena at the Campi Flegrei caldera from Vp and Vp/Vs tomography. Terra. Nova. 18, 373–379. doi:10.1111/j.1365-3121.2006.00701.x
Chiodini, G., Caliro, S., De Martino, P., Avino, R., and Gherardi, F. (2012). Early signals of new volcanic unrest at Campi Flegrei caldera? Insights from geochemical data and physical simulations. Geology 40, 943–946. doi:10.1130/g33251.1
Chouet, B., Dawson, P., and Martini, M. (2008). Shallow-conduit dynamics at Stromboli Volcano, Italy, imaged from waveform inversions. Geo. Soc. Lond. 307, 57–84. doi:10.1144/SP307.5
Daly, E., Keir, D., Ebinger, C. J., Stuart, G. W., Bastow, I. D., and Ayele, A. (2008). Crustal tomographic imaging of a transitional continental rift: the Ethiopian rift. Geophys. J. Int. 172, 1033–1048. doi:10.1111/j.1365-246X.2007.03682.x
Dawson, P., Chouet, B. A., and Pitt, A. (2016). Tomographic image of a seismically active volcano: Mammoth Mountain, California. J. Geophys. Res. Solid Earth. 121, 114–133. doi:10.1002/2015JB012537
de Kool, M., Rawlinson, N., and Sambridge, M. (2006). A practical grid-based method for tracking multiple refraction and reflection phases in three-dimensional heterogeneous media. Geophys. J. Int. 167, 253–270. doi:10.1111/j.1365-246X.2006.03078.x
De Natale, G., Troise, C., and Pingue, F. (2001). A mechanical fluid-dynamical model for ground movements at Campi Flegrei caldera. J. Geodyn. 32, 487–517. doi:10.1016/S0264-3707(01)00045-X
De Siena, L., Chiodini, G., Vilardo, G., Del Pezzo, E., Castellano, S. C., Colombelli, S., et al. (2017). Source and dynamics of a volcanic caldera unrest: Campi Flegrei, 1983–84. Sci. Rep. 7, 8099. doi:10.1038/s41598-017-08192-7
Di Vito, M. A., Isaia, R., Orsi, G., Southon, J., de Vita, S., D’Antonio, M., et al. (1999). Volcanism and deformation since 12,000 years at the Campi Flegrei caldera (Italy). J. Volcanol. Geothermal Res. 91, 221–246. doi:10.1016/S0377-0273(99)00037-2
Dvorkin, J., Mavko, G., and Nur, A. (1999). Overpressure detection from compressional- and shear-wave data. Geophys. Res. Lett. 26, 3417–3420. doi:10.1029/1999gl008382
Eberhart-Phillips, D. (1986). Three-dimensional velocity structure in northern California coast ranges from inversion of local earthquake arrival times. Bull. Seis. Soc. Am. 76(4), 1025–1052.
E. L. C. Electroconsult (1986). “Exploitation of Langano-Aluto geothermal resources feasibility report,” in Geothermal exploration project, Ethiopian lake district rift. Milano, Italy: Tech. Rep., Ministry of Mines and Energy. 1-iii/8-7.
Gallacher, R. J., Keir, D., Harmon, N., Stuart, G., Leroy, S., Hammond, J. O. S., et al. (2016). The initiation of segmented buoyancy-driven melting during continental breakup. Nat. Commun. 7, 13110. doi:10.1038/ncomms13110
Gianelli, G., and Teklemariam, M. (1993). Water-rock interaction processes in the Aluto-Langano geothermal field (Ethiopia). J. Volcanol. Geothermal Res. 56, 429–445. doi:10.1016/0377-0273(93)90007-E
Gizaw, B. (1993). Aluto-Langano geothermal field, Ethiopian Rift Valley: physical characteristics and the effects of gas on well performance. Geothermics 22, 101–116. doi:10.1016/0375-6505(93)90050-W
Glahn, A., and Granet, M. (1993). Southern Rhine Graben: small-wavelength tomographic study and implications for the dynamic evolution of the Graben. Geophys. J. Int. 113, 399–418. doi:10.1111/j.1365-246x.1993.tb00896.x
Gleeson, M. L. M., Stock, M. J., Pyle, D. M., Mather, T. A., Hutchison, W., Yirgu, G., et al. (2017). Constraining magma storage conditions at a restless volcano in the Main Ethiopian Rift using phase equilibria models. J. Volcanol. Geothermal Res. 337, 44–61. doi:10.1016/j.jvolgeores.2017.02.026
Gottsmann, J., Biggs, J., Lloyd, R., Biranhu, Y., and Lewi, E. (2020). Ductility and compressibility accommodate high magma flux beneath a silicic continental rift caldera: insights from Corbetti caldera (Ethiopia). Geochem. Geophys. Geosyst. 21, e2020GC008952. doi:10.1029/2020GC008952
Grayver, A. V., van Driel, M., and Kuvshinov, A. V. (2019). Three-dimensional magnetotelluric modelling in spherical Earth. Geophys. J. Int. 217 (1), 532–557. doi:10.1093/gji/ggz030
Greenfield, T., Keir, D., Kendall, J.-M., and Ayele, A. (2019b). Low-frequency earthquakes beneath Tullu Moye volcano, Ethiopia, reveal fluid pulses from shallow magma chamber. Earth Planet. Sci. Lett. 526, 115782. doi:10.1016/j.epsl.2019.115782
Greenfield, T., Keir, D., Kendall, J. M., and Ayele, A. (2019a). Seismicity of the Bora‐Tullu Moye Volcanic Field, 2016–2017. Geochem. Geophys. Geosyst. 20, 548–570. doi:10.1029/2018gc007648
Greenfield, T., White, R. S., and Roecker, S. (2016). The magmatic plumbing system of the Askja central volcano, Iceland, as imaged by seismic tomography. J. Geophys. Res. Solid Earth. 121, 7211–7229. doi:10.1002/2016JB013163
Guo, X., Zhang, L., Behrens, H., and Ni, H. (2016). Probing the status of felsic magma reservoirs: Constraints from the P–T-H2O dependences of electrical conductivity of rhyolitic melt. Earth Planet. Sci. Lett. 433, 54–62. doi:10.1016/j.epsl.2015.10.036
Hübert, J., Whaler, K., and Fisseha, S. (2018). The electrical structure of the Central Main Ethiopian Rift as imaged by magnetotellurics: implications for magma storage and pathways. J. Geophys. Res. Solid Earth. 123, 6019–6032. doi:10.1029/2017jb015160
Hammond, J. O. S., and Kendall, J. M. (2016). "Constraints on melt distribution from seismology: a case study in Ethiopia,” in Magmatic rifting and active volcanism. Editors T. J. Wright, A. Ayele, D. J. Ferguson, T. Kidane, and C. Vye-Brown (London: Special Publications), 420. doi:10.1144/SP420.14
Hansen, S. (2004). Seismic velocity and Attenuation structure of the east rift zone and south Flank of Kilauea volcano, Hawaii. Bull. Seismol. Soc. Am. 94, 1430–1440. doi:10.1785/012003154
Harris, J. M., Langan, R. T., Fasnacht, T., Melton, D., Smith, B., Sinton, J., et al. (1996). Experimental verification of seismic monitoring of CO2 injection in carbonate reservoirs. SEG Technical Program Expanded Abstracts, 1870–1872. doi:10.1190/1.1826505
Hochstein, M. P., Oluma, B., and Hole, H. (2017). Early exploration of the Aluto geothermal field, Ethiopia (history of discovery well LA-3). Geothermics 66, 73–84. doi:10.1016/j.geothermics.2016.11.010
Hooft, E. E. E., Heath, B. A., Toomey, D. R., Paulatto, M., Papazachos, C. B., Papazachos, C. B., Nomikou, P., et al. . (2019). Seismic imaging of Santorini: subsurface constraints on caldera collapse and present-day magma recharge. Earth Planet. Sci. Lett. 514, 48–61. doi:10.1016/j.epsl.2019.02.033
Hudson, T. S., White, R. S., Greenfield, T., Ágústsdóttir, T., Brisbourne, A., and Green, R. G. (2017). Deep crustal melt plumbing of Bárðarbunga volcano, Iceland, Geophys. Res. Lett. 44, 8785–8794. doi:10.1002/2017GL074749.
Hutchison, W., Biggs, J., Mather, T. A., Pyle, D. M., Lewi, E., Yirgu, G., et al. (2016b). Causes of unrest at silicic calderas in the East African Rift: new constraints from InSAR and soil-gas chemistry at Aluto volcano, Ethiopia. Geochem. Geophys. Geosyst. 17, 3008–3030. doi:10.1002/2016GC006395
Hutchison, W., Mather, T. A., Pyle, D. M., Biggs, J., and Yirgu, G. (2015). Structural controls on fluid pathways in an active rift system: a case study of the Aluto volcanic complex. Geosphere 11, 542–562. doi:10.1130/GES01119.1
Hutchison, W., Pyle, D. M., Mather, T. A., Yirgu, G., Biggs, J., Cohen, B. E., et al. (2016a). The eruptive history and magmatic evolution of Aluto volcano: new insights into silicic peralkaline volcanism in the Ethiopian rift. J. Volcanol. Geothermal Res. 328, 9–33. doi:10.1016/j.jvolgeores.2016.09.010
Jaxybulatov, K., Koulakov, I., Seht, M. I.-V., Klinge, K., Reichert, C., Dahren, B., et al. (2011). Evidence for high fluid/melt content beneath Krakatau volcano (Indonesia) from local earthquake tomography. J. Volcanol. Geothermal Res. 206, 96–105. doi:10.1016/j.jvolgeores.2011.06.009
Johnson, J. H., and Poland, M. P. (2013). Seismic detection of increased degassing before Kīlauea’s 2008 summit explosion. Nat. Commun. 4, 1668. doi:10.1038/ncomms2703
Julian, B. R., Pitt, A. M., and Foulger, G. R. (1998). Seismic image of a CO2 reservoir beneath a seismically active volcano. Geophys. J. Int. 133, F7–F10. doi:10.1046/j.1365-246X.1998.1331540.x
Kebede, S., Mamo, T., and Abebe, T. (1985). Explanation to the geological map of Aluto-Langano geothermal area. Geothermal exploration project Report No. 26. Ethiopia: Ministry of Mines and energy, Ethiopian Institute of Geological Surveys, 60.
Keir, D., Ebinger, C. J., Stuart, G. W., Daly, E., and Ayele, A. (2006). Strain accommodation by magmatism and faulting as rifting proceeds to breakup: seismicity of the northern Ethiopian rift. J. Geophys. Res. 111 a. doi:10.1029/2005JB003748
Kennett, B. L. N., Sambridge, M. S., and Williamson, P. R. (1988). Subspace methods for large inverse problems with multiple parameter classes. Geophys. J. Int. 94, 237–247. doi:10.1111/j.1365-246X.1988.tb05898.x
Koulakov, I., Yudistira, T., Luehr, B.-G., and Wandono (2009). P,Svelocity and VP/VSratio beneath the Toba caldera complex (Northern Sumatra) from local earthquake tomography. Geophys. J. Int. 177, 1121–1139. doi:10.1111/j.1365-246X.2009.04114.x
Léveque, J.-J., Rivera, L., and Wittlinger, G. (1993). On the use of the checkerboard test to assess the resolution of tomographic inversions. Geophys. J. Int. 115, 313–318. doi:10.1111/j.1365-246X.1993.tb05605.x
Lavayssière, A., Greenfield, T., Keir, D., Ayele, A., and Kendall, J.-M. (2019). Local seismicity near the actively deforming Corbetti volcano in the Main Ethiopian Rift. J. Volcanol. Geothermal Res. 381, 227–237. doi:10.1016/j.jvolgeores.2019.06.008
Lees, J. M., and Wu, H. (2000). Poisson’s ratio and porosity at Coso geothermal area, California. J. Volcanol. Geothermal Res. 95, 157–173. doi:10.1016/S0377-0273(99)00126-2
Lloyd, R., Biggs, J., Birhanu, Y., Wilks, M., Gottsmann, J., Kendall, J.-M., et al. (2018a). Sustained uplift at a continental rift caldera. J. Geophys. Res. Solid Earth. 123 (6), 5209–5226. doi:10.1029/2018JB015711.
Lloyd, R., Biggs, J., Wilks, M., Nowacki, A., Kendall, J.-M., Ayele, A., et al. (2018b). Evidence for cross rift structural controls on deformation and seismicity at a continental rift caldera. Earth Planet. Sci. Lett. 487, 190–200. doi:10.1016/j.epsl.2018.01.037
Lomax, A., Virieux, J., Volant, P., and Berge-Thierry, C. (2000). “Probabilistic earthquake location in 3D and layered models—introduction of a Metropolis-Gibbs method and comparison with linear locations,” in Advances in seismic event location. Editors C. H. Thurber and N. Rabinowitz (Amsterdam: Kluwer), 101–134.
Mavko, G., and Mukerji, T. (1995). Seismic pore space compressibility and Gassmann’s relation. Geophysics 60, 1743–1749. doi:10.1190/1.1443907
Muksin, U., Bauer, K., and Haberland, C. (2013). Seismic Vp and Vp/Vs structure of the geothermal area around Tarutung (North Sumatra, Indonesia) derived from local earthquake tomography. J. Volcanol. Geothermal Res. 260, 27–42. doi:10.1016/j.jvolgeores.2013.04.012
Nowacki, A., Wilks, M., Kendall, J.-M., Biggs, J., and Ayele, A. (2018). Characterising hydrothermal fluid pathways beneath Aluto volcano, Main Ethiopian Rift, using shear wave splitting. J. Volcanol. Geothermal Res. 356, 331–341. doi:10.1016/j.jvolgeores.2018.03.023
Pilia, S., Rawlinson, N., Direen, N. G., Cummins, P. R., and Balfour, N. (2013). Structural controls on localized intraplate deformation and seismicity in Southern Australia: insights from local earthquake tomography of the Flinders Ranges. J. Geophys. Res. Solid Earth. 118, 2176–2190. doi:10.1002/jgrb.50168
Prejean, S., Ellsworth, W., Zoback, M., and Waldhauser, F. (2002). Fault structure and kinematics of the Long Valley Caldera region, California, revealed by high‐accuracy earthquake hypocenters and focal mechanism stress inversions. J. Geophys. Res. 107 (B12), 9. doi:10.1029/2001JB001168.
Pritchard, M. E., de Silva, S. L., Michelfelder, G., Zandt, G., McNutt, S. R., Gottsmann, J., et al. (2018). Synthesis: PLUTONS: investigating the relationship between pluton growth and volcanism in the Central Andes. Geosphere 14(3), 954–982. doi:10.1130/GES01578.1
Pritchard, M. E., Mather, T. A., McNutt, S. R., Delgado, F. J., and Reath, K. (2019). Thoughts on the criteria to determine the origin of volcanic unrest as magmatic or non-magmatic. Phil. Trans. R. Soc. A. 377 (2139), 20180008. doi:10.1098/rsta.2018.0008
Rawlinson, N., and Sambridge, M. (2003). “Seismic traveltime tomography of the crust and lithosphere,” in Advances in geophysics, Editor R. Dmowska (New York, NY: Elsevier), Vol. 46, 81–198. doi:10.1016/S0065-2687(03)46002-0
Rawlinson, N., and Urvoy, M. (2006). Simultaneous inversion of active and passive source datasets for 3-D seismic structure with application to Tasmania. Geophys. Res. Lett. 33, L24213. doi:10.1029/2006GL028105
Reinsch, T., Dobson, P., Asanuma, H., Huenges, E., Poletto, F., and Sanjuan, B. (2017). Utilizing supercritical geothermal systems: a review of past ventures and ongoing research activities. Geotherm. Energy. 5, 16. doi:10.1186/s40517-017-0075-y
Sambridge, M. S., and Kennett, B. L. N. (1986). A novel method of hypocentre location. Geophys. J. Int. 87 (2), 679–697. doi:10.1111/j.1365-246X.1986.tb06644.x
Samrock, F., Grayver, A. V., Cherkose, B., Kuvshinov, A., and Saar, M. O. (2020). “Aluto-Langano geothermal field, Ethiopia: complete image of underlying magmatic-hydrothermal system revealed by revised interpretation of magnetotelluric data,” in World geothermal Congress (WGC 2021).
Samrock, F., Kuvshinov, A., Bakker, J., Jackson, A., and Fisseha, S. (2015). 3-D analysis and interpretation of magnetotelluric data from the Aluto-Langano geothermal field, Ethiopia. Geophys. J. Int. 202, 1923–1948. doi:10.1093/gji/ggv270
Segall, P. (1989). Earthquakes triggered by fluid extraction, Geol 17, 942–946. doi:10.1130/0091-7613(1989)017<0942:etbfe>2.3.co;2
Simiyu, S. (1999). “Seismic velocity analysis in the Olkaria geothermal field,” in Twenty-fourth workshop on geothermal reservoir Engineering, Stanford University, Menlo Park, CA, 7.
Stork, A. L., Verdon, J. P., and Kendall, J.-M. (2015). The microseismic response at the in Salah carbon capture and storage (CCS) site. Int. J. Greenhouse Gas Control. 32, 159–171. doi:10.1016/j.ijggc.2014.11.014
Syracuse, E. M., Abers, G. A., Fischer, K., MacKenzie, L., Rychert, C., Protti, M., et al. (2008). Seismic tomography and earthquake locations in the Nicaraguan and Costa Rican upper mantle. Geochem. Geophys. Geosyst. 9, a. doi:10.1029/2008GC001963
Teklemariam, M., Battaglia, S., Gianelli, G., and Ruggieri, G. (1996). Hydrothermal alteration in the Aluto-Langano geothermal field, Ethiopia. Geothermics, 25, 679–702. doi:10.1016/S0375-6505(96)00019-3
Teklemariam, M. (1996). Water-rock interaction processes in the Aluto-Langano geothermal field, Ethiopia. Ph.D. Thesis, University of Pisa, 245 p.
Troise, C., De Natale, G., Schiavone, R., Somma, R., and Moretti, R. (2019). The Campi Flegrei caldera unrest: discriminating magma intrusions from hydrothermal effects and implications for possible evolution. Earth-Sci. Rev. 188, 108–122. doi:10.1016/j.earscirev.2018.11.007
van Thienen-Visser, K., and Breunese, J. N. (2015). Induced seismicity of the Groningen gas field: history and recent developments. Lead. Edge. 34, 664–671. doi:10.1190/tle34060664.1
Vanorio, T., and Kanitpanyacharoen, W. (2015). Rock physics of fibrous rocks akin to Roman concrete explains uplifts at Campi Flegrei Caldera. Science 349, 617–621. doi:10.1126/science.aab1292
Walsh, J. B. (1965). The effect of cracks in rocks on Poisson’s ratio. J. Geophys. Res. 70, 5249–5257. doi:10.1029/jz070i020p05249
Wespestad, C. E., Thurber, C. H., Andersen, N. L., Singer, B. S., Cardona, C., Zeng, X., et al. (2019). Magma reservoir below Laguna del Maule Volcanic Field, Chile, imaged with surface‐wave tomography. J. Geophys. Res. Solid Earth. 124 (3), 2858–2872. doi:10.1029/2018jb016485
Whaler, K., and Hautot, S. (2006). “The electrical resistivity structure of the crust beneath the northern Main Ethiopian Rift,” in Structure and evolution of the rift systems within the Afar volcanic Province, Northeast Africa. Editors G. Yirgu, C. J. Ebinger, and P. K. H. Maguire (London, Special Publications), 295–305. doi:10.1144/GSL.SP.2006.259.01.22
Wilks, M., Kendall, J.-M., Nowacki, A., Biggs, J., Wookey, J., Birhanu, Y., et al. (2017). Seismicity associated with magmatism, faulting and hydrothermal circulation at Aluto Volcano, Main Ethiopian Rift. J. Volcanol. Geothermal Res. 340, 52–67. doi:10.1016/j.jvolgeores.2017.04.003
Yu, J., Byun, J., and Seol, S. J. (2015). VP/VS monitoring of CO2 sequestration using virtual horizontal crosswell tomography. Geosci. J. 19, 441–448. doi:10.1007/s12303-014-0053-3
Keywords: tomography, volcano seismicity, magmatic systems, hydrothermal, systems, seismic imaging, restless volcano
Citation: Wilks M, Rawlinson N, Kendall J-M, Nowacki A, Biggs J, Ayele A and Wookey J (2020) The Coupled Magmatic and Hydrothermal Systems of the Restless Aluto Caldera, Ethiopia. Front. Earth Sci. 8:579699. doi: 10.3389/feart.2020.579699
Received: 03 July 2020; Accepted: 02 September 2020;
Published: 14 October 2020.
Edited by:
Luca De Siena, Johannes Gutenberg University Mainz, GermanyReviewed by:
Miriam Christina Reiss, Goethe University Frankfurt, GermanyCopyright © 2020 Wilks, Rawlinson, Kendall, Nowacki, Biggs, Ayele and Wookey. This is an open-access article distributed under the terms of the Creative Commons Attribution License (CC BY). The use, distribution or reproduction in other forums is permitted, provided the original author(s) and the copyright owner(s) are credited and that the original publication in this journal is cited, in accordance with accepted academic practice. No use, distribution or reproduction is permitted which does not comply with these terms.
*Correspondence: N. Rawlinson, bnI0NDFAY2FtLmFjLnVr, J.-M. Kendall, bWlrZS5rZW5kYWxsQGVhcnRoLm94LmFjLnVr
Disclaimer: All claims expressed in this article are solely those of the authors and do not necessarily represent those of their affiliated organizations, or those of the publisher, the editors and the reviewers. Any product that may be evaluated in this article or claim that may be made by its manufacturer is not guaranteed or endorsed by the publisher.
Research integrity at Frontiers
Learn more about the work of our research integrity team to safeguard the quality of each article we publish.