 Zongci Huang
 Wenjun Zhang*
 Pang-Chi Hsu
94% of researchers rate our articles as excellent or good
Learn more about the work of our research integrity team to safeguard the quality of each article we publish.
Find out more
ORIGINAL RESEARCH article
Front. Earth Sci. , 10 December 2020
Sec. Atmospheric Science
Volume 8 - 2020 | https://doi.org/10.3389/feart.2020.579442
This article is part of the Research Topic The Asian Monsoon View all 17 articles
An extreme northward displacement of the western Pacific subtropical high (WPSH) was detected during the boreal mid-late summer (July-August) of 2018, bringing record-breaking heat waves over northern East Asia. Negative sea surface temperature (SST) anomalies in the northern India Ocean (NIO) are usually accompanied with a northward shift of the WPSH. However, no prominent NIO SST anomalies were observed during the 2018 boreal summer. It is found that this extreme northward-shifted WPSH event is largely attributed to the accumulated effect of intra-seasonal oscillation (ISO) convection anomalies over the tropical western North Pacific (WNP). The accumulated effect on the WPSH meridional location is further supported by their significant correlation based on the data since 1979. While the relationship between the NIO SST anomalies and WPSH meridional location has substantially weakened since the late 1990s, the accumulated effect of the tropical WNP ISO convections keeps playing a crucial role in modulating the WPSH meridional displacement. The active WNP ISO activities can stimulates a poleward propagating Rossby wave train, which favors a northward shift of the WPSH. Our results suggest that the accumulated effect of the tropical WNP ISO convections should be considered when predicting the WPSH during the boreal mid-late summer season.
As a crucial component of the East Asian summer monsoon circulation system (Rodwell and Hoskins, 2001), the western Pacific subtropical high (WPSH) has pronounced climate impacts over East Asia (e.g., Tao and Xu, 1962; Huang, 1963; Lau and Li, 1984; Tao and Chen, 1987; Ding, 1994; Zhao and Chen, 1995). The strength, shape, zonal and meridional displacements of the WPSH is closely associated with the intensity and distribution of precipitation and temperature over China (e.g., Tao and Zhu, 1964; Tao and Chen, 1987; Chang et al., 2000a; Chang et al., 2000b; Zhou and Yu, 2005). For example, when the WPSH strengthens and extends westward, abundant warm and moist air is brought from tropical seas to the land, which increases the precipitation over eastern China. On the contrary, a weak and eastward shifted WPSH generally leads to less precipitation there (e.g., Akiyama, 1973; Tao and Chen, 1987; Kodama, 1992; Chang, 2004; Wang et al., 2009; Fan et al., 2013). The WPSH has prominent sub-seasonal variability with significant meridional movements. In general, the WPSH locates over the South China Sea from late-March to May, and then jumps northward to about 22°N around mid-June, resulting in the onset of plum rain (or Meiyu in China) over the middle-lower reaches of Yangtze River. After mid-July, the WPSH jumps northward again with its center around 30°N, leading to the end of plum rain and the onset of rainy season in northern China (e.g., Chen and Chang, 1980; Tao and Chen, 1987; Wang, 2002; Ding and Chan, 2005; Ninomiya and Shibagaki, 2007; Sampe and Xie, 2010).
The WPSH exhibits significant interannual and interdecadal variabilities, and great efforts have been devoted to investigate the possible mechanisms (e.g., Tao and Chen, 1987; Lu, 2001; Chung et al., 2011; Xu et al., 2015; Wang et al., 2017). On the interannual timescale, the variability of the WPSH is closely linked to the climate variability over the tropics. In particular, El Niño-Southern Oscillation (ENSO), the most prominent year-to-year climate fluctuation, exerts remarkable influence on the WPSH. During El Niño developing summers, the warm sea surface temperature (SST) anomalies in the central-eastern tropical Pacific can trigger an anomalous cyclonic circulation over the western North Pacific (WNP) (Wang and Zhang, 2002), and weaken the WPSH. In the subsequent autumn, an anomalous anticyclonic circulation forms and develops and can persist to the next summer via the local air-sea interaction (Wang et al., 2000; Wang and Zhang, 2002), the Indian Ocean (IO) capacitor effect (e.g., Xie et al., 2009), and the Combination-mode dynamics (e.g., Stuecker et al., 2015; Zhang et al., 2015; Zhang et al., 2016). Correspondingly, the WPSH tends to be intensified and maintains over the WNP during the El Niño decaying summer. On the decadal timescales, it is proposed that the WPSH experienced a prominent decadal change during the late 1970s (Gong and Ho, 2002). For example, the WPSH tends to be stronger and shifts southwestward due to the enhanced heating of the Indo-Pacific warm pool (Zhou et al., 2009). However, these arguments were challenged by other studies (e.g., He et al., 2015; Wu and Wang, 2015). They show that this decadal change cannot be observed when measuring the WPSH using dynamic factors such as vorticity, and the so-called decadal westward extension of the WPSH could be a manifestation of global warming.
Northern East Asia witnessed record-breaking heat waves during the 2018 boreal mid-late summer (July-August). The “2018 China Climate Bulletin”, released by the China Meteorological Administration (CMA), shows that the average temperature from July to August in northeastern China was 25.1 °C, 1.3 °C higher than normal, which recorded the highest temperature since 1961. 47 stations there experienced a record-breaking daily maximum temperature. It has been reported that these extreme heat waves are closely associated with the maintenance of the extreme northward-shifted WPSH (Ding et al., 2019; see Figure 1). This unexceptional phenomenon reminds us that investigations on the possible mechanisms for the WPSH meridional movement is of great importance for future prediction of the WPSH and associated summer heat waves. However, compared with the variability of WPSH intensity, little attention has been paid to investigate the variability and mechanisms of the WPSH meridional locations. Early studies proposed that the tropical WNP convection anomalies can modulate the WPSH meridional displacement through the Pacific-Japan (PJ) or the East Asia–Pacific pattern (Nitta, 1987; Huang and Li, 1987), which is featured by an atmospheric teleconnection with two centers respectively over the tropical WNP and mid-latitudinal region (Kosaka and Nakamura, 2006; Kosaka et al., 2011). The atmospheric circulation anomalies during 2018 mid-late summer also resembles the PJ teleconnection pattern (Figures 1A), which suggests a possible linkage between the extreme northward shift and the anomalous PJ pattern. The previous studies have shown that the PJ pattern is significantly correlated with ENSO in preceding winter (e.g., Xie et al., 2009; Kosaka et al., 2011; Kosaka et al., 2013). The El Niño-induced delayed warming in the tropical Indian Ocean anchors the WNP anticyclone through exciting an atmospheric Kelvin wave in the WNP, which comprises the tropical lobe of the PJ pattern (Xie et al., 2009). However, the observation shows a weak La Niña event in the preceding 2017/2018 winter. And the northern Indian Ocean (NIO) did not show prominent SST anomalies during 2018 summer. Thus, it seems that this weak La Niña event or the NIO SST anomalies is not the primary reason for the WPSH extreme northward displacement in 2018 boreal mid-late summer. One latest research suggested this heatwave event can be largely contributed by the abnormally enhanced Madden-Julian Oscillation (MJO; Madden and Julian, 1971) convections over the tropical WNP (Hsu et al., 2020).
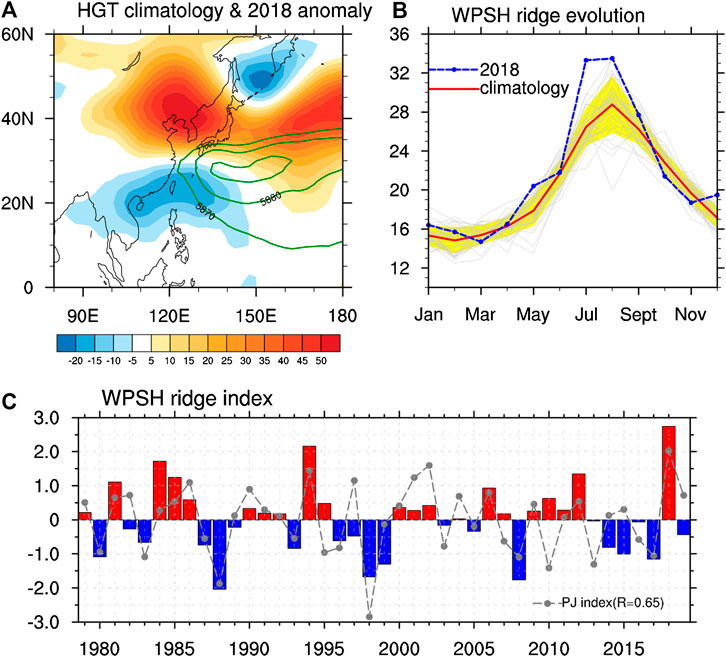
FIGURE 1. (A) Distribution of the 500hPa geopotential height anomaly during the 2018 boreal mid-late summer (shading in m) and the climatological mean WPSH (contours in m). (B) Monthly evolution of the WPSH ridge index in 2018 (blue line), remaining years (gray line) and climatological mean (red line). The yellow shading denotes 1 standard deviation of the climatological mean WPSH ridge index. (C) Time evolution of the WPSH ridge index (bar) and PJ index (gray line) during the boreal mid-late summer from 1979 to 2019. The red/blue bars represent the northward/southward WPSH.
It is compelling to expect that the western Pacific intra-seasonal oscillation (ISO) may have impacts on the meridional displacement of the WPSH, since it acts as a key factor for the extreme northward shift of the WPSH in 2018. We in this paper find that, on the interannual timescale, both the NIO SST anomalies and the accumulated effect of ISO convection anomalies over the tropical WNP play important roles in modifying the WPSH north-south location. While the contribution of the NIO SST anomalies has substantially weakened since the late 1990s, the accumulated effect of ISO convection anomalies exert a stable impact on the WPSH meridional displacement. The remainder of this paper is organized as follows. Data and Methodology introduces data, methodology and several definitions of climate indices. The interannual variability of the WPSH meridional displacement and the associated SST and convection anomalies are described in Interannual Variability of the WPSH Meridional Displacement and Its Related Ocean-Atmospheric Features. In Importance of Two Factors on the WPSH Meridional Location, an empirical model is established to forecast the WPSH meridional location based on the NIO SST anomalies and the accumulated intra-seasonal OLR (Accu-ISO) index defined to measure the accumulated effect of ISO convection anomalies. We also investigate the decadal change in relationship of the WPSH meridional movement with these two key factors. Finally, discussions and major conclusions are illustrated in Summary and Discussion.
In this study, the monthly and daily mean atmospheric reanalysis datasets derived from the National Centers for the Environmental Prediction-Department of Energy (NCEP–DOE) Atmospheric Model Intercomparison Project-II reanalysis datasets (Kanamitsu et al., 2002) are utilized. The horizontal resolution is 2.5° × 2.5°. The global monthly SST anomalies are investigated based on the National Oceanic and Atmospheric Administration (NOAA) Extended Reconstructed SST analysis, version 5 (ERSSTv5, Huang et al., 2017) with the resolution of 2° × 2°. The interpolated daily mean outgoing longwave radiation (OLR) data on 2.5° × 2.5° grids are provided by the NOAA (Liebmann and Smith, 1996). The precipitation data on 2.5° × 2.5° grids are taken from Climate Prediction Center Merged Analysis of Precipitation (CMAP) (Xie and Arkin, 1997).
The mid-late summer (July-August) is our focus in this study. The WPSH ridge index, which is used to measure its meridional displacement, is defined by using the interface between the easterly and westerly of the subtropical high at the 500hPa geopotential height: the averaged latitudes satisfying both u = 0 and ∂u/∂y > 0 conditions in a closed 5880 gpm contour over the area (10–60°N, 110–150°E) (Zhao, 1999; Liu et al., 2012). The boreal summer intra-seasonal oscillation (BSISO) index is used to describe the ISO activity. Following the previous studies (Lee et al., 2011; Lee et al., 2013), the BSISO index is measured as the multivariate (MV)-EOF analysis of daily OLR and 850 hPa zonal wind anomalies over the Asian summer monsoon (ASM) domain (10°S–40°N, 40°–160°E). BSISO1, comprised by the first and second MV-EOF modes, represents northward/northeastward propagating oscillations with an oscillating period of 30–60 days. BSISO2, comprised by the third and fourth MV-EOF modes, captures the northward/northeastward propagating oscillations with a 10–30-days oscillating period. The PJ pattern is defined as the leading empirical orthogonal function (EOF) mode of the mid-late summer mean 850-hPa relative vorticity over the western north Pacific (0°–60°N, 100°–160°E), and the PJ index is represented as the normalized PC1 time series (e.g., Kosaka and Nakamura 2010; Kosaka et al., 2013).
Anomalies were derived relative to the whole studying period (1979–2019) and the long-term linear trend is removed to avoid possible impacts of the global warming. The conclusions remain qualitatively the same even with the non-detrended data. To focus on the intra-seasonal variability when discussing the impact of ISO on the WPSH, the annual cycle (mean and first three harmonics of climatological annual variation) is removed from the daily mean OLR and 850 hPa zonal wind anomalies, and the running mean of the last 120 days is also subtracted to eliminate the effects of the interannual variability (Wheeler and Hendon, 2004; Lee et al., 2013). All statistical significance tests are performed based on the two-tailed Student’s t-test.
As shown in Figures 1B, the WPSH ridge is usually located around 26.5°N in July and moves northward to near 29°N in August. However, an extreme northward shifted WPSH was detected during the 2018 summer. In June 2018, the WPSH was located at about 22°N, almost the same position as the climatological mean. Then the WPSH suddenly jumped from 22°N to about 33°N in July and maintained at this latitude through August. This meridional position is much more northward shifted than the climatological mean, especially for July. The WPSH ridge index during mid-late summer 2018 was far beyond one standard deviation (yellow shading) and was the most northward-shifted since 1979. We hereafter focus on the July-August averaged north-south location of the WPSH and try to investigate the possible reasons for this extreme event in 2018. It is clearly shown that the WPSH meridional location exhibits strong interannual variability with the largest value occurring in 2018 (Figure 1C), further confirming the extremity of the WPSH latitudinal location.
To examine the atmospheric circulation related to the WPSH latitudinal movement, the 850 hPa vorticity anomaly is regressed upon the WPSH ridge index (not shown). A poleward wave train-like atmospheric circulation pattern can be detected over East Asia and its adjacent oceans, with two opposite centers respectively over the subtropical WNP (10°–25°N) and mid-latitude region (30°–40°N). This meridional structure resembles the PJ pattern, and the WPSH ridge index is highly correlated with the PJ index (r = 0.65, statistically significant at 95% confidence level). Their high consistency (Figures 1C) suggests that they are possibly driven by same forcings. Since the PJ pattern acts as the bridge between the tropical and extra-tropical atmospheric circulation (e.g., Huang and Li, 1987; Nitta, 1987), we then consider the possible forcings from the tropics.
As illustrated in the introduction, the tropical SST is an important factor affecting the WPSH meridional movement. We here regress the simultaneous anomalous SST and horizontal wind onto the WPSH ridge index (Figures 2A). A northward-shifted WPSH is accompanied by significant negative SST anomalies in the northern Indian Ocean (NIO) and WNP. Correspondingly, an anomalous cyclone and anti-cyclone prevails over the WNP and near Japan, respectively. This result indicates that the NIO SST anomalies may exert a significant impact on the WPSH through modifying the WNP atmospheric anomalies. The warming NIO SST can suppress the convection over the WNP by inducing an anomalous anti-cyclone there as a response of a Kelvin wave response (Watanabe and Jin, 2002; Yang et al., 2007; Xie et al., 2009). The WNP atmospheric anomalies then influence the mid-latitudinal circulation through the PJ pattern, which tends to modulate the WPSH meridional location, consistent with the former study (Nitta, 1987). Along with the negative SST anomalies over the WNP during summer 2018, we observe positive precipitation anomalies there (Figures 2B), suggesting that the SST anomalies are possibly forced by the anomalous atmospheric circulation. Therefore, the SST anomalies may be not the ultimate reason for this meridional movement of the WPSH in summer. In the mid-late summer of 2018, weakly negative SST anomalies appear over the NIO (Figures 2B), which may have some impact on the WPSH north-south location anomaly. However, it is not strong enough to be used to explain the extreme northward shift of the WPSH in 2018.
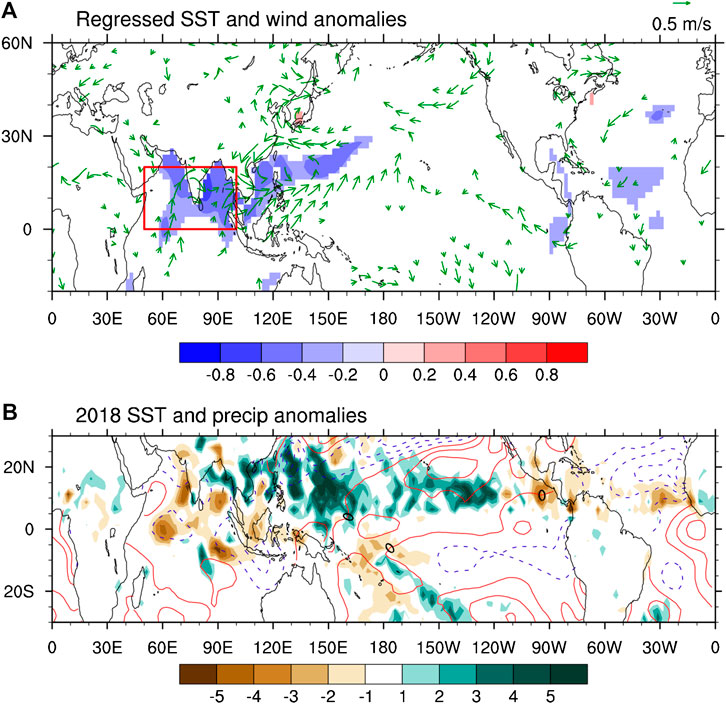
FIGURE 2. (A) Regressed SST anomalies (shadings in °C) and 850 hPa wind anomalies (vectors in m/s) upon the WPSH ridge index during boreal mid-late summer of 1979–2017. Anomalies are shown only when they are significant at the 95% confidence level. The red box denotes the region where the NIO index is defined. (B) SST anomalies (contours in °C, from −1.5 to 1.5 by 0.3) and precipitation anomalies (shadings in mm/day) during boreal mid-late summer 2018. Solid and dashed lines in (B) denote positive and negative values, respectively.
Previous studies suggest that the ISO-associated convection activities can play an important role in the extreme temperature and precipitation anomalies over eastern China (e.g., Hong and Li, 2009; Hsu et al., 2016; Chen and Zhai, 2017; Hsu et al., 2017). The western tropical Pacific ISO has been recognized as an important forcing for the generation and maintenance of the abnormal northward shift of the WPSH in 2018 (Hsu et al., 2020). The BSISO1 index is used here to describe the ISO activity, since it can describe the ISO activities over the WNP more realistically compared with the MJO index (e.g., Lee et al., 2011; Chen and Zhai, 2017). The BSISO2 index showed a relatively weak evolution during the 2018 Northeast Asian heatwave period, suggesting a weak effect on the northward shift of WPSH in this case. In fact, Hsu et al. (2017) documented that the BSISO2 shows a closer relationship between heat waves over India and the Yangtze River basin, and the BSISO1 exerts significant influences over the Northeast Asia. The similar result can be found in Figures 3A, which shows the phase space diagram of BSISO1 from 1st July to 31st August. It can be observed that the BSISO1 is very active over the South China Sea (Phase 6–7) and WNP (Phase 8) area, especially from 7th July to 1st August and from 3rd August to 22nd August.
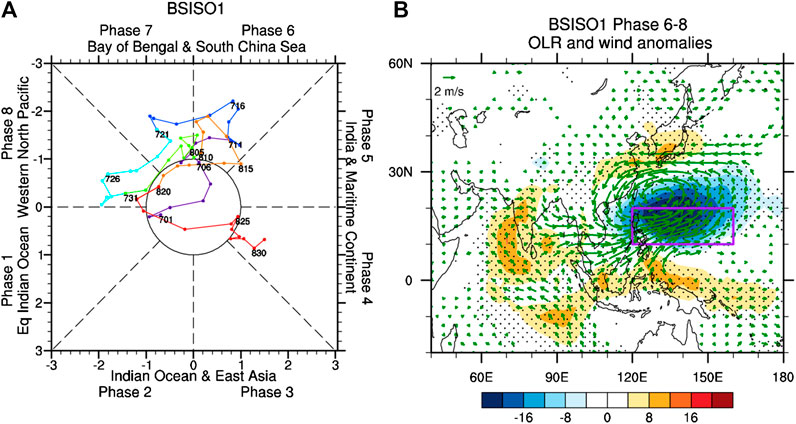
FIGURE 3. (A) The phase space diagram of BSISO1 during the 2018 boreal mid-late summer. Each color represents ten days from July 1st to August 31st and the numbers correspond to the date. (B) Composite OLR (shading in W/m2) and 850hPa wind anomalies (vectors in m/s) of active BSISO1 days in Phase 6–8 during boreal mid-late summer of 1979–2019. The days are selected when the ISO amplitude (PC12 + PC22)1/2 exceeded 1. The stippled area and the green vectors denote the corresponding values are significant at the 95% significance level. The purple box in (B) denotes the key area (10°–20°N, 120°–160°E) of WNP region.
To verify the impacts of WNP ISO activities on the WPSH associated circulation, we composite the OLR and 850 hPa wind anomalies of the active ISO days in Phases 6–8 of BSISO1 during boreal mid-late summer from 1979 to 2019. The active ISO days are selected when the BSISO1 amplitude [represented by (PC12 + PC22)1/2] exceeds one standard deviation. As shown in Figures 3B, during Phases 6–8 of the BSISO1, the anomalous convection is enhanced over the South China Sea and Philippine Sea, accompanying by prevailing cyclonic circulation anomalies over its northwestern part. Suppressed convection can be detected over the Indian Ocean and the Maritime Continent. Simultaneously, large-scale anticyclonic circulation anomalies are evident over northern China and Japan. It can be seen that the active BSISO1 over the South China Sea and WNP can influence the WPSH mid-latitudinal location by stimulating a poleward propagating Rossby wave train resembling the PJ teleconnection pattern.
In order to explain the long-lasting extreme northward displacement of the WPSH in summer 2018, we then define an accumulated intra-seasonal OLR anomaly (Accu-ISO) index over the tropical WNP (10°–20°N, 120°–160°E) to investigate the importance of the accumulated effect of ISO convections on the WPSH meridional displacement. The Accu-ISO index is defined as the summation of tropical WNP-averaged intra-seasonal OLR anomalies from 1st July to 31st August in each year. This index may comprise both the amplitude and persistence of the ISO convective anomalies over the tropical WNP. It is shown in Figure 4 that this Accu-ISO index is negatively correlated with the WPSH ridge index (r = -0.52, significant at the 95% confidence level). It suggests that the accumulated effect of ISO convections may also play a critical role on the north-south location of the WPSH during mid-late summer. During the summer of 1979 to 2019, the accumulated effect of ISO convections is the strongest in 2018, which may be responsible for the extreme northward shift of the WPSH and the associated summer heat waves during this summer.
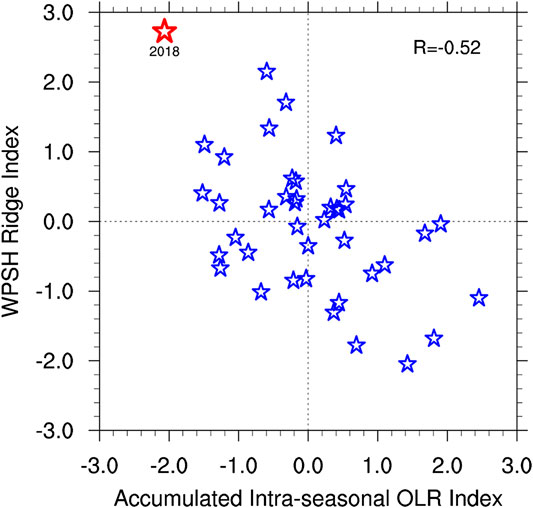
FIGURE 4. Scatter plot of the WPSH ridge index as a function of the Accu-ISO anomalies over WNP (10°–20°N, 120°–160°E). The 2018 case is shown as the red star. The corresponding correlation coefficient between these two indices (R) is also displayed.
To examine the performance of the two key processes in predicting the WPSH north-south location, we construct a multivariate linear regression model based on the NIO and the Accu-ISO indices. Following the previous study (Xie et al., 2009), the NIO index is defined as the area-averaged SST anomalies over the NIO region (Figure 2; red box). As shown in Figure 5, these two indices are not correlated with each other (r = 0.06, insignificant at the 95% confidence level), suggesting their linear statistical independence. Figure 6 shows the time series of observed WPSH ridge index (blue line), and reconstructed WPSH ridge index based on the NIO index (purple line) and based on both the NIO and Accu-ISO indices (red line). The reconstructed WPSH index using both the NIO and Accu-ISO indices is highly correlated with the observed index (R = 0.68). The variance of the WPSH ridge index explained by both the NIO and Accu-ISO indices (R2 = 47%) is much higher than that by the NIO index only (R2 = 23%). It should be noted that the inclusion of the Accu-ISO index realistically captures the extreme WPSH north-south movement in 1988, 1998 and 2018. These results suggest that the Accu-ISO index other than the NIO index provides an additional physical-based predictor for the WPSH north-south location.
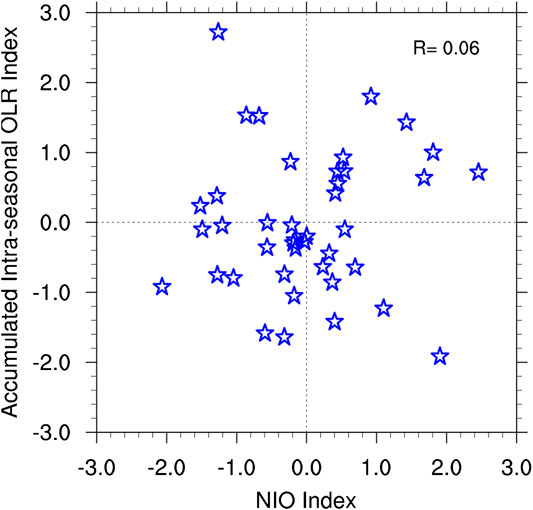
FIGURE 5. Scatter plot of the Accu-ISO anomalies over WNP (10°–20°N, 120°–160°E) and the NIO index. The corresponding correlation coefficient between these two indices (R) is also displayed.
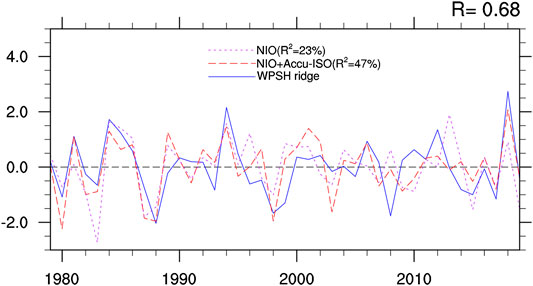
FIGURE 6. Time series of the observed WPSH ridge index (blue line), the reconstructed WPSH ridge index based on the NIO index (purple line), and based on both the NIO and Accu-ISO indices (red line). The explained variances of the two regressed indices (R2) are also displayed.
We also calculate the variance pattern of 500 hPa geopotential height explained by the regression model with the NIO index only (Figures 7A) and with both the NIO and Accu-ISO indices (Figures 7C). It can be seen that the NIO index can explain more than 45% of the 500 hPa geopotential height variance over the tropical region, but only explain around 10% variance over the Korea peninsula (Figures 7A). When the Accu-ISO index is further considered in the regression model, the 500hPa geopotential height variance explained is significantly improved, especially in the widened part over the northeastern China and Korea peninsula (Figures 7C). The 500hPa geopotential height variance is increased by about 25% over the WNP and 15% over north East Asian, which largely reflects the variability of WPSH north-south location (Figures 7E). This point is also clearly verified by the comparison among the reconstructions of the 500hPa geopotential height anomalies in 2018 based on different regression models (Figures 7B,D,F). The reconstructed 500 hPa geopotential height anomalies based on both the NIO and Accu-ISO indices accurately captures two geopotential height anomalies centers over the WNP region and northern East Asia, which is much more realistic than those reconstructed by the NIO index alone.
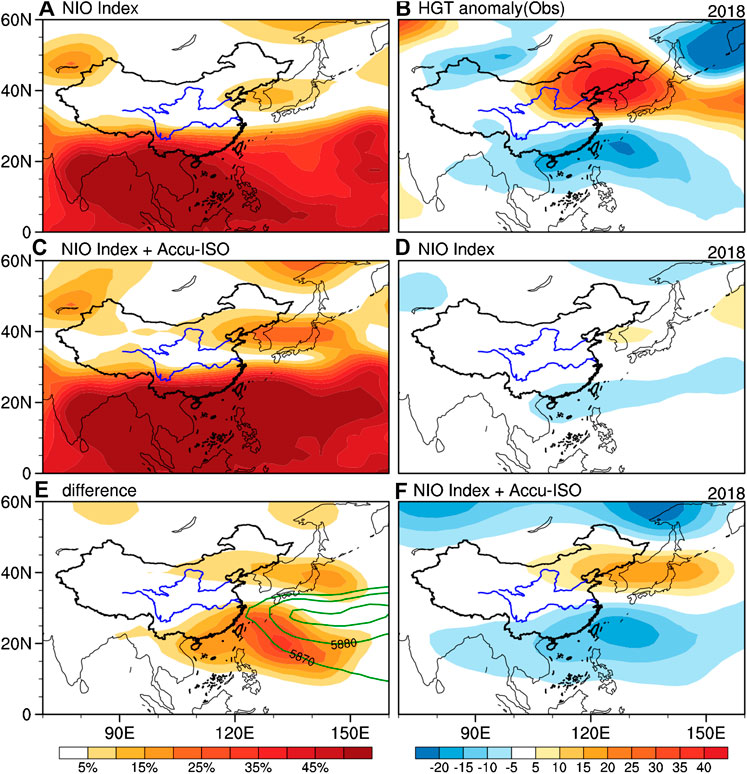
FIGURE 7. Performance of linear regression models in capturing the boreal mid-late summer 500 hPa geopotential height anomaly. The explained variance for the anomalous 500 hPa geopotential height by the regression model with (A) the NIO index only, (C) both the NIO and Accu-ISO indices, and (E) their difference. Distribution of (B) the observed 500 hPa geopotential height anomaly (shading in m) in 2018 boreal mid-late summer, the reconstructed 500 hPa geopotential height anomaly based on the (D) NIO index predictor only and (F) both the NIO and Accu-ISO indices.
To verify how well both the NIO SST anomalies and accumulated effect of ISO convections contribute to the prediction skill of the WPSH meridional displacement, an empirical prediction model is developed using the multiple linear regression method based on both the NIO and Accu-ISO indices:
Due to the limited sample size, the first 36-years are used to act as a training period to estimate the regression coefficients and the residual 5-years are viewed as an independent testing period (Figure 8). It can be seen that during the training period, the empirical model can captures 39% variance of the observed WPSH ridge index (R = 0.62; blue line). During the independent testing period, 98% variance of the WPSH meridional north-south movement is captured by the model (red line). Although there are only five cases in this period, the high correlation coefficient (R = 0.99) suggests that this empirical model offers a relatively accurate prediction of the WPSH meridional displacement.
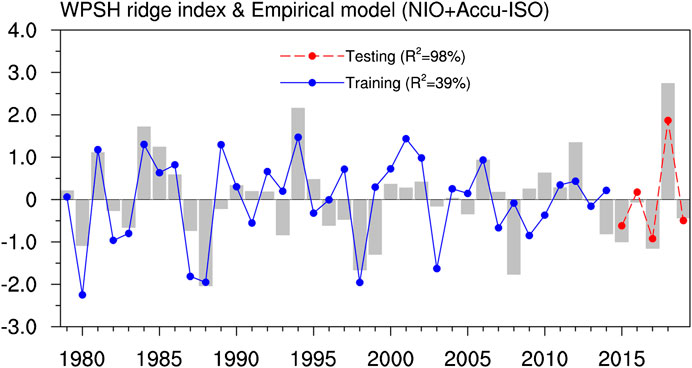
FIGURE 8. Time evolution of the observed WPSH ridge index (bars) and the empirical model fitted values (lines) during the boreal mid-late summer from 1979 to 2019. The red and blue lines represent the training and testing results, respectively.
Previous studies argued that the Indian Ocean SST has experienced a prominent decadal change around the late 1990s due to the Inter-decadal Pacific Oscillation (IPO)-induced atmospheric adjustment (e.g., Dong et al., 2016; Ummenhofer et al., 2017; Mohapatra et al., 2020). So, it deserves attention whether the impacts of the NIO SST anomalies on the WPSH north-south location displays decadal changes. We in Figures 9A show the 21-years-window running correlations of the WPSH ridge index with the NIO and Accu-ISO indices. It can be seen that the correlation coefficient between the WPSH ridge and NIO indices exhibits prominent decadal variations. While the NIO SST anomalies exhibit a strongly weakened association with the WPSH ridge after the late 1990s (blue line), the relationship between the Accu-ISO and WPSH ridge indices is consistently significant throughout the entire period (red line). We also display the different responses of the WPSH meridional displacement to the NIO SST anomalies before and after the late 1990s. Consistent with the results shown in Figures 9A, the WPSH ridge and NIO indices are significantly correlated during 1979–1998 (Figures 9B), while a non-significant relationship is found during 1999–2019 (Figures 9C). These results indicate that the NIO SST anomalies play relatively minor role on the WPSH north-south location after the late 1990s comparing with that of the accumulated effect of ISO convections. This point is further illustrated clearly in the time series of the observed and linearly regressed WPSH ridge indices (Figure 10). During 1979–1998, the WPSH meridional displacement is reconstructed well based on both the NIO and Accu-ISO indices with the major contribution from the NIO SST anomalies (R2 = 54%). Since the impact of the NIO SST anomalies has weakened after the late 1990s (R2 = 4%), the linear regression with both the NIO and Accu-ISO indices can only captures 34% variability of the north-south shift of the WPSH (R = 0.58) and the correlation is mainly contributed by the accumulated effect of ISO convections (R2 = 30%). Considering the weakened relation of the NIO SST anomalies with the WPSH meridional locations in recent decades, we also examine the validity of Eq. 1 but with only Accu-ISO index involved. In the last 5-years independent period, 72% variance is captured by the statistically model as a predictor of the Accu-ISO index. It suggests that the NIO SST anomalies play some contribution on the WPSH meridional locations despite that it is not a main predictor.
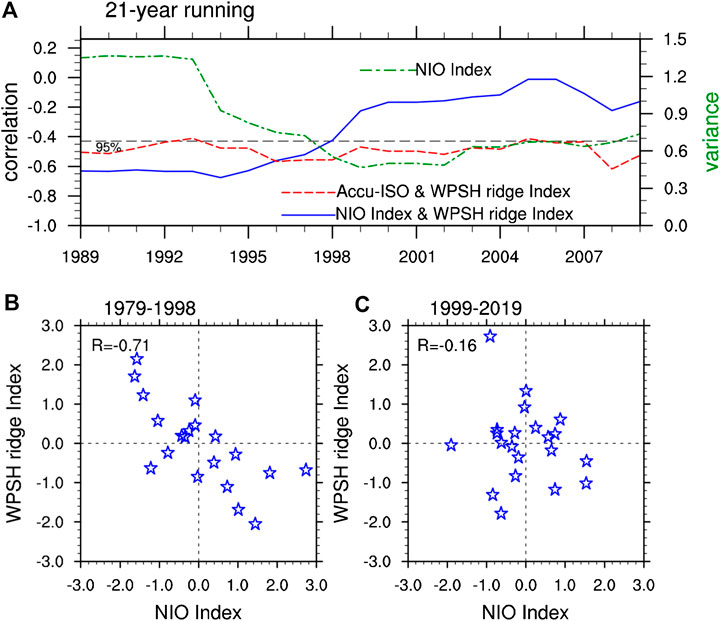
FIGURE 9. (A) Time evolution of the 21-years running correlation coefficients of the WPSH ridge index with NIO index (blue line) and Accu-ISO index (red line). The green line denotes the 21-years running standard deviation of the NIO index. The black dashed line denotes the 95% confidence level based on the two-tailed Student’s t test. Scatterplot of the WPSH ridge and NIO index during the mid-late summer of (B) 1979–1998 and (C) 1999–2019.
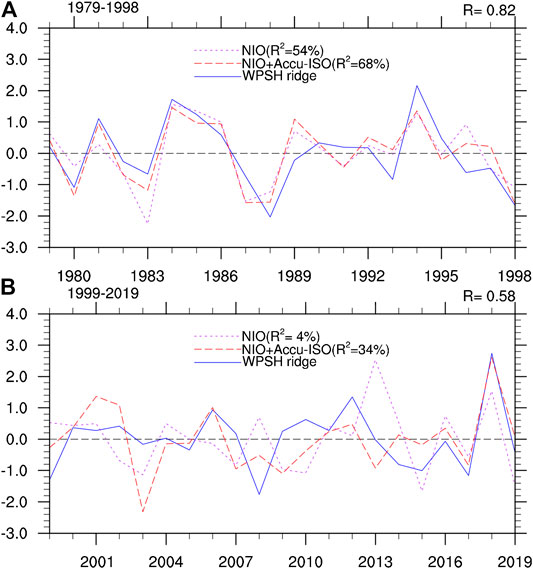
FIGURE 10. (A) Time series of the observed WPSH ridge index (blue line), the reconstructed WPSH ridge index based on the NIO index (purple line), and the reconstructed WPSH ridge index based on both the NIO and Accu-ISO indices (red line) for the mid-late summer of 1979–1998. (B) Same as (A) but for 1999–2019. The explained variances of the two regressed indices (R2) are also displayed.
An extreme northward shift of WPSH was detected during the 2018 boreal mid-late summer, bringing record-breaking heat waves over northern East Asia region. Observed analyses show that the WPSH north-south location is statistically related to the NIO SST anomalies. However, weakly negative NIO SST anomalies in mid-late summer 2018 cannot explain the extreme northward shift of WPSH. The accumulated effect of ISO convections over the tropical WNP can also exert significant impacts on the WPSH north-south location, through exciting a poleward propagating Rossby wave train. During the mid-late summer from 1979 to 2019, the accumulated effect of ISO convections is the strongest in 2018, which is largely responsible for the extreme northward-shifted WPSH. While the modulation effect of the NIO SST anomalies has substantially weakened since the late 1990s, the accumulated effect of the WNP ISO convections exhibits a stationary relationship with the WPSH latitudinal movement.
At present, the reason for the weakened relationship between the NIO SST and the WPSH meridional displacement after the late 1990s is still unknown. We in Figure 9A display the 21-years-window running variance of the NIO index (green line). A remarkable decadal variation of NIO SST can also be observed around the late 1990s, which is consistent with the decadal change of the NIO-WPSH ridge relationship. It suggests that the variability of the NIO SST anomalies weakened in recent years, which possibly leads to a less modulation on the East Asian atmospheric circulation.
The BSISO1 during summer (July-August) 2018 exhibited very different propagation features from typical ISO events, with strong and quasi-stationary activities maintaining over the South China Sea and WNP (Phases 6–8) for up to 40 days. Many extreme climate events in recent years have been linked to similar abnormal ISO activities with relatively longer phase duration. For instance, the extreme drought during autumn and winter 2009/10 over southwestern China coincided with pro-longed suppressed MJO convection over the Bay of Bengal (Lv et al., 2012). However, the underlying mechanisms for these exceptional ISO events are not clear. During July-August 2018, remarkable moisture surpluses and strengthened cyclonic anomalies can be observed over the South China Sea and WNP (not shown), which could be the reason for the maintenance of the local enhanced BSISO1 activity (Hsu and Lee, 2005; Maloney 2009; Kim et al., 2014; Sobel et al., 2014).
In this study, we mainly focus on the important impacts of the accumulated effect of WNP ISO convections on the WPSH meridional movement and emphasize its role in capturing the extreme of northward shift of the WPSH in mid-late summer 2018. Contributions of other forcings, such as the anthropogenic forcing, should also be noted, since it has been reported to increase the probability of the extreme events (Imada et al., 2019; Qian et al., 2020).
The raw data supporting the conclusions of this article will be made available by the authors, without undue reservation.
WZ and ZH conceived the idea, conducted the data analysis and prepared the figures. ZH, WZ, and XG discussed the results and wrote the paper. P-CH helped perform the analysis with constructive discussions.
This work was supported by the National Key Research and Development Program (2018YFC1506002), and the National Nature Science Foundation of China (41675073, 41905073).
The authors declare that the research was conducted in the absence of any commercial or financial relationships that could be construed as a potential conflict of interest.
Akiyama, T. (1973). The large-scale aspects of the characteristic features of the Baiu front. Pap. Meteorol. Geophys. 24 (2), 157–188. doi:10.2467/mripapers1950.24.2_157
Chang, C. P., Zhang, Y., and Li, T. (2000a). Interannual and interdecadal variations of the East Asian summer monsoon and tropical Pacific SSTs. Part I: roles of the subtropical ridge. J. Clim. 13, 4310–4325. doi:10.1175/1520-0442(2000)013<4310:iaivot>2.0.co;2
Chang, C. P., Zhang, Y., and Li, T. (2000b). Interannual and interdecadal variations of the East Asian summer monsoon and tropical Pacific SSTs. Part II: meridional structure of the monsoon. J. Clim. 13, 4326–4340. doi:10.1175/1520-0442(2000)013<4326:iaivot>2.0.co;2
Chen, T. J. G., and Chang, C. P. (1980). The structure and vorticity budget of an early summer monsoon trough (mei-yu) over southeastern China and Japan. Mon. Wea. Rev. 108, 942. doi:10.1175/1520-0493(1980)108<0942:tsavbo>2.0.co;2
Chen, Y., and Zhai, P. (2017). Simultaneous modulations of precipitation and temperature extremes in Southern parts of China by the boreal summer intraseasonal oscillation. Clim. Dynam. 49, 3363–3381. doi:10.1007/s00382-016-3518-4
Chung, P., Sui, C., and Li, T. (2011). Interannual relationships between the tropical sea surface temperature and summertime subtropical anticyclone over the western North Pacific. J. Geophys. Res. Atmos. 116 (D13), D13111. doi:10.1029/2010JD015554
Ding, T., Gao, H., and Yuan, Y. (2019). The record-breaking northward shift of the western Pacific subtropical high in summer 2018 and the possible role of cross-equatorial flow over the Bay of Bengal. Theor. Appl. Climatol. 139, 1–10. doi:10.1007/s00704-019-02997-4
Ding, Y., and Chan, J. C. L. (2005). The East Asian summer monsoon: an overview. Meteorol. Atmos. Phys. 89, 117–142. doi:10.1007/s00703-005-0125-z
Dong, L., Zhou, T., Dai, A., Song, F., Wu, B., and Chen, X. (2016). The footprint of the inter-decadal pacific oscillation in Indian ocean sea surface temperatures. Sci. Rep. 6, 21251. doi:10.1038/srep21251
Fan, L., Shin, S.-I., Liu, Q., and Liu, Z. (2013). Relative importance of tropical SST anomalies in forcing East Asian summer monsoon circulation: relative importance OF SSTA to EASM. Geophys. Res. Lett. 40, 2471–2477. doi:10.1002/grl.50494
Gong, D.-Y., and Ho, C.-H. (2002). Shift in the summer rainfall over the Yangtze River valley in the late 1970s: summer rainfall shift IN the late 1970s. Geophys. Res. Lett. 29, 78–1784. doi:10.1029/2001GL014523
He, C., Zhou, T., Lin, A., Wu, B., Gu, D., Li, C., et al. (2015). Enhanced or weakened western North pacific subtropical high under global warming? Sci. Rep. 5, 16771. doi:10.1038/srep16771
Hong, C.-C., and Li, T. (2009). The extreme cold anomaly over southeast Asia in february 2008: roles of ISO and ENSO. J. Clim. 22, 3786–3801. doi:10.1175/2009JCLI2864.1
Hsu, H.-H., and Lee, M.-Y. (2005). Topographic effects on the eastward propagation and initiation of the madden–julian oscillation. J. Clim. 18, 795–809. doi:10.1175/JCLI-3292.1
Hsu, P.-C., Lee, J.-Y., and Ha, K.-J. (2016). Influence of boreal summer intraseasonal oscillation on rainfall extremes in southern China: BSISO influences on rainfall extremes in southern China. Int. J. Climatol. 36, 1403–1412. doi:10.1002/joc.4433
Hsu, P.-C., Lee, J.-Y., Ha, K.-J., and Tsou, C.-H. (2017). Influences of boreal summer intraseasonal oscillation on heat waves in monsoon Asia. J. Clim. 30, 7191–7211. doi:10.1175/JCLI-D-16-0505.1
Hsu, P.-C., Qian, Y., Liu, Y., Murakami, H., and Gao, Y. (2020). Role of abnormally enhanced MJO over the western pacific in the formation and subseasonal predictability of the record-breaking Northeast Asian heatwave in the summer of 2018. J. Clim. 33, 3333–3349. doi:10.1175/JCLI-D-19-0337.1
Huang, B., Thorne, P. W., Banzon, V. F., Boyer, T., Chepurin, G., Lawrimore, J. H., et al. (2017). Extended reconstructed sea surface temperature, version 5 (ERSSTv5): upgrades, validations, and intercomparisons. J. Clim. 30, 8179–8205. doi:10.1175/jcli-d-16-0836.1
Huang, R. H., and Li, W. J. (1987). “Influence of the heat source anomaly over the western tropical Pacific onthe subtropical high over East Asia,” in Proceedings of International Conference on the General Circulation of East Asia, Chengdu, China, April 10–15, 1987. 40–51.
Huang, S. (1963). Longitudinal movement of the subtropical anticyclone and its prediction. Acta Meteorol. Sin. 33, 320–332.
Imada, Y., Watanabe, M., Kawase, H., Shiogama, H., and Arai, M. (2019). The july 2018 high temperature event in Japan could not have happened without human-induced global warming. Sola 15A, 8–12. doi:10.2151/sola.15A-002
Kanamitsu, M., Ebisuzaki, W., Yang, S.-K., Hnilo, J. J., Fiorino, M., and Potter, G. L. (2002). NCEP-DOE AMIP-II reanalysis (R-2). Bull. Am. Meteorol. Soc. 83 (11), 1631–1643. doi:10.1175/bams-83-11-1631(2002)083<1631:nar>2.3.co;2
Kim, D., Kug, J.-S., and Sobel, A. H. (2014). Propagating versus nonpropagating madden–julian oscillation events. J. Clim. 27, 111–125. doi:10.1175/JCLI-D-13-00084.1
Kodama, Y.-M. (1992). Large-scale common features of subtropical precipitation zones (the Baiu frontal zone, the SPCZ, and the SACZ). Part I: characteristics of subtropical frontal zones. J. Meteor. Soc. Jpn. 70, 813–802. doi:10.2151/jmsj1965.70.4_813
Kosaka, Y., and Nakamura, H. (2010). Mechanisms of meridional teleconnection observed between a summer monsoon system and a subtropical anticyclone. Part I: the pacific–Japan pattern. J. Clim. 23, 5085–5108. doi:10.1175/2010JCLI3413.1
Kosaka, Y., and Nakamura, H. (2006). Structure and dynamics of the summertime Pacific–Japan teleconnection pattern. Q. J. R. Meteorol. Soc. 132, 2009–2030. doi:10.1256/qj.05.204
Kosaka, Y., Xie, S.-P., Lau, N.-C., and Vecchi, G. A. (2013). Origin of seasonal predictability for summer climate over the Northwestern Pacific. Proc. Natl. Acad. Sci. U.S.A. 110, 7574–7579. doi:10.1073/pnas.1215582110
Kosaka, Y., Xie, S.-P., and Nakamura, H. (2011). Dynamics of interannual variability in summer precipitation over east Asia. J. Clim. 24, 5435–5453. doi:10.1175/2011JCLI4099.1
Lau, K. M., and Li, M. T. (1984). The monsoon over East Asia and its global association-a survey. Bull. Am. Meteorol. Soc. 65, 116–125. doi:10.1175/1520-0477(1984)065<0114:tmoeaa>2.0.co;2
Lee, J.-Y., Wang, B., Wheeler, M. C., Fu, X., Waliser, D. E., and Kang, I.-S. (2013). Real-time multivariate indices for the boreal summer intraseasonal oscillation over the Asian summer monsoon region. Clim. Dynam. 40, 493–509. doi:10.1007/s00382-012-1544-4
Lee, J.-Y., Wang, B., Wheeler, M., Fu, X., and Waliser, D. (2011). “A metrics for boreal summer monsoon intraseasonal oscillation,” in 36th NOAA Annual climate diagnostics and prediction workshop, Fort Worth, TX, October 3–6, 2011, 5.
Liebmann, B., and Smith, C. A. (1996). Description of a complete (interpolated) outgoing long wave radiation dataset. Bull. Am. Meteorol. Soc. 77, 1275–1277.
Liu, Y. Y., Li, W. J., Ai, W. X., and Li, Q. Q. (2012). Reconstruction and application of the monthly western Pacific subtropical high indices. J. Appl. Meteorol. Sci. 23, 414–423.
Lu, R. (2001). Interannual variability of the summertime North Pacific subtropical high and its relation to atmospheric convection over the warm pool. J. Meteor. Soc. Jpn Ser. II 79, 771–783.
Lv, J. M., Ju, J. H., Ren, J. Z., and Gan, W. W. (2012). The influence of the Madden-Julian Oscillation activity anomalies on Yunnan’s extreme drought of 2009–2010. Sci. China Earth Sci. 55, 98–112. doi:10.1007/s11430-011-4348-1
Madden, R. A., and Julian, P. R. (1971). Detection of a 40–50 day oscillation in the zonal wind in the tropical Pacific. J. Atmos. Sci. 28, 702–708. doi:10.1175/1520-0469(1971)028<0702:DOADOI>2.0.CO;2
Maloney, E. D. (2009). The moist static Energy budget of a composite tropical intraseasonal oscillation in a climate model. J. Clim. 22, 711–729. doi:10.1175/2008JCLI2542.1
Mohapatra, S., Gnanaseelan, C., and Deepa, J. S. (2020). Multidecadal to decadal variability in the equatorial Indian Ocean subsurface temperature and the forcing mechanisms. Clim. Dynam. 54, 3475–3487. doi:10.1007/s00382-020-05185-7
Ninomiya, K., and Shibagaki, Y. (2007). Multi-scale features of the meiyu-baiu front and associated precipitation systems. JMSJ 85 (B), 103–122. doi:10.2151/jmsj.85B.103
Nitta, T. (1987). Convective activities in the tropical western pacific and their impact on the northern hemisphere summer circulation. J. Meteorol. Soc. Jpn. Ser. II 65, 373–390. doi:10.2151/jmsj1965.65.3_373
Qian, Y., Murakami, H., Hsu, P., and Kapnick, S. (2020). Effects of anthropogenic forcing and natural variability on the 2018 heatwave in northeast Asia. Bull. Am. Meteorol. Soc. 101, S77–S82. doi:10.1175/BAMS-D-19-0156.1
Rodwell, M. J., and Hoskins, B. J. (2001). Subtropical anticyclones and summer monsoons. J. Clim. 14, 3192–3211. doi:10.1175/1520-0442(2001)014<3192:SAASM>2.0.CO;2
Sampe, T., and Xie, S.-P. (2010). Large-scale dynamics of the meiyu-baiu rainband: environmental forcing by the westerly jet. J. Clim. 23, 113–134. doi:10.1175/2009JCLI3128.1
Sobel, A., Wang, S., and Kim, D. (2014). Moist static Energy budget of the MJO during DYNAMO. J. Atmos. Sci. 71, 4276–4291. doi:10.1175/JAS-D-14-0052.1
Stuecker, M. F., Jin, F.-F., Timmermann, A., and McGregor, S. (2015). Combination mode dynamics of the anomalous northwest pacific anticyclone. J. Clim. 28, 1093–1111. doi:10.1175/JCLI-D-14-00225.1
Tao, S., and Chen, L. (1987). “A review of recent research on the East Asian summer monsoon in China,” in Monsoon meteorology. New York: Oxford University Press, Vol. 7, 60–92.
Tao, S., and Xu, S. (1962). Circulation characteristics in association with persistent summer drought and flood in the Yangtze-Huaihe River reaches. Acta Meteorol. Sin. 32, 1–18.
Tao, S., and Zhu, F. (1964). Variation of the 100 hPa flow pattern in South Asia in summer and the movement of the subtropical anticyclone over the western Pacific. Acta Meteorol. Sin. 34, 385–394. doi:10.11676/qxxb1964.039
Ummenhofer, C. C., Biastoch, A., and Böning, C. W. (2017). Multidecadal Indian ocean variability linked to the pacific and implications for preconditioning Indian ocean dipole events. J. Clim. 30, 1739–1751. doi:10.1175/JCLI-D-16-0200.1
Wang, B. (2002). Rainy season of the asian–pacifi c summer monsoon. J. Clim. 15 (4), 386–398. doi:10.1175/1520-0442(2002)015<0386:rsotap>2.0.co;2
Wang, B., Wu, R., and Fu, X. (2000). Pacific–east Asian teleconnection: how does ENSO affect east Asian climate? J. Clim. 13, 1517–1536. doi:10.1175/1520-0442(2000)013<1517:PEATHD>2.0.CO;2
Wang, B., and Zhang, Q. (2002). Pacific-east Asian teleconnection, Part II: how the Philippine Sea anomalous anticyclone is established during El Niño development. J. Clim. 15, 3252–3265. doi:10.1175/1520-0442(2002)015<3252:PEATPI>2.0.CO;2
Wang, B., Liu, J., Yang, J., Zhou, T., and Wu, Z. (2009). Distinct principal modes of early and late summer rainfall anomalies in east Asia*. J. Clim. 22, 3864–3875. doi:10.1175/2009JCLI2850.1
Wang, L., Yu, J., and Houk, P. (2017). Enhanced biennial variability in the Pacific due to Atlantic capacitor effect. Nat. Commun. 8, 14887. doi:10.1038/ncomms14887
Watanabe, M., and Jin, F. (2002). Role of Indian ocean warming in the development of Philippine Sea anticyclone during ENSO: philippine SEA anticyclone during ENSO. Geophys. Res. Lett. 29, 116-1–116-4. doi:10.1029/2001GL014318
Wheeler, M. C., and Hendon, H. H. (2004). An all-season real-time multivariate MJO index: development of an index for monitoring and prediction. Mon. Weather Rev. 132, 1917–1932. doi:10.1175/1520-0493(2004)132<1917:AARMMI>2.0.CO;2
Wu, L., and Wang, C. (2015). Has the western pacific subtropical high extended westward since the late 1970s? J. Clim. 28, 5406–5413. doi:10.1175/JCLI-D-14-00618.1
Xie, P., and Arkin, P. A. (1997). Global precipitation: a 17-year monthly analysis based on gauge observations, satellite estimates, and numerical model outputs. Bull. Am. Meteorol. Soc. 78, 20. doi:10.1175/1520-0477(1997)078<2539:GPAYMA>2.0.CO;2
Xie, S. P., Hu, K., Hafner, J., Tokinaga, H., Du, Y., Huang, G., et al. (2009). Indian Ocean capacitor effect on Indo-western Pacific climate during the summer following El Niño. J. Clim. 22, 730–747. doi:10.1175/2008JCLI2544.1
Xu, Z., Fan, K., and Wang, H. (2015). Decadal variation of summer precipitation over China and associated atmospheric circulation after the late 1990s. J. Clim. 28 (10), 4086–4106. doi:10.1175/jcli-d-14-00464.1
Yang, J., Liu, Q., Xie, S.-P., Liu, Z., and Wu, L. (2007). Impact of the Indian Ocean SST basin mode on the Asian summer monsoon. Geophys. Res. Lett. 34, L02708. doi:10.1029/2006GL028571
Zhang, W., Jin, F.-F., Stuecker, M. F., Wittenberg, A. T., Timmermann, A., Ren, H.-L., et al. (2016). Unraveling El niño’s impact on the east asian monsoon and Yangtze River summer flooding: El niño’s impact on the asian monsoon. Geophys. Res. Lett. 43 (11), 375–382. doi:10.1002/2016GL071190
Zhang, W., Li, H., Jin, F.-F., Stuecker, M. F., Turner, A. G., and Klingaman, N. P. (2015). The annual-cycle modulation of meridional asymmetry in ENSO’s atmospheric response and its dependence on ENSO zonal structure. J. Clim. 28, 5795–5812. doi:10.1175/JCLI-D-14-00724.1
Zhao, Z., and Chen, G. (1995). The cause and forecast of long-term change of the latitudinal position of West Pacific Subtropical High in early summer. J. Trop. Meteorol. 11, 223–230.
Zhao, Z. G. (1999). Summer drought and flood in China and the circulation patterns. Beijing, China: China Meteorological Press.
Zhou, T., Yu, R., Zhang, J., Drange, H., Cassou, C., Deser, C., et al. (2009). Why the western pacific subtropical high has extended westward since the late 1970s. J. Clim. 22, 2199–2215. doi:10.1175/2008JCLI2527.1
Keywords: east asian summer monsoon, northern India ocean, intra-seasonal oscillation, north-south location, western pacific subtropical high
Citation: Huang Z, Zhang W, Geng X and Hsu P-C (2020) Accumulated Effect of Intra-Seasonal Oscillation Convections over the Tropical Western North Pacific on the Meridional Location of Western Pacific Subtropical High. Front. Earth Sci. 8:579442. doi: 10.3389/feart.2020.579442
Received: 02 July 2020; Accepted: 18 November 2020;
Published: 10 December 2020.
Edited by:
Kyung-Ja Ha, Pusan National University, South KoreaReviewed by:
Maoqiu Jian, Sun Yat-sen University, ChinaCopyright © 2020 Huang, Zhang, Geng and Hsu. This is an open-access article distributed under the terms of the Creative Commons Attribution License (CC BY). The use, distribution or reproduction in other forums is permitted, provided the original author(s) and the copyright owner(s) are credited and that the original publication in this journal is cited, in accordance with accepted academic practice. No use, distribution or reproduction is permitted which does not comply with these terms.
*Correspondence: Wenjun Zhang, emhhbmd3akBudWlzdC5lZHUuY24=
Disclaimer: All claims expressed in this article are solely those of the authors and do not necessarily represent those of their affiliated organizations, or those of the publisher, the editors and the reviewers. Any product that may be evaluated in this article or claim that may be made by its manufacturer is not guaranteed or endorsed by the publisher.
Research integrity at Frontiers
Learn more about the work of our research integrity team to safeguard the quality of each article we publish.