 Shuntaro Hata
 Shin Sugiyama
95% of researchers rate our articles as excellent or good
Learn more about the work of our research integrity team to safeguard the quality of each article we publish.
Find out more
ORIGINAL RESEARCH article
Front. Earth Sci. , 21 January 2021
Sec. Cryospheric Sciences
Volume 8 - 2020 | https://doi.org/10.3389/feart.2020.576044
Glaciar Pío XI has advanced and thickened over the past several decades in contrast to the generally retreating and thinning trends seen in other glaciers in the Southern Patagonia Icefield (SPI). To quantify recent changes in ice-front positions and glacier surface elevation over the ablation area of Glaciar Pío XI, we analyzed satellite data acquired from 2000 to 2018. Two major glacier termini, and most of the small outlet glaciers, showed advancing trends, including the largest advance (1,400 m), observed at the southern terminus during the study period. Surface elevation increased by 37.3 ± 0.4 m as a mean over the study area, and the rate of the increase accelerated by 135 ± 10% from Period 1 (2000–2007) to Period 2 (2007–2017/18). Elevation change during Period 1 was only slightly positive except for extraordinary thickening (∼20 m a−1) observed near the southern terminus and one of the outlet glacier fronts, whereas significant thickening (∼2.7 m a−1) occurred over the entire ablation area during Period 2. Satellite imagery showed an emergence of sedimentary mounds in front of the southern terminus, suggesting that reduction in frontal ablation and increasingly compressive flow regime are the main drivers of the recent rapid thickening and advance. Most likely, the influence of the sediment deposition on the southern terminus subsequently propagated to the northern terminus and upper reaches of the glacier. The rate of ice mass increase during the study period was 0.48 ± 0.03 Gt a−1, which corresponds to 4% of the total mass loss from the SPI from 2000 to 2015/16.
The Southern Patagonia Icefield (SPI) is the second largest ice mass in the southern hemisphere, covering an area of 12,363 km2 along the border of Chile and Argentina (RGI Consortium, 2017; Figure 1A). The total ice volume was estimated to be 4,326 km3, which is equivalent to a sea level rise of 10.62 mm (Carrivick et al., 2016). In the SPI, 83% of major outlet glaciers terminate in water (Davies and Glasser, 2012), mostly in fjords on the western side of the icefield and in lakes on the eastern side. Most of these glaciers are currently retreating and thinning (Aniya et al., 1997; Rignot et al., 2003; Sakakibara and Sugiyama, 2014; Foresta et al., 2018; Malz et al., 2018; Abdel Jaber et al., 2019; Braun et al., 2019; Dussaillant et al., 2019). Retreat and thinning of calving glaciers dominate recent mass loss of the icefield, which, among mountain glaciers in the world, is the second largest contributor to sea level rise after Alaskan glaciers (IPCC, 2019).
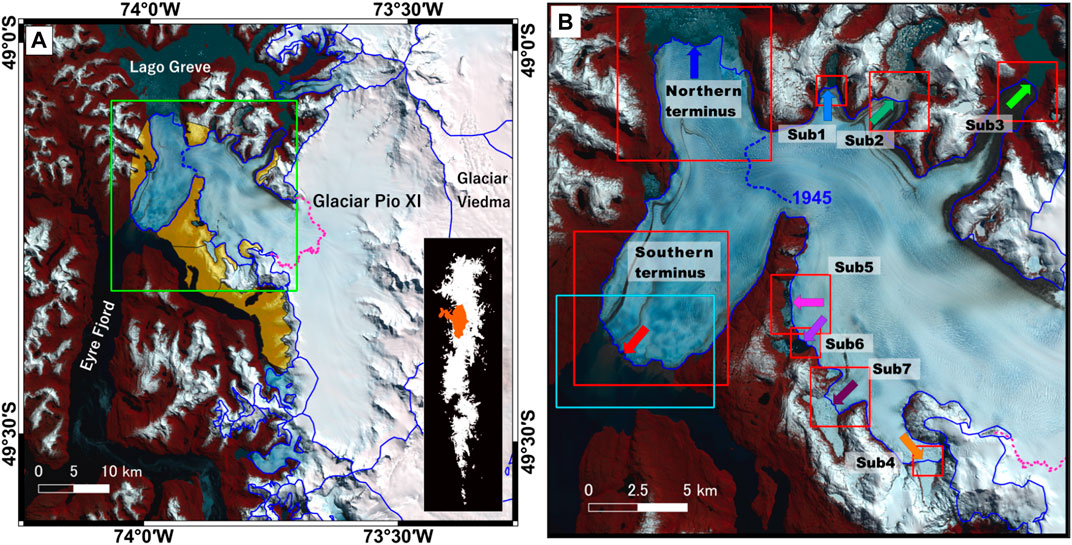
FIGURE 1. (A) Satellite image of Glaciar Pío XI (Sentinel-2 MSI image on October 18, 2018) with the location of the glacier in the SPI shown in the inset. Blue lines are glacier boundaries after RGI 6.0 inventory (RGI Consortium, 2017), except for the outline of Glaciar Pío XI traced on the background image. The magenta dotted line indicates the ELA (1,055 m; reported in Schaefer et al., 2015) according to the ALOS/PRISM DEM in 2007. Accuracy of the DEMs were evaluated in the areas shaded in yellow. The box indicates the area shown in (B). (B) The same satellite image as in (A), showing the glacier front position in 1945 (blue dashed line), the southern and northern termini, outlet glaciers (Sub1–Sub4) and ice margins (Sub5–Sub7) analyzed in this study. Boxes indicate the areas shown in Figures 2A–I, 6.
In general, glaciers in the SPI have shown retreating trends over the last several decades. Among 28 major calving glaciers, 17 retreated by more than 0.5 km from 1984 to 2011 (Sakakibara and Sugiyama, 2014). The only advancing glacier during the above period is Glaciar Pío XI, which is the focus of this study. Glaciar Pío XI had advanced by more than 10 km between 1945 and 1962 (Rivera, 1992) (Figure 1B). During this period, the glacier terminus reached the western frank of Eyre Fjord and bifurcated into two ice tongues, one flowing south into Eyre Fjord and the other to the north into Lago Greve. Both termini showed advancing trends until 1998, except for a retreat of the southern terminus from 1981 to 1985 (Rivera et al., 1997a). Thereafter, the southern and northern termini showed relatively short episodes of retreat during 1998–2000 and 1998–2005, respectively (Sakakibara and Sugiyama, 2014; Wilson et al., 2016). Several mechanisms have been proposed for the advance of Glaciar Pío XI in the 20th century. Rivera et al. (1997b) pointed out that the period of rapid advance was preceded by a positive precipitation anomaly, and therefore suggested that the glacier responded to an increased snow fall in the large accumulation area. Warren et al. (1997) proposed that sediment deposition played a central role in the glacier advance because formation of a sedimental shoal provides stability to the ice-front and reduces frontal ablation. Several studies proposed surge as a driver of the rapid advance, although the triggering mechanism of the acceleration is unclear (Rivera et al., 1997a; Wilson et al., 2016). No consensus has been reached so far, and most likely multiple mechanisms are involved in the 20th century advance of Glaciar Pío XI.
After short periods of retreat in 1998–2000 and 1998–2005, the southern and northern termini began to advance in 2000 and 2006, respectively (Sakakibara and Sugiyama, 2014; Wilson et al., 2016; Rivera, 2018). Wilson et al. (2016) performed detailed investigation on the flow speed variations of Glaciar Pío XI together with analyses of the ice-front position and changes in ice thickness. After a period of large acceleration up to 2000, the ice speed of the glacier progressively decreased in the 21st century. The authors of the study classified Glaciar Pío XI as a surge-type glacier and interpreted the recent advancing trend as the response to the fast ice-flow condition lasted until 2000. Glacier surge causes mass transport from the accumulation area to the terminus regions, which often results in ice thickening near the glacier front while thinning in the upper reaches. However, recent studies based on satellite and field surveys have shown a thickening trend over the entirety of Glaciar Pío XI (Foresta et al., 2018; Malz et al., 2018; Abdel Jaber et al., 2019; Minowa et al., 2019). To better understand the driving mechanism of the recent advancing trend, further analysis is required particularly for the surface elevation change.
In this study, we used satellite based remote sensing techniques to measure changes in the ice-front positions and glacier surface elevation of Glaciar Pío XI between 2000 and 2018. A combination of several types of satellite imagery enabled us to locate ice-front positions within temporal resolutions from weeks to years. Our analysis includes frontal variations of several outlet-glacier tongues and glacier margins calving into lakes, which have never before been reported. Changes in the surface elevation were quantified over the ablation area by comparing high-resolution digital elevation models (DEMs) obtained by photogrammetric analyses of satellite images. Satellite images were also utilized to observe sediment deposition near the glacier front. This paper reports the details of the recent advance and thickening of Glaciar Pío XI, and discusses processes affecting glacier dynamics.
Glaciar Pío XI (49.2°S, 73.6°W) is the largest glacier in South America located on the western side of the SPI (Figure 1A). The glacier is 70 km long and covers an area of 1,255 km2 in 2018 (Figure 1A). The lowermost part of the glacier bifurcates into two ice tongues, the southern terminus terminating in Eyre Fjord and the northern terminus in Lago Greve. The depths of Eyre Fjord and Lago Greve were reported to be 30–50 m and ∼150 m, respectively (Warren and Rivera, 1994; Warren et al., 1997). According to a multi-beam sonar survey in 2003–2008, the depth of Eyre Fjord near the ice-front was ∼25 m (Dowdeswell and Vásquez, 2013). In the upper reaches of the bifurcating area, four outlet glaciers protrude from the main trunk and terminate in lakes (Sub1–4 in Figure 1B), and marginal ice flows into lakes at three locations (Sub5–7 in Figure 1B). These subsidiary ice-fronts were included in our analysis.
Glaciar Pío XI has a large accumulation area ratio (AAR = 0.81) (De Angelis, 2014). This means that a relatively large amount of accumulation is counterbalanced by frontal ablation as well as rapid melting in the ablation area. Mass balance modeling for the period from 1975 to 2011 showed a mean surface mass balance of +3.45 m w.e. and equilibrium line altitude (ELA) at 1,055 m a.s.l. (Schaefer et al., 2015). The ice thickness is greater than 1,300 m in the accumulation area, which is the second thickest ice in the SPI (Millan et al., 2019). No ice thickness measurement data is available in the ablation area.
Changes in the ice-front positions of Glaciar Pio XI were measured from April 2, 2000 to October 18, 2018, using 48 satellite images acquired by Landsat 5 Thematic Mapper (TM), Landsat 7 Enhanced Thematic Mapper Plus (ETM+), Landsat 8 Operational Land Imager (OLI), Terra Advanced Spaceborne Thermal Emission and Reflection Radiometer (ASTER) and Sentinel-2 Multispectral Imager (MSI) (Supplementary Table S1). We used level-1 band 8 (panchromatic) images of Landsat 7 ETM+ and Landsat 8 OLI, level-1 band 3 (near‐infrared) images of Terra ASTER, and false color images converted from bands 4, 3, 2 of Landsat 5 TM and 8, 4, 3 of Sentinel-2 MSI. Ice-fronts were manually delineated on the images using QGIS geographic information system software. The mean displacement of the ice-front was calculated by dividing the change in the surface area by the width of the glacier (Figure 2) (Moon and Joughin, 2008). The uncertainty in the ice-front position was estimated by repeating the measurement for all ice-fronts/margins on cloud-free images obtained by each sensor. Standard deviations of ten repeated measurements on TM, ETM+, OLI, MSI and ASTER images were 3–7 m.
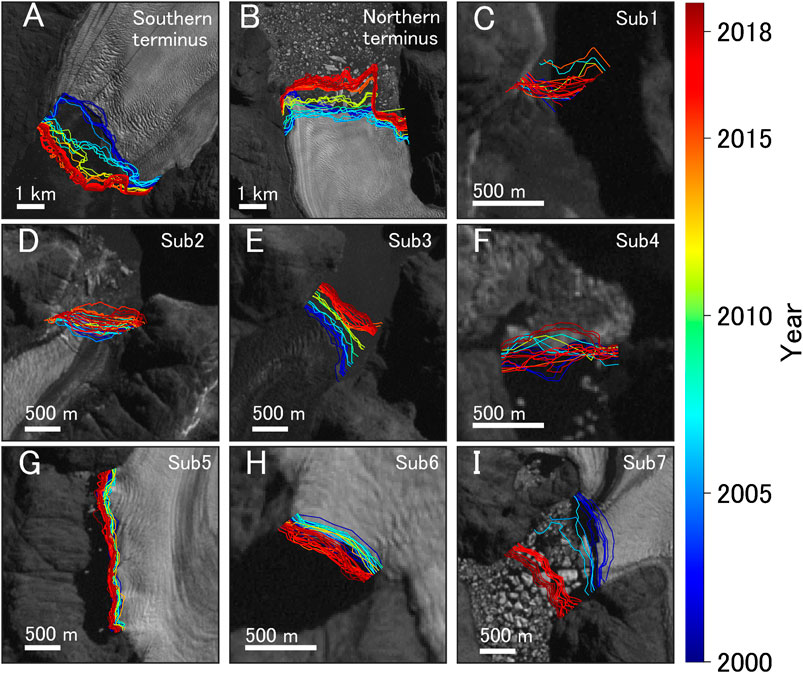
FIGURE 2. Ice-front positions from 2000 to 2018 at (A) the southern terminus, (B) the northern terminus, (C)–(F) four outlet glaciers (Sub1–Sub4) and (G)–(I) three ice margins calving into lakes (Sub5–Sub7) as designated in Figure 1B. The background images were taken from Landsat 7 ETM+ band 8 acquired on April 2, 2000.
Changes in the glacier surface elevation were measured from February 2000 to October 2018 by differing DEMs. A DEM in February 2000 was obtained by the Shuttle Radar Topography Mission (SRTM) and distributed by U. S. Geological Survey (USGS) (EROS Center, 2017). We also used ASTER DEMs in February 2017 and October 2018 distributed by the Japanese National Institute of Advanced Industrial Science and Technology (AIST) and the Geological Survey of Japan and these DEMs are available through the AIST website (https://gbank.gsj.jp/madas/map/index.html). Uncertainties in the vertical coordinates of the SRTM and ASTER DEMs were reported as ±7 m (Rignot et al., 2003) and ±29.5 m (Bolch et al., 2011), respectively.
In addition to these freely available DEMs, we produced a DEM on March 15, 2007 by processing stereo-pair satellite-images obtained by Panchromatic Remote-sensing Instruments for Stereo Mapping (PRISM) mounted on the Japanese Advanced Land Observing Satellite (ALOS). Nadir- and forward-looking images with a processing level of 1B2 (geometrically corrected data) were used for this purpose. Rational polynomial coefficient (RPC) files distributed by the Remote Sensing Technology Center of Japan (RESTEC) were utilized for geolocation of the images. Photogrammetric analysis was performed using a photogrammetry software mounted on the ERDAS IMAGINE 2018 (Intergraph Co., Ltd.) workstation. The glacier and surrounding land surface elevation were surveyed based on a stereoscopic image generated by a three-dimensional monitor (PX 2210MW, PLANAR Co., Ltd.). We generated a triangulated irregular network of surface elevation in the stereoscopic space, which was subsequently processed to a 30 m gridded DEM by linear interpolation. The generated DEM covers the lower part of the glacier (20% of the total glacier area), excluding the snow-covered accumulation area where surface features required for the survey were unavailable. For this reason, the upper boundary of the area analyzed in this study is given by the snow line on the ALOS PRISM images acquisition date (March 15, 2007).
ASTER images used to derive the DEMs are partially covered by clouds, thus we manually removed cloud-covered areas from the ASTER DEMs. After this procedure, the ASTER DEMs cover 188 km2 of the glacier area, while the SRTM and ALOS DEMs cover 234 km2. Mean elevation change was computed excluding areas without data.
We followed the method proposed by Nuth and Kääb (2011) to remove three types of biases from the ASTER DEMs; horizontal shift, elevation dependent bias, and biases specific to the along/cross satellite track. The SRTM DEM was used as a reference in the procedure. Thereafter, vertical biases of the ASTER and ALOS DEMs were corrected for the SRTM DEM by differing the DEMs out of the glacier, where elevation change is assumed to be negligible (Figure 1A). This analysis was performed in off-ice areas covering 159 km2 within 8 km from the glacier, excluding steep terrains with a slope greater than 30°. After the corrections, standard deviation (
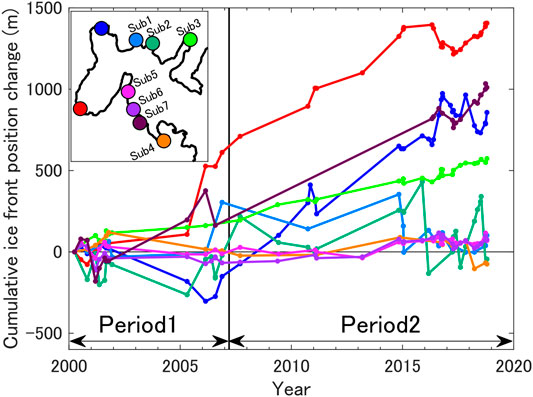
FIGURE 3. Cumulative displacement of the ice-front positions since April 2000.
The standard deviations provide measures of accuracy for elevation change evaluated at each DEM grid point. Accuracy improves after averaging the elevation changes over a large area. The uncertainty in the aerial mean was estimated from standard error (SE) defined as
where
From April 2000 to October 2018, the southern and northern termini, four outlet glacier tongues and three locations of the ice margins of Glaciar Pío XI showed advancing trends (Figure 2). The southern terminus advanced by 1,400 m and its surface area increased by 6.6 km2 (Figures 2A, 3). The terminus progressively advanced from 2000 to 2016 with a mean rate of 86 m a−1. A retreat of 150 m was observed between April 2016 and August 2017, but the glacier advanced again by 160 m from August 2017 to October 2018. After a 300 m retreat in 2000–2005, the northern terminus advanced by 1,160 m in 2005–2018 (Figures 2B, 3). The mean displacement rates during the two periods were −51 and 92 m a−1, respectively. The advance in the latter period was interrupted by short (<1 year) and small (< 250 m) retreat episodes in 2010, 2015, 2016 and 2018. The total advance during the study period was 860 m, and the surface area increased by 3.9 km2.
Four of the outlet glacier tongues (Sub1–4) and three locations of the ice margins (Sub5–7) showed generally advancing trends during the study period (Figures 2C–I, 3). Each ice-front showed substantially different short-term variations and total displacement. The frontal variations of these subsidiary ice-fronts are categorized into three types. Sub3 and Sub7 have experienced a relatively large advance (> 500 m) over the study period with mean displacement rates of 30 and 54 m a−1, respectively. Front positions of Sub5 and Sub6 have been relatively stable, i.e. fluctuations over the study period were within ±120 m. The rest of the ice-fronts (Sub1, Sub2 and Sub4) showed larger short-term variations, but total displacement over the study period was small (<100 m). For example, Sub1 rapidly advanced by 300 m from February to November 2006, which was followed by a relatively stable period from 2006 to 2014 and a sudden retreat of 350 m from November 2014 to January 2015 (Figure 3). Sub1 and Sub2 showed similar short-term frontal variations, e.g., rapid retreat of Sub1 in 2015 corresponded to similar retreat of Sub2 in 2016.
The glacier surface showed significantly large uplift during the study period (Figure 4A). Surface elevation increased by 37.3 ± 0.4 m (2.09 ± 0.02 m a−1) as a mean over the study area from February 2000 to February 2017/October 2018 (Figure 4A). From 2000 to 2007 (Period 1), mean elevation change over the area covered by the 2017/18 ASTER DEM was 8.1 ± 0.2 m (1.14 ± 0.03 m a−1) (Figure 4B), which was equivalent to an ice volume increase of 1.90 ± 0.04 km3 (0.26 ± 0.01 km3 a−1). Greater elevation change (29.2 ± 0.4 m and 2.69 ± 0.04 m a−1) and volume change (6.85 ± 0.10 km3 and 0.62 ± 0.01 km3 a−1) were observed in the following period 2007–2017/18 (Period 2) (Figure 4C), which indicated a 135 ± 10% increase in rate change from the previous period.
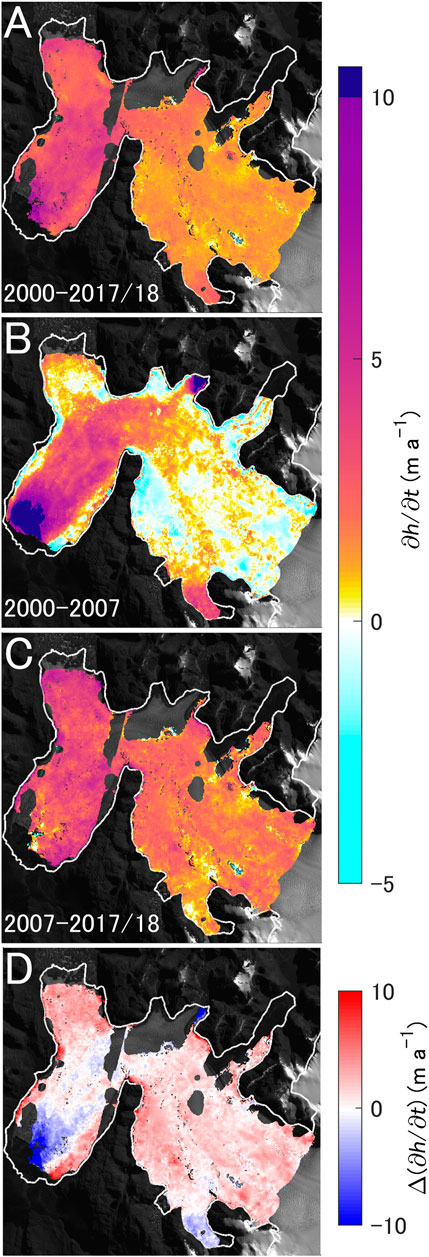
FIGURE 4. (A) Surface elevation changes over the ablation area of Glacier Pío XI from 2000 to 2017/18 (B) from 2000 to 2007 (Period 1) and (C) from 2007 to 2017/18 (Period 2). (D) The change in the rate of elevation change from Period 1 to Period 2, i.e., (C) minus (B). White line indicates the glacier outline in 2018. The background is a Landsat 7 ETM+ band 8 image acquired on April 2, 2000.
Spatial patterns of the elevation change are significantly different in Period 1 and Period 2 (Figures 4B–D), which were analyzed along the central profiles taken by Wilson et al. (2016) (Figure 5). During Period 1, an extraordinary large elevation change (> 15 m a−1) was localized near the front of the southern terminus (Figures 4B, 5C,D). Along the profile, mean elevation change within 12 km from the ice-front of the southern terminus was 32.2 ± 0.4 m, whereas mean elevation change was only −1.2 ± 0.2 m in the upper reaches (12–30 km from the southern front) (Figures 5A,C). Elevation change during Period 2 was more uniformly distributed over the study area (Figures 4C, 5A,C), i.e., elevation increased by 36.3 ± 0.8 m in the lower 12 km and 24.7 ± 0.5 m in the upper reaches (Figure 5A). Accordingly, elevation change accelerated from Period 1 to Period 2, except for the regions near the southern terminus and one of the outlet ice tongues located in the southern portion of the main trunk (Sub4) (Figure 4D). The change in the spatial pattern is also clear along the profile connecting the southern and the northern termini (Figures 5B,D). During Period 1, elevation change was small near the front of the northern terminus in contrast to the south. Elevation change during Period 2 was more uniformly distributed across the two termini, showing a clear increase (from 0.40 ± 0.09 to 3.78 ± 0.14 m a−1) near the northern terminus compared to Period 1 (Figures 4C, 5D).
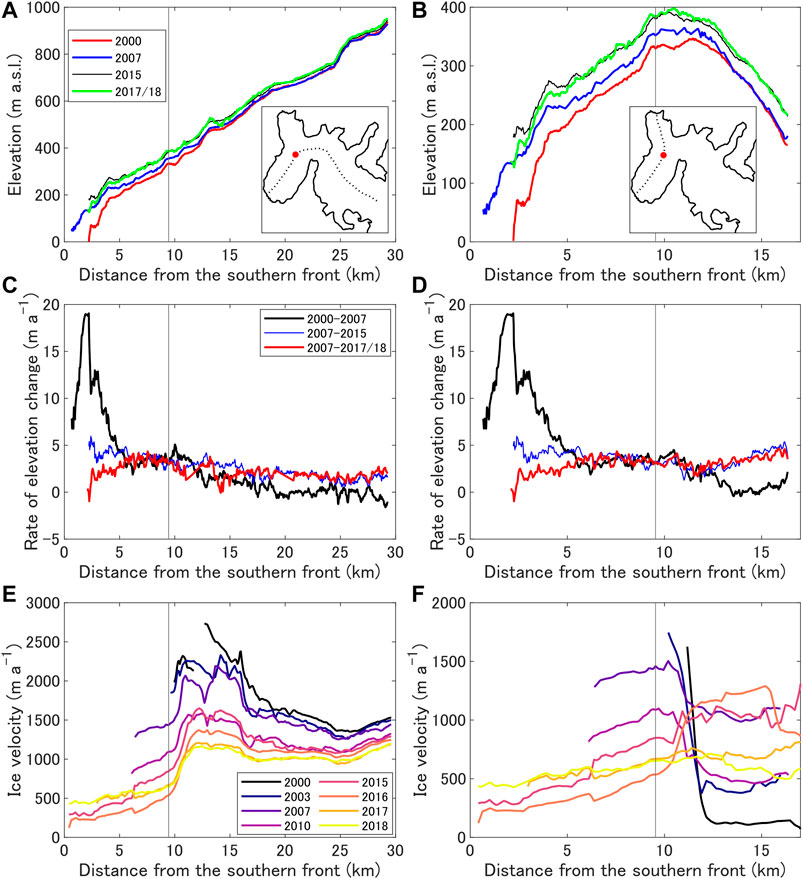
FIGURE 5. (A), (B) Glacier surface elevations in 2000, 2007, 2015 and 2017/18 along the profiles shown in the inset. The profiles correspond to those taken in Wilson et al. (2016). (C), (D) The rates of elevation change in 2000–2007, 2007–2015 and 2007–2017/18 along the profiles shown in (A) and (B). (E), (F) Ice velocity in 2000–2018 along the profiles shown in (A) and (B). Uncertainty in the ITS_LIVE velocity data was reported as < 150 m a−1. Vertical lines in (A)–(F) and red dots in (A), (B) indicate the branch point of the profiles.
Our analysis showed substantial thickening over the ablation area of Glaciar Pío XI during the study period. The rate of elevation change for the period 2000–2017/18 (2.09 ± 0.04 m a−1) is consistent with previous studies of the ablation area of the glacier, based on SRTM and ASTER DEMs (2.4 m a−1 in 2000–2012) (Willis et al., 2012), and on SRTM and TanDEM-X DEMs (3.5 m a−1 in 2000–2012) (Abdel Jaber, 2016). The rate of ice mass increase during the study period was 0.48 ± 0.03 Gt a−1, which corresponds to 4% of the total mass loss from the SPI from 2000 to 2015/16 (Malz et al., 2018). The rate increased by 135 ± 10% from Period 1 to Period 2. Accelerated thickening is consistent with a recent study, which reported elevation changes over the entire glacier surface as 0.42 m a−1 in 2000–2012 and 1.01 m a−1 in 2012–2016 (Abdel Jaber et al., 2019). The reported rates over the entire glacier are significantly smaller than our result, indicating pronounced thickening in the ablation area. This is consistent with the data reported by Abdel Jaber et al. (2019), which show clear thickening in the ablation area in contrast to small change in the accumulation area.
Thickening of Glaciar Pío XI is unique in Patagonia, but some glaciers in other regions show thickening trends as well. Taku Glacier in Alaska thickened by ∼50 m in the terminus area between 1994 and 2003 (Motyka et al., 2006). Repeated radar surveys showed that surface elevation change accounted for less than a half of the thickness change, indicating rapid excavation of basal sediments. This study suggests that a similar process is occurring underneath Glaciar Pío XI and mass gain is greater than that computed from the surface elevation change. Subglacial excavation near the terminus of Glaciar Pío XI is likely, because rapid sediment deposition was observed in front of the glacier as described in the next subsection. Harvard Glacier, a tidewater glacier in Alaska, showed surface uplift in 1950/57–2001/04 at a rate of 0.058 m a−1 (Arendt et al., 2006). Some of the basins of Vestfonna in Svalbard showed thickening between 1990 and 2005, resulting in a mean elevation change of 0.05 m a−1 (Nuth et al., 2010). Thickening in the Kunlun region, High Mountain Asia, was estimated as 0.21 m a−1 for the period between 2000 and 2016 (Brun et al., 2017). In a comparison with the data reported in other glaciers, the elevation change obtained in our study demonstrates that Glaciar Pío XI is one of the most rapidly thickening glaciers in the world.
A close investigation of the satellite images revealed the emergence of sedimentary mound above ocean surface near the ice-front of the southern terminus since 2011 (Figure 6; Supplementary Figures S1, S2). Between April 2000 and September 2010, sediment deposition was observed at the glacier front only near the eastern margin (Figures 6A, C; Supplementary Figure S1). Turbid water was draining and spreading into the fjord from a sedimentary delta formed at the side of the glacier. After the first observation in 2011, the area of sedimentary mound exposed above water gradually expanded in the fjord (Supplementary Figures S1, S2). In October 2018, a band of sediment deposition extended along the glacier front, covering nearly 80% of the frontal margin (Figures 6B, D; Supplementary Figure S2). The glacier front advanced by 1,400 m from 2000 to 2018, thus the deposition was likely due to excavation of fjord sediment and/or sediment transport by subglacial meltwater discharge.

FIGURE 6. Satellite images showing the southern terminus of Glacier Pío XI on (A) April 2, 2000 acquired by Landsat 7 ETM+ and (B) October 18, 2018 acquired by Sentinel-2 MSI. (C), (D) Schematic diagrams showing the features observed in the corresponding satellite images. The boundaries between sedimentary mound and fjord water in (C) and (D) were illustrated based on the Normalized Difference Water Index (NDWI) (McFeeters, 1996). NDWI < 0.3 was taken as a condition to distinguish sediment from water. The threshold was determined by visual inspection of the sedimentary delta observed on the image on April 2, 2000. This threshold is within a range reported in previous studies (e.g., McFeeters, 2013). The dashed line near the ice-front in (B) shows the location of the sea-floor ridge observed in the bathymetry presented by Dowdeswell and Vásquez (2013).
Sediment deposition near the southern front was reported in previous studies. In 1992, during a period of advance, proglacial delta near the margin was pushed by the ice-front forming sediment wedges above sea level (Warren and Rivera, 1994). Only small calving occurred at the central 1,500 m of the terminus, and the rest of the ice-front was in contact with sediments. Bathymetry of Eyre Fjord surveyed in 2003–2008 shows relatively flat and shallow (20–60 m) sea floor near the glacier front (Dowdeswell and Vásquez, 2013). Near the present ice-front position, a ∼30 m-high depositional ridge was formed by sediment-laden water discharge from the eastern glacier margin. Satellite image from 2018 indicates that the ice-front position is affected by the sea-floor ridge (Figure 6B). These observations confirm that sediment deposition is as a key process in the frontal dynamics of Glaciar Pío XI.
The formation of the sedimentary mounds implies its significant impact on the frontal ablation processes and glacier dynamics. The separation of the ice-front from fjord water results in reduction in ablation due to submarine melting. The glacier front is protected from fjord circulation and stabilized by the sediment deposition, so that subaqueous melting and calving flux decreases. Satellite images show frequent calving from the heavily crevassed ice-front before 2011, whereas no iceberg was observed in the fjord after the emergence of the sedimentary mound (Figures 6A,B; Supplementary Figures S1, S2). Further, ice flow is expected to slow down because back pressure from the sediments increases after the ice overrode the shoal. This hypothesis is supported by ice speed data distributed by the ITS_LIVE project (Gardner et al., 2019). Ice speed along the centerline showed a clear decelerating trend from 2000 to 2018 (Figure 5E). Speed near the branch point (red dot in Figure 5A) was about 2 km a−1 in 2000, which decreased to ∼1 km a−1 in 2010 and thereafter progressively decelerated (Figures 5E,F). This observation is consistent with previous studies based on different data sources (Muto and Furuya, 2013; Sakakibara and Sugiyama, 2014; Mouginot and Rignot, 2015; Wilson et al., 2016; Abdel Jaber et al., 2019).
The reduction in the frontal ablation, a compressive flow regime due to deceleration and ice overriding a moraine are all favorable conditions for ice-front advance, thickening and surface uplift. Therefore, we assume that the recent advance and thickening of Glaciar Pío XI is greatly affected by sediment deposition in front of the southern terminus, a similar situation as reported at Taku Glacier in Alaska (Motyka and Echelmeyer, 2003; Kuriger et al., 2006; Motyka et al., 2006; Truffer et al., 2009). Presumably, sediment deposition played a critical role also in the long-term fluctuations of Glaciar Pío XI as demonstrated by numerical modeling of tidewater glacier frontal variations (Brinkerhoff et al., 2017).
Bathymetry surveyed in 2003–2008 showed that the fjord was shallower than 50 m near the southern terminus (Dowdeswell and Vásquez, 2013). Most likely, the glacier dynamics and frontal ablation were already affected by the shoal before the sedimentary mound emerged above the ocean surface in 2011. The mound formed near the glacier front was not a stable feature. Satellite images indicate occasional disappearance or reduction in the area of the sedimentary mound in a relatively cold season, e.g., August 2017, May 2019 and July 2020 (Supplementary Figure S2). A likely interpretation of the seasonal evolution is a balance between sediment discharge from the glacier and its removal by fjord circulation. The extent of the sediment deposits reduced when sediment laden meltwater discharge decreased in winter.
Previous studies reported an increasing trend in precipitation over the last few decades in Patagonia (Schaefer et al., 2015), and a correlation was suggested between the spatial pattern of snow fall increase and the locations of relatively stable glaciers (Bravo et al., 2019). To investigate a possible influence of climatic trend on the observed glacier change, we analyzed ERA-5 reanalysis data (Hersbach and Dee, 2016). ERA-5 reanalysis data is the successor of ERA-Interim, which has been widely applied for climate analysis and modeling. Previous studies reported an improvement in the performance of the ERA-5 air temperature and precipitation datasets (Albergel et al., 2018; Tetzner et al., 2019). Air temperature and precipitation from grid cells covering the glacier (49.0–49.5°S, 73.5–74.0°W) were averaged for this purpose. Summer mean temperature (December–February) showed a slight warming trend during 1979–2019 at a rate of + 0.09°C decade−1 (p = 0.34). This trend is due to a significant temperature increase after 2000 (+0.50°C decade−1 in 2000–2019, p = 0.02) (Figure 7A). Annual mean air temperature also showed a similar positive trend during the same period (0.59 °C decade−1, p < 0.01). Therefore, the advancing trend of Glaciar Pío XI since 2000 cannot be explained by the temperature change.
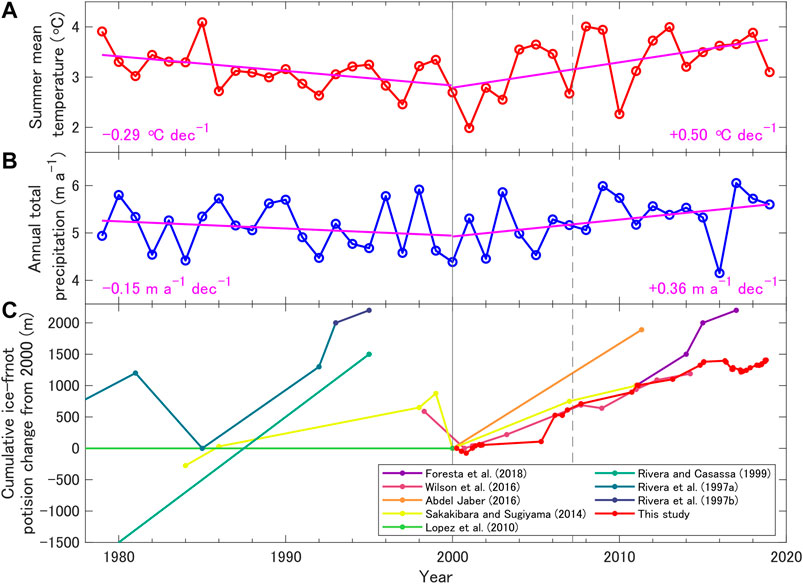
FIGURE 7. (A) Summer mean air temperature (December–February) and (B) annual precipitation from the ERA-5 reanalysis data covering Glaciar Pio XI (49.0–49.5°S, 73.5–74.0°W). Linear regression lines and linear trends of the data in 1979–2000 and 2000–2019 are shown in magenta. (C) Cumulative ice-front position change relative to 2000 at the southern terminus.
Annual precipitation increased after 2000 (+0.36 m a−1 decade−1 in 2000–2019, p = 0.09) in contrast to a slightly negative trend in the previous period (−0.15 m a−1 decade−1 in 1979–2000, p = 0.39) (Figure 7B). Snow accumulation in the relatively large accumulation area has been pointed out as a key process driving the extraordinary behavior of Glaciar Pío XI (Rivera et al., 1997b; Rivera and Casassa, 1999; Rivera, 2018). The gradual increase in precipitation after 2000, which is consistent with previous studies (Schaefer et al., 2015; Bravo et al., 2019), implies greater accumulation in the high elevation area. However, the precipitation trend is not a likely reason of the rapid change near the glacier front since 2000. Influence of increased accumulation propagates down-glacier in a longer time scale, which is not able to explain the extraordinary rapid thickening near the southern front followed by pervasive thickening in the upper reaches. It is also clear that frontal variations since 1980 show correlation neither with temperature nor with precipitation (Figure 7C). It should be noted that snow accumulation in the upper reaches of Glaciar Pío XI is large and variable (Schwikowski et al., 2013), which is difficult to reproduce by reanalysis data. Precipitation and snow accumulation in Patagonia are complex processes as demonstrated by a recent study on moisture transport to the region (Sauter, 2020). Considering the large magnitude of the recent glacier change, however, a noticeable indication is expected in the climate data if the change was driven by surface mass balance. Therefore, we assume the reduction in the frontal ablation and ice speed as the primary control of the glacier change in 2000, whereas snow accumulation in the relatively large accumulation area affects the longer-term advancing trend of Glaciar Pío XI.
The glacier thickened over the entire region of the ablation area (Figure. 4A), and advancing trends were observed at the outlet glaciers and ice margins as well (Figures 2, 3). Although the generally thickening and advancing trends are consistent over the study area, the magnitude of the changes was spatially inhomogeneous. Here, we analyze the spatial variations in the surface elevation change to understand the process driving the glacier advance and thickening revealed in this study.
The rate of the elevation change generally increased toward the lower elevation area (Figure 8). Mean elevation changes below and above 400 m a.s.l. were 3.8 ± 0.3 and 0.3 ± 0.2 m a−1 during Period 1 (Figure 8A) and 3.3 ± 0.4 and 1.9 ± 0.3 m a−1 during Period 2 (Figure 8B). Elevation increased in the upper reaches particularly in the later period, which is inconsistent with the hypothesis of down-glacier mass transfer due to surge before 2000. During Period 1, extraordinary rapid uplift was observed near the southern front and Sub2 front (Figures 4B, 8A). The mean rates in these regions reached 20 m a−1, resulting in >100 m ice surface uplift over the seven-year period. Changes were more uniformly distributed during Period 2 (Figures 4C, 8B). Acceleration in the uplift rates is evident over the entire elevation range, except for the southern terminus, Sub2 and Sub4 ice tongue regions (Figure 4D). Notable uplift was observed at the northern terminus and Sub3 ice tongue, as well as over the main trunk of the glacier (Figure 8B). Although the rates were smaller than during Period 1, the southern terminus, Sub2 and Sub4 ice tongues still showed positive elevation change during Period 2.
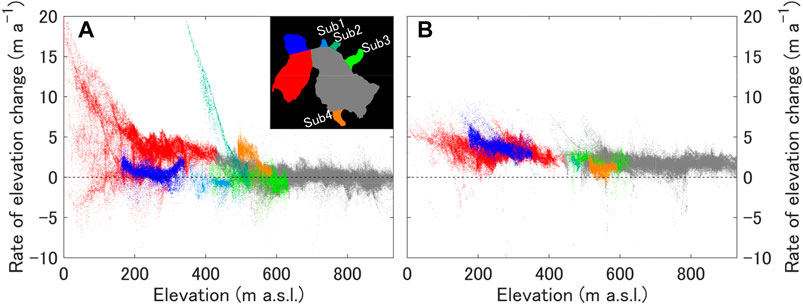
FIGURE 8. The rates of the surface elevation change (A) from 2000 to 2007 and (B) from 2007 to 2017/18 as obtained at each grid of the DEMs. The marker colors show the location on the glacier as illustrated in the inset in (A).
The rapid uplift near the southern terminus during Period 1 can be explained by the sediment deposition described in the previous subsection. We assume that the elevation increase at a rate greater than 10 m a−1 was due to vertical straining associated with longitudinally compressive ice flow. The elevation change was possibly enhanced by thickening of the subglacial sediment layer. Near the southern and northern termini, water depth was significantly shallower in Eyre Fjord (∼20 m) than in Lago Greve (∼150 m) (Warren and Rivera, 1994; Dowdeswell and Vásquez, 2013). The southern terminus was influenced more by sediment deposition because of the shallow depth of the fjord. We speculate that the extraordinary rapid uplift at Sub2 ice tongue during Period 1 was a result of similar sediment deposition. The northern terminus showed a clear phase shift from slight thickening (0.4 ± 0.7 m a−1) and retreat (–23 m a−1) during Period 1 to more rapid thickening (3.8 ± 0.7 m a−1) and advance (84 m a−1) during Period 2. Ice speed data show acceleration of the northern terminus during 2000–2016, while the southern terminus decelerated during the same period (Figure 5F). These observations indicated that the primary flow path at the bifurcating area switched from the south to the north. Therefore, we attribute the thickening in the northern terminus during Period 2 to the increase in ice flux into the region. We also hypothesize that the deceleration in the southern terminus region affected the flow regime in the upper reaches and caused the thickening in the main trunk of the glacier during Period 2. Longitudinal flow regime became less extensive (i.e. vertical strain rate became less compressive) in the region, which resulted in accumulation of ice after 2010. Such a change in the flow regime is clearly observable in Figure 5E ( > 10 km from the front) as well as those reported by Wilson et al. (2016) and Abdel Jaber et al. (2019).
Advance of the southern terminus ceased in 2015 and the ice-front position has been stabilized until 2019 (Figures 2A, 3). To investigate the surface elevation change during this recent period, we utilized elevation data in 2015 reported by Malz et al. (2018). The mean elevation change along the centerline from 2007 to 2015 (2.8 m a−1) was greater than that from 2007 to 2017/18 (2.2 m a−1) (Figure 5C), which implies reduction in the thickening rate after 2015. Within 2–6 km from the southern terminus, even a thinning trend was observed from 2015 to 2017/18 (Figure 5B). Care should be taken because the temporal separation of the compared DEMs is only 14 months from December 2015 to February 2017, thus accurate evaluation of the elevation change is difficult for this period. However, it is likely that the thickening trend halted approximately when the glacier front was stabilized. Moreover, the southern terminus accelerated from 2017 to 2018 after the deceleration continued since 2000 (Figure 5F). These observations indicate changes in the trends of glacier advance, thickening and deceleration, and thus demonstrate the importance of further monitoring of Glaciar Pío XI.
This paper reported recent changes in the ice-front positions and surface elevation of Glaciar Pío XI, an advancing calving glacier in the SPI. Satellite images and DEMs acquired in 2000–2018 were utilized to quantify elevation change in the ablation area as well as frontal variations of the two major termini, four outlet glaciers and three locations of ice margins calving into lakes. Most of the ice-fronts showed advancing trends over the study period. The greatest advance (1,400 m from 2000 to 2018) was observed at the southern terminus. The northern terminus and some of the subsidiary ice-fronts advanced by several hundred meters during the same period. Glacier-surface elevation increased at a rate increasing from 1.14 ± 0.03 m a−1 in 2000–2007 to 2.69 ± 0.04 m a−1 in 2007–2017/18. If we assume this elevation change is totally due to ice thickness change, the mass gain is equivalent to 4% of the mass loss in the SPI from 2000 to 2015/16. Our data demonstrated that Glaciar Pío XI is one of the most rapidly thickening glaciers in the world.
Satellite images indicated sediment deposition and formation of a mound in front of the southern terminus. The terminus thickened at a rate greater than 10 m a−1 between 2000 and 2007, which was most likely due to the influence of the sediment deposition on the glacier dynamics and frontal ablation. Although generally thickening and advancing trends were observed over the study area, changing rates are inhomogeneous in space and time. A likely interpretation of the advancing and thickening of Glaciar Pío XI is as follows. After a short period of retreat in 1998–2000, the southern terminus began rapid advance and thickening in 2005 under the influence of sediment deposition near the ice-front. The southern terminus decelerated during this period, affecting the ice flow regime in the upper reaches. After 2010, the northern terminus and the main trunk of the glacier began thickening as a consequence of the ice dynamics change propagated up-glacier. We conclude that the ice dynamics affected by the sediment deposition played the key role in the recent changes in Glaciar Pío XI, with a possible influence of recently increasing precipitation.
The datasets presented in this study can be found in online repositories. The names of the repository/repositories and accession number(s) can be found below: Landsat images and SRTM DEMs were downloaded from http://earthexplorer.usgs.gov/. Sentinel image were downloaded from https://scihub.copernicus.eu/dhus/. ASTER DEMs were downloaded from https://gbank.gsj.jp/madas/map/index.html.
SH analyzed data and produced figures. All authors SH and SS discussed the results and wrote the manuscript.
This research was supported by the Japan Society for the Promotion of Science, Grants-in-Aid for Scientific Research JP16H05734 and JP20H00186.
The authors declare that the research was conducted in the absence of any commercial or financial relationships that could be construed as a potential conflict of interest.
We thank Takanobu Sawagaki for his help to generate the ALOS DEM and variable comments on the study. Thanks are also to Masato Furuya for his contribution to the initial stage of the study. Ryan Wilson and Centro de Estudios Cientificos provided the elevation data from laser altimetry in 2007. We thank the Scientific Editor Christoph Schneider for handling the paper, and two reviewers for providing constructive comments. The English was corrected by Ariah Kidder. Landsat images and SRTM DEMs were downloaded from http://earthexplorer.usgs.gov/. Sentinel images were downloaded from https://scihub.copernicus.eu/dhus/. ASTER DEMs were downloaded from https://gbank.gsj.jp/madas/map/index.html. The ITS_LIVE ice velocity dataset was downloaded fromhttps://nsidc.org/apps/itslive/ and the ERA-5 reanalysis data from https://cds.climate.copernicus.eu/.
The Supplementary Material for this article can be found online at: https://www.frontiersin.org/articles/10.3389/feart.2020.576044/full#supplementary-material.
Abdel Jaber, W. (2016). Derivation of mass balance and surface velocity of glaciers by means of high resolution synthetic aperture radar: application to the Patagonian Icefields and Antarctica, Dissertation, Technische Universität München, Available at: http://elib.dlr.de/109075/(Accessed April 14, 2020).
Abdel Jaber, W., Rott, H., Floricioiu, D., Wuite, J., and Miranda, N. (2019). Heterogeneous spatial and temporal pattern of surface elevation change and mass balance of the Patagonian Ice fields between 2000 and 2016. Cryosphere. 13, 2511–2535. doi:10.5194/tc-13-2511-2019
Albergel, C., Dutra, E., Munier, S., Calvet, J. C., Munoz-Sabatere, J., de Rosnay, P., et al. (2018). ERA-5 and ERA-Interim driven ISBA land surface model simulations: which one performs better? Hydrol. Earth Syst. Sci. 22, 3515–3532. doi:10.5194/hess-22-3515-2018
Aniya, M., Sato, H., Naruse, R., Skvarca, P., and Casassa, G. (1997). Recent variations in the Southern Patagonia Icefield, South America. Arc. Alp. Res. 29 (1), 1–12. doi:10.1080/00040851.1997.12003210
Arendt, A., Echelmeyer, K., Harrison, W., Lingle, C., Zirnheld, S., Valentine, V., et al. (2006). Updated estimated of glacier volume changes in the western Chugach Mountains, Alaska, and a comparison of regional extrapolation methods. J. Geophys. Res. 111, F03019. doi:10.1029/2005JF000436
Bolch, T., Pieczonka, T., and Benn, D. I. (2011). Multi-decadal mass loss of glaciers in the Everest area (Nepal Himalaya) derived from stereo imagery. Cryosphere. 5, 349–358. doi:10.5194/tc-5-349-2011
Braun, M. H., Malz, P., Sommer, C., Farías-Barahona, D., Sauter, T., Casasssa, G., et al. (2019). Constraining glacier elevation and mass changes in South America. Nat. Clim. Change. 9, 130–136. doi:10.1038/s41558-018-0375-7
Bravo, C., Bozkurt, D., Reyes, A. G., Quincey, D. J., Ross, A. N., Farías-Barahona, D., et al. (2019). Assessing snow accumulation patterns and changes on the Patagonian Icefields. Front. Earth Sci. 7 (1), 30. doi:10.3389/fenvs.2019.00030
Brinkerhoff, D., Truffer, M., and Aschwanden, A. (2017). Sediment transport drives tidewater glacier periodicity. Nat. Commun. 8, 90. doi:10.1038/s41467-017-00095-5
Brun, F., Berthier, E., Wagnon, P., Kääb, A., and Treichler, D. (2017). A spatially resolved estimate of High Mountain Asia glacier mass balances, 2000-2016. Nat. Geosci. 10, 668–673. doi:10.1038/NGEO2999
Carrivick, J. L., Davies, B. J., James, W. H. M., Quincey, D. J., and Glasser, N. F. (2016). Distributed ice thickness and glacier volume in Southern South America. Global Planet. Change. 146, 122–132. doi:10.1016/j.gloplacha.2016.09.010
Davies, B., and Glasser, N. (2012). Accelerating shrinkage of Patagonian glaciers from the little ice age (∼AD 1870) to 2011. J. Glaciol. 58 (212), 1063–1084. doi:10.3189/2012JoG12J026
De Angelis, H. (2014). Hypsometry and sensitivity of the mass balance to changes in equilibrium-line altitude: the case of the Southern Patagonia Icefield. J. Glaciol. 60 (219), 14–28. doi:10.3189/2014JoG13J127
Dowdeswell, J. A., and Vásquez, M. (2013). Submarine landforms in the fjords of Southern Chile: implications for glacimarine processes and sedimentation in a mild glacier-influenced environment. Quat. Sci. Rev. 64, 1–19. doi:10.1016/j.quascirev.2012.12.003
Dussaillant, I., Berthier, E., Brun, F., Masaiokas, M., Hugonnet, R., Favier, V., et al. (2019). Two decades of glacier mass loss along the Andes. Nat. Geosci. 12, 802–808. doi:10.1038/s41561-019-0432-5
EROS Center (2017). Shuttle radar Topography mission (SRTM) 1 arc-second global. Available at: https://www.usgs.gov/centers/eros/science/usgs-eros-archive-digital-elevation-shuttle-radar-topography-mission-srtm-1-arc.
Foresta, L. N., Gourmelen, F., Weissgerber, P., Nienow, J., Williams, A., Shepherd, M., et al. (2018). Heterogeneous and rapid ice loss over the Patagonian Ice Fields revealed by CryoSat-2 swath radar altimetry. Remote Sens. Environ. 211, 441–455. doi:10.1016/j.rse.2018.03.041
Gardelle, J., Berthier, E., Arnaud, Y., and Kääb, A. (2013). Region-wide glacier mass balances over the Pamir Karakoram-Himalaya during 1999-2011. Cryosphere. 7, 1263–1286. doi:10.5194/tc-7-1263-2013
Gardner, A. S., Fahnestock, M. A., and Scambos, T. A. (2019). ITS_LIVE regional glacier and ice sheet surface velocities. Available at: http://its-live-data.jpl.nasa.gov.s3.amazonaws.com/documentation/ITS_LIVE-Regional-Glacier-and-Ice-Sheet-Surface-Velocities.pdf.
Hersbach, H., and Dee, D. (2016). ERA reanalysis is in production. Available at: https://www.ecmwf.int/en/newsletter/147/news/era5-reanalysis-production.
IPCC (2019). IPCC special report on the Ocean and cryosphere in a changing climate. Available at: https://www.orfonline.org/expert-speak/ipccs-special-report-on-oceans-and-cryosphere-in-a-changing-climate-key-takeaways-for-hindu-kush-himalayan-region-57365/.
Kruiger, E. M., Truffer, M., Motyka, R. J., and Bucki, A. K. (2006). Episodic reactivation of large-scale push moraines in front of the advancing Taku Glacier, Alaska. J. Geophys. Res. 111, F01009. doi:10.1029/2005JF000385
Lopez, P., Chevallier, P., Favier, V., Pouyaud, B., Ordenes, F., and Oerlemans, J. (2010). A regional view of fluctuations in glacier length in Southern South America. Global Planet. Chang. 71 (1–2), 85–108. doi:10.1016/j.gloplacha.2009.12.009
Malz, P., Meier, W., Casassa, G., Jaña, R., Skvarca, P., and Braun, M. (2018). Elevation and mass changes of the Southern Patagonia Icefield derived from TanDEM-X and SRTM data. Remote Sens. 10 (188), 1–17. doi:10.3390/rs10020188
McFeeters, S. K. (1996). The use of the normalized difference water index (NDWI) in the delineation of open water features. Int. J. Rem. Sens. 17 (7), 1425–1432. doi:10.1080/01431169608948714
McFeeters, S. K. (2013). Using the normalized difference water Index (NDWI) within a geographic information system to detect swimming pools for mosquito abatement: a practical approach. Remote Sens. 5, 3544–3561. doi:10.3390/rs5073544
Millan, R., Rignot, E., Rivera, A., Martineau, V., Mouginot, J., Zamora, R., et al. (2019). Ice thickness and bed elevation of the Northern and Southern Patagonian Icefields. Geophys. Res. Lett. 46, 6626–6635. doi:10.1029/2019GL082485
Minowa, M., Schaefer, M., Skvarca, P., Matoba, S., and Gacitúa, G. (2019). Glaciological traverse across the Southern Patagonian Icefield. Bull. Glaiol. Res. 37, 47–56. doi:10.5331/bgr.19R03
Moon, T., and Joughin, I. (2008). Changes in ice front position on Greenland’s outlet glaciers from 1992 to 2007. J. Geophys. Res. 113, F02022. doi:10.1029/2007JF000927
Motyka, R. J., and Echelmeyer, K. A. (2003). Taku Glacier (Alaska, U.S.A.) on the move again: active deformation of proglacial sediments. J. Glaciol. 49 (164), 50–58. doi:10.3189/172756503781830962
Motyka, R. J., Truffer, M., Kuriger, E. M., and Bucki, A. K. (2006). Rapid erosion of soft sediments by tidewater glacier advance: Taku Glacier, Alaska, USA. Geophys. Res. Lett. 33, L24504. doi:10.1029/2006GL028467
Mouginot, J., and Rignot, E. (2015). Ice motion of the Patagonian Icefields of South America: 1984–2014. Geophys. Res. Lett. 42, 1441–1449. doi:10.1002/2014GL062661
Muto, M., and Furuya, M. (2013). Surface velocities and ice-front positions of eight major glaciers in the Southern Patagonian Ice Field, South America, from 2002 to 2011. Remote Sens. Environ. 139, 50–59. doi:10.1016/j.rse.2013.07.034
Nuth, C., and Kääb, A. (2011). Co-registration and bias corrections of satellite elevation data sets for quantifying glacier thickness change. Cryosphere. 5, 271–290. doi:10.5194/tc-5-271-2011
Nuth, C., Moholdt, G., Kohler, J., Hagen, J. O., and Kääb, A. (2010). Svalbard glacier elevation changes and contribution to sea level rise. J. Geophys. Res. 115, F01008. doi:10.1029/2008JF001223
RGI Consortium (2017). Randolph glacier inventory – a dataset of global glacier outlines: version 6.0: technical report. Available at: https://doi.org/10.7265/N5-RGI-60.
Rignot, E., Rivera, A., and Casassa, G. (2003). Contribution of the Patagonia icefields of South America to sea level rise. Science. 302, 434–437. doi:10.1126/science.1087393
Rivera, A. (1992). El Glaciar Pio XI: Avances y retrocesos, El impacto sobre su entorno durante el presente siglo. Rev. Geogr. Chileerra Aust. 36, 33–62.
Rivera, A. (2018). Glaciar Pío XI: La excepción a la tendencia de desglaciación en Patagonia Pio XI glacier: The exception to the deglaciation trend in Patagonia. Rev. Geogr. Chileerra Aust. 54, 1–12. doi:10.23854/07199562.2018541rivera1
Rivera, A., Aravena, J. C., and Casassa, G. (1997a). Recent fluctuations of Glaciar Pio XI Patagonia: discussion of a glacial surge hypothesis. Mount. Res. Dev. 17, 309–322. doi:10.2307/3674021
Rivera, A., and Casassa, G. (1999). Volume changes on Pio XI glacier, Patagonia: 1975–1995. Global Planet. Change. 22, 1–4.
Rivera, A., Lange, H., Aravena, J. C., and Casassa, G. (1997b). The 20th-century advance of Glaciar Pio XI, Chilean Patagonia. Ann. Glaciol. 24, 66–71. doi:10.3189/S0260305500011952
Sakakibara, D., and Sugiyama, S. (2014). Ice-front variations and speed changes of calving glaciers in the Southern Patagonia Icefield from 1984 to 2011. J. Geophys. Res. Earth Surf. 119, 2541–2554. doi:10.1002/2014JF003148
Sauter, T. (2020). Revisiting extreme precipitation amounts over southern South America and implications for the Patagonian Icefields. Hydrol. Earth Syst. Sci. 24, 2003–2016. doi:10.5194/hess-24-2003-2020
Schaefer, M., Machguth, H., Falvey, M., Casassa, G., and Rignot, E. (2015). Quantifying mass balance processes on the Southern Patagonia Icefield. Cryosphere. 9, 25–35. doi:10.5194/tc-9-25-2015
Schwikowski, M., Schläppi, M., Santibañez, P., Rivera, A., and Casassa, G. (2013). Net accumulation rates derived from ice core stable isotope records of Pío XI glacier, Southern Patagonia Icefield. Cryosphere. 7, 1635–1644. doi:10.5194/tc-7-1635-2013
Tetzner, D., Thomas, E., and Allen, C. (2019). A validation of ERA5 reanalysis data in the Southern Antarctic Peninsula—Ellsworth land region, and its implications for ice core studies. Geosciences. 9 (7), 289. doi:10.3390/geosciences9070289
Truffer, M., Motyka, R. J., Hekkers, M., Howat, I. M., and King, M. A. (2009). Terminus dynamics at an advancing glacier: Taku Glacier, Alaska. J. Glaciol. 55, 1052–1060. doi:10.3189/002214309790794887
Warren, C. R., and Rivera, A. (1994). Non-linear climatic response of calving glaciers: a case study of Pio XI Glacier, Chilean Patagonia. Rev. Chil. Hist. Nat. 67, 385–394.
Warren, C. R., Rivera, A., and Post, A. (1997). Greatest holocene advance of Glaciar Pio XI, Chilean Patagonia: possible causes. Ann. Glaciol. 24, 11–15. doi:10.3189/S026030550001185X
Willis, M. J., Melkonian, A. K., Pritchard, M. E., and Rivera, A. (2012). Ice loss from the Southern Patagonian Ice Field, South America, between 2000 and 2012. Geophys. Res. Lett. 39, L17501. doi:10.1029/2012GL053136
Keywords: calving glacier, elevation change, advancing glacier, satellite imagery, photogrammetry
Citation: Hata S and Sugiyama S (2021) Changes in the Ice-Front Position and Surface Elevation of Glaciar Pío XI, an Advancing Calving Glacier in the Southern Patagonia Icefield, From 2000–2018. Front. Earth Sci. 8:576044. doi: 10.3389/feart.2020.576044
Received: 25 June 2020; Accepted: 07 December 2020;
Published: 21 January 2021.
Edited by:
Christoph Schneider, Humboldt-Universität zu Berlin, GermanyReviewed by:
Andres Rivera, University of Chile, ChileCopyright © 2021 Hata and Sugiyama. This is an open-access article distributed under the terms of the Creative Commons Attribution License (CC BY). The use, distribution or reproduction in other forums is permitted, provided the original author(s) and the copyright owner(s) are credited and that the original publication in this journal is cited, in accordance with accepted academic practice. No use, distribution or reproduction is permitted which does not comply with these terms.
*Correspondence: Shuntaro Hata, c2h1bnRhcm8uaGF0YUBmcm9udGllci5ob2t1ZGFpLmFjLmpw
Disclaimer: All claims expressed in this article are solely those of the authors and do not necessarily represent those of their affiliated organizations, or those of the publisher, the editors and the reviewers. Any product that may be evaluated in this article or claim that may be made by its manufacturer is not guaranteed or endorsed by the publisher.
Research integrity at Frontiers
Learn more about the work of our research integrity team to safeguard the quality of each article we publish.