
95% of researchers rate our articles as excellent or good
Learn more about the work of our research integrity team to safeguard the quality of each article we publish.
Find out more
ORIGINAL RESEARCH article
Front. Earth Sci. , 14 December 2020
Sec. Geomagnetism and Paleomagnetism
Volume 8 - 2020 | https://doi.org/10.3389/feart.2020.563453
This article is part of the Research Topic Multi-disciplinary Applications in Magnetic Chronostratigraphy View all 11 articles
 Luigi Jovane1*
 Fabio Florindo1,2,3
 Gary Wilson4,5
 Stephanie de Almeida Pecchiai Saldanha Leone1
 Muhammad Bin Hassan1
 Daniel Rodelli1
 Giuseppe Cortese4
New paleomagnetic results from the late Eocene-Middle Miocene samples from Deep Sea Drilling Project Site 274, cored during Leg 28 on the continental rise off Victoria Land, Ross Sea, provide a chronostratigraphic framework for an existing paleoclimate archive during a key period of Antarctic climate and ice sheet evolution. Based on this new age model, the cored late Eocene-Middle Miocene sequence covers an interval of almost 20 Myr (from ∼35 to ∼15 Ma). Biostratigraphic constraints allow a number of possible correlations with the Geomagnetic Polarity Time Scale. Regardless of correlation, average interval sediment accumulation rates above 260 mbsf are ∼6 cm/kyr with the record punctuated by a number of unconformities. Below 260 mbsf (across the Eocene/Oligocene boundary) interval, sedimentation accumulation rates are closer to ∼1 cm/kyr. A major unconformity identified at ∼180 mbsf represents at least 9 Myr accounting for the late Oligocene and Early Miocene and represent non-deposition and/or erosion due to intensification of Antarctic Circumpolar Current activity. Significant fluctuations in grain size and magnetic properties observed above the unconformity at 180 mbsf, in the Early Miocene portion of this sedimentary record, reflect cyclical behavior in glacial advance and retreat from the continent. Similar glacial cyclicity has already been identified in other Miocene sequences recovered in drill cores from the Antarctic margin.
Deep Sea Drilling Program (DSDP) Leg 28 (Figure 1) was designed to explore the long-term climatic, biostratigraphic and geological history of Antarctica and its environments (Hayes and Frakes, 1975). Such geological records provide insights into modern and future climate sensitivity estimates, particularly for time periods characterized by the presence of continental ice sheets and a paleogeography similar to modern (e.g., Markwick, 2007; Farnsworth et al., 2019).
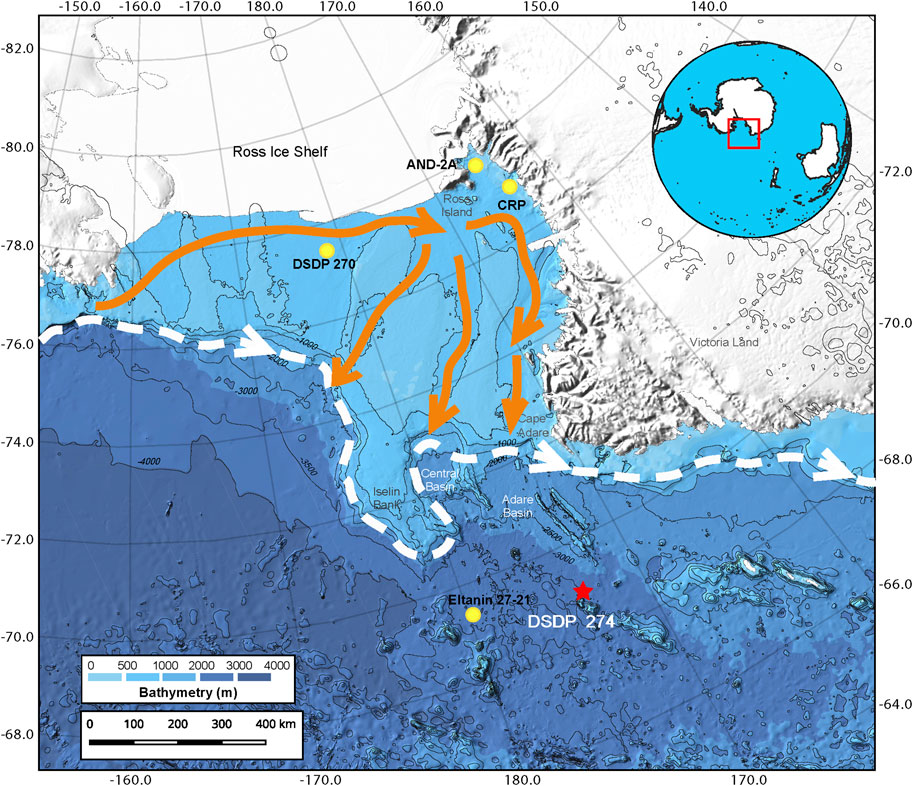
FIGURE 1. Map of Ross Sea with schematic representation of present-day Antarctic Slope Current (dashed white line) and the continental shelf current flow (orange lines) (Ainley and Jacobs, 1981; Whitworth et al., 1995; Orsi and Wiederwohl, 2009). Location of DSDP Site 274 is indicated by a red star. DSDP 270, AND-2A, Eltanin 27–21 and CRP are also shown because they are reference cores in the area (respectively, Kulhanek et al., 2019, Jovane et al., 2019; Jovane et al., 2008; Roberts et al., 2013).
Earth’s climate underwent a stepwise shift from greenhouse to icehouse conditions during the Cenozoic. Major ice sheets first appeared on Antarctica across the Eocene/Oligocene boundary co-incident with the earliest Oligocene Oi-1 oxygen isotope event (1.0‰ δ18O increase at ca. 33.55 Ma; e.g., Miller et al., 1991; Zachos et al., 1996; Zachos et al., 2001; Miller, 2005a; Miller et al., 2005b; Francis et al., 2009; Lurcock and Florindo, 2017, Westerhold et al., 2020). While long thought to be associated with the early glaciation of Antarctica (Kennett, 1977), the Antarctic Circumpolar Current did not appear until the Late Oligocene (Lyle, et al., 2007). Throughout the Oligocene, Antarctic ice sheets experienced repeated cycles of advance and retreat, as indicated by large and rapid changes in global sea level (Kominz and Pekar, 2001) and δ18O variations in deep-ocean sediment (Pälike et al., 2006). Following the inception of the Antarctic Circumpolar Current, the Oligocene terminated with another transient global cooling event (Mi-1, at ca. 23 Ma), characterized by a ∼1‰ positive excursion in marine benthic foraminiferal δ18O records (e.g., Wilson et al., 2009; Beddow et al., 2016) and associated with a large-scale Antarctic ice sheet expansion at the Oligocene-Miocene transition. This event was dramatic in scale, with the East Antarctic Ice Sheet (EAIS) estimated to have grown from 50 to 125% of its present-day size (e.g., Pekar et al., 2006). It was the first of a series of similar “Mi-” oxygen isotope events that, while less extreme than Mi-1, were responsible for the progressive cooling and glaciation experienced by Antarctica during the Miocene. As in the Oligocene, however, the cooling during the Miocene was not monotonic, but characterized by swings between cooler and warmer climate (e.g., Miller et al., 1991; Zachos et al., 1997; Zachos et al., 2001; Lear et al., 2004; Holbourn et al., 2005; Shevenell et al., 2008; Holbourn et al., 2013; Holbourn et al., 2014; Holbourn et al., 2015; Lear et al., 2015; Holbourn et al., 2018; Liebrand et al., 2017; Westerhold et al., 2020).
After the initial onset of and recovery from Mi-1, the Early Miocene experienced relatively warm intervals. The warming cycles of the Early Miocene culminated in the Mid-Miocene Climatic Optimum (MMCO) at around 17–14 Ma, immediately followed by the Middle Miocene Climate Transition (MMCT) at 14.2–13.8 Ma (Shevenell et al., 2004). The transition, as recorded in deep-ocean δ18O variations, was a significant one: the MMCO was the warmest interval since the Eocene, while the MMCT, and the subsequent cooling during the rest of the Miocene, produced temperatures colder than any previously observed in the Cenozoic. During this time, there was a sizable EAIS, as inferred from δ18O, sea level curves and direct sedimentological evidence from the Antarctic continent itself (e.g., Lewis et al., 2007).
In this paper, we present the first magnetostratigraphic chronology of a late Eocene-Early Miocene record from a sediment core (DSDP Leg 28, Site 274) obtained from offshore Cape Adare in the Ross Sea Sector of the Antarctic continent in 1973. The new age model will allow further studies of this unique core to produce future paleoenvironmental reconstructions focusing on the discharge of sediments from the catchment areas in this region of the Ross Sea (e.g., Sagnotti, et al., 1998; Jovane et al., 2004; Jovane et al., 2019; Roberts et al., 2013).
DSDP Site 274 was drilled during Expedition Leg 28 in February 1973, on the continental rise off Victoria Land, Ross Sea, about 250 km north-northeast of Cape Adare (Figure 1) (68°59.81S, 173°25.64′E; water depth of 3,326 m). A 421-m thick, largely terrigenous, sedimentary section was drilled with an average core recovery of 66%.
A graben-like structure, with relief of several hundred meters (Houtz and Meijer, 1970), lies to the southwest of the site and probably served as an effective barrier to the downslope transport of terrigenous material. Seafloor magnetic lineations in the area and detailed biostratigraphic studies suggested a late Eocene/Early Oligocene age for the base of the sedimentary cover (Hayes et al., 1975; Hayes and Frakes, 1975). However, paleomagnetic analysis has not been carried out on those cores until this study.
For this study, half-core samples were obtained from the International Ocean Discovery Program (IODP) Gulf Coast Repository from 320 m below sea floor (mbsf) (close to the contact with basement) to 123 mbsf. This interval comprises silty claystone, diatom-detrital silty clay ooze and diatom-rich silty clay (Hayes et al., 1975; Hayes and Frakes, 1975). An unconformity was identified at 180.5 mbsf by Frakes (1975) and interpreted to represent a time interval between late Oligocene (Core 20) and Early-Middle Miocene (Core 19).
For the present study, DSDP Site 274 working half core samples were provided by the IODP Gulf Coast Repository from which we collected 8 cm3 cubic samples, using a non-magnetic double blade saw. The core was dry but preservation was excellent.
Two hundred and sixty samples were taken from the center of the working halves between 316 mbsf (Core 34) and 123 mbsf (Core 14), with a sample collected at least every meter (depending on the core recovery, drilling-induced disturbance and where sufficient material was available). Sediment samples from the interval between 320 and 180 mbsf are stiffer and more consolidated, while those from the interval between 180 and 123 mbsf are softer and less consolidated. Samples were oriented only with respect to vertical direction, therefore absolute paleomagnetic declinations could not be determined. Paleomagnetic analyses were performed at Instituto de Astronomia, Geofísica e Ciências Atmosféricas da Universidade de São Paulo (IAG USP) in a magnetically shielded room using a 2 G Enterprises magnetometer (Model 755–4K). Grain size, magnetic susceptibility and rock magnetic analyses were conducted at the Centro Oceanográfico de Registros Estratigráficos (CORE) at the Instituto Oceanográfico da Universidade de São Paulo (IO USP) using a Microtrac Bluewave-SIA, an AGICO MFK1-FA Kappabridge, and a Vibrating Sample Magnetometer (VSM) MicroMag 3,900 Princeton-Lake Shore Cryotronics, respectively.
Samples were prepared by crushing ∼0.2 g of bulk sediment in an agate mortar. The crushed samples were further disaggregated using 10% hydrogen peroxide to remove organic matter. After 48 h of reaction, the samples were passed through 2 mm sieves and dried in an oven. After drying, sodium pyrophosphate was added to prevent the particles from flocculating. The Microtrac Bluewave equipment was used to measure the particles by laser diffraction in water, with their size being calculated according to the modified Mie theory for non-spherical particles (Chýlek et al., 1976). To establish the basic statistical parameters of particle size, as well as particle size distribution, the GRADISTAT v. 4.0 program, developed by Blott and Pye (2001), was used to establish the basic statistical parameters of particle size, as well as particle size distribution.
Rock magnetic analyses were conducted on 21 selected samples distributed along the studied interval to estimate downcore variations in the composition, concentration, and grain size of magnetic minerals. These analyses included volume normalized low-field magnetic susceptibility (κ), hysteresis loops, with maximum fields of 0.5 T, isothermal remanent magnetization (IRM) imparted in progressively (100 acquisition steps) to saturation (SIRM), or to the maximum attainable direct field of 1.8 T. IRM curves were subdivided into discrete coercivity components, as in Robertson and France (1994), with cumulative log-Gaussian (CLG) functions, using the spreadsheet developed by Kruiver et al. (2001) and Heslop et al. (2002).
In addition, we investigated the temperature dependence of magnetic susceptibility using a MFK1-FA equipped with CS4 furnace (AGICO) Kappabridge, to discriminate ferromagnetic mineralogy. Samples were measured up to a maximum temperature of 700°C in an argon atmosphere, in order to minimize thermochemical alteration.
In order to remove secondary NRM components, an Alternating Field (AF) demagnetization technique was employed, with stepwise demagnetization at peak AF fields of 2.5, 5, 10, 15, 20, 30, 40, 50, 60, 70, 80, 90 and 100 mT. Vector component diagrams (Zijderveld, 1967) were used to display stepwise demagnetization data. Characteristic remanent magnetization (ChRM) directions were determined using principal component analysis (PCA) with linear best fits calculated from three or more demagnetization steps using the PuffinPlot paleomagnetic analysis application (Lurcock and Wilson, 2012; Lurcock and Florindo, 2019).
The lithology of the studied interval is predominantly clay. The average grain size is 11.16 phi (0.435 μm), while the mode is 11.17 phi (0.432 μm), with a standard deviation of 0.33. The coarsest average grain size (9.87 phi; 1.065 μm) is found at 158.09 mbsf. The finest average grain size (12.41 phi; 0.181 μm) was observed at 162.11 mbsf. Several samples have multiple peaks in the grain size distribution (Figure 2).
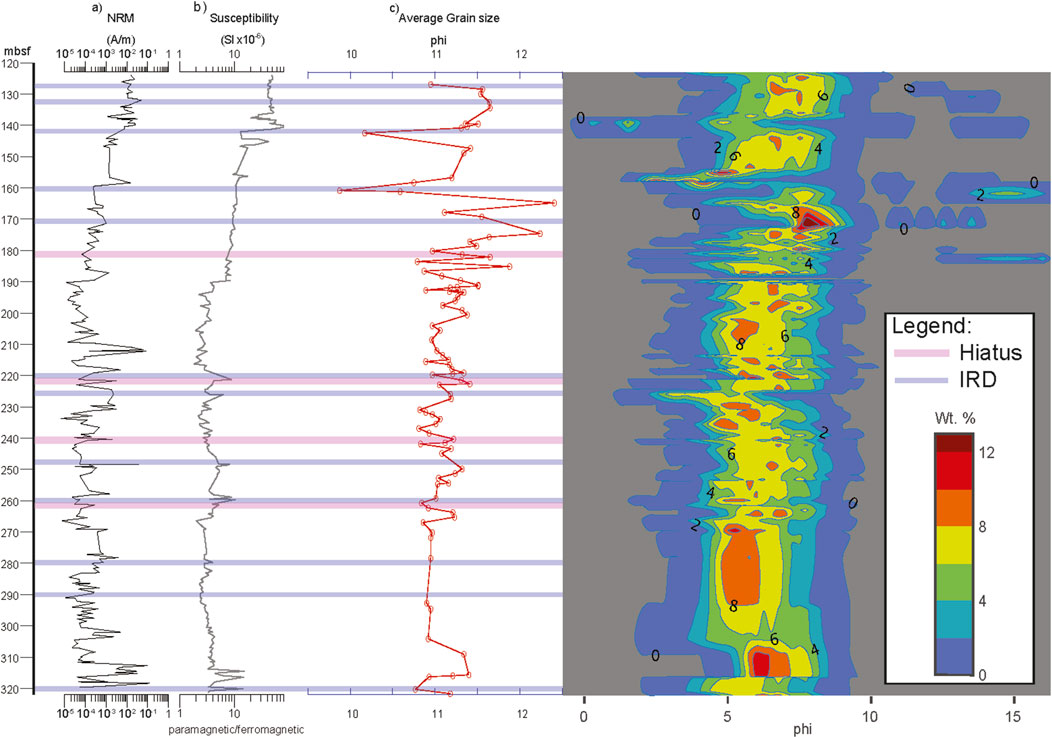
FIGURE 2. Downcore variations of (A) NRM intensity, (B) low-field magnetic susceptibility (κ), (C) average grain size and (D) sediment grain size distribution in a contour. Hiatuses and IRD horizons are highlighted as pink and light blue, respectively.
A drop-stone, 2 cm in diameter, was found at 319.74 mbsf, and additional ice rafted debris (IRD) particles greater than 5 mm in diameter were identified at 258.5 and 247.5 mbsf. Frakes (1975) also reported the presence of a coarse fraction in Cores 19 and 18 (180.5 and 161.5 mbsf, respectively) interpreted to reflect ice rafting events.
We observed a lower proportion of clay and a higher proportion of sand in the interval between 180 and 130 mbsf (Cores 19–14, respectively), where the variability of the average grain size is greater and ranges between 10 and 12 phi (0.98–0.24 μm). Between 180 and 160 mbsf (Cores 19–18, respectively) the average grain size is finer between 11 and 12 phi (0.48–0.24 μm) and coarsens between 160 and 130 mbsf (Cores 17–14) to values ranging between 9.7 and 11.7 phi (1.20–0.30 μm). The average grain size is finer in the lower interval of the core (between ∼300 and ∼180 mbsf; Cores 34–20) with values ranging between 11 and 11.5 phi (0.48–0.34 μm), with a slight coarsening in average grain size in the interval ∼320–∼304 mbsf (Cores 34–33). Abrupt changes in grain size at ∼262, ∼240 and ∼224 mbsf suggest the possibility of minor unconformities in the sedimentary succession.
Magnetic susceptibility (κ) values range widely between 1.8 × 10⁻⁶ and 92.9 × 10⁻⁶ SI with a mean value of 10.9 × 10⁻⁶ SI (Figure 2). Below the unconformity at ∼180 mbsf, the highest κ values occur in samples between 280 and 210 mbsf and are associated with IRD intervals with coarser sediments and larger clasts. Above 180 mbsf, κ gradually increases reaching peak values at 140 mbsf.
IRM acquisition curves obtained for the samples were separated into four coercivity components (Figure 3). Both samples (at 218.92 and 285.41 mbsf) show a component with very low coercivity (mean 8 mT) and dispersion parameter of 0.30, which corresponds to coarse detrital magnetite with different coercivity or activation of superparamagnetic (SP) particles dispersed in the material (Heslop et al., 2004; Abrajevitch and Kodama, 2011; Savian et al., 2014; Savian et al., 2016). The two middle-coercivity components show values consistent with single domain (SD) magnetite (mean coercivity of 23 mT, dispersion parameter 0.23 in samples 218.92 mbsf and 45 mT, dispersion parameter 0.19 in sample 285.41 mbsf, respectively). Those components are assumed to represent low-coercivity SD magnetite and high-coercivity SD magnetite, probably of biogenic origin (Egli, 2004; Jovane et al., 2012; Yamazaki , 2012; Heslop et al., 2004; Rodelli et al., 2019). The component characterized by mean coercivities of 100 and 280 mT (dispersion parameter = 0.15 and 20, respectively), are interpreted as hematite (Kruiver et al., 2001; Abrajevitch et al., 2009; Rodelli et al., 2019). The overall contribution to the IRM in sample 218.92 mbsf from the SD magnetite is 72, and 9% is linked instead to detrital magnetite. Hematite only represents 19% of the total contribution. IRM acquisition curves for a sample at 285.41 mbsf, typical of samples with lower κ, was fitted with only four components (Figure 3E): the low coercivity SD magnetite component is missing, and the hard SD magnetite is less abundant, corresponding to only 64% of the magnetic signal, and the detrital magnetite is more abundant (18%). Hematite is slightly less abundant (18%).
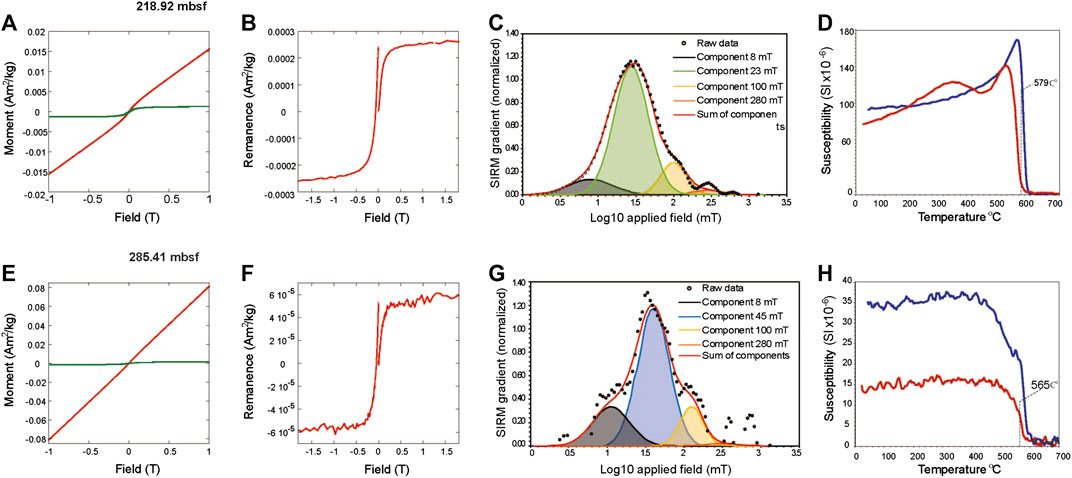
FIGURE 3. Rock magnetic properties of two selected samples at. (A), (E) hysteresis loops before (red) and after (green) subtracting the paramagnetic contribution, by applying an automatic linear slope correction. (B), (F) backfield and IRM saturaton acquisitions. (C), (G) IRM acquisition curves gradient with the separated components. Black component: low coercivity detrital magnetite, blue and green components: SD magnetite; orange components: hematite. (C), (F) thermomagnetic curves, the red curve represents the heating portion and the blue line the cooling portion of the cycle.
A κ-T curve for sample at 218.92 mbsf (Figure 3C) shows increasing values up to about 330°C, which can be interpreted as maghemite (Rodelli et al., 2018; Rodelli et al., 2019), possibly related to partial oxidation of magnetite. This is followed by a peak at about 520°C and a major inflection at 579°C, calculated with the two-tangent method of Grommé et al. (1969), and consistent with chemically pure magnetite (Thompson and Oldfield, 1986). A κ-T curve for sample at 285.41 mbsf (Figure 3F) has a sharp drop at 565°C consistent with magnetite probably mixed with titano-magnetite (Ozima and Larson, 1970). The cooling curve for sample at 285.41 mbsf has higher overall κ than the heating curve, which indicates production of new magnetic phases during heating while sample at 218.92 mbsf maintain similar values.
NRM intensities (Figure 2A) for the DSDP 274 succession range widely between 9.36 × 10⁻² and 6.58 × 10⁻⁵ A/m about a mean of 4.72 × 10⁻³ A/m. At the base of the sequence (320–310 mbsf), values are higher than for the rest of the sequence below the unconformity, then increase again above 180 mbsf. Glaciomarine sediments at the base are coarser and contain larger clasts that can increase intensities and lead to non-reliable paleomagnetic behavior (e.g., unstable remanence, low inclination or multi-component magnetizations). For these reasons, samples at the base were excluded from magnetostratigraphic interpretations.
Some samples exhibit a low coercivity horizontal component of remanence (Figure 4) interpreted to be a drilling induced radial overprint related to strong magnetic fields in the cutting-shoe and/or core barrel (e.g., Acton et al., 2002; Florindo et al., 2003). In most cases, this is removed by AF demagnetization in a peak field of 20 mT, but in some cases the horizontal overprint is harder and persists to higher coercivities (>80 mT; Figure 4D) and prevents the isolation of a ChRM. In a few samples, characterized by the lowest NRM intensities, this overprint could not be removed by AF demagnetization. We cannot rule out that drying may have further hardened the radial overprint.
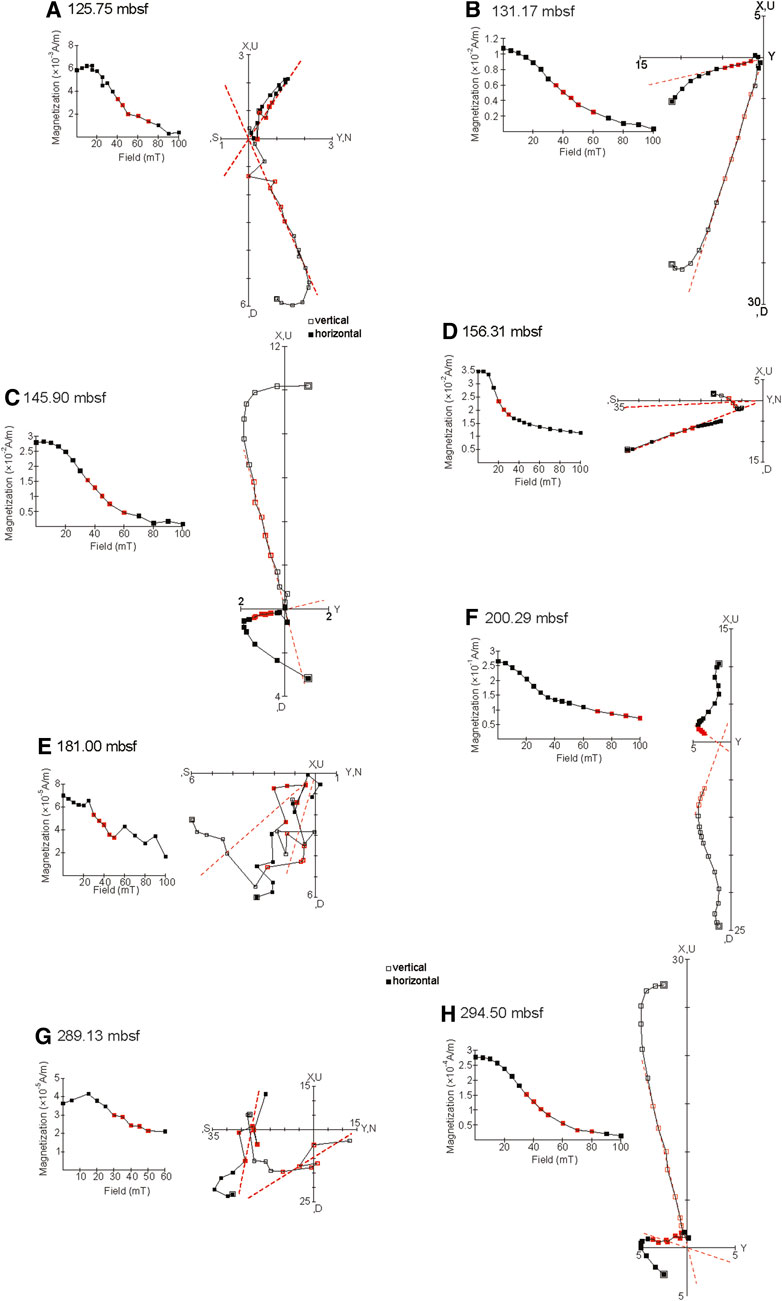
FIGURE 4. AF (alternating field) demagnetization behavior for eight representative samples. For the vector component diagrams, open (closed) symbols represent projections onto the vertical (horizontal) plane. The red dashed lines represent PCA fits that indicate the ChRM direction for each sample. A), F), B) examples of reverse polarity. C), H), E), G) examples of normal polarity; Samples A), E) G) are noisy but it is possible to identify a ChRM. Sample D) has a radial overprint that resists AF demagnetization. The cores were not azimuthally oriented and declinations are, therefore, arbitrary. See text for discussion.
The ChRM is identified in most samples, regardless of polarity, between AFs of 20 and 70 mT (Figure 4). Approximately half of the ChRMs are directed to the origin of vector component plots (Figures 4A,C) and half follow a trajectory toward a high coercivity component not removed by peak AFs of 100 mT (Figures 4F,G). The high coercivity component of samples containing a small amount of hematite is assumed to be a secondary chemical remanent magnetism and unanchored ChRM components are reported.
Of the total of 287 samples, 65.51% (188) were used to determine the magnetic polarity zonation, with discrete magnetozones defined as an interval where at least two consecutive samples show polarities different from adjacent intervals. The other 99 samples were discarded according to the following criteria. Samples were discarded from the final analysis if they met the following conditions: 1) samples with a radial overprint (Figure 4D); 2) single samples showing a ChRM with an inclination of opposite polarity to that of the previous and following samples; 3) samples with anomalous low inclination (shallower than ±25°) were also not considered (Figure 4G); 4) samples containing IRD which do not demagnetize due to the presence of high-coercivity minerals and 5) samples with overprints (drilling overprint (Fuller et al., 1998) or core-splitting overprint (Wilson et al., 2000; Florindo et al., 2001) that could not be removed by low field AF demagnetization.
Mean ChRM inclinations were computed separately for normal and reverse polarity populations using a maximum likelihood method (Arason and Levi, 2010) as implemented in the PuffinPlot application (Lurcock and Florindo, 2019). The normal polarity intervals have a mean inclination of −55.01° (N = 56, α95 = 6.67°, θ63 = 27.03°), the reverse polarity intervals have a mean of 68.3° (N = 132, α95 = 4.45°, θ63 = 27.8°) (Figure 5). Some samples have lower inclination than the expected Geocentric Axial Dipole (GAD) inclination (±64.5° at 20 Ma and ±63.9° at 40 Ma; Torsvik et al., 2012) for this period and for this site latitude. A post depositional tilt of ∼5° the strata is implied by the difference in normal and reversed polarity inclinations.

FIGURE 5. Histograms of paleomagnetic inclinations from discrete samples for DSDP Site 274 after AF demagnetization. Mean ChRM inclinations (shown in blue), and associated α95, were computed separately for normal and reverse polarity populations using a maximum likelihood method (Arason and Levi, 2010). The expected inclinations for the GAD are shown in red for this period and for the site latitude (Torsvik et al., 2012).
We recognize eight normal and eight reversed magnetozones (Figure 6). The base of magnetozone N1 is not identified due to an interval of undefined polarity at the base of the core with most samples characterized by radial overprints. The upper part of magnetozone N1 is well defined by four normal polarity samples. Samples 313.21 (normal polarity) and 311.4 (reversed polarity) mbsf define the boundary of magnetozone N1 with R1. Between 312.3 and 302.38 mbsf magnetozone R1 is clearly identified, although it includes several samples with noisy data and others that do not demagnetize. Magnetozone N2 is well defined by three normal polarity samples between 302.82 (top of magnetozone R1) and 297.72 mbsf, which is the base of magnetozone R2. Between 298.4 and 280.09 mbsf, magnetozone R2 includes a long series of samples with reversed polarity with only occasional samples that do not demagnetize. The boundary between magnetozones N3 and R3 lies within an 8-m-interval where polarity could not be determined due to samples in which the radial overprints do not demagnetize. The interval between ca. 270 and 241.08 mbsf includes two intervals of well-defined reversed polarity: magnetozones R3 and R4, with a long interval magnetozone N4 where polarity is unclear with several samples not demagnetizing and others with persistent overprints. Magnetozone N5 is defined at its base between 241.08 and 240.49 mbsf and at its top between samples 236.37 and 235 mbsf. Magnetozones R5, N5 and N4 contain several samples that do not fully demagnetize. The boundary between magnetozones R5 and N6 is not well defined due to an interval including some samples that do not demagnetize and are noisy and have radial overprints. Magnetozone N6 is represented by four samples but also contains some samples that do not demagnetize. The boundary between magnetozones N6 and R6 is at 219.83 mbsf; at the midpoint between samples of opposite polarity at 220.74 and 218.92 mbsf. Magnetozone N7 includes only two samples and is separated from magnetozone R6 by an interval of questionable polarity conditions containing several noisy samples that do not demagnetize and have radial overprints. The interval of the core above 210 mbsf includes a well-defined N-R-N-R pattern of polarity, with the boundary between magnetozones N7 and R7 at 206.70 mbsf between samples 206.94 and 206.47 mbsf. Magnetozone R7 includes several noisy samples that do not demagnetize and have radial overprints. The boundary between magnetozones R7 and N8 is at 175.87 mbsf midway between a reversed sample at 177.53 mbsf and a normal sample at 174.22 mbsf. The boundary between magnetozone N8 and R8 is identified at 160.65 mbsf between samples at 162.11 and 159.20 mbsf.
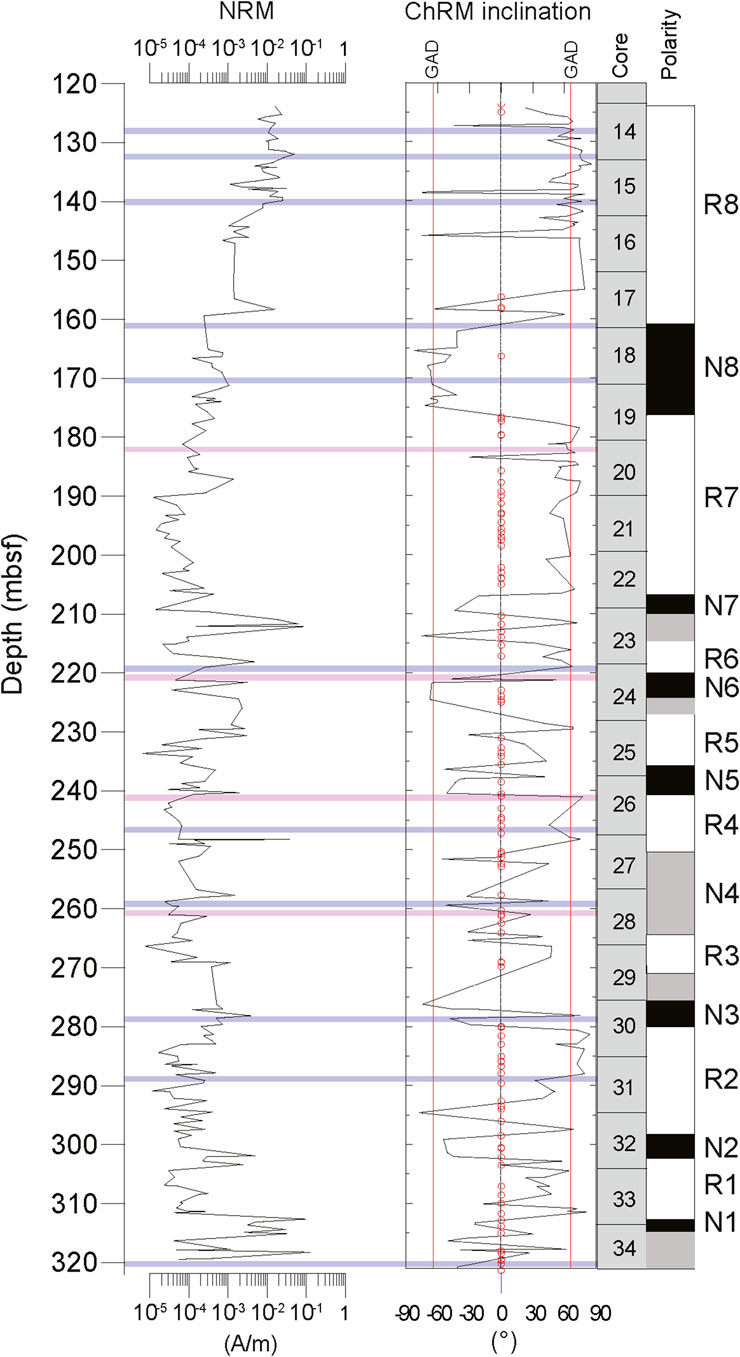
FIGURE 6. Downcore variations of NRM intensity, ChRM inclination, and magnetic polarity zonation (black denotes normal polarity and white denotes reversed polarity).
Although most of the magnetozone boundaries were identified, some of the boundaries, particularly in the lower interval of the core, could not be located precisely because of intervals with uncertain polarity due to strong radial overprints, samples that do not demagnetize and others which were truncated by sedimentary unconformities identified by abrupt grain size changes. The boundaries between magnetozones N6 and R6, R4 and N5, and within N4 occur within sedimentary unconformities.
No further biostratigraphic information has been reported for the 316–123 mbsf interval (Cores 34–14) since the original biostratigraphic first and last occurrence information provided by the Shipboard Report (Table 1; Hayes et al., 1975). Here, we update those occurrences accounting for more recent age and occurrence data from other Southern Ocean drill holes in order to correlate our magnetic polarity stratigraphy with the Geomagnetic Polarity Time Scale (GPTS) (Figure 7).
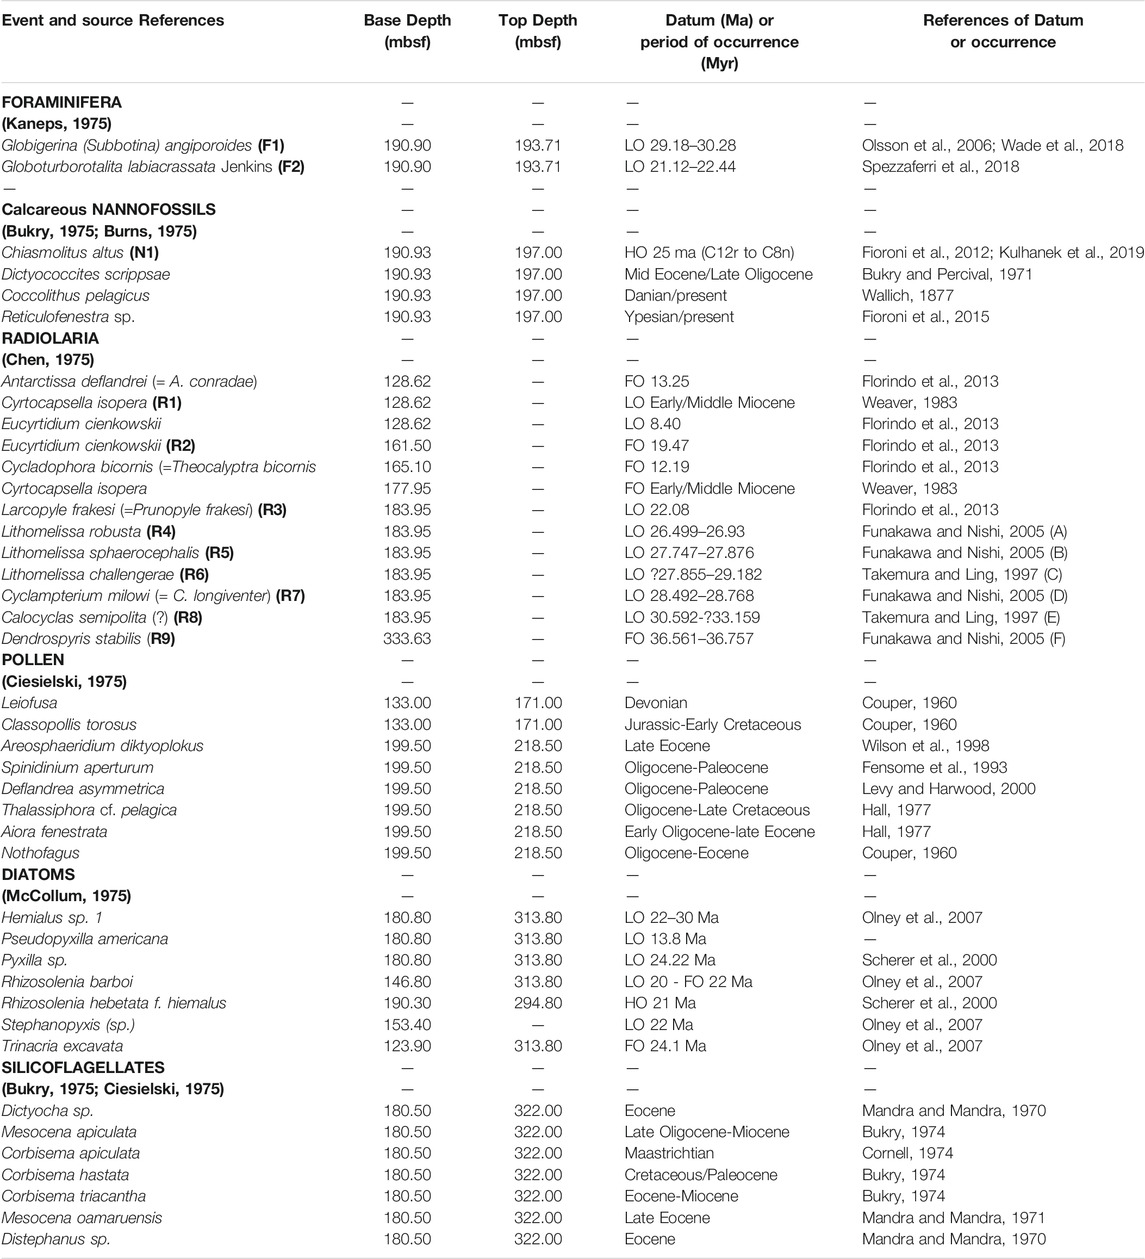
TABLE 1. Biostratigraphic data from previous studies in the DSDP Initial Reports -Hayes et al. (1975), Radiolaria (Chen, 1975), Diatoms (McCollum, 1975), Silicoflagellates (Ciesielski, 1975), Planktonic Foraminifera (Kaneps, 1975), Calcareous nannoplankton (Bukry, 1975; Burns, 1975) - used to correlate of the DSDP Site 274 magnetic polarity zonation with the Geomagnetic Polarity Time Scale. Ages for radiolarian datum levels were assigned, where available, by the composite ordering of events and hybrid age model output from constrained optimization (CONOP) analyses of Southern Hemisphere data sets and Ocean Drilling Program (ODP) Site 744 (Florindo et al., 2013). Ages for all other events are as reported in the biozonation by Takemura and Ling (1997), or from other reports, such as Weaver (1983). The age calibrations of the events reported in Funakawa and Nishi (2005) and Takemura and Ling (1997) were converted to the Gradstein et al. (2012) timescale from the original Berggren et al. (1995) age calibration, using the converter at: http://www.odsn.de/cgi-bin/conv_ts.pl; (A) 27.1–27.5, (B) 28.2–28.3, (C) ?28.28–29.40, (D) 28.9–29.1, (E) 30.48-?33.06, (F) 36.2–36.4.
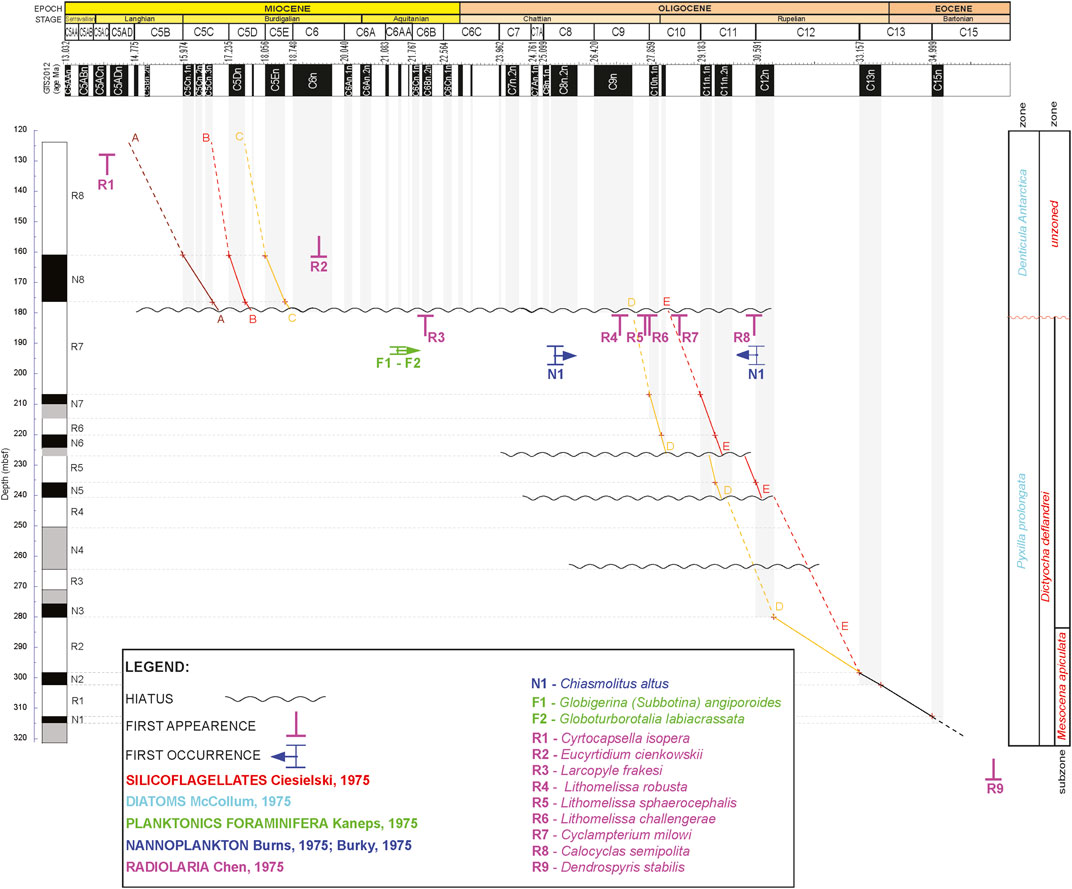
FIGURE 7. Age vs. depth plot with correlation of DSDP Site 274 polarity zonation to the GPTS of Gradstein et al. (2012). Hiatuses defined from the sedimentological data and biostratigraphical datum are represented following the legend. Magnetostratigraphic model A is in dark red; models B and E are in red; models C and D are in orange.
Planktonic foraminifera occur exclusively within Core 21 (190–199.5 mbsf) Introduction (92–88 cm) and Material and Methods (73–69 cm), including Globigerina (Subbotina) angiporoides (LO 29.18–30.28 Ma, FO 40.40–41.89 Ma; Olsson et al., 2006; Wade et al., 2018) and Globoturborotalita labiacrassata Jenkins (LO 21.12–22.44 Ma, FO 30.28–32.10 Ma; Spezzaferri et al., 2018). There is some indication that the assemblage may be reworked, but a penecontemporaneous redeposition was suggested by Kaneps (1975, Table 1).
Calcareous nannofossils are present only in isolated horizons and burrows in the interval covered by Cores 28–21 (266–190 mbsf), but only in Core 21 (199.5–190 mbsf), Introduction, 93 cm and Material and Methods, 70 cm, was the assemblage sufficient for an age determination (Chiasmolithus altus assemblage) (Burns, 1975; Bukry, 1975, Table 1). Fioroni et al. (2012), in a Southern Ocean calibration, attributed the Chiasmolithus altus biozone to the time interval from chrons C12r to C8n, which was later confirmed by Kulhanek et al. (2019). Dictyococcites scrippsae (middle Eocene to Upper Oligocene; Bukry and Percival, 1971), Coccolithus pelagicus (Danian to present; Wallich, 1877) and Reticulofenestra species (Ypresian to present, Fioroni et al., 2015) were also found in the same samples.
Diatoms are generally abundant with preservation ranging from fair/poor (Cores 19–1) to excellent (Cores 34–20). Down through Core 19 (180.5–171 mbsf), diatoms are of Miocene age (Denticula antarctica Zone) and below this, through Core 34 (323–313.5 mbsf), of Oligocene age (Pyxilla prolongata; See Figures 8A,B of McCollum, 1975, Table 1).
Ciesielski (1975) identified silicoflagellates in the interval between Cores 19–13, from 179 to 114 mbsf, with this interval containing an assemblage of low diversity and abundance, poor preservation, and broken specimens. Distephanus speculum and D. boliviensis are identified throughout this interval providing poor age-diagnostic forms (Guiry and Guiry, 2011). However, the interval comprising Cores 34 to 20 (321.5–181 mbsf) displays a uniform assemblage of silicoflagellates with excellent preservation and high abundance. Mesocena apiculata, Dictyocha deflandrei s.l, Distephanus cf. D. boliviensis, Distephanus crux, Corbisema apiculata, and Naviculopsis trispinosa (See Tables 6C, D of Ciesielski, 1975) define this interval as belonging to the Dictyocha deflandrei Zone, which is subdivided into two subzones: 1) Dictyocha deflandrei Subzone (Cores 30–20) characterized by the presence of Dictyocha frenguellii and 2) Mesocena apiculata subzone (Cores 34–30) (Guiry and Guiry, 2011, Table 1).
Chen (1975) originally reported radiolarian occurrences at Site 274. Many of the species he found or described are however junior synonyms (see Table 1 for their correct names, along with a reinterpretation of his reported occurrences of bioevents at Site 274). A very typical modern to Pliocene sequence of radiolarian events is observed in cores 11–1, followed by several late to middle Miocene LADs occurring in Core 12 (Antarctissa deflandrei, 5.87 Ma, Cycladophora spongothorax, 8.62 Ma, Actinomma golownini, 10.87 Ma, Cycladophora golli, 14.92 Ma). In the interval between Cores 19–15 (180.5–133 mbsf), radiolarian associations are dominated by Cyrtocapsella isopera indicating a middle to early Miocene age (see Table 9A, Chen 1975; Weaver, 1983). Associations are completely different in the interval between cores 34 and 20, where abundant radiolarians are present, such as Amphisphaera sp., Calocyclas sp., Cenosphaera sp., Eucyrtidium sp. This interval is assigned an age of Chattian or older, based on Lithomelissa challengerae, Lithomelissa robusta, Lithomelissa sphaerocephalis, Lithomelissa tricornis, Prunopyle frakesi and Prunopyle hayesi (see Table 9B, Chen, 1975; Table 1).
On the basis of radiolarian assemblages and their comparison with foraminiferal and calcareous nannofossil assemblages, Chen (1975) hypothesized a hiatus between cores 20 (190.0–180.5 mbsf) and 19 (180.5–171.0 mbsf). This interpretation seems to be supported by his data, with the Miocene and younger portion of the sequence being well constrained based on radiolarian marker species which are well calibrated, and an older section starting with Core 20 (sample 20R-3, 40–50 cm) which is substantially different, older and much more uniform in its radiolarian assemblage (Table 1). The LADs recorded in Core 20 include Larcopyle frakesi (22.08 Ma), Lithomelissa sphaerocephalis (23.35–24.73 Ma), Lithomelissa challengerae (?28.28–29.40 Ma), and Calocyclas (?) semipolita (30.48-?33.06 Ma) which, while clearly identifying this core as substantially older than Core 19, make it difficult to assign it a well-constrained age.
Correlation of the paleomagnetic polarity zonation with the GPTS (Gradstein et al., 2012) provides an age interpretation between the upper Eocene and the Middle Miocene (from Chron C15n to C5Br) (Figure 7).
Biostratigraphic data identify a major unconformity at ∼180 mbsf (Hayes et al., 1975) separating Early/Late Oligocene strata below from Early/Middle Miocene strata above. More recent constraints on age data (Table 1) restrict the interval of core beneath the unconformity to the late Eocene–Early Oligocene and above the unconformity to the late Early–Middle Miocene (Figure 7).
Beneath the unconformity, magnetozones N1 to R7 are correlated to chrons C15–C9 as follows (Figure 7): Between 315 and 281 mbsf the normal magnetozones N1 and N2 are correlated with chrons C15n and C13n, respectively, and reversed magnetozones R2 and R2 with chrons C13r and C12r, respectively. This correlation implies a sedimentation rate of ∼1 cm/kyr for the late Eocene/Early Oligocene interval of the core with the Eocene/Oligocene boundary at ∼304 mbsf between Core 33 and Core 32. Two correlations are considered between 280 and 180 mbsf (magnetozones N3–R7; Figure 7). The younger correlates magnetozones N3. N5, R5, N6, R6, N7 and R7 with chrons C12n, C11n.2n, C11n.1r, C10n.2n, C10n.1r, C10n.1n and C9r (model D), respectively and implies that the last appearances of radiolarians Cyclampterium milowi and Calocyclas semipolita are almost one million year younger than their currently identified last occurrences. The older correlation links magnetozones N5, R5, N6, R6, N7 and R7 with chrons C12n, C11r, C11n.2n, C11n.1r, C11n.1n and C10r (model E) and has a smaller lag and consequently more consistent with the radiolarian late occurrence data but leaves magnetozone N3 with no corresponding chron in the GPTS. While we expect to see magnetozones truncated and potentially missing from the DSDP Site 274 record, magnetozone N3 is represented by several samples and multiple normal polarity chrons, and we would not expect to see an additional magnetic polarity interval not identified in the GPTS. Regardless, we observe that the sediment accumulation rate in the mid Oligocene interval of the core (280–180 mbsf) is more than four times that of the lower Eocene-Oligocene boundary interval, with 25% of the time interval accounted for by distributed unconformities as identified by marked grain size changes (Figures 2, 7).
Above the unconformity at 180 mbsf, the interval between 180 and 123 mbsf (cores 19–14), has few biostratigraphical constraints (Hayes et al., 1975, Table 1), and we identify three possible magnetostratigraphic age model reconstructions: where R8 N8 and upper part of R7 correspond to (A) chrons C5Br, C5Cn and C5Cr (B) chrons C5Cr, C5Dn and C5Dr. and (C) chrons C5Dr., C5En and C5Er, respectively (Figure 7). However, sediment accumulation rates are quite high for all reconstructions (between 2 and 5 cm/kyr), similar to the sediment accumulation rates observed beneath the unconformity.
Our new age model implies that the unconformity at 180 mbsf accounts for between 9 Myr at its shortest and 11 Myr at its longest, which is significantly shorter than the >15 Myr identified from biostratigraphy only in the original age depth model of Hayes et al. (1975).
According to our correlation and calculation of the sedimentary accumulation rate, the studied section encompasses ∼20 Myr. For the interval 180–123 mbsf (cores 19–14), we produced the following estimates of mean sedimentation rates for the two most likely age reconstructions: (model A) 2.0 cm/kyr (C5B-C5C), (model B) 5.1 cm/kyr (C5C-C5D) and (model C) 3.3 cm/kyr (C5D-C5E). The interval between 320 and 180 mbsf (cores 34–20) has a mean sediment accumulation rate of 1.5 cm/kyr (model D) and 1.4 cm/kyr (model E) with a mean of 0.8 cm/kyr between chrons C12n and C15n. The highest sedimentation rate is observed during C5Cn (following model B) with 5.1 cm/kyr and lowest sediment accumulation rate is observed during Chron C12n 0.7 cm/kyr.
We present a new magnetostratigraphic chronology for an upper Eocene to Middle Miocene sedimentary section cored during DSDP Leg 28 (Site 274) on the continental rise off Victoria Land, Ross Sea. We confirm a significant hiatus between chrons C9r and C5Cr/C5Dr/C5Er, i.e., from the earliest Chattian to the mid Burdigalian (Figure 7), and its duration is significantly shorter than previous estimates.
Our new age model also identifies a four-fold increase in sedimentation rate on the Antarctic margin after the Eocene/Oligocene boundary (Figure 7). Previous drilling in McMurdo Sound (southern Victoria Land) also identified a significant early Oligocene unconformity (Wilson et al., 1998) and a significant increase in sediment accumulation rates across the Eocene/Oligocene boundary (Wilson et al., 1998; Wilson et al., 2000; Hannah et al., 2001). The increase in sedimentation rate has been linked to the onset of Antarctic ice sheet growth across the Eocene/Oligocene boundary (Salamy and Zachos, 1999; Galeotti et al., 2016). We confirm those findings across the wider Antarctic shelf and slope. The unconformity at 180 mbsf, is coincident with other significant Late Oligocene unconformities reported from the Ross Embayment (Florindo et al., 2005) but extends into the mid Miocene. We relate the long unconformity to be linked to the early evolution of the Antarctic Circumpolar Current which was established in the Late Oligocene and intensified into the Miocene after the growth of Antarctic ice sheets at the Eocene-Oligocene Boundary (Barker et al., 2007; Lyle et al., 2007; Jovane and Verosub, 2011). Sedimentation did not begin again at DSDP Site 274 until the Antarctic Polar Front migrated northward coincident with Mid Miocene Glacial intensification (Nelson and Cook, 2001).
The unconformity at ca. 180 mbsf could also be partially related to the formation of the Adare Basin, which accommodates the sediments from the West Antarctica Rift System and forms a barrier for the arrival of sediments to the site (Granot et al., 2010, 2013).
Regardless of the exact explanation of the unconformity, these insights are invaluable because they demonstrate that the Early Miocene is characterized by long-term fluctuations of the Antarctic Ice Sheets (Levy et al., 2016; Levy et al., 2019; Jovane et al., 2019; Evangelinos et al., 2020) and that, prior to the Middle Miocene Climatic Optimum (∼15 Ma), there was a period of climatic instability modulated by long-term variations with phases of bottom current intensification which either eroded or did not allow the deposition of sediments in the deep parts of the basin.
We provided new paleomagnetic results from the late Eocene-Middle Miocene samples from DSDP Site 274, cored during Leg 28 on the continental rise off Victoria Land, Ross Sea.
- Based on our new age model, the cored late Eocene-Middle Miocene sequence covers an interval of almost 20 Myr, from ∼35 to ∼15 Ma.
- We confirm and better define a major unconformity identified at ∼180 mbsf which represents at least 9 Myr from the earliest Chattian to the mid Burdigalian. It may represent non-deposition and/or erosion due to intensification of Antarctic Circumpolar Current activity.
- Significant fluctuations in grain size and magnetic properties are observed above the unconformity (above 180 mbsf) interpreted as cyclical behavior in glacial advance and retreat from the continent.
This new age model will allow further studies of this unique core to reconstruct paleoenvironmental studies focusing on the discharge of sediments from the catchment areas in this region of the Ross Sea.
The raw data supporting the conclusions of this article will be made available by the authors, without undue reservation.
LJ: paleomagnetic measurements, data analysis, discussion and writing; FF: discussion and writing; DR: paleomagnetic measurements, data analysis, and writing; SL: grain size measurements, data analysis, and writing; MH: paleomagnetic measurements, data analysis, and writing; GC: radiolaria and writing; GW: data analysis, discussion and writing.
The authors declare that the research was conducted in the absence of any commercial or financial relationships that could be construed as a potential conflict of interest.
We thank the editor Hagay Amit and the reviewers for useful comments and corrections which greatly improved the manuscript. The Deep Sea Drilling Project samples and data were provided by the International Ocean Discovery Program (sample requests: 043328-IODP and 069232-IODP). The samples were collected at the UC Davis Paleomagnetism Laboratory as part of NSF grant OPP 06-17194 to K. L. Verosub. LJ, MBH and DR acknowledge funding from Fundação de Amparo á Pesquisa do Estado de São Paulo (FAPESP) grant 2016/24946-9 and 2018/17061-6. LJ is also financed by the Coordenação de Aperfeiçoamento de Pessoal de Nível Superior - Brasil (CAPES)—Finance Code 001. The data are available from the authors upon request.
Abrajevitch, A., and Kodama, K. (2011). Diagenetic sensitivity of paleoenvironmental proxies: a rock magnetic study of Australian continental margin sediments. Geochem. Geophys. Geosyst. 12, Q05Z24. doi:10.1029/2010GC003481
Abrajevitch, A., Van der Voo, R., and Rea, D. K. (2009). Variations in relative abundances of goethite and hematite in Bengal Fan sediments: climatic vs. diagenetic signals. Mar. Geol. 267, 191–206. 10.1016/j.margeo.2009.10.010
Acton, G. D., Okada, M., Clement, B. M., Lund, S. P., and Williams, T. (2002). Paleomagnetic overprints in ocean sediment cores and their relationship to shear deformation caused by piston coring. J. Geophys. Res. 107 (B4), 2067. doi:10.1029/2001JB000518
Ainley, D. G., and Jacobs, S. S. (1981). Sea-bird affinities for ocean and ice boundaries in the Antarctic. Deep Sea Res. Part A Oceanogr. Res. Pap. 28 (10), 1173–1185. doi:10.1016/0198-0149(81)90054-6
Arason, P., and Levi, S. (2010). Maximum likelihood soultion for inclination-only data in paleomagnetism. Geophys. J. Int. 182, 753–771. doi:10.1111/j.1365-246X.2010.04671.x
Barker, P. F., Filippelli, G. M., Florindo, F., Martin, E. E., and Scher, H. D. (2007). Onset and role of the antarctic circumpolar current. Deep Sea Res. Part II Top. Stud. Oceanogr. 54 (21–22), 2388–2398. doi:10.1016/j.dsr2.2007.07.028
Beddow, H. M., Liebrand, D., Sluijs, A., Wade, B. S., and Lourens, L. J. (2016). Global change across the oligocene-miocene transition: high-resolution stable isotope records from IODP site U1334 (equatorial pacific ocean): the OMT at site U1334. Paleoceanography 31, 81–97. doi:10.1002/2015PA002820
Berggren, W. A., Kent, D. V., Swisher, C. C., and Aubry, M.-P. (1995). “A revised Cenozoic geochronology and chronostratigraphy,” in Geochronology, time scales and global stratigraphic correlation. Editors W.A. Berggren, D.V. Kent, M.P. Aubry, and J. Hardenbol (Society for Sedimentary Geology).
Blott, S. J., and Pye, K. (2001). GRADISTAT: a grain size distribution and statistics package for the analysis of unconsolidated sediments. Earth Surf. Process. Landforms 26, 1237–1248. doi:10.1002/esp.261
Bukry, D. (1975). “Coccolith and silicoflagellate stratigraphy near Antarctica, Deep Sea drilling Project, Leg 28,” in Initial reports of the deep sea drilling project. Editor A. G. Kaneps (Washington, DC: U.S. Government Printing Office), Vol. 28.
Bukry, D., and Percival, S. F. (1971). New Tertiary calcareous nannofossils. Tulane Studies in Geology and Paleontology 8 (3).
Bukry, D. (1974). Stratigraphic value of silicoflagellates in nontropical regions. Geol. Soc. Am. Bull. 85 (12), 1905–1906. doi:10.1130/0016-7606(1974)85<1905:SVOSIN>2.0.CO;2
Burns, D. A. (1975). “Nannofossil biostratigraphy for antarctic sediments, Leg 28, Deep Sea drilling Project,” in Initial reports of the Deep Sea drilling Project. Editor A. G. Kaneps (Washington, DC: U.S. Government Printing Office), Vol. 28.
Chen, P. H. (1975). Antarctic radiolaria. Initial Reports of the Deep Sea drilling Project. Washington, DC: U.S. Government Printing Office). Vol. 28.
Chýlek, P., Grams, G. W., and Pinnick, R. G. (1976). Light Scattering by Irregular Randomly Oriented Particles. Science 193 (4252), 480--482. doi:10.1126/science.193.4252.480
Ciesielski, P. F. (1975). “Biostratigraphy and paleoecology of neogene and Oligocene silicoflagellates from cores recovered during antarctic Leg 28, Deep Sea drilling Project,” in Initial reports of the Deep Sea drilling Project. Editor A. G. Kaneps (Washington, DC:U.S. Government Printing Office), Vol. 28.
Cornell, W. C. (1974). Maastrichtian silicoflagellates of the great valley, California. Geosci. Man 9 (1), 37–43. doi:10.1080/00721395.1974.9989747
Couper, R. A. (1960). Southern Hemisphere mesozoic and tertiary podocarpaceae and fagaceae and their palaeogeographic significance. Proc. Roy. Soc. Lond. B Biol. Sci. 152 (949), 491–500. doi:10.1098/rspb.1960.0056
Egli, R. (2004). Characterization of individual rock magnetic components by analysis of remanence curves: 3. Bacterial magnetite and natural processes in lakes. Phys. Chem. Earth 29, 867–884. 10.1016/j.pce.2004.03.010
Evangelinos, D., Escutia, C., Etourneau, J., Hoem, F., Bijl, P., Boterblom, W., et al. (2020). Late oligocene-miocene proto-antarctic circumpolar current dynamics off the wilkes Land margin, East Antarctica. Global Planet. Change 191, 103221. doi:10.1016/j.gloplacha.2020.103221
Farnsworth, A., Lunt, D. J., O’Brien, C. L., Foster, G. L., Inglis, G. N., Markwick, P., et al. (2019). Climate sensitivity on geological timescales controlled by nonlinear feedbacks and Ocean circulation. Geophys. Res. Lett. 46, 9880–9889. doi:10.1029/2019GL083574
Fensome, R. A., Gocht, H., Stover, L. E., and Williams, G. L. (1993). The Eisenack catalog of fossil Dinoflagellates. Stuttgar: Schweizerbart Science Publishers, Vol. 2.
Fioroni, C., Villa, G., Persico, D., and Jovane, L. (2015). Middle Eocene-Lower Oligocene calcareous nannofossil biostratigraphy and paleoceanographic implications from Site 711 (equatorial Indian Ocean). Mar. Micropaleontol. 118, 50–62. doi:10.1016/j.marmicro.2015.06.001
Fioroni, C., Villa, G., Persico, D., Wise, S. W., and Pea, L. (2012). Revised middle eocene-upper Oligocene calcareous nannofossil biozonation for the Southern Ocean. Rev. Micropaleontol. 55, 53–70. doi:10.1016/j.revmic.2012.03.001
Florindo, F., Bohaty, S. M., Erwin, P. S., Richter, C., Roberts, A. P., Whalen, P. A., et al. (2003). Magnetobiostratigraphic chronology and palaeoenvironmental history of cenozoic sequences from ODP sites 1165 and 1166, prydz bay, Antarctica. Palaeogeogr. Palaeoclimatol. Palaeoecol. 198, 69–100. doi:10.1016/S0031-0182(03)00395-X
Florindo, F., Farmer, R. K., Harwood, D. M., Cody, R. D., Levy, R. H., Bohaty, S. M., et al. (2013). Paleomagnetism of sediments from ODP Site 744, southern Kerguelen Plateau: implications for early to-middle Miocene climate in Antarctica. Global Planet. Change 110 (C), 434–454. doi:10.1016/j.gloplacha.2013.05.004
Florindo, F., Wilson, G. S., Roberts, A. P., Sagnotti, L., and Verosub, K. L. (2005). Magnetostratigraphic chronology of a late Eocene to early Miocene glacimarine succession from the Victoria Land basin, Ross Sea, Antarctica. Global Planet. Change 45, 207–236. doi:10.1016/j.gloplacha.2004.09.009
Florindo, F., Wilson, G. S., Roberts, A. P., Sagnotti, L., and Verosub, K. L. (2001). Magnetostratigraphy of late eocene-early Oligocene strata from the CRP-3 core, Victoria Land basin, Antarctica. Terra Antartica 8 (4), 599–614.
Frakes, L. A. (1975). “Paleoclimatic significance of some sedimentary components at site 27,” in Initial reports of the Deep Sea drilling Project. Editor A. G. Kaneps (Washington, D. C:U.S. Government Printing Office), Vol. 28.
Francis, J. E., Marenssi, S., Levy, R., Hambrey, M., Thorn, V. C., Mohr, B., et al. (2009). “From greenhouse to icehouse—the eocene/oligocene in Antarctica,” in Developments in Earth and environmental Sciences. Amsterdam, Netherlands: Elsevier, 309–368.
Fuller, M., Hastedt, M., and Herr, B. (1998). Coring-induced magnetization of recovered sediments. Proc. Ocean Drill. Progr. Sci. Results 157, 47–56.
Funakawa, S., and Nishi, H. (2005). Late middle Eocene to late Oligocene radiolarian biostratigraphy in the Southern Ocean (maud rise, ODP Leg 113, site 689). Mar. Micropaleontol. 54, 213–247. doi:10.1016/j.marmicro.2004.12.002
Galeotti, S., DeConto, R., Naish, T., Stocchi, P., Florindo, F., Pagani, M., et al. (2016). Antarctic ice sheet variability across the Eocene-Oligocene boundary climate transition. Science 352, 76–80. doi:10.1126/science.aab0669
Gradstein, F. M., Ogg, J. G., Schmitz, M. D., and Ogg, G. M. (2012). The geological time scale 2012. Amsterdam, Netherlands: Elsevier, 1142.
Granot, R., Cande, S. C., Stock, J. M., and Damaske, D. (2013). Revised eocene-oligocene kinematics for the west antarctic rift system. Geophys. Res. Lett. 40, 279–284. doi:10.1029/2012GL054181
Granot, R., Cande, S. C., Stock, J. M., Davey, F. J., and Clayton, R. W. (2010). Postspreading rifting in the Adare Basin, Antarctica: regional tectonic consequences. Geochem. Geophys. Geosyst. 11, Q08005. doi:10.1029/2010GC003105
Grommé, C. S., Wright, T., and Peck, D. (1969). Magnetic properties and oxidation of irontitanium oxide minerals in Alae Makaupuki lava lakes, Hawaii. J. Geophys. Res. 74, 5277–5293. doi:10.1029/JB074i022p05277
Guiry, M. D., and Guiry, G. M. (2011). AlgaeBase. World-wide electronic publication. Galway: National University of Ireland. Avialable at: https://www.algaebase.org (Accessed April 04, 2020).
Hall, S. A. (1977). Cretaceous and tertiary dinoflagellates from seymour Island, Antarctica. Nature 267 (5608), 239–241. doi:10.1038/267239a0
Hannah, M. J., Wrenn, J. H., and Wilson, G. J. (2001). Preliminary report on early Oligocene and latest Eocene marine palynomorphs from CRP-3 drillhole, Victoria Land basin, Antarctica. Terra Antartica 8, 383–388.
Hayes, D. E., Frakes, L. A., Barrett, P. J., Burns, D. A., Chen, P.-H., Ford, A. B., et al. (1975). “Shipboard site report - site 274,” in Initial reports of the Deep Sea drilling Project. Editor A. G. Kaneps (Washington, DC:U.S. Government Printing Office), Vol. 28.
Hayes, D. E., and Frakes, L. A. (1975). “General synthesis, Deep Sea drilling Project Leg 28,” in Initial reports of the Deep Sea drilling Project. Editor A. G. Kaneps (Washington, DC:U.S. Government Printing Office), Vol. 28.
Heslop, D., Dekkers, M. J., Kruiver, P. P., and van Oorschot, I. H. M. (2002). Analysis of isothermal remanent magnetization acquisition curves using the expectation-maximization algorithm. Geophys. J. Int. 148, 58–64. doi:10.1046/j.0956-540x.2001.01558.x
Heslop, D., McIntosh, G., and Dekkers, M. J. (2004). Using time‐ and temperature‐dependent Preisach models to investigate the limitations of modelling isothermal remanent magnetization acquisition curves with cumulative log Gaussian functions. Geophys. J. Int. 157, 55–63. doi:10.1111/j.1365-246X.2004.02155.x
Holbourn, A. E., Kuhnt, W., Clemens, S. C., Kochhann, K. G. D., Jöhnck, J., Lübbers, J., et al. (2018). Late Miocene climate cooling and intensification of southeast Asian winter monsoon. Nat. Commun. 9, 1584. doi:10.1038/s41467-018-03950-1
Holbourn, A., Kuhnt, W., Frank, M., and Haley, B. A. (2013). Changes in Pacific Ocean circulation following the Miocene onset of permanent Antarctic ice cover. Earth Planet Sci. Lett. 365, 38–50. doi:10.1016/j.epsl.2013.01.020
Holbourn, A., Kuhnt, W., Kochhann, K. G. D., Andersen, N., and Sebastian Meier, K. J. (2015). Global perturbation of the carbon cycle at the onset of the miocene climatic optimum. Geology 43, 123–126. doi:10.1130/G36317.1
Holbourn, A., Kuhnt, W., Lyle, M., Schneider, L., Romero, O., and Andersen, N. (2014). Middle Miocene climate cooling linked to intensification of eastern equatorial Pacific upwelling. Geology 42, 19–22. doi:10.1130/G34890.1
Holbourn, A., Kuhnt, W., Schulz, M., and Erlenkeuser, H. (2005). Impacts of orbital forcing and atmospheric carbon dioxide on Miocene ice-sheet expansion. Nature 438, 483–487. doi:10.1038/nature04123
Houtz, R., and Meijer, R. (1970). Structure of the Ross Sea shelf from profiler data. J. Geophys. Res. Solid Earth 75, 6592–6597. doi:10.1029/JB075i032p06592
Jovane, L., Acton, G., Florindo, F., and Verosub, K. L. (2008). Geomagnetic field behavior at high latitudes from a paleomagnetic record from Eltanin core 27–21 in the Ross Sea sector, Antarctica. Earth Planet Sci. Lett. 267, 435–443. 10.1016/j.epsl.2007.12.006
Jovane, L., Florindo, F., Acton, G., Ohneiser, C., Sagnotti, L., Strada, E., et al. (2019). Miocene glacial dynamics recorded by variations in magnetic properties in the ANDRILL‐2A drill core. J. Geophys. Res. Solid Earth 124, 2297–2312. doi:10.1029/2018JB016865
Jovane, L., Florindo, F., Bazylinski, D. A., and Lins, U. (2012). Prismatic magnetite magnetosomes from cultivated Magnetovibrio blakemorei strain MV-1: a magnetic fingerprint in magnetic sediments?. Environ Microbiol Rep 4, 664–668. doi:10.1111/1758-2229.12000
Jovane, L., Florindo, F., and Dinarès-Turell, J. (2004). Environmental magnetic record of paleoclimate change from the Eocene-Oligocene stratotype section, Massignano, Italy. Geophys. Res. Lett. 31, L15601. doi:10.1029/2004GL020554
Jovane, L., and Verosub, K. L. (2011). “Magnetic properties of oligocene-eocene cores from SHALDRIL II, Antarctica,” in Tectonic, climatic, and cryospheric Evolution of the antarctic peninsula. Editors J. B. Anderson, and J. S. Wellner (Washington, DC: American Geophysical Union), Vol. 63, 115–130.
Kaneps, A. G. (1975). “Cenozoic planktonic foraminifera from antarctic deep-sea sediments, Leg 28, DSDP,” in Initial reports of the Deep Sea drilling Project. Editor A. G. Kaneps (Washington, D. C: U.S. Government Printing Office), Vol. 28.
Kennett, J. P. (1977). Cenozoic evolution of Antarctic glaciation, the circum-Antarctic Ocean, and their impact on global paleoclimate. J. Geophys. Res. 82, 3843–3860. doi:10.1029/JC082i027p03843
Kominz, M. A., and Pekar, S. F. (2001). Oligocene eustasy from two-dimensional sequence stratigraphic backstripping. Geol. Soc. Am. Bull. 113 (3), 291–304. doi:10.1130/0016-7606(2001)113<0291:OEFTDS>2.0.CO;2
Kruiver, P. P., Dekkers, M. J., and Heslop, D. (2001). Quantification of magnetic coercivity components by the analysis of acquisition curves of isothermal remanent magnetization. Earth Planet Sci. Lett. 189, 269–276. 10.1016/S0012-821X(01)00367-3
Kulhanek, D. K., Levy, R. H., Clowes, C. D., Prebble, J. G., Rodelli, D., Jovane, L., et al. (2019). Revised chronostratigraphy of DSDP site 270 and late Oligocene to early Miocene paleoecology of the Ross Sea sector of Antarctica. Global Planet. Change 178, 46–64. doi:10.1016/j.gloplacha.2019.04.002
Lear, C. H., Coxall, H. K., Foster, G. L., Lunt, D. J., Mawbey, E. M., Rosenthal, Y., et al. (2015). Neogene ice volume and ocean temperatures: insights from infaunal foraminiferal Mg/Ca paleothermometry. Paleoceanography 30 (11), 437–1454. doi:10.1002/2015PA002833
Lear, C. H., Rosenthal, Y., Coxall, H. K., and Wilson, P. A. (2004). Late Eocene to early Miocene ice sheet dynamics and the global carbon cycle. Paleoceanogr. Paleoclimatol. 19, PA4015. doi:10.1029/2004PA001039
Levy, R., Harwood, D., Florindo, F., Sangiorgi, F., Tripati, R., von Eynatten, H., et al. (2016). Antarctic ice sheet sensitivity to atmospheric CO2 variations in the early to mid-Miocene. Proc. Natl. Acad. Sci. Unit. States Am. 113 (13), 3453–3458. doi:10.1073/pnas.1516030113
Levy, R. H., and Harwood, D. M. (2000). “Tertiary marine palynomorphs from the McMurdo Sound erratics, Antarctica,” in Paleobiology and Paleoenvironments of Eocene Rocks: McMurdo Sound, East Antarctica. 76, 183–242.
Levy, R. H., Meyers, S. R., Naish, T. R., Golledge, N. R., McKay, R. M., Crampton, J. S., and Harwood, D. M. (2019). Antarctic ice-sheet sensitivity to obliquity forcing enhanced through ocean connections. Nat. Geosci. 12 (2), 132–137. doi:10.1073/pnas.1516030113
Lewis, A. R., Marchant, D. R., Ashworth, A. C., Hemming, S. R., and Machlus, M. L. (2007). Major middle Miocene global climate change: evidence from East Antarctica and the transantarctic mountains. Geol. Soc. Am. Bull. 119, 1449–1461. doi:10.1130/00167606(2007)119[1449:MMMGCC]2.0.CO;2
Liebrand, D., de Bakker, A. T. M., Beddow, H. M., Wilson, P. A., Bohaty, S. M., Ruessink, G., et al. (2017). Evolution of the early Antarctic ice ages. Proc. Natl. Acad. Sci. Unit. States Am. 114, 3867–3872. doi:10.1073/pnas.1615440114
Lurcock, P. C., and Florindo, F. (2017). Antarctic climate history and global climate changes. Cambridge: Oxford University Press.
Lurcock, P. C., and Florindo, F. (2019). New developments in the PuffinPlot paleomagnetic data analysis program. Geochem. Geophys. Geosyst. 20, 5578–5587. doi:10.1029/2019GC008537
Lurcock, P., and Wilson, G. (2012). PuffinPlot: a versatile, user-friendly programme for paleomagnetic analysis. Geochem. Geophys. Geosyst. 13, Q06Z45. doi:10.1029/2012GC004098
Lyle, M., Gibbs, S., Moore, T. C., and Rea, D. K. (2007). Late Oligocene initiation of the antarctic circumpolar current: evidence from the South Pacific. Geology 35, 691. doi:10.1130/G23806A.1
Mandra, Y. T., and Mandra, H. (1970). Antarctic Tertiary marine climate based on silicoflagellates. Antarct. J. U. S. 5 (5), 178–180.
Mandra, Y. T., and Mandra, H. (1971). Upper-eocene silicoflagellates from new-zealand. Antarct. J. U. S. 6 (5), 177–178.
Markwick, P. J. (2007). “The palaeogeographic and palaeoclimatic significance of climate proxies for data-model comparisons,” in Deep-time Perspectives on climate change: Marrying the Signal from computer Models and biological proxies. Editors M. Williams, A. M. Haywood, F. J. Gregory, and D. N. Schmidt (London, United Kingdom: The Geological Society of London on behalf of The Micropalaeontological Society), 251–312.
McCollum, D. W. (1975). “Diatom stratigraphy of the Southern Ocean,” in Initial reports of the Deep Sea drilling Project. Editor A. G. Kaneps (Washington, DC: U.S. Government Printing Office), Vol. 28.
Miller, K. G. (2005a). The phanerozoic record of global sea-level change. Science 310, 1293–1298. doi:10.1126/science.1116412
Miller, K. G., Wright, J. D., and Browning, J. V. (2005b). Visions of ice sheets in a greenhouse world. Mar. Geol. 217, 215–231. doi:10.1016/j.margeo.2005.02.007
Miller, K. G., Wright, J. D., and Fairbanks, R. G. (1991). Unlocking the Ice House: Oligocene-Miocene oxygen isotopes, eustasy, and margin erosion. J. Geophys. Res. 96, 6829–6848. doi:10.1029/90JB02015
Nelson, C. S., and Cook, P. J. (2001). History of oceanic front development in the New Zealand sector of the Southern Ocean during the Cenozoic—a synthesis. N. Z. J. Geol. Geophys. 44 (4), 535–553. doi:10.1080/00288306.2001.9514954
Olney, M. P., Scherer, R. P., Harwood, D. M., and Bohaty, S. M. (2007). Oligocene–early Miocene Antarctic nearshore diatom biostratigraphy. Deep-Sea Research II 54, 2325–2349. doi:10.1016/j.dsr2.2007.07.020
Olsson, R. K., Hemleben, C., Huber, B. T., and Berggren, W. A. (2006). “Taxonomy, biostratigraphy, and phylogeny of Eocene Globigerina, Globoturborotalita, subbotina, and turborotalita,” in Atlas of Eocene planktonic foraminifera. Editors P. N. Pearson, R. K. Olsson, C. Hemleben, B. T. Huber, and W. A. Berggren (Cushman Foundation for Foraminiferal Research, Special Publication), Chap. 6, 41, 111–168.
Orsi, A. H., and Wiederwohl, C. L. (2009). A recount of Ross Sea waters. Deep Sea Res. Part II Top. Stud. Oceanogr. 56 (13–14), 778–795. doi:10.1016/j.dsr2.2008.10.033
Ozima, M., and Larson, E. E. (1970). Low- and high-temperature oxidation of titanomagnetite in relation to irreversible changes in the magnetic properties of submarine basalts. J. Geophys. Res. 75 (5), 103–101. doi:10.1029/JB075i005p01003
Pälike, H., Norris, R. D., Herrle, J. O., Wilson, P. A., Coxall, H. K., Lear, C. H., et al. (2006). The heartbeat of the Oligocene climate system. Science 314, 1894–1898. doi:10.1126/science.1133822
Pekar, S. F., DeConto, R. M., and Harwood, D. M. (2006). Resolving a late Oligocene conundrum: deep-sea warming and Antarctic glaciation. Palaeogeogr. Palaeoclimatol. Palaeoecol. 231, 29–40. doi:10.1016/j.palaeo.2005.07.024
Plantz, P. E. (2007). SL-AN-25 revision A. Blue laser technology applied to the microtrac unified scatter technique for full-range particle size Measurement. Application note 8. Available at: https://pdfs.semanticscholar.org/bba0/410e2cbffeb8f6f8f426e5a9fdcd22dbbf4f.pdf (Accessed 2007).
Roberts, A. P., Sagnotti, L., Florindo, F., Bohaty, S. M., Verosub, K. L., Wilson, G. S., et al. (2013). Environmental magnetic record of paleoclimate, unroofing of the transantarctic mountains, and volcanism in late Eocene to early Miocene glaci-marine sediments from the Victoria Land basin, Ross Sea, Antarctica. J. Geophys. Res. Solid Earth 118, 1845–1861. doi:10.1002/jgrb.50151
Robertson, D. J., and France, D. E. (1994). Discrimination of remanence-carrying minerals in mixtures, using isothermal remanent magnetisation acquisition curves. Phys. Earth Planet. In. 82, 223–234. doi:10.1016/0031-9201(94)90074-4
Rodelli, D., Jovane, L., Giorgioni, M., Rego, E. S., Cornaggia, F., Benites, M., et al. (2019). Diagenetic fate of biogenic soft and hard magnetite in chemically stratified sedimentary environments of mamanguá ría, Brazil. J. Geophys. Res. Solid Earth 124, 2313–2330. doi:10.1029/2018JB016576
Rodelli, D., Jovane, L., Roberts, A. P., Cypriano, J., Abreu, F., and Lins, U. (2018). Fingerprints of partial oxidation of biogenic magnetite from cultivated and natural marine magnetotactic bacteria using synchrotron radiation: fingerprints of partial oxidation of biogenic magnetite. Environ. Microbiol. Rep. 10, 337–343. doi:10.1111/1758-2229.12644
Sagnotti, L., Florindo, F., Verosub, K. L., Wilson, G. S., and Roberts, A. P. (1998). Environmental magnetic record of antarctic palaeoclimate from eocene/oligocene glaciomarine sediments, Victoria Land basin: magnetic record of antarctic palaeoclimate. Geophys. J. Int. 134, 653–662. doi:10.1046/j.1365-246x.1998.00559.x
Salamy, K. A., and Zachos, J. C. (1999). Latest Eocene—early Oligocene climate change and Southern Ocean fertility: inferences from sediment accumulation rates and stable isotope data. Paleogeog. Paleoclim, Paleoecol. 145, 61–77. doi:10.1016/S0031-0182(98)00093-5
Savian, J. F., Jovane, L., Frontalini, F., Trindade, R. I., Coccioni, R., Bohaty, S. M., et al. (2014). Enhanced primary productivity and magnetotactic bacterial production in response to middle Eocene warming in the Neo-Tethys Ocean. Palaeogeogr. Palaeoclimatol. Palaeoecol. 414, 32–45. doi:10.1016/j.palaeo.2014.08.009
Savian, J. F., Jovane, L., Giorgioni, M., Iacoviello, F., Rodelli, D., Roberts, A. P., et al. (2016). Environmental magnetic implications of magnetofossil occurrence during the Middle Eocene Climatic Optimum (MECO) in pelagic sediments from the equatorial Indian Ocean. Palaeogeogr. Palaeoclimatol. Palaeoecol. 441, 212–222. doi:10.1016/J.PALAEO.2015.06.029
Scherer, R., Bohaty, S. M., and Harwood, David. M. (2000). Oligocene and lower Miocene siliceous microfossil biostratigraphy of Cape Roberts Project core CRP-2/2A, Victoria Land basin, Antarctica. Papers in the Earth and atmospheric Sciences, 282.
Shevenell, A. E., Kennett, J. P., and Lea, D. W. (2008). Middle Miocene ice sheet dynamics, deep-sea temperatures, and carbon cycling: a Southern Ocean perspective. Geochem. Geophys. Geosyst. 9, Q02006. doi:10.1029/2007GC001736
Shevenell, A. E., Kennett, J. P., and Lea, D. W. (2004). Middle Miocene Southern Ocean cooling and antarctic cryosphere expansion. Science 305, 1766–1770. doi:10.1126/science.1100061
Spezzaferri, S., Olsson, R. K., Hemleben, C., Wade, B. S., and Coxall, H. K. (2018). “Taxonomy, biostratigraphy, and phylogeny of Oligocene and lower Miocene Globoturborotalita,” in Atlas of Oligocene planktonic foraminifera. Editors B. S. Wade, R. K. Olsson, P. N. Pearson, B. T. Huber, and W. A. Berggren (Cushman Foundation for Foraminiferal Research), 46, 231–268.
Takemura, A., and Ling, H. Y. (1997). Eocene and Oligocene radiolarian biostratigraphy from the Southern Ocean: correlation of ODP legs 144 (atlantic ocean) and 120 (Indian ocean). Mar. Micropaleontol. 30, 97–116. doi:10.1016/S0377-8398(96)00017-5
Torsvik, T. H., Van der Voo, R., Preeden, U., Mac Niocaill, C., Steinberger, B., Doubrovine, P. V., et al. (2012). Phanerozoic polar wander, palaeogeography and dynamics. Earth Sci. Rev. 114 (3–4), 325–368. doi:10.1016/j.earscirev.2012.06.007
Wade, B. S., Olsson, R. K., Pearson, P. N., Edgar, K. M., and Premoli Silva, I. (2018). “Taxonomy, biostratigraphy, and phylogeny of Oligocene subbotina,” in Atlas of Oligocene planktonic foraminifera. Editors B. S. Wade, R. K. Olsson, P. N. Pearson, B. T. Huber, and W. A. Berggren (Cushman Foundation for Foraminiferal Research, Special Publication), Chap. 10, 46, 307–330.
Wallich, G. C. (1877). XXXIV—observations on the coccosphere. J. Nat. Hist. 19 (112), 342–350. doi:10.1080/00222937708682153
Weaver, F. M. (1983). “Cenozoic radiolarians from the southwest atlantic, falkland plateau region, Deep Sea drilling Project Leg 71,” in Init. Repts. DSDP, 71. Editor J. W. Ludwig, and V. A. Krasheninnikov (Washington, DC: U.S. Govt. Printing Office).
Westerhold, T., Marwan, N., Drury, A. J., Liebrand, D., Agnini, C., Anagnostou, E., et al. (2020). An astronomically dated record of Earth’s climate and its predictability over the last 66 million years. Science 369, 1383–1387. doi:10.1126/science.aba6853
Whitworth, T., Orsi, A. H., Kim, S.-J., Nowlin, W. D., and Locarnini, R. A. (1995). “Water masses and mixing near the Antarctic slope front,” in Antarctic research series (volume 75): ocean, ice, and atmosphere: interactions at the antarctic continental margin. Editors S.S. Jacobs, and R.F. Weiss (Washington, DC: American Geophysical Union), 1–27.
Wilson, G. S., Florindo, F., Sagnotti, L., Verosub, K. L., and Roberts, A. P. (2000). Magnetostratigraphy of oligocene-miocene glaciomarine strata from CRP-2/2A, Victoria Land basin. Antarct. Terra Ant. 7, 631–646.
Wilson, G. S., Pekar, S. F., Naish, T. R., Passchier, S., and DeConto, R. (2009). “The Oligocene – Miocene boundary – antarctic climate response to orbital forcing,” in Developments in Earth and environmental Sciences, Vol 8, antarctic climate EvolutionFabio Florindo and martin siegert. (Amsterdam, Netherlands: Elsevier), 369–400.
Wilson, G. S., Roberts, A. P., Verosub, K. L., Florindo, F., and Sagnotti, L. (1998). Magnetobiostratigraphic chronology of the eocene—oligocene transition in the CIROS-1 core, Victoria Land margin, Antarctica: implications for antarctic glacial history. Geol. Soc. Am. Bull. 110 (1), 35–47. doi:10.1130/0016-7606(1998)110<0035:MCOTEO>2.3.CO;2
Yamazaki, T. (2012). Paleoposition of the Intertropical Convergence Zone in the eastern Pacific inferred fromglacial–interglacial changes in terrigenous and biogenicmagnetic mineral fractions. Geology 40, 151–154. doi:10.1130/G32646.1
Zachos, J. C., Flower, B. P., and Paul, H. (1997). Orbitally paced climate oscillations across the Oligocene/Miocene boundary. Nature 388, 567–570. doi:10.1038/41528
Zachos, J. C., Quinn, T. M., and Salamy, K. A. (1996). High-resolution (10 4 years) deep-sea foraminiferal stable isotope records of the Eocene-Oligocene climate transition. Paleoceanography 11, 251–266. doi:10.1029/96PA00571
Zachos, J., Pagani, M., Sloan, L., Thomas, E., and Billups, K. (2001). Trends, rhythms, and aberrations in global climate 65 Ma to present. Science 292, 686–693. doi:10.1126/science.1059412
Keywords: magnetostratigraphy, grain size, Ross Sea Antarctica, circumpolar current, Oligocene-Early Miocene
Citation: Jovane L, Florindo F, Wilson G, de Almeida Pecchiai Saldanha Leone S, Hassan MB, Rodelli D and Cortese G (2020) Magnetostratigraphic Chronology of a Cenozoic Sequence From DSDP Site 274, Ross Sea, Antarctica. Front. Earth Sci. 8:563453. doi: 10.3389/feart.2020.563453
Received: 18 May 2020; Accepted: 13 November 2020;
Published: 14 December 2020.
Edited by:
Hagay Amit, Université de Nantes, FranceReviewed by:
Belén Oliva-Urcia, Autonomous University of Madrid, SpainCopyright © 2020 Jovane, Florindo, Wilson, de Almeida Pecchiai Saldanha Leone, Hassan, Rodelli and Cortese. This is an open-access article distributed under the terms of the Creative Commons Attribution License (CC BY). The use, distribution or reproduction in other forums is permitted, provided the original author(s) and the copyright owner(s) are credited and that the original publication in this journal is cited, in accordance with accepted academic practice. No use, distribution or reproduction is permitted which does not comply with these terms.
*Correspondence: Luigi Jovane, am92YW5lQHVzcC5icg==
Disclaimer: All claims expressed in this article are solely those of the authors and do not necessarily represent those of their affiliated organizations, or those of the publisher, the editors and the reviewers. Any product that may be evaluated in this article or claim that may be made by its manufacturer is not guaranteed or endorsed by the publisher.
Research integrity at Frontiers
Learn more about the work of our research integrity team to safeguard the quality of each article we publish.