
95% of researchers rate our articles as excellent or good
Learn more about the work of our research integrity team to safeguard the quality of each article we publish.
Find out more
ORIGINAL RESEARCH article
Front. Earth Sci. , 08 October 2020
Sec. Quaternary Science, Geomorphology and Paleoenvironment
Volume 8 - 2020 | https://doi.org/10.3389/feart.2020.561322
This article is part of the Research Topic Observations, Interactions, and Implications of Increasingly Dynamic Permafrost Coastal Systems View all 15 articles
 Michael Lim1*
 Dustin Whalen2
 Paul J. Mann1Paul Fraser2
 Heather Bay Berry3Charlotte Irish4Kendyce Cockney4
 John Woodward1
Permafrost coasts are extensive in scale and complex in nature, resulting in particular challenges for understanding how they respond to both long-term shifts in climate and short-term extreme weather events. Taking examples from the Canadian Beaufort Sea coastline characterized by extensive areas of massive ground ice within slump and block failure complexes, we conduct a quantitative analysis of the practical performance of helicopter-based photogrammetry. The results demonstrate that large scale (>1 km2) surface models can be achieved at comparable accuracy to standard unmanned aerial vehicle surveys, but 36 times faster. Large scale models have greater potential for progressive alignment and contrast issues and so breaking down image sequences into coherent chunks has been found the most effective technique for accurate landscape reconstructions. The approach has subsequently been applied in a responsive acquisition immediately before and after a large storm event and during conditions (wind gusts >50 km h−1) that would have prohibited unmanned aerial vehicle data acquisition. Trading lower resolution surface models for large scale coverage and more effective responsive monitoring, the helicopter-based data have been applied to assess storm driven-change across the exposed outer islands of the Mackenzie Delta area for the first time. These data show that the main storm impacts were concentrated on exposed North orientated permafrost cliff sections (particularly low cliffs, >20 m in height) where cliff recession was 43% of annual rates and in places up to 29% of the annual site-wide erosion volume was recorded in this single event. In contrast, the thaw-slump complexes remained relatively unaffected, debris flow fans were generally more resistant to storm erosion than the ice-rich cliffs, perhaps due to the relatively low amounts of precipitation that occurred. Therefore, the variability of permafrost coast erosion rates is controlled by interactions between both the forcing conditions and local response mechanisms. Helicopter-based photogrammetric surveys have the potential to effectively analyze these controls with greater spatial and temporal consistency across more representative scales and resolutions than has previously been achieved, improving the capacity to adequately constrain and ultimately project future Arctic coast sensitivity.
An increase in storm intensity resulting from rising air temperatures has been widely reported across the Arctic (Pisaric et al., 2011; Small et al., 2011), and has potentially shifted the Beaufort Sea to a “new normal” climatic state (Wood et al., 2013). Despite a limited ice-free season when erosion can occur, pan-Arctic long-term recession rates are high relative to other coastlines (Lantuit et al., 2012). Concerns have been raised over the potential for accelerated rates of erosion in permafrost coasts in particular (Wobus et al., 2011; Radosavljevic et al., 2016), but both the spatial (Maslakov and Kraev, 2016; Overduin et al., 2016) and the temporal (Günther et al., 2013; Nielsen et al., 2020) variability noted have proven challenging to accurately model and assess (Fritz et al., 2017). A key element of uncertainty within the quantification of erosion rates originates in the approaches used to monitor change. There is generally a dichotomy of scales of investigation based on frequent, local and detailed studies, or infrequent (annual at best) wide-scale assessments that simplify the coastal zone into a single retreating line, usually denoted by the shore or cliff top (Günther et al., 2013). Position mapping from satellite images often focuses on landward recession rates as the primary indicator of coastal change, but volume estimates can be derived if surface topography is accounted for (Novikova et al., 2018), and these metrics have been comprehensively investigated by (Obu et al., 2016). Satellite imagery is limited for responding to short-term events such as storms (Cunliffe et al., 2019), although visual data is available at increasingly high frequency (Nitze and Grosse, 2016).
The capacity to consistently measure detailed volumetric change over wide regions or large coherent sites is generally limited to lidar surveys (Obu et al., 2017), which are effective but require a dedicated survey vehicle and are cost-prohibitive for frequent or responsive surveys. Long-range fixed wing unmanned aerial vehicle (UAV) systems such as the Griffon Aerospace Outlaw Seahunter, with a maximum possible range of 100 km, are being used to map the Inuvik to Tuktoyaktuk highway but require restrictive pre-arranged notice to be filed with the aviation authority and are generally limited to fair weather conditions. The current state of the art coastal monitoring approach for the challenging and expansive Beaufort Sea coastline is to access remote outer islands and key community or type sites via helicopter in order to undertake detailed photogrammetric UAV surveys of failure complexes (Cunliffe et al., 2019). This approach provides vital data on these sensitive geoindicators of climatic change and helps inform community resilience and decision making (Van der Sluijs et al., 2018). However, it relies on the expert knowledge to identify which areas to concentrate on and leads to a fragmented patchwork of detailed monitoring sites rather than a coherent picture of processes of geomorphic change (Grosse et al., 2016).
Single storm events have the potential to produce short-term order of magnitude increases in erosion rates (Solomon, 2005), but questions remain over how localized these impacts are, whether specific sites are more susceptible to storm-driven change and if storm characteristics (duration, precipitation, wind speed and direction) result in quantifiable differences in landscape responses. The effects of both short-term, high magnitude events and long-term trends on processes beyond the landward retreat of the coast, such as thaw-induced subsidence or transitions to new failure mechanisms, cannot be convincingly addressed with current datasets. Here we examine the potential of helicopter-based SfM surveys as a new, effective approach for wide-scale volumetric coastal change monitoring. Applications using helicopter platforms for photogrammetric surveys remain very limited, particularly repeat surveys for change detection, but have achieved notable successes in generating topographic maps of inaccessible hazardous areas (Neri et al., 2017) or long linear riverscapes (Dietrich, 2016). We evaluate helicopter-based photogrammetric surveys of a key ice-rich permafrost coast type site against a model produced using standard high-resolution UAV captured images. We then apply a wide-scale pre- and post-storm survey across exposed outer islands of the Mackenzie Delta area, which is undergoing significant erosion rates (Solomon, 2005) and threatening communities (Irrgang et al., 2019).
The MacKenzie River Delta area of the Beaufort Sea coast is significant within the Arctic due to its rapidly changing hydrology and ecosystem dynamics (Lesack and Marsh, 2007, Lesack and Marsh, 2010); it is sea-ice and river discharge interactions (Dean et al., 1994); and its significance in supplying sediments to the Beaufort Shelf (Goñi et al., 2000). It is thought to be the largest single source of sediments in the Arctic (Rachold et al., 2000). Although future climate projections in the area contain substantial variability, a study of 18 future projections to 2,039 showed continued temperature and precipitation increases and many are already being exceeded (Bonsal and Kochtubajda, 2009), with significant trends in deeper thaw penetration also noted from 1991–2016 (O’Neill et al., 2019). Recent concerns have centered on the potentially under-estimated (O’Rourke, 2017) and accelerating rates of coastal erosion in the area (Lantuit et al., 2012; Irrgang et al., 2018), and particularly the vulnerability of communities (Alvarez et al., 2020), infrastructure (Warren et al., 2005), ecosystems (Waugh et al., 2018) and significant archaeological sites across the Inuvialuit area (O’Rourke, 2017).
Tuktoyaktuk is one of the major population centers within the Inuvialuit Regional Settlement Region (Waugh et al., 2018), and is a key area of concern due to unprecedented recent development following the completion of the Northwest Territories Highway 10 that connects the coastal settlement to Inuvik by permanent road. Homes in Tuktoyaktuk have already been destroyed or relocated in response to coastal erosion. Erosion processes are particularly effective in the area resulting in retreat rates in excess of 0.7 m a−1 and high susceptibility to storms is typically observed (Solomon, 2005). Adjacent to the Tuktoyaktuk community is the Pingo National Landmark, a 16 km2 designated site that includes massive ground ice structures at a range of scales, from microscale (<2 m height) patterned ground, through mesoscale (generally 2–30 m high) plateaus of ice layered cliffs to macroscale (>20 m high) pingos that dominate the landscape. The area is within the zone of continuous permafrost (Burn and Kokelj, 2009) and Peninsula Point is a well-documented type site for massive ground ice (Mackay and Dallimore, 1992; Lim et al., 2020) that has been used to develop and evaluate the approaches in this paper. On the evening of August 4, 2019 a storm (wind gusts >50 km h−1) resulted in a surge that breached parts of the Tuktoyaktuk community and caused extensive damage to sea defenses. Both pre- and post-storm helicopter-based surveys have been conducted to quantify the changes occurring at Peninsula Point (an area of 0.27 km2) and across the outer islands in the delta (Figure 1), including Pelly Island (27.29 km2), Hooper Island (8.35 km2) and Pullen Island (5.6 km2).
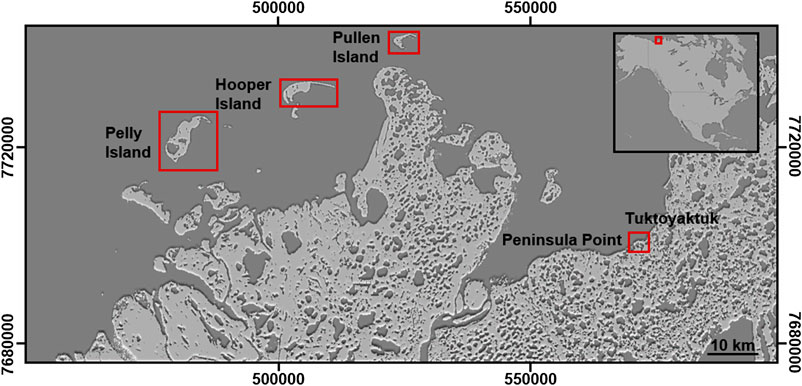
FIGURE 1. Study area in the Mackenzie Delta area, key sites are highlighted.
For the past several decades Natural Resources Canada (NRCan) has had the responsibility of monitoring the rapid changes occurring along the Beaufort Sea coast (Solomon et al., 1994; Forbes et al., 1995). Long-term erosion rates can be approximated by mapping the cliff or shoreline position, but to address the spatial and temporal limitations of this approach, NRCan conducts frequent (annual or sub-annual) monitoring of key sites across the region using helicopter access and then detailed UAV surveys of local areas of concern. A new helicopter-based photogrammetric survey approach was developed and tested at Peninsula Point, using a UAV survey of the island undertaken the following day as a ground truth model for comparison.
In order to assess the feasibility and performance of wide-scale (>1 km2) helicopter-based photogrammetry for effective coastal monitoring, certain criteria have been used to constrain the approach development. Firstly, only non-specialist equipment has been used. Any professional surveying systems that attach to the outside of the helicopter are unlikely to be an option for long-term monitoring practice as they are prohibitively expensive, require special permission and testing for specific aircraft and would take time to install, preventing effective response times. Additionally, only survey geometry (view angles) achievable using a digital single-lens reflex camera aimed through the open window (the Bell 206B and LR and Airbus AS350B2 and AS350B3 helicopter models have been tested) because, although the door can sometimes be removed this is not always possible and often not practical for responsive monitoring data collection flights that may have multiple objectives beyond topographic surveys. Secondly, the aim of developing and evaluating a helicopter survey method is not to replicate the established procedure for UAV surveys because the approach needs to be effectively upscaled. Capturing oblique images from a helicopter negates the usual nadir images achieved from UAV surveys and the time consuming and detailed use of ground control networks is not practicable. However, check point targets, separate to reduced natural feature ground control, have been used to evaluate both helicopter and UAV based models.
A range of data collection approaches have been tested ranging from high (200 m) and steep (20° from vertical) to low (40 m) and shallow (70° from vertical) but the most successful involved high-level oblique image collection. A flying height of 120 m was used for terrain with an elevation range within approximately 20 m (and up to 150 m for cliff heights that reached 30 m). The digital single-lens reflex used was a Sony DSC-RX10M2 linked to an intervalometer set to take images every second. With an average flying speed of 50–60 km h−1, an image was captured approximately every 14–17 m. The use of this system with high speed (95 MB/s) and high capacity (64 GB) SD cards enabled long sequences (several hundred images) to be captured without buffering issues. Single passes of oblique images with an approximate angle of 40° (Figure 2A) generally produced enough overlap to achieve sufficient quality (i.e., they produced point cloud densities >30 ppm2 on clearly identifiable surfaces with no doming, erroneous layers or clouds of non-surface points) DEMs of the eroding cliff and slump areas for testing. This allowed for long stretches of coastline to be surveyed in a single pass, if ground control and check points exist and the changes in coastline orientation are continuous (without sharp changes that lead to large differences in perspective between adjacent images). However, the edges (typically the outer 20%) of the swath area covered by the oblique images and resultant DEM lost image texture, point density and accuracy (Figure 2D). This had two implications. Firstly, a significant (Liu et al., 2015) but often poorly accounted for (Rowland and Coon, 2015) aspect of permafrost landscape response to environmental changes is subsidence (Morse et al., 2009), which would not be well constrained away from coastal focus area. Secondly, when interested in producing a model of a complete island these edge effects lead to registration errors between overlapping sections, resulting in erroneous change concentrated on the edges of overlapping sections that could mask or obscure genuine changes. The most effective approach to minimize this was to capture high level oblique data all around the coastline and then conduct a series (if necessary, to account for 20% edge effects) of flight lines over the island maintaining similar altitude and view angle (Figure 2B).
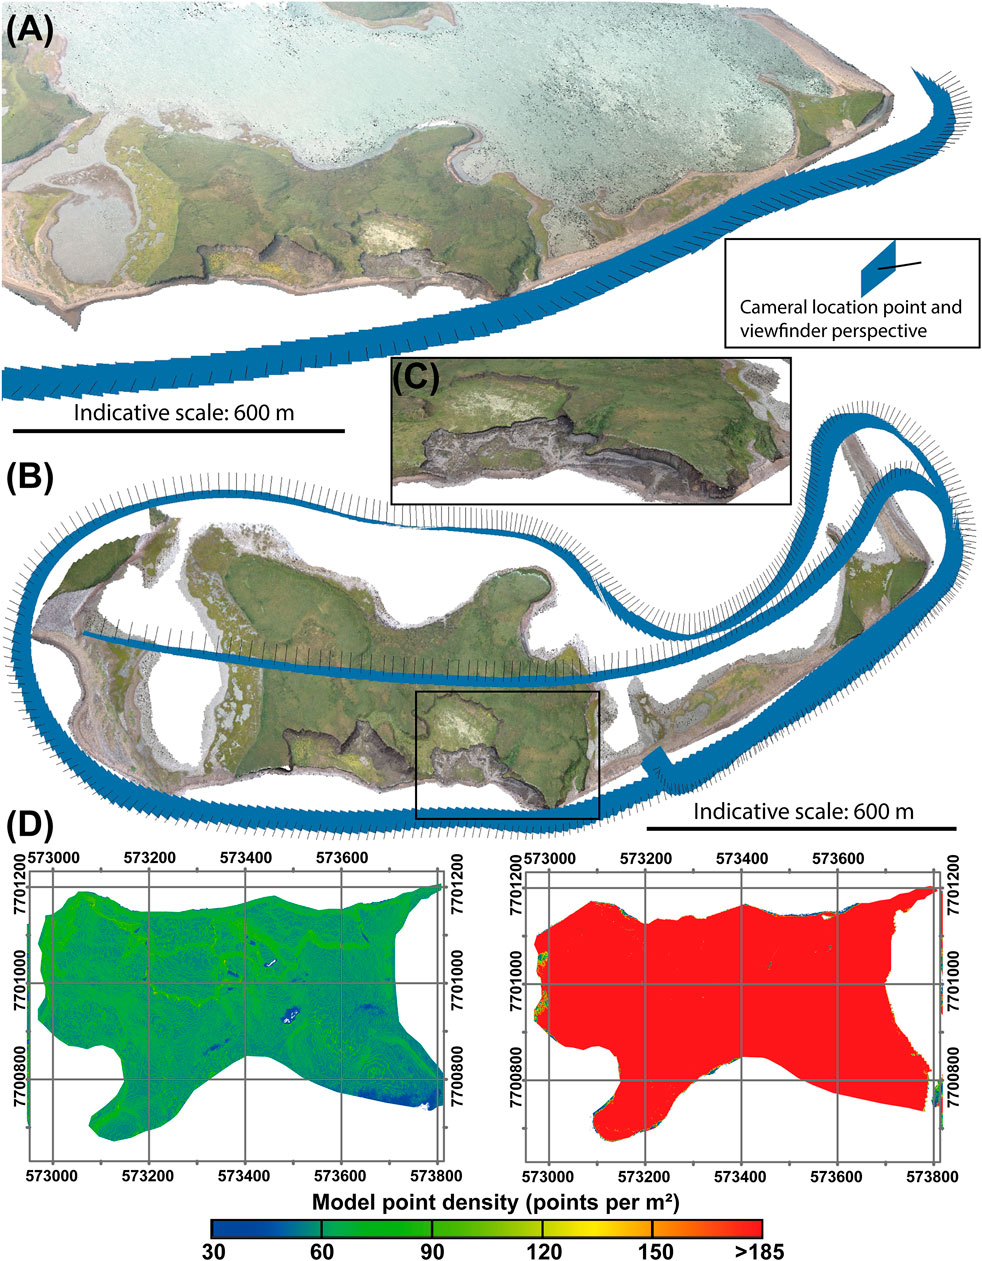
FIGURE 2. Helicopter-based survey geometry and dense point cloud of Peninsula Point, NWT. (A) Coast parallel, single pass surveys produce sufficient quality digital surface point cloud models of the immediate coastal zone but beyond this model accuracies are based on increasingly oblique image matches and have greater potential for error. (B) In order to effectively survey the whole island a concentric collection pattern around the edge and then and oblique pass over the center of the island produced a high quality consistent DEM. (C) Processing has been broken down into coherent sequences of images and then iteratively converged to optimize the DEM from a combination of perspectives in areas of complex topography. (D) Visualization of point resolution differences in the models produced from the two helicopter survey approaches, showing the density reduction away from the coast produced by a single pass (left) and the denser and even coverage of the concentric survey collection (right). A UTM grid is overlain for scale.
Sparse (>200 m separation) natural features have been surveyed using post-processed carrier phase GNSS measurements to establish ground control points with an accuracy within ±0.02 m. In order to externally check the accuracy of the helicopter-based model produced and to survey sites prior to helicopter-based collections, UAV surveys have been conducted with a DJI Matrice 210 RTK equipped with a vertically orientated Zenmuse X4S 20 MP camera. Parallel flight lines (45 m separation) produced an overlapping mosaic of nadir images from a flying height of 100 m. The more limited image footprint and longer collection time meant that lighting and contrast issues were generally more significant in reducing the quality of the UAV model. An even distribution of 12 specially designed temporary control targets were distributed across the survey areas at an approximate separate separation of >100 m. A summary of the survey collection platforms and dates is presented in Table 1.
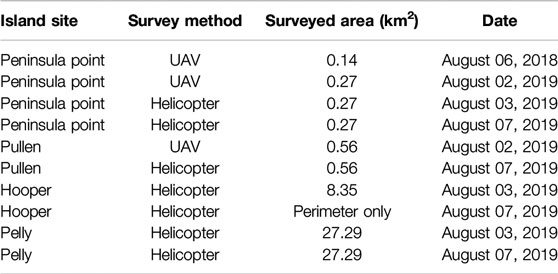
TABLE 1. Summary of survey collections used to analyze storm impacts on the outer islands in the Mackenzie Delta area.
The image sequences have been processed in Agisoft Metashape Professional (version 1.5.5.9097) using a standard workflow (Verhoeven, 2011). Entire sequences of site images have successfully been used here to generate dense point cloud models of deltaic islands (see for example Figure 3B), but when surveying at these large (>km2) scales there is greater potential for lighting contrasts during the survey and misalignments in overlapping areas. To account for this, processing has been broken down into sequences or “chunks” defined by visual differences in lighting and at points of notably different perspectives. Images toward the edges of the sequence have been kept common to the next sequence to ensure overlap. The large sequences of images (a total of 574 images were used for Peninsula points but larger sites surveyed exceeded 1,300 images) processed efficiently (typically overnight) on a specialist workstation with 128 GB RAM and an 18 Core Intel Xeon Gold processor equipped with an 11 GB graphics card. The dense (average > 30 ppm2) point clouds of sections of each site were then exported and iteratively converged in Cloud Compare (version 2.1). The point clouds were filtered for blunders, which were particularly associated with bodies of water in the surveyed scene and the most obliquely generated points (that had a notably lower resolution, typically <30 ppm2) were deleted from overlapping areas. Finally, the point clouds were merged and georeferenced using the sparse distribution of control points (7 points were used for Peninsula Point). Independent check points produced an RMSE of 0.21 m planimetric accuracy and 0.41 m in vertical accuracy.
The UAV surveys were generally processed as a single sequence of 1,200 images but problematic areas of lighting contrast have been processed separately and areas of over exposure had notably higher noise levels. These areas have been filtered for over exposed pixels and any blunders removed manually, but some remained problematic (Figure 3A). The control target points were used directly in Agisoft to orientate and scale the models and separate check points produced a typical planimetric accuracy of 0.05 m and a vertical RMSE of 0.10 m (it is noted that this not representative of the errors within the over exposed flight lines, which have largely been discounted from subsequent analyses).
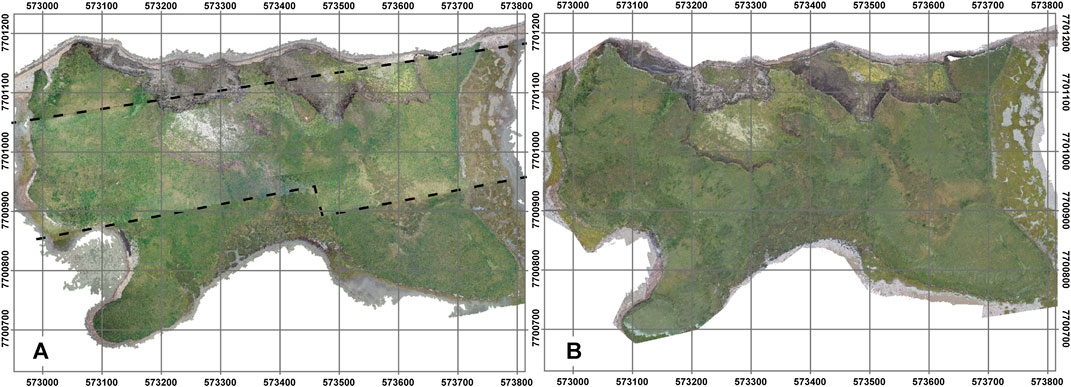
FIGURE 3. Photogrammetric colored point clouds of Peninsula Point, NWT, one day apart. (A) Unmanned aerial vehicle survey of the island collected in flight lines, contrast changes over the course of the survey led to different noise levels and elevation errors across these differences, denoted by the dashed black lines. (B) Helicopter-based survey of the island that was sufficiently quick (5 min, including surrounding areas) that no significant contrast changes occurred. A UTM grid is overlain for scale.
The RMSE values indicate that the helicopter-based models are generally reflective of the surveyed topography, but a more rigorous evaluation has been achieved by analyzing the difference to the higher resolution UAV model conducted with more ground control on the following day. The difference between the surveys should be minimal, limited to the changes occurring in the (24) hours between the surveys. This pattern is evident in the difference model with strong spatial agreement between the standard and widely adopted UAV survey data and the new helicopter-based data (Figure 4A). Additionally, the rapid data collection using a helicopter platform negated some of the flight line contrast noise and alignment errors that affected the slower UAV survey (Figure 3B). Beyond the contrast issue in the UAV survey, locations and quantities of change are consistent with observations from the site; primary activity areas were at a retreating backscarp terrace within a retrogressive thaw complex and at exposed permafrost cliffs at the shoreface Figure 4C. A total volumetric difference of 129.5 m3 was recorded between the surveys, no thresholding has been applied so this may include error as well as genuine change.
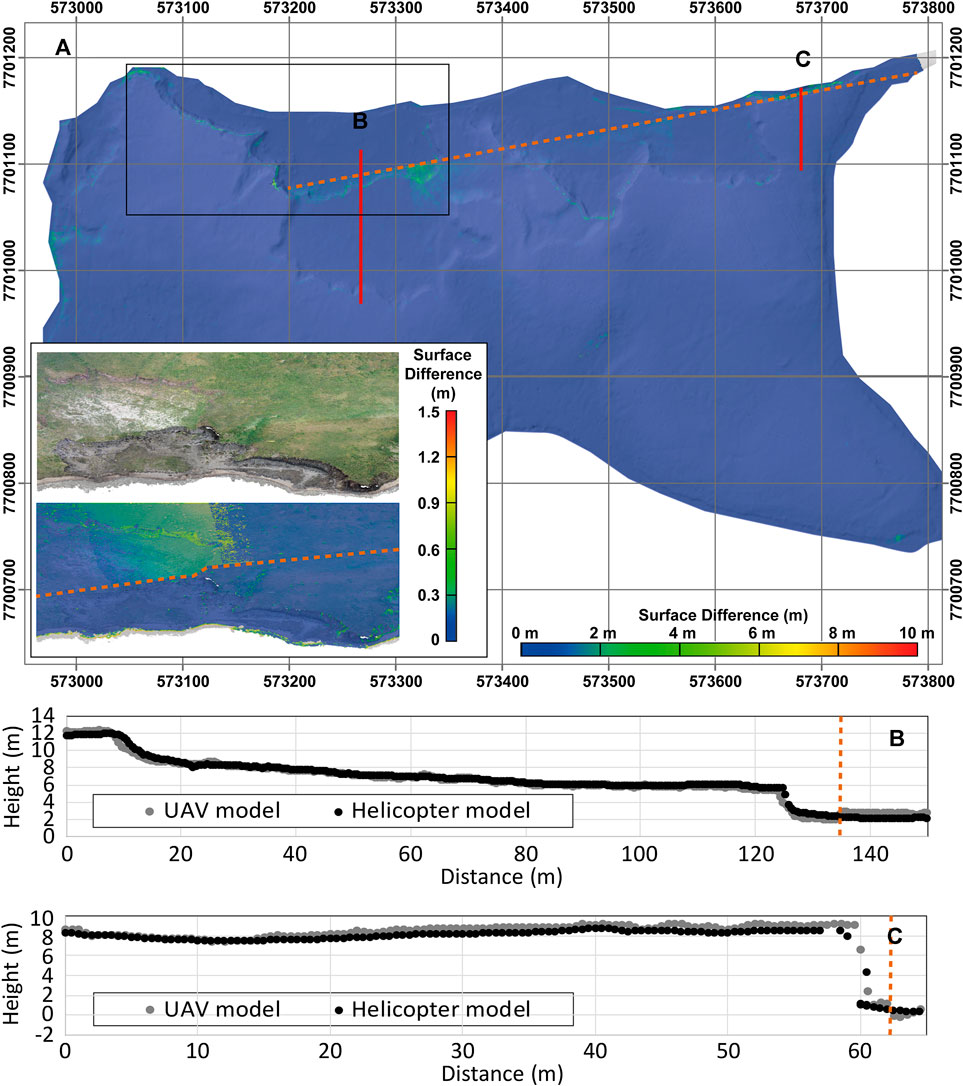
FIGURE 4. DEM surface differences between next-day helicopter and unmanned aerial vehicle (UAV) surveys at Peninsula Point, NWT. (A) Overview of the differences recorded across the island showing no detectable change apart from at the actively eroding cliff faces. This is complicated by an error in the UAV data where lighting contrasts between flight lines resulted in an alignment error denoted by the orange dashed line. Fine scale oblique views are inset (at a different surface difference scale for detail) and a UTM grid is overlain for scale. (B) Profile through a retrogressive thaw slump area shows little discernible change other than the stepped contrast error (dashed orange line). (C) Profile through a section of sea-exposed cliff shows minor (<1 m) recession of the cliff top, the stepped contrast error in the UAV data is also visible (dashed orange line).
The ability to effectively produce a surface model from oblique helicopter-based images demonstrates the potential to quantitatively monitor extensive (km2) areas of coastline. Helicopter surveys using standard photographic equipment and sparse ground control data can account for the complexity of coastal systems such as those found across the Beaufort Sea coast, typified by both long linear sequences of sea-cliffs and dunes and also by numerous island and spit complexes, particularly prevalent in the MacKenzie Delta area. Helicopter-based surveys do not offer the resolution and precision of UAV surveys but the high rates of change across permafrost coastlines may not always warrant such detail. A comparison between the approaches shows that helicopter surveys are significantly more expensive than UAV surveys for a few locally accessible sites, but as soon as monitoring is required on more distant sites helicopter surveys become rapidly more cost-effective (Table 2). Helicopter surveys can now achieve effective quantitative erosion data over wide spatial scales using standard photographic equipment.
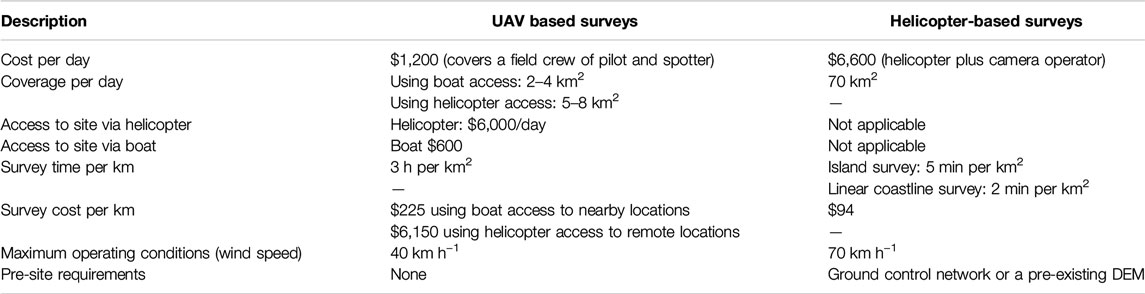
TABLE 2. Comparison of helicopter surveys against the current approach of unmanned aerial vehicle-based monitoring (cost in Canadian dollars).
In order to apply the helicopter-based survey approach for longer term (annual) change quantification the helicopter-based surface model has been compared to a UAV survey conducted a year earlier (Figure 5A). The surface differences show that the currently active areas, principally the exposed cliff faces, dominate the annual signal, although other areas of difference are detected such as the vegetated back scarp of a higher level slump area that had appeared to be relict (Figure 5B; see also Figure 2C). The total annual surface loss at Peninsula Point recorded was 44,522 m3. Over the area of the island (274,670 m2) this is a low rate of change (0.16 m3 per m2) but this response has been concentrated at the exposed massive ice and permafrost cliffs within the island and these areas have receded by approximately 8 m in places (Figure 5C).
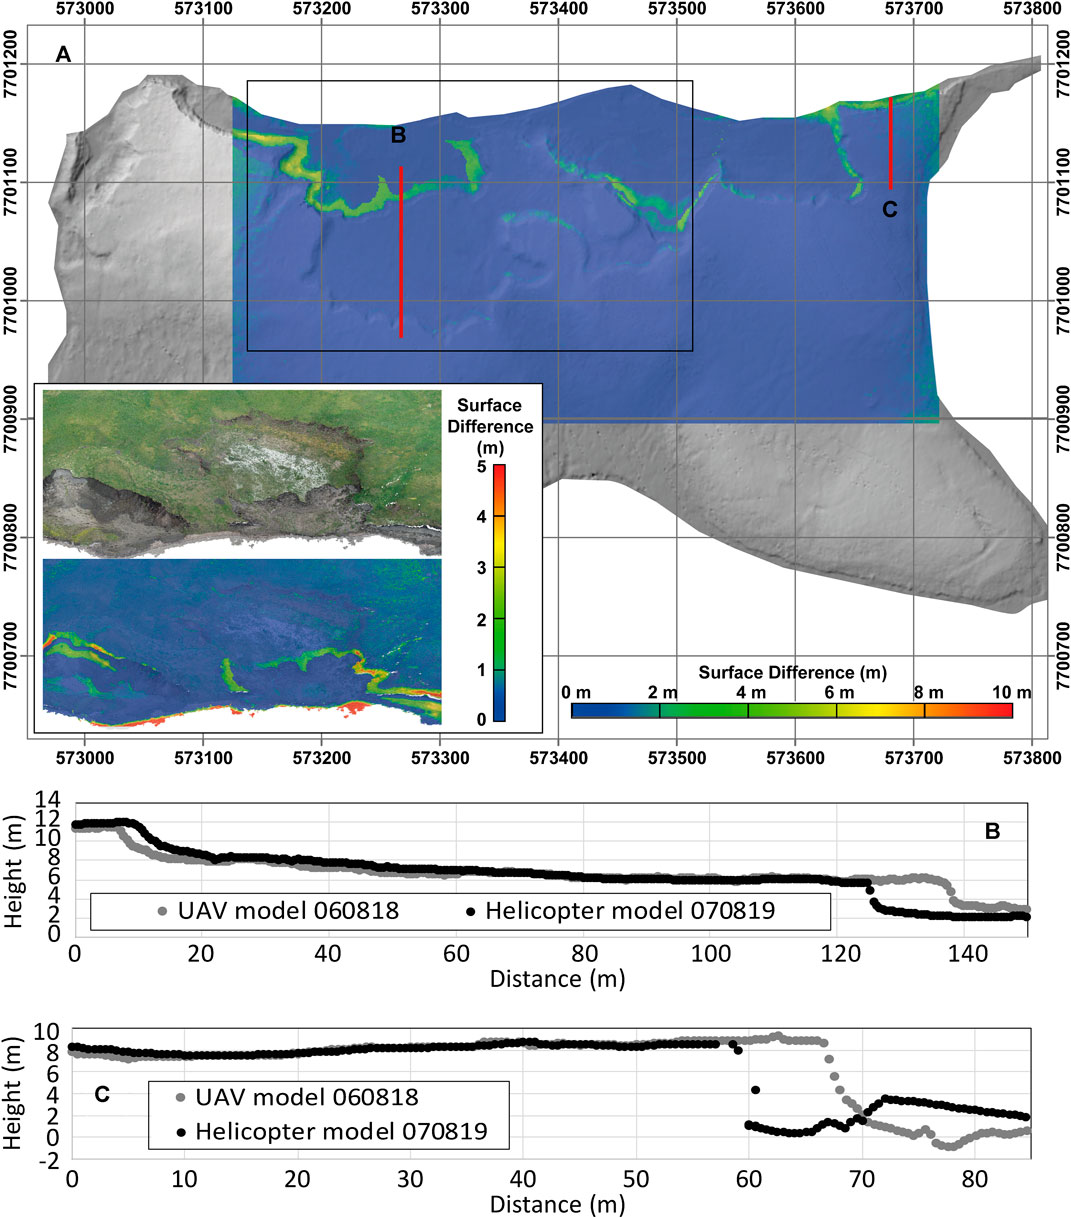
FIGURE 5. DEM surface differences between helicopter and UAV photogrammetric surveys a year apart at Peninsula Point, NWT. (A) Overview of the differences recorded across the island (the UAV data did not capture the whole site) showing change concentrated on retreating slump back scarps and exposed cliffs. Fine scale oblique views are inset (at a different surface difference scale for detail) and a UTM grid is overlain for scale. (B) Profile through a retrogressive thaw slump area shows back scarp retreat and slope toe erosion. (C) Profile through a section of sea-exposed cliff shows approximately 8 m of recession at the cliff top.
After evaluating the performance of helicopter-based photogrammetry for erosion monitoring, a forecast of storm conditions provided the opportunity to apply the new approach at large (>km2) scales. The storm was forecast for the evening of 4th August–morning of August 5, 2019. On the August 3, 2019 a single flight was used to survey seven key monitoring sites across a 150 km stretch of the Beaufort Sea coast. The flight also included stops for installation of time-lapse cameras for validation at key community sites and other research tasks. This meant that one key outer island, Pullen Island, was not surveyed but it had been surveyed using UAV-based photogrammetry the day before. The wind conditions on the third were already escalating (exceeding 50 km h−1) and prohibited UAV surveys but all surveyed sites produced data of comparable accuracy to Peninsula Point, which was also included in the survey and used as a control site. The storm was not particularly exceptional in terms of magnitude, but the duration of higher significant wave heights was notably longer than any preceding events within the 2019 open water season (Figure 6). A repeat flight was undertaken on 7th August when storm conditions had largely abated, but wind speeds (20–30 km h−1) still made UAV surveys challenging. The post-storm data capture included the previous seven sites and other sites of interest such as Pullen Island. Here we present the results from the storm-related differences at the massive ice type site Peninsula Point and then the three outermost islands (highlighted in Figure 1) surveyed in the delta area to quantify the short-term storm related changes occurring.
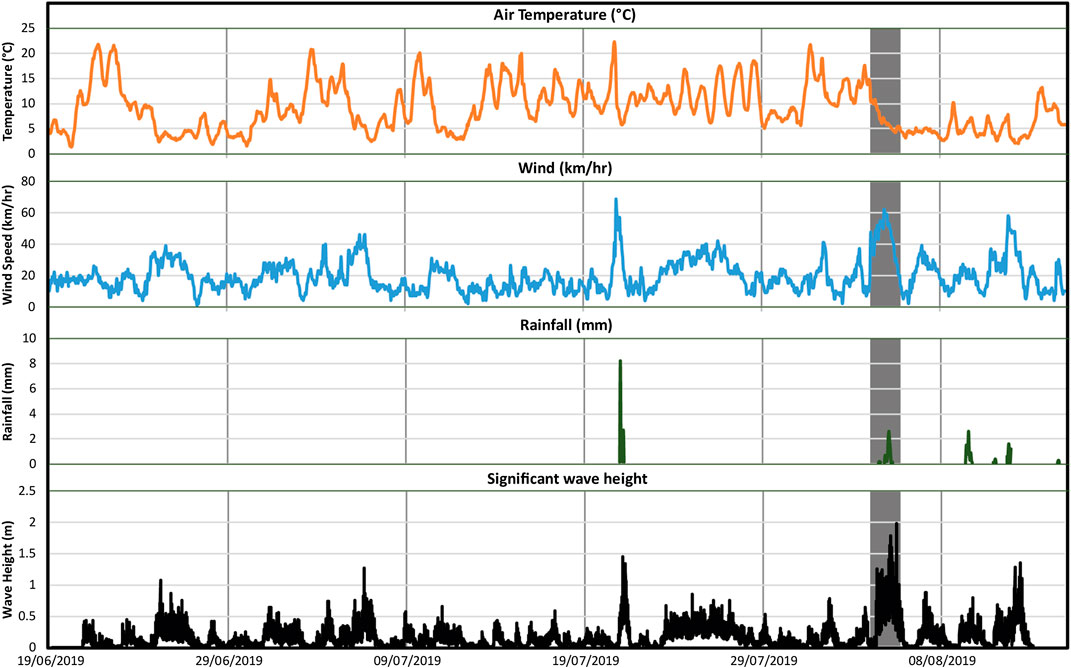
FIGURE 6. Storm conditions (highlighted in gray from 4–5August, 2019) show high wind speeds and sustained high significant wave heights but limited rainfall relative to the rest of the open water season.
The storm-related change at Peninsula Point resulted in the volumetric loss of 12,800 m3, with change concentrated at the cliffs exposed directly to sea waves. This accounted for 29% of the annual total erosion (compared to UAV survey data collected a year earlier; Figure 5) and was disproportionately high given the relatively modest magnitude of the storm, although the storm had sustained high wind and wave conditions and a longer duration than previous events since the sea-ice break-up (Figure 6). The storm was able to remove much of the material that had accumulated at the base of the coastal slope during the previous year (note the lower level of the mud drape in front of the cliff toe in Figure 7B) in addition to a strong response of the cliffs exposed directly to storm surge contact (Figure 7C). In an environment where erosion is concentrated to the ice-free season, the impact of storms on sea cliffs is clear, and can lead to dramatic event-based erosion rates, but slump back scarps at the site were much less affected (Figure 7A). The storm response at Peninsula Point emphasizes the importance of geomorphic context in applying and interpreting both annual rates of loss and the impact of specific events such as extreme weather.
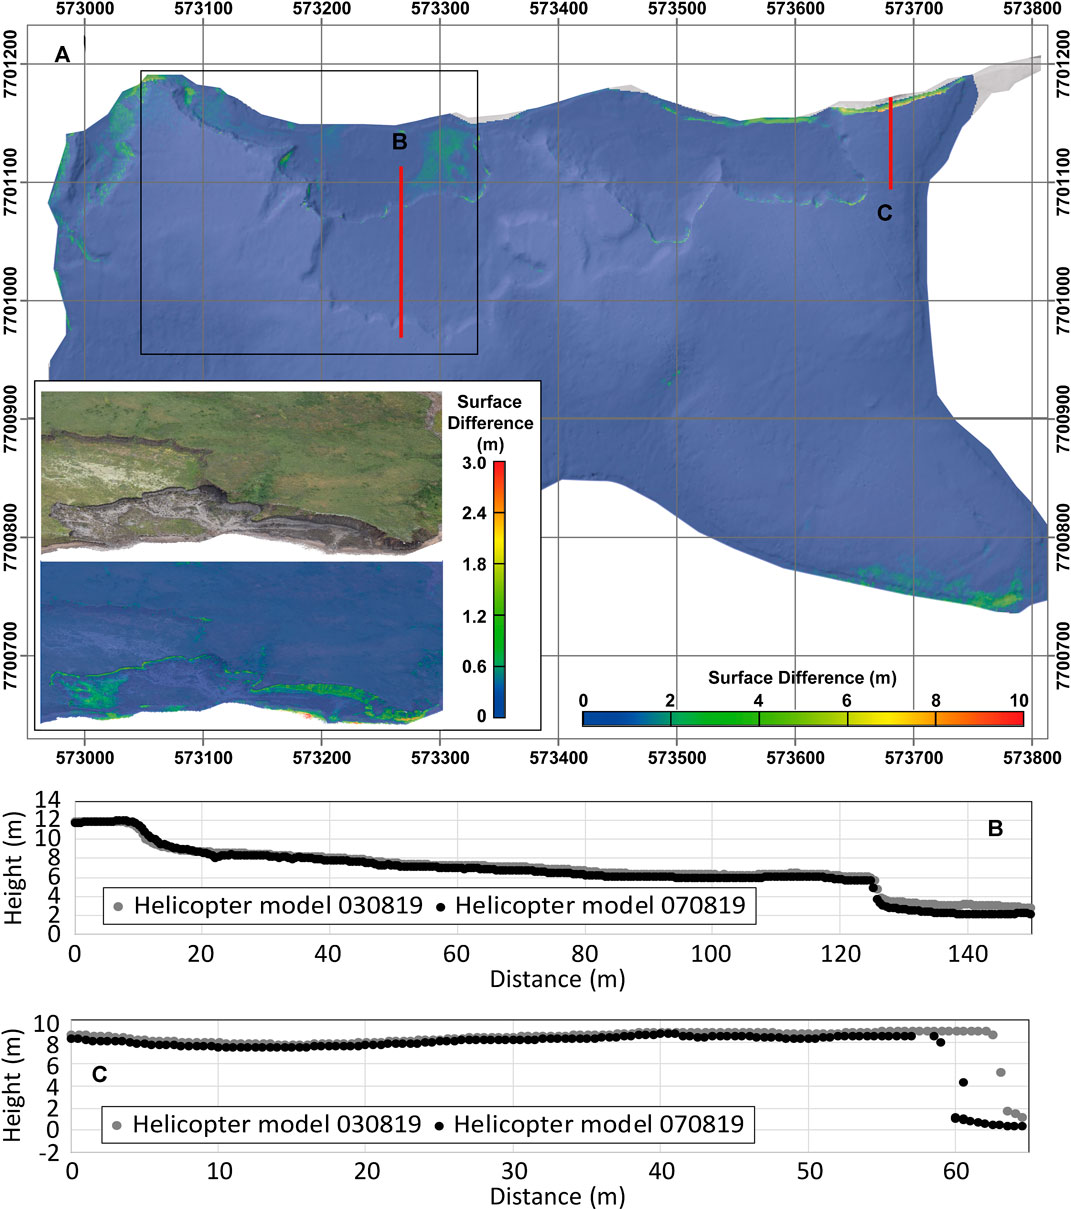
FIGURE 7. DEM differences between helicopter photogrammetric surveys before and after a storm at Peninsula Point, NWT. (A) Overview of the differences recorded across the island showing spatial distribution of change. Fine scale oblique views are inset (at a different surface difference scale for detail) and a UTM grid is overlain for scale. (B) Profile through a retrogressive thaw slump area shows erosion of the mud drape in front of the slope toe but little change elsewhere. (C) Profile through a section of sea-exposed cliff shows approximately 4 m of recession at the cliff top.
The outer islands of the MacKenzie Delta are the most exposed to storm conditions, and their responses may inform projections of future coastal dynamics elsewhere. The surveyed outer islands had varied amounts of pre-existing survey information. Pullen Island (the most exposed site) had a volumetric loss (assumed to be dominated by storm-driven responses) of 12,056 m3. The response was comparable to the storm-induced surface loss that occurred at Peninsula Point but concentrated over a shorter 525 m north-orientated coastal section (relative to 700 m of north orientated exposed coast and several raised back scarps at Peninsula Point). In common with Peninsula Point, the retrogressive thaw slumps showed minimal significant change during the storm and a dramatic impact on the sea cliff sections that receded, steepened and were undercut in places (Figure 8).
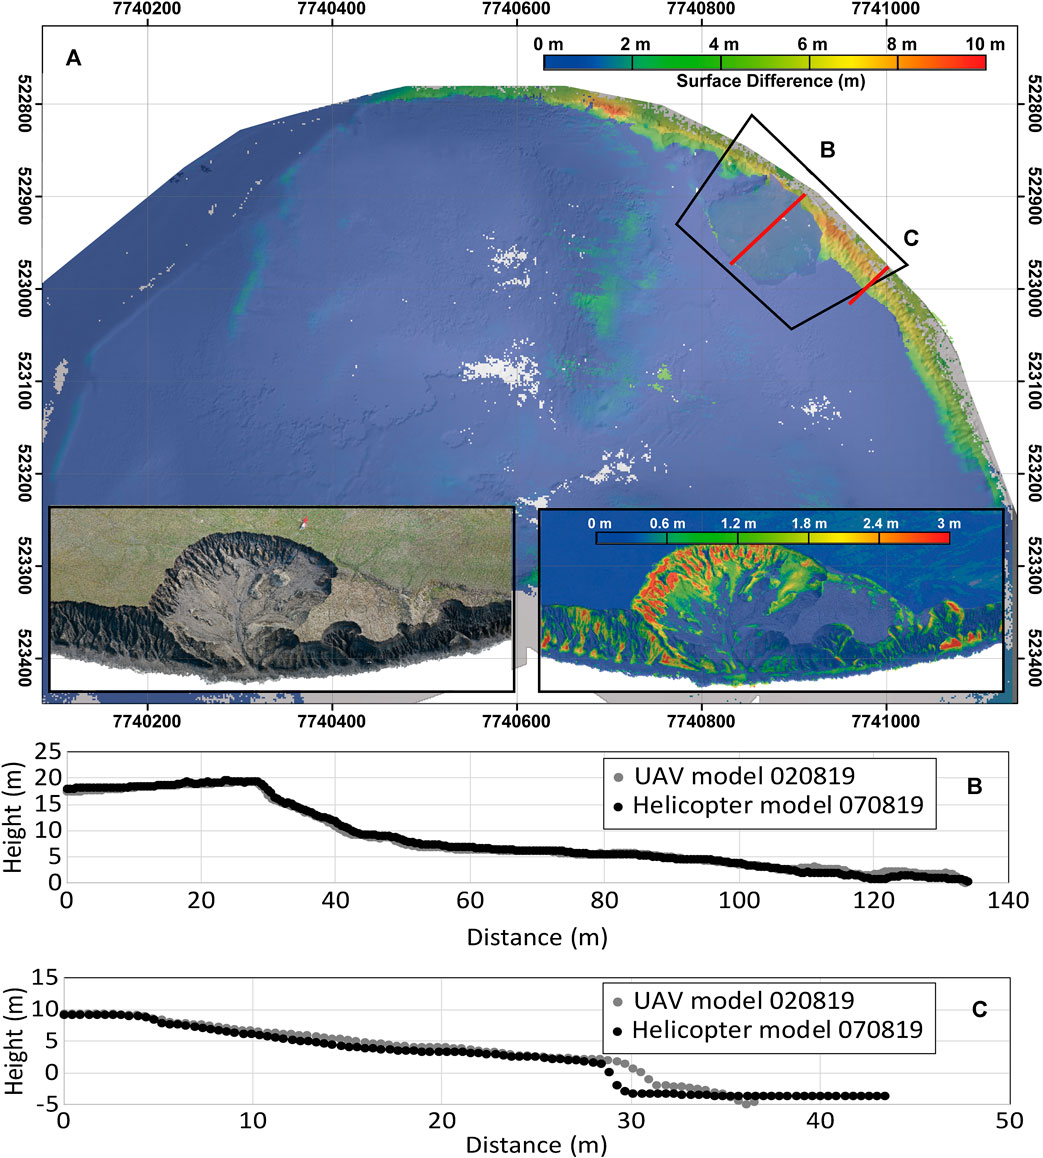
FIGURE 8. DEM surface differences between pre-storm UAV and post-storm helicopter-based photogrammetric surveys at Pullen Island, NWT. Note: the geospatial data have been rotated through 90° for presentation purposes, effectively transposing the UTM Eastings and Northings. (A) Overview of the differences recorded across the island showing spatial distribution of change and fine scale oblique views are inset (at a different surface difference scale for detail). (B) Profile through a retrogressive thaw slump area shows only minor areas of significant change. (C) Profile through a section of sea-exposed cliff shows approximately 3 m of recession at the cliff top.
At Hooper Island the pre-storm data captured the whole island but the post-storm resurvey data focused only on the coastal zone given that little detectable change was expected inland due to the lack of rainfall associated with the storm (that may trigger inland slope failures), and to simulate the most efficient survey capture method for coastal monitoring (single pass flights). Covering an area of 8.35 km2, Hooper Island (Figure 9A) is much larger than the islands at Pullen or Peninsula and recorded a storm related erosion volume of 132,385 m3 from the coastal zone. Despite the larger total eroded volume, the erosion from the storm was lower than that at Pullen when accounting for the 5.6 km stretch of north coastline over which most surface loss was concentrated; the muted response was characterized by relatively smaller losses at the base of exposed cliffs (Figure 9C). Prior to the pre-storm flight, NRCan’s 3D monitoring program had not surveyed Hooper Island before and so it is not possible to set these valuable new event-based data in a wider temporal context.
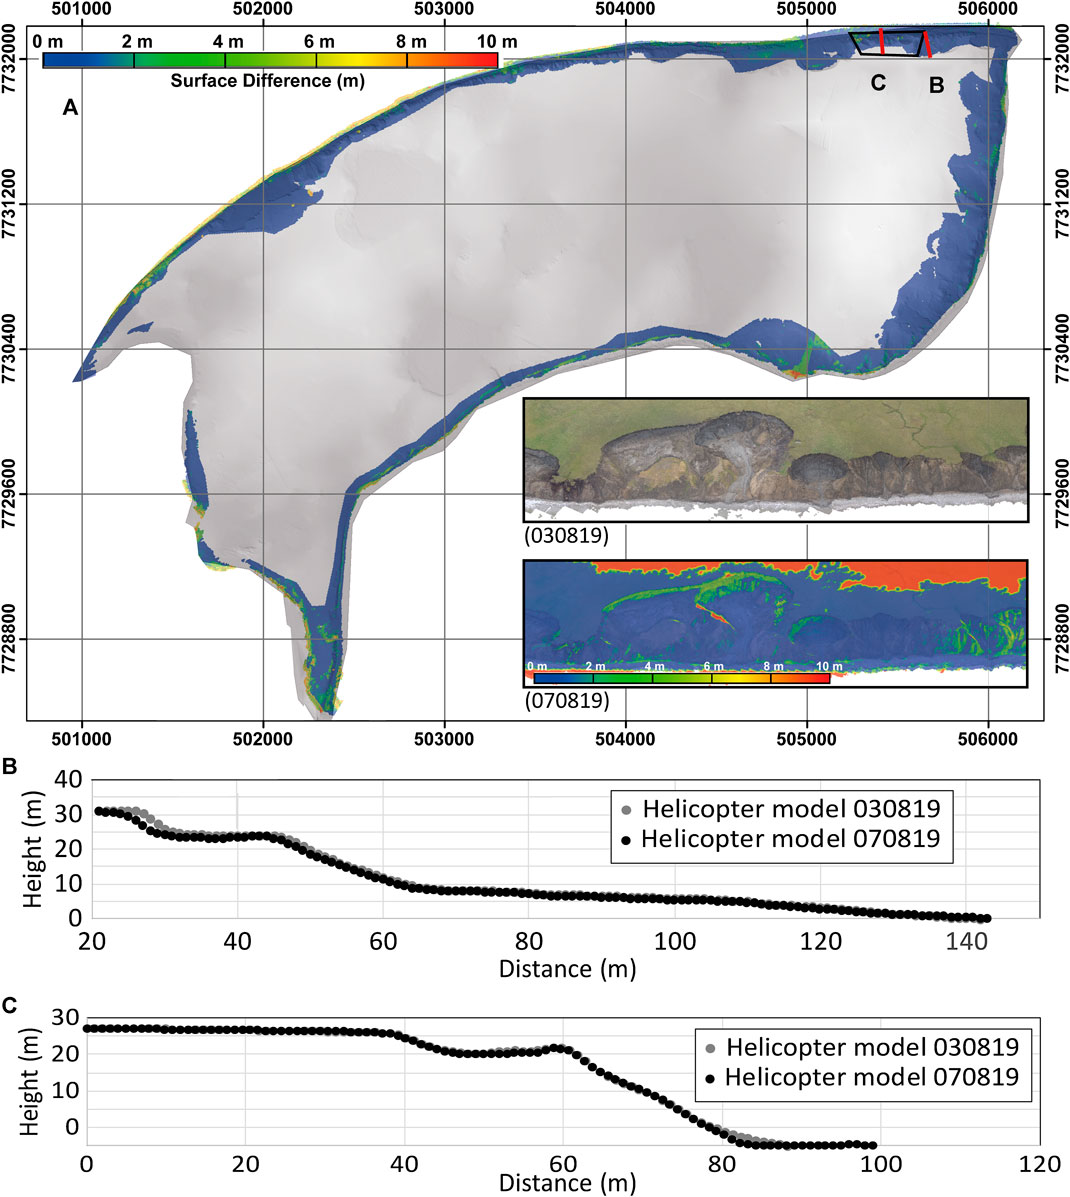
FIGURE 9. DEM surface differences between pre-storm (whole island) and post-storm (coastline) helicopter-based photogrammetric surveys at Hooper Island, NWT. (A) Overview of the differences recorded across the island showing spatial distribution of change and fine scale oblique views are inset (at a different surface difference scale for detail); note that the red upper area in the difference model is where there is no overlap between DEMs. (B) Profile through a retrogressive thaw slump area shows only minor areas of significant change. (C) Profile through a section of sea-exposed cliff shows approximately 2 m of recession at a very confine area at the base of the cliff.
The largest outer island surveyed was Pelly Island, encompassing a spatial footprint of 27.29 km2, although approximately 23% (6.14 km2) of the island is lake surface. In order to assess the ability of helicopter surveys at large scale the entire island was repeat surveyed. The storm resulted in a loss of 545,394 m3. In common with the other islands, the storm impact was concentrated on the northern shores, but due to its orientation, erosion occurred throughout the island’s 25 km coastline, particularly along its eastern flank (Figure 10). These are high-end measures of surface loss because no thresholding has been applied in order to aid comparability across sites and so there is the potential to incorporate error in addition to the genuine changes detected. However, a principle advantage of the photogrammetric process is that color orthoimages enable visual validation of detected changes if higher accuracy change detection and specific process detailing is required.
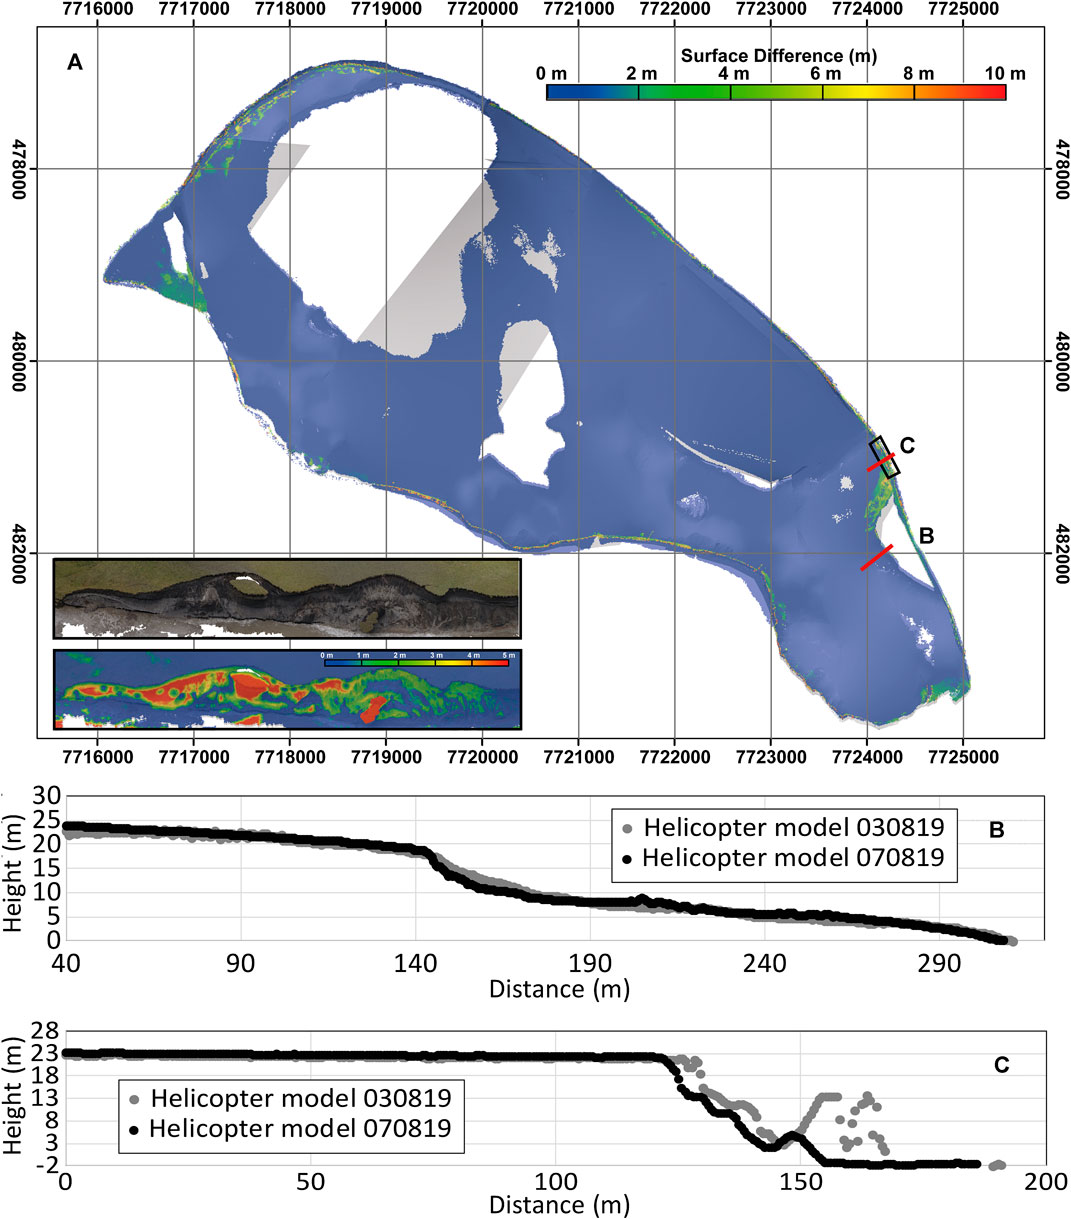
FIGURE 10. DEM surface differences between pre- and post-storm helicopter-based photogrammetric surveys at Pelly Island, NWT. Note: the geospatial data have been rotated through 90° for presentation purposes, effectively transposing the UTM Eastings and Northings. (A) Overview of the differences recorded across the island showing spatial distribution of change and fine scale oblique views are inset (at a different surface difference scale for detail). (B) Profile through a retrogressive thaw slump area shows some flattening of the coastal slope through head scarp erosion and subsidence and in filling of the mud and debris flow area. (C) Profile through a section of sea-exposed cliff shows large stacks were removed during the storm in addition to approximately 6 m of recession at the cliff top in places where large blocks collapsed.
The sea-exposed cliff faces on the northern shores were most significantly affected by the storm process conditions. When normalized by both coastline length and cliff height to produce an effective landward volumetric recession, these areas showed peak storm responses in the lower cliff top elevation sea-exposed cliffs at Peninsula Point (3.4 m) and Pullen Island (3.2 m) relative to the much taller cliff sections at Hooper Island (1.5 m) and Pelly Island (2.0 m). These values show that the variability of storm responses are not always captured well by single profiles and that higher cliffs may have potentially greater immediate resistance to storm effects but the large undercuts noted in the photogrammetry are likely to separate the cantilever collapse and true erosion response from the primary driving event.
The paucity of high-resolution (>1 m2), quantitative data on the regional variability of responses (on both annual timescales and to extreme events), has limited assessments of future climatic changes (Overduin et al., 2014). We have evaluated and then applied new helicopter-based surveys for assessing the significance of storm-related morphological change across outer islands in the Mackenzie Delta area, NWT.
The performance of helicopter-based surveys for monitoring wide-scale (>km2) coastal processes has been evaluated at a type-site for massive ground ice (Lim et al., 2020), thought to be a dominant control on coastal sensitivity to change (Farquharson et al., 2019). The resolution of the helicopter models are generally lower than that of conventional UAV survey approaches resulting from the coarser ground sample distances achieved in the raw imagery: each pixel typically represented <0.05 m in helicopter images relative to 0.01 m in the UAV derived images. There is potential for accuracy issues with continuous surveys over such large areas, but the scale and rate of Arctic coast erosion may not always warrant such high levels of precision and the accuracy of large-scale surveys has been improved by segmenting large image sequences and using ground control from both existing datasets and specially collected sparsely distributed points. Error thresholds have not been applied here but the check point assessments suggest that a conservative detection difference of 0.50 m would be achievable for responsive pre- and post-storm surveys (change detection models typically identified genuine, visually validated, differences beyond approximately 0.25 m) when no significant lighting or contrast issues have been noted. This level of detection is potentially acceptable given the dynamism of permafrost coast landscapes and the propensity for processes such as thaw-induced surface deformation, which can account for comparable or greater amounts of subsidence through the thaw season (Morse et al., 2009).
The ability to survey in high (up to 70 km h−1) wind conditions and to produce new repeat and responsive sub-meter resolution three-dimensional data at scales not previously achievable, using non-specialist equipment has demonstrable advantages. The time savings are dramatic in the field and more advanced computers have meant processing large datasets is now viable and practical. While helicopter-based platforms remain an expensive option, the cost-effectiveness per kilometer is a fraction of widely applied UAV surveys for all but the most readily accessible sites. Additionally, the survey geometry can be adapted to capture the range of environments found in permafrost coasts from continuous linear stretches of cliffs, dunes and bars to complex topographic features such as islands and pingoes. However, it is likely that this new approach for permafrost coast monitoring will be best applied in combination with more detailed UAV surveys (there were no unaccountable and therefore erroneous surface differences over the same island site, surveyed by both approaches a day apart) and will be particularly valuable in situations such as the those across the Beaufort Sea coast where helicopters already play a vital role in site accessibility. The installation of a (semi) permanent sparse network of recognisable ground control, potentially more concentrated in critical areas, could be surveyed once and then used throughout the season to generate wide coverage volumetric monitoring. Ultimately, helicopter-based photogrammetry is comparable to and complementary with the UAV surveys currently used to monitor these sites (see Figure 8). Analyzing these datasets together, potentially with new expansive satellite monitoring (e.g., Zwieback et al., 2018), improves understanding of errors within each dataset and enables a versatile and effective monitoring approach across key spatial and temporal scales.
Lengthening open water seasons have extended the exposure of Arctic coastlines to storm conditions (Stroeve et al., 2012), which may also be increasing in intensity and duration (Vermaire et al., 2013). The impacts of extreme weather events, and wider climatic patterns in the Beaufort Sea (Wood et al., 2013), are already being felt by northern communities (Pearce et al., 2010) and impacting the key species they depend upon (Scharffenberg et al., 2019). However, the geomorphic significance of storms and the spatial variability of their effects are poorly quantified across Arctic regions. The ability to generate new and responsive 3D morphological data at regional scales enables a former fragmented mosaic of detailed local studies of erosion patterns to be linked (both temporally and through more consistent resolution) and set in wider context.
Evaluating the wide-scale changes associated with a relatively long duration (15 h) storm revealed that retrogressive thaw slumps were generally much less affected (see for example Figure 9B), with most erosion concentrated on exposed cliffs within the storm-surge contact zone. Where slump material entered this zone the erosion was detectable but less than within the intact cliffs, which were deeply undercut. This is perhaps reflective of the lack of ground ice within the debris fan material (Gilbert et al., 2016) or the higher relative resistance of silty material, which was often desiccated and hard set. Additionally, lower elevation (<20 m) cliffs recorded an average recession of 3.3 m whereas higher (>20 m) cliffs receded by an average of 1.75 m but with the true response potentially lagged until undercut areas collapse. These cross-site data demonstrate both the spatial and temporal complexity of storm responses and how coastal geometry (height and orientation), material properties and failure modes all influence the sensitivity and responses of permafrost coasts. The role of intense precipitation events has also been demonstrated in coarse (30 m pixel) but expansive (5,000 km2) and frequent (11 days) elevation change monitoring using satellite interferometry (Zwieback et al., 2018). The ability to quantify distinct geomorphic responses due to specific local controls (Lim et al., 2020), during specific events as we show here, or across sub-seasonal timescales (Zwieback et al., 2018) has the potential to provide a more detailed appreciation of permafrost landscapes.
At Peninsula Point the exposed coast is dominated by retrogressive thaw complexes bordered by shorter sections of coastal cliffs. Canadian Global Coupled Model ensembles have determined that air temperatures in the region have risen by approximately 4°C between 1960 and 2020 (Manson and Solomon, 2007) and historic patterns of retreat at the site show a progressive shift from a convex cross shore profile to generally flat shoreline from 1935 to 1989 (Mackay and Dallimore, 1992). That morphology has since been maintained at a relatively consistent rate of approximately 3.5 m a−1. Therefore, the first significant storm (>36 km h−1 for longer than 10 h, adjusted from Scharffenberg et al., 2019) event during the 2019 open water season directly resulted in a cliff line step-back comparable to the long-term mean annual rates (although some areas receded landwards by up to 8 m between 2018 and 2019 summers). Furthermore, an average of 2.2 m cliff retreat across the most exposed sections of the MacKenzie Delta outer islands during the storm represents a key geomorphic event that impacted multiple sites. This agency has the potential to cause fundamental shifts in long-term erosion rates if projected and currently monitored increases in storminess and open water seasons continue (Manson and Solomon, 2007). However, in this morpho-climatic context, it should also be noted that more sheltered coastal sections recorded no detectable change in places.
It is evident that true morphodynamic responses to both short-term extreme events and potentially longer-term climatic signals rely on the ability to detail surface differences consistently and across wide scales in a practical manner. Tailored helicopter-based photogrammetric surveys provide a systematic, responsive and potentially cost-effective and accessible approach to achieve wide-scale topographic monitoring in order to more adequately understand the regional responses to specific weather events. This approach has direct implications for assessing the immediate and short-term impacts of storms in terms of erosion volumes, infrastructure damage, and the release of significant material such as carbon bearing layers or contaminants (Fritz et al., 2017), and if applied routinely may help address questions of the spatial variability that cannot be resolved by long-term observations (Obu et al., 2017). In particular, the complex sensitivities of block failures from permafrost cliffs of different sizes (Hoque and Pollard, 2016) and potentially increasing effects of retrogressive thaw slumps (Ward Jones et al., 2019) need to be accounted for to improve projections and models of future Arctic coastal behavior.
In the context of concerns regarding heightened storm intensity (Small et al., 2011), increased open water seasons (Stroeve et al., 2012) and accelerated erosion of permafrost coasts across the Arctic (Radosavljevic et al., 2016), here we have evaluated the use of helicopter-based photogrammetric surveys to quantify volumetric changes for both regular and responsive monitoring purposes. Constrained by the use of standard camera equipment for data collection, the savings in terms of time (97–99% quicker per km) and cost efficiency (58–98% cheaper per km) are potentially large when assessing sites that are large and not easily accessible. However, the most significant contribution of this approach will be new data and an improved understanding of high resolution permafrost coast responses at much larger scales than has previously been possible. Applying the approach to a 150 km transect of sites (including new sites, not preciously surveyed by NRC and UAV monitoring) before and after a storm event, in conditions not suitable for standard UAV surveys has detailed and quantified key coastal responses. Erosion was concentrated on the exposed north orientated coastlines, and particularly on the permafrost and ground ice cliff sections. The storm accounted for over a quarter of the annual total volumetric surface losses at a type-site for massive ice, and the coastal cliff areas receded at amounts comparable to typical annual retreat rate in places. There was a consistently greater immediate volumetric response in low (<20 m) relative to high (>20 m) elevation cliffs, but further monitoring would be required to assess the long-term impacts when deep undercuts finally result in cantilever collapse (Hoque and Pollard, 2016). Retrogressive thaw slumps were much less affected, perhaps due to the lack of high intensity rain associated with the storm, and these data indicate that where debris flow material had solidified within the coastal zone the erosion volumes were relatively less than those of intact permafrost cliff material. The need for detailed observations such as these and the potential for retrogressive thaw slumps to become decoupled from environmental drivers has been noted elsewhere (Zwieback et al., 2018; Ward Jones et al., 2019). Therefore, quantifying the geomorphic agency of both annual and extreme weather events at wider, more representative scales provides a more holistic and consistent approach to assessing current and future changes to Arctic coastlines.
The data supporting the conclusions of this manuscript but not presented above will be made available by the authors to any qualified researcher. These data include the raw images, storm meteorological conditions or digital elevation models.
ML, PM, CI, CC, and JW planned, collected and processed the helicopter-based surveys and ML wrote the manuscript and DW, PF, and JW reviewed it. DW, PF, HB, and CI conducted and processed the UAV surveys.
The authors declare that the research was conducted in the absence of any commercial or financial relationships that could be construed as a potential conflict of interest.
The authors thank and acknowledge the support of the NERC Arctic office UK-Canada Bursary scheme and Polar Continental Shelf Program for helicopter survey support, without which this research would not have been possible. This work was supported by the Natural Resources Canada’s Climate Change Geoscience program and is linked to and received funds from the Beaufort Sea Regional Strategic Environmental Assessment (BRSEA) and Climate Change Preparedness in the North Fund (CCPN) both of Indigenous and Northern Affairs Canada.
We particularly thank and acknowledge the Inuvik and Tuktoyaktuk Hunters and Trappers Committee, the Hamlet of Tuktoyaktuk and members of the Tuktoyaktuk Climate Change Resilience Project who have actively supported this work. We owe our gratitude to Parks Canada who have granted unprecedented access to the Pingo Canadian Landmark, within which a large portion of the study takes place and thank the editor and reviewers for their insightful comments.
Alvarez, J., Yumashev, D., and Whiteman, G. (2020). A framework for assessing the economic impacts of Arctic change. Ambio 49 (2), 407–418. doi:10.1007/s13280-019-01211-z
Bonsal, B. R., and Kochtubajda, B. (2009). An assessment of present and future climate in the Mackenzie Delta and the near-shore Beaufort Sea region of Canada. Int. J. Climatol. 29 (12), 1780–1795. doi:10.1002/joc.1812
Burn, C. R., and Kokelj, S. V. (2009). The environment and permafrost of the Mackenzie Delta area. Permafr. Periglac. Process. 20 (2), 83–105. doi:10.1002/ppp.655
Cunliffe, A., Tanski, G., Radosavljević, B., Palmer, W., Sachs, T., Lantuit, H., et al. (2019). Rapid retreat of permafrost coastline observed with aerial drone photogrammetry. The Cryosphere 13, 1513–1528.
Dean, K. G., Stringer, W. J., Ahlnäs, K., Searcy, C., and Weingartner, T. (1994). The influence of river discharge on the thawing of sea ice, Mackenzie River Delta: albedo and temperature analyses. Polar Res. 13 (1), 83–94. doi:10.1111/j.1751-8369.1994.tb00439.x
Dietrich, J. T. (2016). Riverscape mapping with helicopter-based structure-from-motion photogrammetry. Geomorphology 252, 144–157. doi:10.1016/j.geomorph.2015.05.008
Farquharson, L. M., Romanovsky, V. E., Cable, W. L., Walker, D. A., Kokelj, S. V., and Nicolsky, D. (2019). Climate change drives widespread and rapid thermokarst development in very cold permafrost in the Canadian high arctic. Geophys. Res. Lett. 46 (12), 6681–6689. doi:10.1029/2019gl082187
Forbes, D. L., Solomon, S. M., and Frobel, D. (1995). Report of the 1992 coastal surveys in the Beaufort Sea. Geol. Survey Canada Open File. 3053, 53. doi:10.4095/203482
Fritz, M., Vonk, J. E., and Lantuit, H. (2017). Collapsing Arctic coastlines. Nat. Clim. Change. 7 (1), 6–7. doi:10.1038/nclimate3188
Günther, F., Overduin, P., Sandakov, A., Grosse, G., and Grigoriev, M. (2013). Short- and long-term thermo-erosion of ice-rich permafrost coasts in the Laptev Sea region. Biogeosciences 10, 4297–4318. doi:10.5194/bg-10-4297-2013
Gilbert, G. L., Kanevskiy, M., and Murton, J. B. (2016). Recent advances (2008-2015) in the study of ground ice and cryostratigraphy. Permafr. Periglac. Process. 27 (4), 377–389. doi:10.1002/ppp.1912
Goñi, M. A., Yunker, M. B., Macdonald, R. W., and Eglinton, T. I. (2000). Distribution and sources of organic biomarkers in arctic sediments from the Mackenzie River and Beaufort Shelf. Mar. Chem. 71 (1), 23–51. doi:10.1016/s0304-4203(00)00037-2
Grosse, G., Goetz, S., McGuire, A. D., Romanovsky, V. E., and Schuur, E. A. G. (2016). Changing permafrost in a warming world and feedbacks to the Earth system. Environ. Res. Lett. 11 (4), 040201. doi:10.1088/1748-9326/11/4/040201
Hoque, M. A., and Pollard, W. H. (2016). Stability of permafrost dominated coastal cliffs in the Arctic. Polar Sci. 10 (1), 79–88. doi:10.1016/j.polar.2015.10.004
Irrgang, A. M., Lantuit, H., Gordon, R. R., Piskor, A., and Manson, G. K. (2019). Impacts of past and future coastal changes on the Yukon coast—threats for cultural sites, infrastructure, and travel routes. Arct. Sci. 5 (2), 107–126. doi:10.1139/as-2017-0041
Irrgang, A. M., Lantuit, H., Manson, G. K., Günther, F., Grosse, G., and Overduin, P. P. (2018). Variability in rates of coastal change along the Yukon coast, 1951 to 2015. J. Geophys. Res. Earth Surf. 123 (4), 779–800. doi:10.1002/2017jf004326
Lantuit, H., Overduin, P. P., Couture, N., Wetterich, S., Aré, F., Atkinson, D., et al. (2012). The Arctic coastal dynamics database: a new classification scheme and statistics on Arctic permafrost coastlines. Estuar. Coast. 35 (2), 383–400. doi:10.1007/s12237-010-9362-6
Lesack, L. F. W., and Marsh, P. (2007). Lengthening plus shortening of river-to-lake connection times in the Mackenzie River Delta respectively via two global change mechanisms along the arctic coast. Geophys. Res. Lett. 34 (23), L23404. doi:10.1029/2007gl031656
Lesack, L. F. W., and Marsh, P. (2010). River-to-lake connectivities, water renewal, and aquatic habitat diversity in the Mackenzie River Delta. Water Resour. Res. 46 (12), 1–16. doi:10.1029/2010wr009607
Lim, M., Whalen, D., Martin, J., Mann, P. J., Hayes, S., Fraser, P., et al. (2020). Massive ice control on permafrost coast erosion and sensitivity. Geophys. Res. Lett. 47 (17), e2020GL087917. doi:10.1029/2020gl087917
Liu, L., Schaefer, K. M., Chen, A. C., Gusmeroli, A., Zebker, H. A., and Zhang, T. (2015). Remote sensing measurements of thermokarst subsidence using InSAR. J. Geophys. Res. Earth Surf. 120 (9), 1935–1948. doi:10.1002/2015jf003599
Mackay, J. R., and Dallimore, S. R. (1992). Massive ice of the Tuktoyaktuk area, western Arctic coast, Canada. Can. J. Earth Sci. 29 (6), 1235–1249. doi:10.1139/e92-099
Manson, G. K., and Solomon, S. M. (2007). Past and future forcing of Beaufort Sea coastal change. Atmos. Ocean. 45 (2), 107–122. doi:10.3137/ao.450204
Maslakov, A., and Kraev, G. (2016). Erodibility of permafrost exposures in the coasts of Eastern Chukotka. Polar Sci. 10 (3), 374–381. doi:10.1016/j.polar.2016.04.009
Morse, P. D., Burn, C. R., and Kokelj, S. V. (2009). Near-surface ground-ice distribution, Kendall Island Bird Sanctuary, western Arctic coast, Canada. Permafr. Periglac. Process. 20 (2), 155–171. doi:10.1002/ppp.650
Neri, M., De Maio, M., Crepaldi, S., Suozzi, E., Lavy, M., Marchionatti, F., et al. (2017). Topographic maps of Mount Etna’s Summit Craters, updated to December 2015. J. Maps. 13 (2), 674–683. doi:10.1080/17445647.2017.1352041
Nielsen, D. M., Dobrynin, M., Baehr, J., Razumov, S., and Grigoriev, M. (2020). Coastal erosion variability at the southern Laptev sea linked to winter sea ice and the Arctic oscillation. Geophys. Res. Lett. 47 (5), e2019GL086876. doi:10.1029/2019gl086876
Nitze, I., and Grosse, G. (2016). Detection of landscape dynamics in the Arctic Lena Delta with temporally dense Landsat time-series stacks. Remote Sens. Environ. 181, 27–41. doi:10.1016/j.rse.2016.03.038
Novikova, A., Belova, N., Baranskaya, A., Aleksyutina, D., Maslakov, A., Zelenin, E., et al. (2018). Dynamics of Permafrost coasts of Baydaratskaya bay (Kara sea) based on multi-temporal remote sensing data. Rem. Sens. 10 (9), 1481. doi:10.3390/rs10091481
O’Neill, H. B., Smith, S. L., and Duchesne, C. (2019). Long-term permafrost degradation and thermokarst subsidence in the Mackenzie delta area indicated by thaw tube measurements. Cold Regions Eng. 2019, 643–651. doi:10.1061/9780784482599.074
O’Rourke, M. J. E. (2017). Archaeological site vulnerability modelling: the influence of high impact storm events on models of shoreline erosion in the western Canadian Arctic. Open Archaeol. 3 (1), 1–16. doi:10.1515/opar-2017-0001
Obu, J., Lantuit, H., Fritz, M., Pollard, W. H., Sachs, T., and Günther, F. (2016). Relation between planimetric and volumetric measurements of permafrost coast erosion: a case study from Herschel Island, western Canadian Arctic. Polar Res. 35 (1), 30313. doi:10.3402/polar.v35.30313
Obu, J., Lantuit, H., Grosse, G., Günther, F., Sachs, T., Helm, V., et al. (2017). Coastal erosion and mass wasting along the Canadian Beaufort Sea based on annual airborne LiDAR elevation data. Geomorphology 293, 331–346. doi:10.1016/j.geomorph.2016.02.014
Overduin, P. P., Strzelecki, M. C, Grigoriev, M. N, Couture, N., Lantuit, H., St‐Hilaire‐Gravel, D., et al. Geological Society, London, Special Publications 388, 103–129, 12 February 2014, doi:10.1144/SP388.13.
Overduin, P. P., Wetterich, S., Günther, F., Grigoriev, M. N., Grosse, G., Schirrmeister, L., et al. (2016). Coastal dynamics and submarine permafrost in shallow water of the central Laptev Sea, East Siberia. Cryosphere 10 (4), 1449–1462. doi:10.5194/tc-10-1449-2016
Pearce, T., Smit, B., Duerden, F., Ford, J. D., Goose, A., and Kataoyak, F. (2010). Inuit vulnerability and adaptive capacity to climate change in Ulukhaktok, Northwest Territories, Canada. Polar Record. 46 (2), 157–177. doi:10.1017/s0032247409008602
Pisaric, M. F. J., Thienpont, J. R., Kokelj, S. V., Nesbitt, H., Lantz, T. C., Solomon, S., et al. (2011). Impacts of a recent storm surge on an Arctic delta ecosystem examined in the context of the last millennium. Proc. Natl. Acad. Sci. U.S.A. 108 (22), 8960–8965. doi:10.1073/pnas.1018527108
Rachold, V., Grigoriev, M. N., Are, F. E., Solomon, S., Reimnitz, E., Kassens, H., et al. (2000). Coastal erosion vs riverine sediment discharge in the Arctic Shelf seas. Int. J. Earth Sci. 89 (3), 450–460. doi:10.1007/s005310000113
Radosavljevic, B., Lantuit, H., Pollard, W., Overduin, P., Couture, N., Sachs, T., et al. (2016). Erosion and flooding-threats to coastal infrastructure in the Arctic: a case study from Herschel island, Yukon territory, Canada. Estuar. Coast. 39 (4), 900–915. doi:10.1007/s12237-015-0046-0
Rowland, J., and Coon, E. (2015). From documentation to prediction: raising the bar for thermokarst research. Hydrogeol. J. 24, 645–648. doi:10.1007/s10040-015-1331-5
Scharffenberg, K. C., Whalen, D., MacPhee, S. A., Marcoux, M., Iacozza, J., Davoren, G., et al. (2019). Oceanographic, ecological, and socio-economic impacts of an unusual summer storm in the Mackenzie Estuary. Arct. Sci. 6 (2), 62–76. doi:10.1139/as-2018-0029
Small, D., Atallah, E., and Gyakum, J. (2011). Wind regimes along the Beaufort Sea coast favorable for strong wind events at Tuktoyaktuk. J Appl. Meteorol. Climatol. 50 (6), 1291–1306. doi:10.1175/2010jamc2606.1
Solomon, S. M., Forbes, D. L., and Kierstead, B. (1994). Coastal impacts of climate change: Beaufort Sea erosion study. Geol. Survey Canada Open File. 2890, 85. doi:10.4095/194148
Solomon, S. M. (2005). Spatial and temporal variability of shoreline change in the Beaufort-Mackenzie region, northwest territories, Canada. Geo Mar. Lett. 25 (2), 127–137. doi:10.1007/s00367-004-0194-x
Stroeve, J. C., Serreze, M. C., Holland, M. M., Kay, J. E., Malanik, J., and Barrett, A. P. (2012). The Arctic’s rapidly shrinking sea ice cover: a research synthesis. Clim. Change. 110 (3), 1005–1027. doi:10.1007/s10584-011-0101-1
Van der Sluijs, J., Kokelj, S., Fraser, R., Tunnicliffe, J., and Lacelle, D. (2018). Permafrost terrain dynamics and infrastructure impacts revealed by UAV photogrammetry and thermal imaging. Rem. Sens. 10 (11), 1734. doi:10.3390/rs10111734
Verhoeven, G. (2011). Taking computer vision aloft - archaeological three-dimensional reconstructions from aerial photographs with photoscan. Archaeol. Prospect. 18 (1), 67–73. doi:10.1002/arp.399
Vermaire, J. C., Pisaric, M. F. J., Thienpont, J. R., Courtney Mustaphi, C. J., Kokelj, S. V., and Smol, J. P. (2013). Arctic climate warming and sea ice declines lead to increased storm surge activity. Geophys. Res. Lett. 40 (7), 1386–1390. doi:10.1002/grl.50191
Ward Jones, M. K., Pollard, W. H., and Jones, B. M. (2019). Rapid initialization of retrogressive thaw slumps in the Canadian high Arctic and their response to climate and terrain factors. Environ. Res. Lett. 14 (5), 055006. doi:10.1088/1748-9326/ab12fd
Warren, J. A., Berner, J. E., and Curtis, T. (2005). Climate change and human health: infrastructure impacts to small remote communities in the north. Int. J. Circumpolar Health. 64 (5), 487–497. doi:10.3402/ijch.v64i5.18030
Waugh, D., Pearce, T., Ostertag, S. K., Pokiak, V., Collings, P., and Loseto, L. L. (2018). Inuvialuit traditional ecological knowledge of beluga whale (Delphinapterus leucas) under changing climatic conditions in Tuktoyaktuk, NT. Arct. Sci. 4 (3), 242–258.
Wobus, C., Anderson, R., Overeem, I., Matell, N., Clow, G., and Urban, F. (2011). Thermal erosion of a permafrost coastline: improving process-based models using time-lapse photography. Arctic Antarct. Alpine Res. 43 (3), 474–484. doi:10.1657/1938-4246-43.3.474
Wood, K. R., Overland, J. E., Salo, S. A., Bond, N. A., Williams, W. J., and Dong, X. (2013). Is there a “new normal” climate in the Beaufort Sea? Polar Res. 32 (1), 19552. doi:10.3402/polar.v32i0.19552
Keywords: arctic storms, permafrost coasts, volumetric erosion monitoring, photogrammetric surveys, regional scale impacts, arctic community resilience
Citation: Lim M, Whalen D, J. Mann P, Fraser P, Berry HB, Irish C, Cockney K and Woodward J (2020) Effective Monitoring of Permafrost Coast Erosion: Wide-scale Storm Impacts on Outer Islands in the Mackenzie Delta Area. Front. Earth Sci. 8:561322. doi: 10.3389/feart.2020.561322
Received: 13 May 2020; Accepted: 16 September 2020;
Published: 08 October 2020.
Edited by:
Davide Tiranti, Agenzia Regionale per la Protezione Ambientale (ARPA), ItalyReviewed by:
Fabio Matano, National Research Council (CNR), ItalyCopyright © 2020 Lim, Whalen, Mann, Fraser, Berry, Irish, Cockney and Woodward. This is an open-access article distributed under the terms of the Creative Commons Attribution License (CC BY). The use, distribution or reproduction in other forums is permitted, provided the original author(s) and the copyright owner(s) are credited and that the original publication in this journal is cited, in accordance with accepted academic practice. No use, distribution or reproduction is permitted which does not comply with these terms.
*Correspondence: Michael Lim, bWljaGFlbC5saW1Abm9ydGh1bWJyaWEuYWMudWs=
Disclaimer: All claims expressed in this article are solely those of the authors and do not necessarily represent those of their affiliated organizations, or those of the publisher, the editors and the reviewers. Any product that may be evaluated in this article or claim that may be made by its manufacturer is not guaranteed or endorsed by the publisher.
Research integrity at Frontiers
Learn more about the work of our research integrity team to safeguard the quality of each article we publish.