
94% of researchers rate our articles as excellent or good
Learn more about the work of our research integrity team to safeguard the quality of each article we publish.
Find out more
ORIGINAL RESEARCH article
Front. Earth Sci. , 20 November 2020
Sec. Structural Geology and Tectonics
Volume 8 - 2020 | https://doi.org/10.3389/feart.2020.550851
This article is part of the Research Topic Unveiling Active Faults: Multiscale Perspectives and Alternative Approaches Addressing the Seismic Hazard Challenge View all 17 articles
 C. Pirrotta1*
 M. S. Barbano1,2
This study deals with the earthquakes which occurred in southeastern Sicily in 1693 (January 9 and 11, Mw ≈ 6.1 and 7.3, respectively). Although they have been largely studied, robust and commonly accepted seismic sources are still missing. We performed a revision of the 1693 macroseismic data and, for the fore and main-shocks, modeled new NNE-SSW trending seismic sources. In the Hyblean Plateau area, we carried out an analysis of DEM and aerial photos to map tectonic features. Then, we performed field surveys on the main faults, and a morphotectonic study with the aim of characterizing the activity of mapped faults. The study revealed the presence of three main fault systems. The first is the Palazzolo-Villasmundo Fault System, composed of NNE-SSW and NE-SW trending north-west-dipping normal faults. Some of these faults could be reactivated as reverse faults. The second is the Augusta-Floridia Fault System, made of NNW-SSE and NW-SE normal faults. The third is composed of faults which have never been mapped before: the Canicattini-Villasmundo Fault System that shows both a segmented and stepping pattern, almost N-S trending and west-dipping normal faults; some of these faults show a left-lateral movement. The morphotectonic study demonstrated that the fault systems are active. Furthermore, both strike and kinematics of the studied faults well match with the regional stress field characterized by a NW-SE σ1, which in the study area is probably both affecting some pre-existing faults, the Palazzolo-Villasmundo and the Augusta-Floridia Fault Systems, and causing the formation of new faults, the Canicattini-Villasmundo Fault System. The latter system lies across the Hyblean Plateau with a total length of 35 km and, due to its aligned segmented pattern, it can be the surface expression of a master fault that seems dividing the Hyblean Plateau in two blocks. Moreover, the Canicattini-Villasmundo Fault System well fits the southern part of the 1693 revaluated seismic sources and matches with a current alignment of shocks mainly characterized by left-lateral focal mechanisms on almost N-S fault planes. Considering the possible rupture length in depth, it could manage to release Mw ≈ 7.1 earthquakes, representing a valuable candidate source for the 1693 earthquakes.
• The reappraisal of the southern Sicily 1693 mainshocks allowed obtaining two almost N-S trending, seismic sources.
• Fault mapping and morphotectonic analysis reveal a complex fault belt. Among these, a segmented N-S trending fault system (the Canicattini Villasmundo Fault System) could be a unique main fault, whose length in depth could reach about 35 km.
• The Canicattini Villasmundo Fault System well matches with part of the almost N-S trending seismic sources modeled for the 1693 earthquakes, representing a valuable candidate for these earthquakes.
• Geometry and kinematics of this system are compatible with SE Sicily instrumental seismicity and support the hypothesis of the Hyblean Plateau indenter segmentation.
South-eastern Sicily was affected by some of the strongest earthquakes of the Italian history such as the 1169, 1542 and 1693, 1818 events, with epicentral intensity (Io) up to 11 (MCS) and equivalent moment magnitude up to Mw 7.3 (Rovida et al., 2019).
This study deals with the foreshock-mainshock pair of the 1693 seismic sequence, which began on January 9 with a strong foreshock (Mw ≈ 6.1), culminated with the catastrophic January 11, 1693 event (Mw ≈ 7.3) and continued for more than 2 years (e.g. Boccone, 1697). The extent of the damaged area, the great number of victims (more than 60,000), and the numerous coseismic effects make the 1693 mainshock one of the most destructive seismic events in the Italian seismic history. It was felt as far as northern Calabria and along the Africa coast (Guidoboni et al., 2018). The mainshock generated also a strong tsunami that hit the Ionian coast of Sicily, from Messina Strait to the southern coast of Sicily and, according to some coeval sources, reached the Maltese Islands (De Soldanis, 1746) (Figure 1).
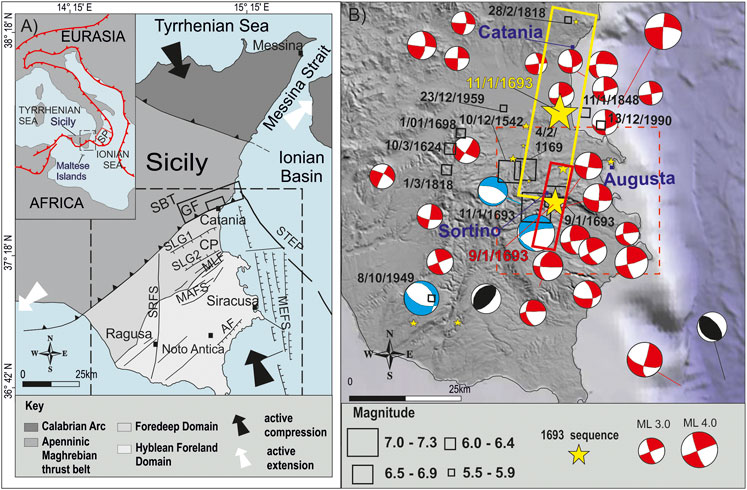
FIGURE 1. (A) Eastern Sicily: principal geodynamic sectors, main stress axes (from Musumeci et al., 2014), and the main regional faults proposed as seismogenic fault of the 1693 earthquakes (DISS Working Group, 2018). SP = Subduction Plane (Gutscher et al., 2006), see the inset of (A); MEFS = Malta Escarpment Fault System (Piatanesi and Tinti, 1998; Azzaro and Barbano, 2000; Jacques et al., 2001; Argnani and Bonazzi, 2005); SRFS = Scicli-Ragusa Fault System (Sirovich and Pettenati, 2001; DISS Working Group, 2018); AF = Avola Fault (Bianca et al., 1999); SLGF1 and SLGF2 = Scordia-Lentini Graben Faults (D’Addezio and Valensise, 1991); GF = Gravina Fault (DISS Working Group, 2018); MLF = Monte Lauro Fault (DISS Working Group, 2018), which corresponds to MAFS = Monterosso-Agnone Fault System; SBT = Sicilian Basal Thrust (Lavecchia et al., 2007; DISS Working Group, 2018); STEP = Slab Transfer Edge Propagator fault system (Polonia et al., 2012); CP is the Catania Plain. Dashed square shows location of (B). (B) Southeastern Sicily DEM; black squares are the epicentres of the strongest historical earthquakes (from 1169 to 2015, after Rovida et al., 2019); focal mechanisms (balloons) for earthquakes with ML = 3.0 ML = 4.0 occurred from 1999 to 2011 (after Scarfì et al., 2013). Focal plane solution classification: red, strike-lateral fault; blue, normal fault; black, reverse fault. Yellow stars are the re-localized epicentres of the 1693 seismic sequence shocks; red and yellow rectangles are the new sources obtained by this work using the boxer method (Gasperini et al., 1999) employing the data of Figure 4 (see chapter 3). Red dashed square is the location of Figure 2.
Despite the catastrophic consequence and the extensive environmental effects, the causative source/s of these earthquakes is/are still matter of debate for several aspects, such as: 1) the occurrence of multiple shocks, which complicated the macroseismic field; 2) the proximity of the maximum damaged area to the coast; 3) the tsunami following the mainshock, suggesting that the earthquake source was located near or off-shore; 4) the lack in the contemporary sources of unequivocal description of surface ruptures; 5) the difficulty of identifying recent displacement in the mesoseismal area due to the limited outcrops of Quaternary deposits; 6) in the area of maximum effects, the lack of a continuous single fault trace long enough to produce an earthquake of M ≈ 7 (Surface Rupture Length 40–60 km according to empirical fault-scaling relationships, e.g. Wells and Coppersmith, 1994).
A number of geological, structural, seismological, geodetic studies, dealing with the seismotectonics of the region, tried to associate the 1693 seismic sequence to some of the kilometric faults cropping out in eastern Sicily (see Figure 1 and Supplementary Table S1 for the main seismic sources associated with the 1693 earthquakes). Based on the occurrence of a large tsunami that hit the coast of Eastern Sicily, the source of the January 11, 1693 earthquake is supposed to be located offshore. For some Authors it is the Malta Escarpment (MEFS in Figure 1A) (e.g., Bianca et al., 1999; Azzaro and Barbano 2000; Argnani and Bonazzi, 2005); for others either a portion of the Ionian subduction plane (SP in the inset of Figure 1A) (e.g., Gutscher et al., 2006) or a STEP fault (STEP in Figure 1A) (Polonia et al., 2012). The main question on these possible locations regards the discrepancy between the offshore source and the damage distribution, with the highest intensities mainly located inland and decreasing toward the coast. Furthermore, a seismic source located offshore should be capable to generate a magnitude eight earthquake, to cause damage such as those occurred in eastern Sicily in 1693 (e.g., Sirovich and Pettenati, 2001; Gutscher et al., 2006). According to structural and seismological data, some source models are located inland (Figure 1A) (e.g., Sirovich and Pettenati, 2001; Lavecchia et al., 2007). In this case, the tsunami could have been caused by earthquake-triggered submarine landslides off the Augusta shoreline (e.g., Billi et al., 2010; Tonini et al., 2011; Paparo et al., 2017). However, none of the faults proposed in literature well fits the location, extension, geometry, and kinematics of the seismic sources obtained by modeling the macroseismic field of these events and the distribution of the seismically induced geological effects (e.g., Barbano and Rigano, 2001; Sirovich and Pettenati, 2001; Visini et al., 2009). For example, the Scicli-Ragusa Fault System (SRFS in Figure 1A) is located several kilometres away from the area of maximum effects. Moreover, the DISS Working Group (2018) suggests the existence of two seismic sources, the Gravina Fault and the Monte Lauro Fault (GF and MLF in Figure 1A) to the north and to the south, the Scordia-Lentini Graben (SLGF1 and SLGF2 in Figure 1A), based on the two main clusters of the largest intensities of the 1693 mainshock and the lack of data points at the Catania Plain (see chapter 3). This area was uninhabited in 1693, because it was unhealthy and affected by a very hot weather, and it was reclaimed in the 1930s. As a result, today it hosts only cultivated fields and citrus groves. Therefore, the two main clusters of the largest intensities of the 1693 earthquake, as supposed by DISS Working Group (2018), is due to the two populated areas providing records.
By a revision of the macroseismic data of the 1693 shocks and the detailed relocation of the coseismic environmental effects, we obtained two new seismic sources extending from the northern part of the Hyblean Plateau northward up to the Catania Plain. Then, we performed a morphotectonic mapping through DEM and aerial photos analyses in the northern part of the Hyblean Plateau. A geological survey along the most relevant faults allowed us to define the possible fault geometry and to roughly estimate the related slip-rates. Then, in this area, we carried out both qualitative geomorphological and morphometric (quantitative geomorphological) investigations to highlight possible recent activity of the mapped faults. In detail, we analyzed geomorphic indexes, such as Stream Length gradient index SL, Asymmetry Factor AF, long stream-profile and so on, of four river basins (from north to south the Mulinello, Marcellino, Cantera, and Anapo Rivers, Figure 2). We focused in the Hyblean Plateau, which is crossed by the 1693 source models, because this is the more suitable area for this kind of studies. Indeed, here the river basins are overlapped for the most of their area by the two modeled seismic sources. On the contrary, in the Catania Plain the northern part of the January 11, 1693 box crosses only the mouths of the rivers. Finally, we considered our seismic source models in the frame of geodetic and seismicity literature data to infer a seismogenic fault capable to produce earthquakes, characterized by a magnitude comparable to those affecting south-eastern Sicily in historical time.
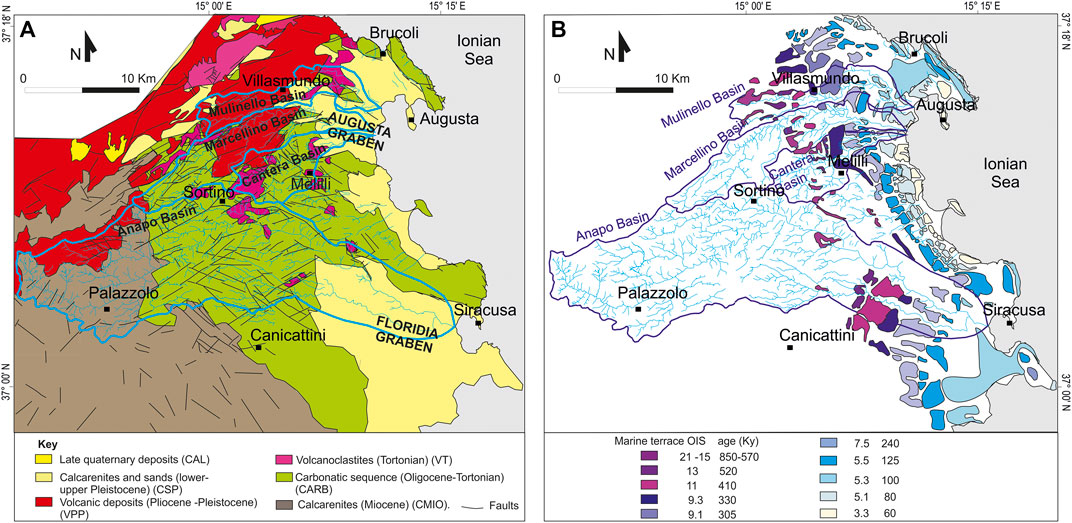
FIGURE 2. (A) Geological sketch map of the study area (modified after Lentini et al., 1994) and the analyzed fluvial basins: from north to south the Mulinello, Marcellino, Cantera and Anapo Rivers; cyan and light blue (B) lines represent the watersheds of the studied rivers. (B) Marine terraces (modified after Catalano et al., 2010) and the fluvial network of the analyzed rivers.
The current geological-structural setting of south-eastern Sicily must be considered in the complex tectonics of the Mediterranean basin, which is dominated by the NNW-SSE Neogene-Quaternary convergence between Nubia and Eurasia plates (Ben Avraham and Grasso, 1990; Lentini et al., 1994) (Figure 1). The Hyblean Plateau is a part of the Nubia continental margin (Dewey et al., 1989) and it represents the emergent fragment of a larger foreland domain, the Pelagian Block, of the Apenninic-Maghrebian orogenic Thrust Belt (Figure 1A). The Foredeep Domain and the Hyblean Foreland Domain are subject to a general strike-lateral faulting regime with a maximum horizontal stress trending from NW-SE to NNW-SSE, in agreement with the Eurasia–Nubia direction of convergence (Figure 1A) (Musumeci et al., 2014). The foreland is separated into two different tectonic crustal blocks (western and eastern) by the N-S striking, left-lateral Scicli-Ragusa Fault System (SRFS): the western block moves north-westwards in agreement with central Sicily, whereas the eastern one accommodates part of the contraction arising from the main Eurasia-Nubia convergence (Catalano et al., 2010; Musumeci et al., 2014). A narrow E-W-trending contractional belt characterizes the northern rim of the Hyblean Plateau, with a shortening up to 4.4 mm/yr (Palano et al., 2012). To the east, the Plateau is bounded by the Maltese Escarpment Fault System (MEFS), which is a kilometric fault system overprinting the pre-existing Mesozoic continent-ocean transition between the eastern block of the Plateau and the Ionian Basin, a portion of the foreland domain characterized by oceanic crust (Scandone et al., 1981). It has been interpreted either as an active right-lateral transtensional (e.g., Doglioni et al., 2001) or as a left-lateral strike-slip fault system (e.g., Adam et al., 2000; Musumeci et al., 2014). Nowadays, the motion direction of MEFS and its recent activity are still debated (e.g., Maesano et al., 2020), although several Authors refer to this structure as a major seismogenic fault (e.g., Argnani and Bonazzi, 2005).
At the eastern side of the Hyblean Plateau, the most important tectonic features are represented by almost parallel NW-SE trending normal faults (Figure 1), giving rise to several horsts and grabens (the Augusta and Floridia Grabens, Figure 2). The activity of the bounding faults of the Floridia Graben is persistent as documented by the offset of 125 ky-old marine terraces; on the contrary, the fault activity along the Augusta Graben stopped 330 ky ago. Indeed, the southern bounding fault is sealed by a 330 ky-old paleoshoreline (Catalano et al., 2010).
The north-western side of the Hyblean Plateau is crossed by a NE-SW - NNE-SSW- trending fault system, known as Monterosso-Agnone Fault System (MAFS in Figure 1) (Cultrera et al., 2015). According to Grasso and Pedley (1990), MAFS has accommodated the flexure of the foreland below the orogenic chain until the Lower Pleistocene. On the other hand, since Middle-Late Pleistocene, active NW-verging thrusting has been characterizing the north-western margin of the Plateau, also involving the previous extensional structures of MAFS (Catalano et al., 2010). The kinematic analyses of these faults constrain a prevalent NNW-directed compression, which is also confirmed by breakout data (e.g., Mariucci and Montone, 2018).
The widest deposits cropping out in the study area belong to the Mt. Climiti Fm., a thick carbonate sequence of sandstones dating back from middle Oligocene to Tortonian (CARB in Figure 2A), and to the Palazzolo Fm., a dated Serravallian-Tortonian to Messinian succession of yellowish calcarenites (CMIO in Figure 2A). In the northern sector, vulcanoclastites with the occurrence of carbonate sediments and sporadic lava belonging to the Carlentini Fm. (Tortonian) (VT in Figure 2A), crop out. In addition, basic vulcanites of either marine or, secondarily, subaerial environment, with age ranging from middle-late Pliocene to Pleistocene (VPP in Figure 2A), crop out. In the eastern sector, the Augusta and Floridia structural depressions are filled with calcarenites and sands, whose age ranges from lower Pleistocene up to upper Pleistocene (CSP in Figure 2A) (Lentini et al., 1994). Finally, late quaternary deposits (CAL in Figure 2A) are locally distributed in the northern sector of the study area. The Augusta and Floridia Basins show a composite polycyclic marine abrasion surface affecting the Upper Pliocene subaerial vulcanites (Schmincke et al., 1997) and different levels of the tertiary Hyblean carbonate succession. Overall, 11 paleo-sea level stands spanning in age from 850 to 570 ky (OIS 21–15) to 60 ky (OIS 3.3), among inner edges and marine terraces, were found (Bonforte et al., 2015 and reference therein) (Figure 2B).
In the historical catalog (from 1000 to 2017, Rovida et al., 2019) a number of strong earthquakes striking eastern Sicily are reported (Figure 1B). Only an earthquake occurred with ML = 5.4 in instrumental time, on December 13, 1990. This was located about 10 km offshore from the northeastern edge of Hyblean Plateau (Amato et al., 1995). The current seismicity (spanning in time from 1994 to 2013) of SE Sicily is characterized by low to moderate magnitudes (1.0 ≤ ML ≤ 4.6) and hypocentres up to 25 km of depth (Musumeci et al., 2014) (Figure 3A). The highest number of earthquakes has occurred within a NNE-SSW to N-S oriented area (Figure 3A) along the eastern sector of the Plateau, as also shown by the earthquake density map (Figure 3B) provided by Cultrera et al. (2015). The typical seismogenic layer is between 15 and 25 km (Figure 3C). The velocity model of the foreland crustal sector, based on 3D P-wave and S-wave velocity maps (Musumeci et al., 2014), shows several sharp lateral velocity perturbations pointing out meaningful discontinuities in the crust, which can be related to major tectonic structures (Figure 3D). In particular, between the one related to the Gela-Catania foredeep by Musumeci et al. (2014), and the other related to the Malta Escarpment, a nearly N–S deep low-velocity zone highlights a discontinuity, which well matches with the almost NNE-SSW band of seismicity. Furthermore, the images resulting from the Vp/Vs ratio show widespread high values (1.8–1.9), which might be indicative of a highly fractured zone corresponding with the NNE-SSW seismic alignment (Figures 3D,E from Musumeci et al., 2014). Several low-magnitude (1.0 ≤ ML ≤ 3.7) seismic swarms (about 500 events) occurred between October 2011 and July 2012, west of Canicattini town (Scarfì et al., 2013) (Figure 3A). Focal mechanisms of the instrumental seismicity in eastern Sicily indicate a prevalence of right-lateral movements on WNW-ESE fault planes or, alternatively, left-lateral movement along N-S to NNE- SSW planes (Figure 1B).
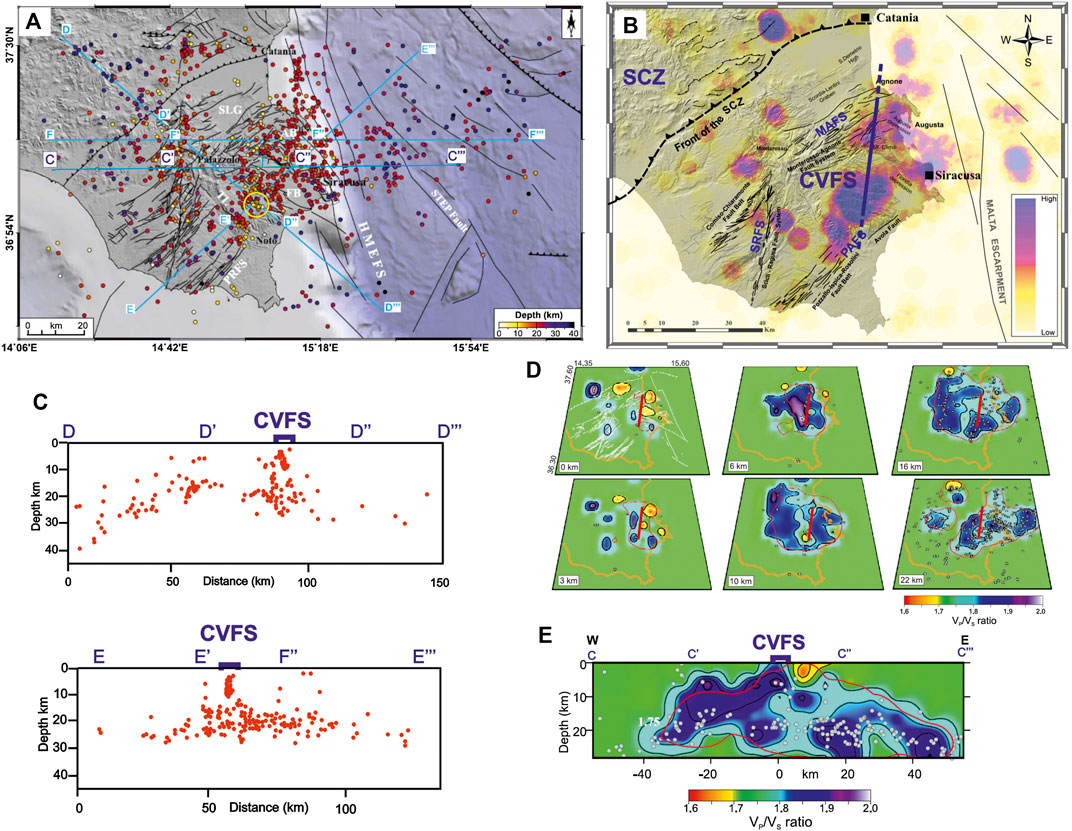
FIGURE 3. (A) Seismicity during 1994–2013 (after Musumeci et al., 2014), yellow circle bounds the 2011–2012 Canicattini seismic swarms. (B) Map of earthquake density (modified after Cultrera et al., 2015); the blue thick line shows the probable location of CVFS. (C) In-depth distribution of shocks across CVFS (modified after Musumeci et al., 2014). (D) VP/VS models for six representative layers resulting from the 3D inversion. Contour lines are spaced 0.1. Red line is the representation of CVFS. On the 0 km layer the main structural features are reported with white lines. Gray circles represent the relocated earthquakes within half the grid size of the slice; red contour lines are the zones with DWS N 50, see Musumeci et al. (2014) for more detail. (E) VP/VS models, contour lines are spaced 0.1. Red curves contour the zones with DWS N 50. Relocated earthquakes, within ±10 km from the sections, are plotted as gray circles, see Musumeci et al. (2014) for more detail.
Starting from the study reported in the CFTI5Med catalog (Guidoboni et al., 2018), we reanalyzed historical reports and reassessed the intensity of the two mainshocks by using the European macroseismic scale (EMS-98, Grünthal, 1998), which classifies damage according to its level and vulnerability class of buildings.
Then we applied the Boxer method (Gasperini et al., 1999) on the new macroseismic fields. According to Gasperini et al. (1999), the source orientation of significant earthquakes is reflected in the elongation of the associated damage pattern. Therefore, a seismic source can be represented as an oriented “rectangle,” whose length and width are obtained from moment magnitude through empirical relationships. The source can represent either the actual surface projection of the seismogenic fault or, at least, the projection of the portion of the Earth crust where a given seismic source is likely to be located (Gasperini et al., 1999).
Moreover, we tried to localize some of the about 1,800 aftershocks that contributed to the destruction of eastern Sicily (Figure 1B).
The analysis of historical sources highlighted that only a few accounts report detailed effects on damage suffered by some localities for the foreshock (January 9). For example, in Augusta, Avola Antica, Noto Antica, the weaker structures collapsed and the stronger buildings cracked (e.g. Boccone, 1697). In fact, the poor quality of building materials, usually inhomogeneous rubble stones, together with the widely adopted “a sacco” constructive techniques (bare stones held together by poor quality mortar), have significantly influenced the damage distribution. As for Catania, the first event frightened the population and caused relevant damage in the whole city. In this case, damages affected not only the poorest houses (A vulnerability class), but also stronger constructions, such as mansions (B vulnerability class) and some monasteries (e.g., the Benedictine), which suffered extensive cracking, detachment of roofs and partial collapse (Azzaro et al., 1999). For the most damaged localities, we estimated a maximum intensity of 8–9 EMS according to the available MCS estimation (Guidoboni et al., 2018). Given the heavy damage and the relevant number of victims in some towns (altogether more than 1,021), it is likely that neighboring localities have suffered damage as well. Therefore, since the number of localities affected by the foreshock is probably higher, it is reasonable to hypothesize that the macroseismic field could be incomplete (Figure 4A).
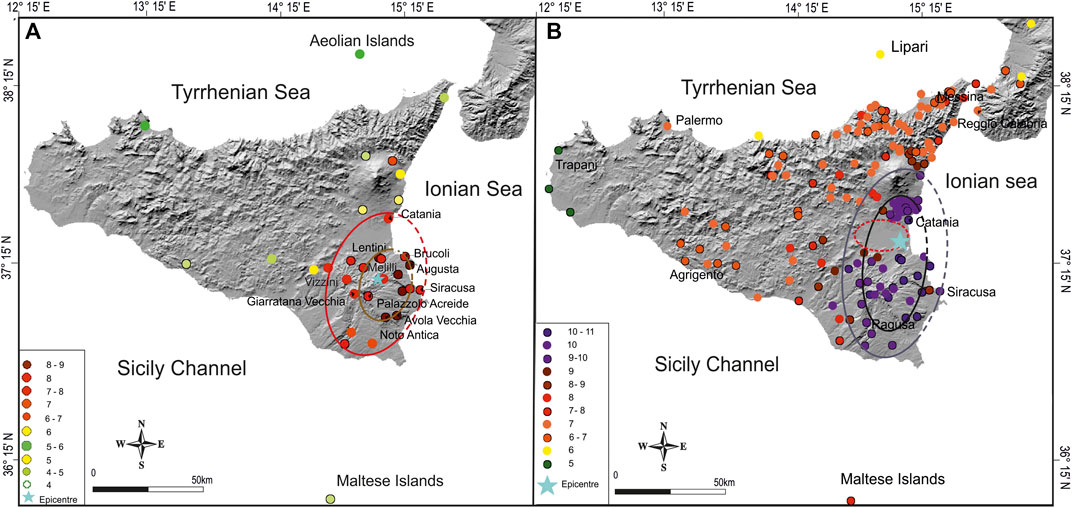
FIGURE 4. (A) Revised January 9 foreshock. In the reported localities many fatalities occurred. The brown ellipse encloses the localities for which intensity I > 8 EMS-98 was estimated; the red ellipse encloses the localities for which intensity I = 7–8 and 8 EMS-98 was estimated. (B) Revised January 11 mainshock. The black ellipse encloses the localities for which intensity I = 10 and 10–11 EMS-98 was estimated; the gray ellipse encloses the localities for which intensity I = 9 and 9–10 EMS-98 was estimated; the red dashed ellipse shows the uninhabited Catania plain area.
The mainshock (January 11) destroyed about forty towns in the area between Catania, Siracusa and Ragusa (Figure 4B), where buildings had already been weakened by the previous event, and damaged most of the Sicilian towns and villages as far as the Malta Island. All the contemporary reports describe Catania as a pile of ruins, listing indeed few remaining buildings (e.g. Boccone, 1697; Bottone, 1718; Mongitore, 1743). Similar description is reported for most of the localities of southern Sicily. Intensity was estimated 10–11 EMS, although it has to be stressed that destruction was the consequence of the combined effects of the two events. The new macroseimic field of the January 11 shock (Figure 4B) shows few differences with respect to those available in CFTI5Med (Guidoboni et al., 2018). The key changes concern the intensity assessment in some localities, for which “total destruction” and an estimated intensity of 11 MCS are reported (Guidoboni et al., 2018). In this study, we assigned 10–11 EMS intensity to take into account that the lack of diagnostic buildings of vulnerability class C and D, may determine an overestimation of the intensity (Grünthal, 1998). Indeed, according to EMS scale buildings of Class A, B, C and D are destroyed under an 11 intensity. In this perspective, we assessed 10 EMS when the accounts report that some buildings did not collapse (Barbano and Rigano, 2001).
According to the revision of the macroseismic data, the foreshock epicentre is located near Sortino (Figure 4A), next to the one reported by the CPTI5 catalog (Rovida et al., 2019). On the other hand, the source of the mainshock seems to be located northward, compared to literature data. Indeed, the assessment of I = 10–11 rather than I = 11 implies a significant change in the earthquake location. According to CFTI5Med data, the epicentre is constrained by the five points of I = 11, and it is located near the January 9 shock. Whereas by evaluating the location using all points of I = 10 and I = 10–11, this would be located in the coastal area south of Catania (see Figure 1B for a comparison of the new and old epicentres). Assuming the mainshock northward with respect to the foreshock (Azzaro and Barbano, 2000; Barbano and Rigano, 2001), this location is also supported by the destruction of the villages located north of Catania, which were not damaged by the foreshock. However, cumulative damage effects bias the macroseismic field of the main event. Moreover, considering that the mainshock was followed by a strong tsunami, either the fault is partially located offshore or the coseismic tectonic subsidence/uplift could have propagated also in the sea.
The destruction followed by the mainshock makes hard to estimate intensity and location of the thousands of aftershocks. Only a few sources report day, time and effects of these shocks, although most of them are reasonably poorly accurate, because they were not written in the area of destruction, where survived people were rather busy in cleaning up debris, burying wounded and dead and getting water and food (e.g. Centorbi, 1694; Boccone, 1697; Bottone, 1718). Many localities damaged by the mainshocks were repeatedly shaken and further damaged by the following events. We also estimated parameters for some of the strongest aftershocks for which in the historical sources information about effects, at least for four localities, are reported (Figure 1B). Obviously, the quality of intensity values is poor because it is difficult to estimate intensity for almost completely destroyed towns (e.g. Azzaro et al., 2020). However, the location of some aftershocks can help to identify the seismic source.
The Boxer method application, on the revaluated macroseismic fields of the 1693 foreshock-mainshock pair (Figure 4), returned two partially interlaced, NNE-SSW directed, seismic sources (Figure 1B). This model suggests that the source responsible can be a unique, NNE-SSW oriented seismogenic fault affecting the eastern sector of the Hyblean Plateau as far as the south of Catania town, which broke twice: a southern segment, on January 9, and a northern segment on January 11. With respect to the CPTI15 catalog, we obtained slightly smaller values of the equivalent magnitude, Mw = 6.1 for the foreshock and Mw = 7.1 for the mainshock, respectively (Table 1).
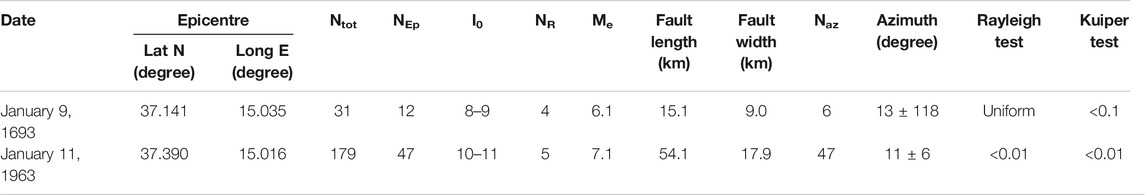
TABLE 1. Source parameters evaluated using intensities obtained herein by Boxer model (Gasperini et al., 1999). Ntot is the total number of data available for the earthquake; NEp is the number of intensity points used for computing the epicentre; I0 is the epicentral intensity; NR is the number of data used to compute Me; Me is the equivalent moment magnitude inferred using average radius (km) of different intensities; NAz is the number of intensity points used for computing the source azimuth with standard deviation; significance levels of the Rayleigh and Kuiper tests.
As the macroseismic field of the mainshock is cumulated with that of the foreshock, the box of the January 11 earthquake obviously follows and partly fits that of the January 9 earthquake. The main limitation of the macroseismic solution is represented by its inadequacy in considering consecutive multiple ruptures (Gasperini et al., 1999), because the damage pattern worsens after the strongest foreshock of the sequence. Furthermore, the macroseismic epicentres are not effective and do not capture the intrinsic complexity of the earthquake rupture. Usually epicentres are located at the tip of the fault and can cause an asymmetry in the distribution of the highest reported intensities with respect to the real location, as observed by comparing the seismic sources of recent Apennine earthquakes obtained by the Boxer method with instrumental data (Vannucci et al., 2019).
We analyzed and mapped coseismic effects caused by the mainshock and reported by historical accounts (such as landslides, liquefactions, secondary ground fracturing, and hydrological anomalies) (Figure 5A), also considering previous paleoseismological studies that identified such effects in several sites of eastern Sicily (Nicoletti, 2005; Pirrotta et al., 2007; Guarnieri et al., 2009; Barbano et al., 2010; Pirrotta and Barbano 2011; Pirrotta et al., 2013). Additionally, we used the Environmental Seismic Intensity scale (ESI 2007), based on the earthquake-triggered effects in the natural environment (Michetti et al., 2007). The coseismic effects, which are considered diagnostic elements for intensity evaluation, are surface faulting and tectonic uplift/subsidence (primary effects), landslides, ground cracks, liquefactions, tsunami and hydrological anomalies (secondary effects). The use of the ESI 2007 is recommended when the macroseismic scale is saturated (i.e., for intensity X to XII) losing its diagnostic value.
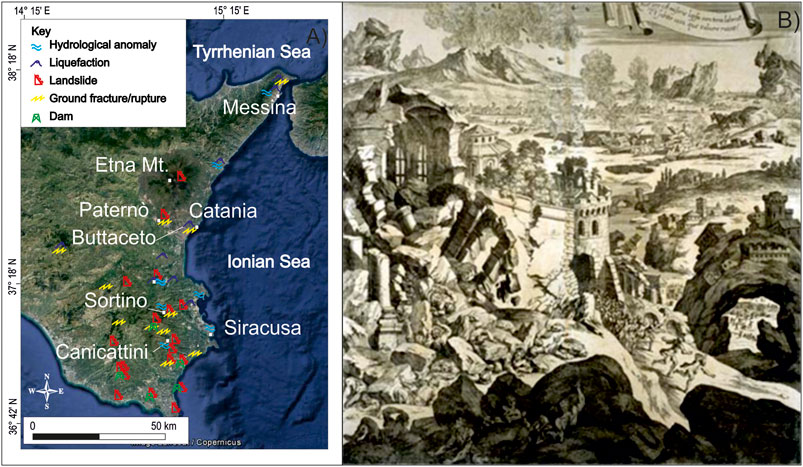
FIGURE 5. (A) Detailed relocation of the 1693 environmental effects. (B) A German copper incision showing the 1693 earthquake. In the foreground, we can see the damaged Hyblean cities, behind the plain of Catania and environmental phenomena and, at the bottom, the Etna Volcano.
Most of the coseismic environmental effects mainly occurred in the eastern Hyblean area and the Catania Plain (Figure 5A), where the new seismic sources lie. Moreover, some of the phenomena described in the historical accounts (e.g. Boccone, 1697; Bottone, 1718) are likely to be related to coseismic faulting (See Supplementary Table S2). Mapped coseismic environmental effects suggest an ESI 2007 intensity X - VERY DESTRUCTIVE. Indeed, although we did not find primary effects, most of the secondary effects listed in the scale (Michetti et al., 2007) were observed within an about 6,000 km2 wide area (Figure 5). Among such effects, we have detected:
(a) Significant changes in either the flow-rate or elevation of several springs. Temporary variations of water level in wells. Strong variations of chemical-physical properties of groundwater, such as temperature, measured at springs and/or wells. Water becomes muddy even in large basins, rivers, wells and springs. Gas emissions, often sulphurous.
(b) Temporary change of river courses in flood plains, also because of widespread land subsidence. Basins were emptied. Tsunamis reached the shores with runups exceeding 5 m, flooding flat areas for hundreds of meters inland. Widespread deep erosion along the shores, with relevant changes of the coastline profile.
(c) Open ground cracks, more than 1 m wide and up to hundred meters long, frequently occurred, mainly in loose alluvial deposits and/or saturated soils; incompetent rocks openings reached several decimetres.
(d) Several large landslides and rockfalls (>105–106 m3), caused temporary or permanent dams, giving rise to lakes. Riverbanks, artificial embankments, and sides of excavations collapsed.
(e) Liquefaction, with water upsurge and soil compaction, which changed the aspect of wide zones; sand volcanoes even more than 6 m large in diameter; vertical subsidence even >1 m; large and long fissures due to lateral spreading phenomena were largely observed (For a summary of the effects and historical sources see Guidoboni et al., 2018).
We mapped tectonic structures by analyzing the surface features that could be associated to fault scarps. The starting point is the known regional structural setting, along with the faults reported on available geological maps (Lentini et al., 1994; Catalano et al., 2010). Then, Digital Elevation Model (DEM) of the study area was set up by interpolating 2-m-interval contour lines, obtained from 1:2.000 scale topographic base maps of the Sicilian Region, using GIS software (ArcInfo by ESRI and Global Mapper). This DEM was integrated with a Digital Terrain Model (DTM) of the Sicilian Region through GIS tools and then analyzed to observe new morphological markers of possible unknown faults. With the aim of investigating in detail these new structures, aerial photos, by the Italian Military Geographical Institute (1:33.000 scale), were analyzed and unknown fault scarps were mapped. Finally, a field survey was carried out on the longest and most evident faults to both validate the achieved results and better estimate dislocation on faults for the slip-rate calculation.
The morphostructural analysis carried out herein highlighted that the longest faults, producing also an important imprint on the landscape, are arranged into three main systems. The first was named herein Palazzolo-Villasmundo Fault System (PVFS) and runs from Palazzolo to Villasmundo towns with a northwest-dip. It is composed of NE-SW to NNE-SSW trending parallel faults, about 10–14 km long: MF1, 2, and 3 and SF1, 2, and 3 (Figures 6A,B, 7; Table 2). Some of these faults were previously mapped in literature and belong to MAFS (Catalano et al., 2010). According to literature, PVFS is a normal fault system that accommodated the flexure of the foreland below the chain until Lower Pleistocene; then, some of these faults were reactivated as reverse faults (Catalano et al., 2010).
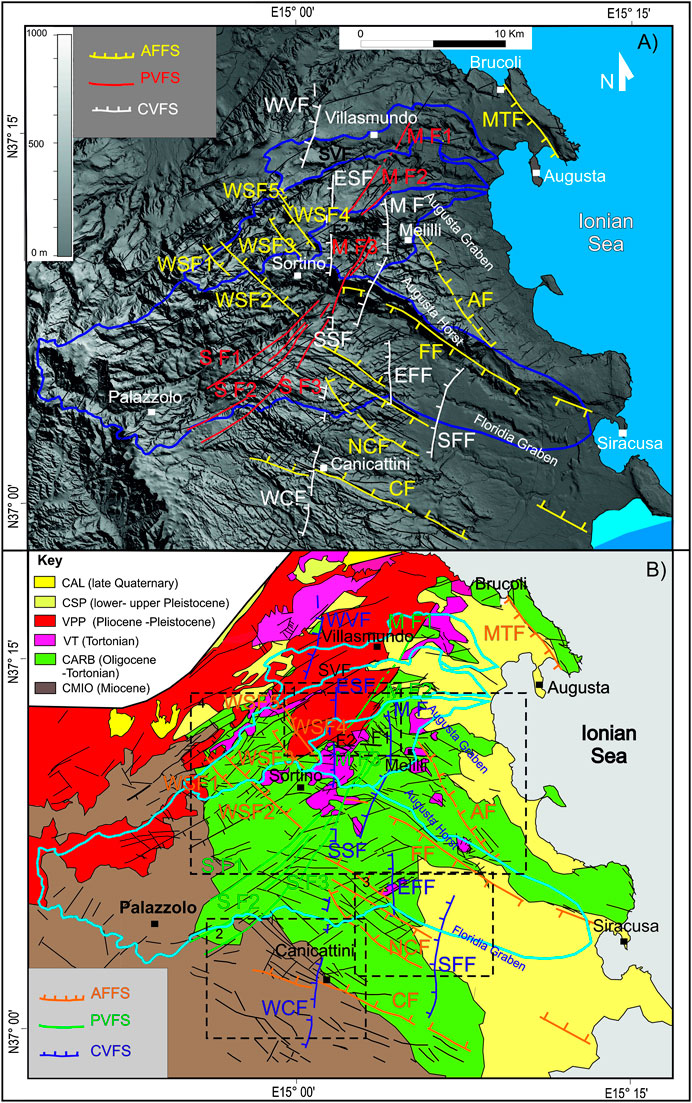
FIGURE 6. (A) Mapped faults draped on the DEM. PVFS is the Palazzolo-Villasmundo Fault System: MF1, MF2 and MF3 are the Melilli Faults; SF1, SF2, and SF3 are the Sortino Faults. AFFS is the Augusta-Floridia Fault System: MTF is the Monte Tauro Fault; AF is the Augusta Fault; FF is the Floridia Fault; NCF is the North Canicattini Fault; CF is the Canicattini Fault. CVFS is the Canicattini Villasmundo Fault System: WVF is the West Villasmundo Fault, ESF is the East Sortino Fault, MF is the Melilli Fault; SSF is the South Sortino Fault, WCF is the West Canicattini Fault, EFF is the East Floridia Fault and SFF is the South Floridia Fault. F1 and F2 are minor faults; all minor faults are from Lentini et al. (1994). Blue polygons indicate the watershed of the studied rivers. (B) Faults and geological formations; black rectangles refer to the location of Figures 7–9, 12 (rectangle 1, 2, 3, and 4 respectively).
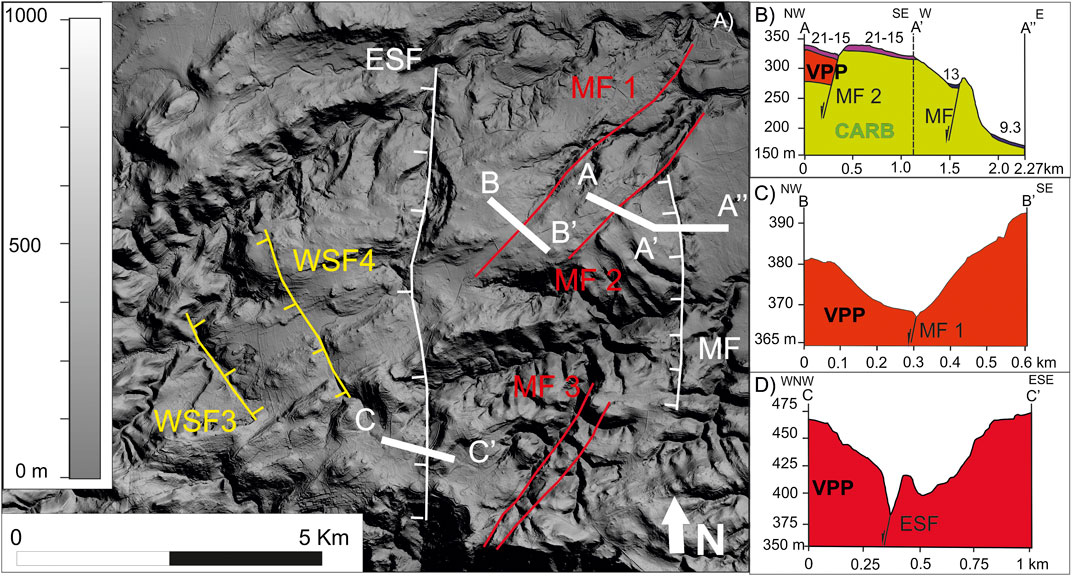
FIGURE 7. (A) A detail of DEM west of Melilli town showing the morphological scarps created by MF, MF1, MF2 and ESF (figure location in Figure 6B). (B) Profile across MF2 and MF showing the dislocation of the marine terraces (see Figure 2B for terrace location). (C) Profile across MF1 showing the asymmetry of the valley with the rejuvenation of the valley profile side that lies at the fault footwall. (D) Profile showing ESF that displaces a valley and causes the shifting of a river course westwards.
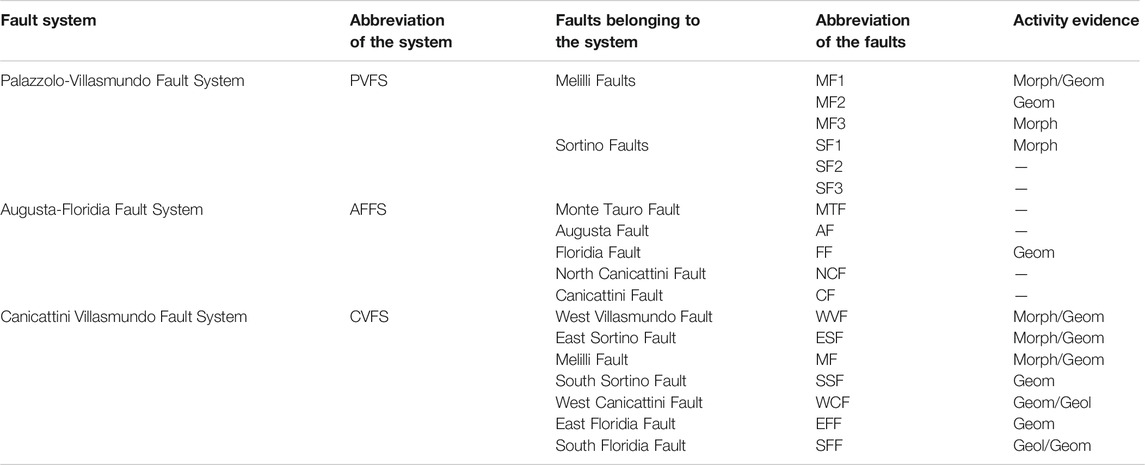
TABLE 2. Fault abbreviations and activity observed by different kind of analyses: Geom, activity observed by geomorphological analysis; Morph, activity observed by morphometric analysis; Geol, activity observed by geological analysis.
The second system, already known in literature, is the Augusta-Floridia Fault System (AFFS in Figures 6A,B and Table 2). It consists of NNW-SSE and NW-SE trending normal faults, giving rise to horst and graben structures, such as the Augusta Graben to the north-east and the Floridia Graben to the south-east (Lentini et al., 1994; Catalano et al., 2010), separated by the Augusta Horst (Figures 6A,B). The former is bordered by the Monte Tauro Fault (MTF) and the Augusta Fault (AF), while the Floridia Graben is bordered by the North Canicattini Fault (NCF) and the Floridia Fault (FF). The 15 km-long, NE-dipping, Canicattini Fault (CF) is the southernmost normal fault belonging to AFFS observed in the study area. Among the minor faults (Lentini et al., 1994; Catalano et al., 2010), the longest are WSF1, 2, 3, 4, and 5 (Figures 6A,B), located in the western sector, which probably belong to AFFS, although they currently show a few evidence of activity.
The third fault system is the Canicattini-Villasmundo Fault System (CVFS), composed of NNE-SSW to N-S-trending faults, never mapped before (Figures 6A,B; Table 2). The West Villasmundo Fault (WVF), the East Sortino Fault (ESF), the South Sortino Fault (SSF) and the West Canicattini Fault (WCF Figures 6A,B, 8), are arranged in a segmented pattern, with gaps shorter than 1–2 km, which is aligned for an overall length of 35 km. To the east of this alignment, the Melilli Fault (MF) (Figure 7), the East Floridia Fault (EFF) and the South Floridia Fault (SFF) (Figure 9) are arranged in an overstepping pattern.
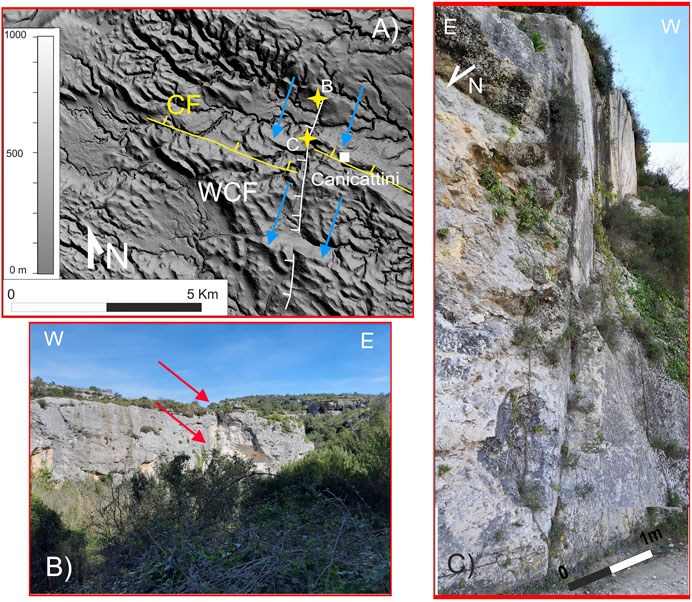
FIGURE 8. (A) DEM showing WCF dislocating two ridges (figure location in Figure 6B). (B,C) photos of WCF northwest and west of Canicattini town, respectively.
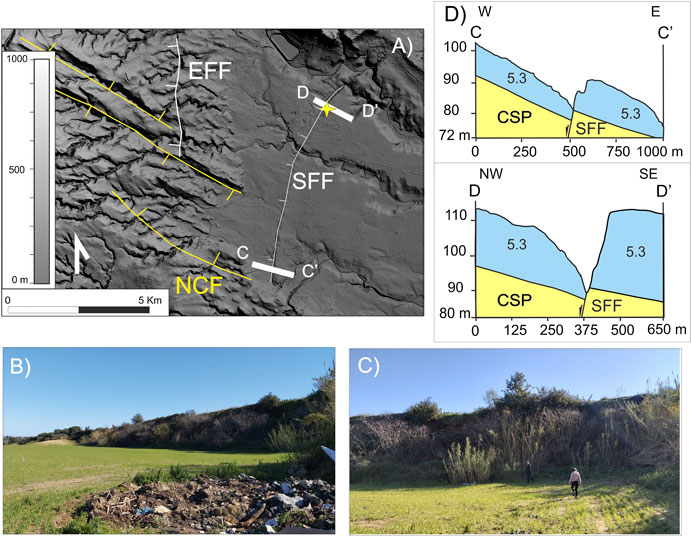
FIGURE 9. (A) A detail of DEM south of Floridia town showing that SFF displaces the upper Pleistocene terrace (OIS 5.3) and the fault activity caused the deflection of the river course (figure location in Figure 6B). The yellow star indicates the location of (B,C): photos of the 10–20 m high fault scarp along profile D-D’. (D) profiles along SSF: C-C’ shows the morphological scarp, the slope increase of the terrace (OIS 5.3) and the westwards shifting of the river valley; D-D’ shows the fault morphological scarp and the asymmetry of the river valley with the rejuvenated profile at footwall.
This system shows a normal kinematics and is characterized by a 10–30 m high, west-dipping, morphological scarp. The most recent evidence of its activity is on SSF. South of Floridia, this fault downthrows westward the upper Pleistocene terrace (OIS 5.3, 100 ky old), with a maximum vertical displacement of 20 m, and it is responsible for both the terrace tilting and the steepness of its footwall (Figure 9). We calculated that the long-term (upper Pleistocene) slip-rates of CVFS is 0.3 mm/y, assuming that the beginning of the system activity was about 100 ky BP, which is the age of the youngest marine terrace dislocated by the faults. In addition, CVFS shows some evidence of lateral movement with the leftwards dislocation of AFFS: to the east of Sortino, MF likely dislocates FF; in the southern sector, WCF seems to dislocate leftward CF (Figures 6A,B). Moreover, CVFS displaces leftward river channels and ridges, as well (Figure 8).
AFFS can be considered an active system because some faults displace upper Pleistocene marker. The bounding faults of the Augusta Graben and the Floridia Graben were active during Pleistocene age, as suggested by the syntectonic sedimentation of CSP (lower-upper Pleistocene, Figure 2). However, some faults of AFFS seem to be characterized by a more recent activity. Indeed, the northern FF, bounding the Floridia Graben, displaces southward a 125 ky old marine terrace. On the contrary, according to Catalano et al. (2010), the activity of AF stopped during upper Pleistocene because it is sealed by a 330 ky old marine terrace. On the other hand, CVFS seems to be the youngest system of the study area because it, besides displacing a 100 ky old Pleistocene marine terrace (SFF in Figure 9), seems to displace also some structures of AFFS (WCF displaces CF and MF displaces FF). In addition, the present-day activity of the three studied fault systems is testified by the morphotectonic analysis.
A morphotectonic analysis was performed herein, based on both quantitative morphometric and qualitative geomorphological studies, at the watershed-scale, of four basins of rivers flowing in the study area (the Mulinello, Marcellino, Cantera and Anapo Rivers) to detect evidence of a recent tectonic activity.
The morphometric analysis allowed us to quantify the relationships between faults and geomorphological features following the approach developed by Snyder et al. (2000) and Kirby et al. (2003). We mapped the drainage geometry and elaborated the DEM trough GIS software (Arc GIS) to extract channel and basin metrics, such as stream length, steepness, concavity. In particular, we computed hierarchical parameters, which describe the organization and maturity of the drainage network and can highlight anomalies due to active tectonics (Supplementary Table S3). Following the approach proposed by Pirrotta et al. (2016), we analyzed Strahler order (Horton, 1945; Strahler, 1952), Bifurcation ratio, Direct bifurcation ratio, Bifurcation index (R), Anomaly parameter, Hierarchical anomaly number (Avena et al., 1967) and Hierarchical anomaly index. The latter parameter has been conceived for this specific work, because it allows a better quantification of drainage anomalies. It is expressed as Δa = Ha/N1, where Ha is the number of the hierarchical anomalies and N1 is the number of first-order segments of the network. The Δa values approaching to 0 indicate a good hierarchical organization of the basin, while values approaching to 1 show a low degree of hierarchical organization. Description and meaning of the parameters are summarized in Supplementary Table S3.
In addition, the geomorphic indexes, such as the Asymmetry factor (AF) (Hare and Gardner, 1985; Cox, 1994; Pinter, 2005; Molin et al., 2004), the Transverse Topographic Symmetry factor (T) (Cox, 1994), the Basin Elongation Ratio (Re) (Bull and McFadden, 1977; Molin et al., 2004), the Hypsometric integral (Strahler, 1952), the Stream length-gradient index (SL) (Hack, 1973; Merritts and Vincent, 1989; Burbank and Anderson, 2001) and the Valley width-height ratio (Vf) (Bull and McFadden, 1977; Ouchi, 1985), were estimated. These indexes define the geometry of a basin and allow highlighting possible fault activity at local scale. Description and meaning of the indexes are summarized in Supplementary Table S4. Since the geomorphic indexes are influenced by lithology, local climate and human causes (Hack 1973), these factors were considered during the analysis and the parameters were related both to the lithology cropping out and to the Quaternary marine terraces (Figure 2). The longitudinal profiles of the channel were smoothed by applying a first-order polynomial loess filter with nearest neighbor’s bandwidth method, choosing a 0.1 sampling proportion. It allowed the removal of the artificial steps introduced in the DEM, keeping natural steps or knick points.
The Mulinello River reaches the 3rd Strahler order. This river has high values of R parameter indicating that the fluvial network has not reached a good hierarchical organization. Moreover, Ha and Δa parameters show a low, but existing, hierarchical anomaly degree. AF index establishes a general symmetry of the basin, however a shifting of the main channel toward the dextral side of the hydrographic basin is observed. T index shows that the main channel locally flows next to the watershed, indicating the action of local geomorphological or structural features. This is particularly evident between MF1 and SVF, where the index exceeds the 0.50 value (Supplementary Table S5). Re index highlights an anomalous elongated shape of the basin, indicating fast uplift and head retreat of the drainage likely due to local activity of faults. However, the relatively high value of Vf index demonstrates that valleys are well modeled (Supplementary Table S5); this can be due to the fact that the drainage is not well developed and mainly represented by first-order segments, which gave rise to well modeled valleys over time (Figure 10A). SL peaks are observed at the hanging wall of MF1 (about 100–150 m a.s.l.) (Figures 10B,D,E). High values of SL are generally expected at the footwall of a normal fault; therefore, such element allows supposing an inversion of the movement along this fault. This anomaly occurs without lithological changes and it is often observed together with the important fluvial deflection of the river (Figure 10D). The local rejuvenation of the hypsometric curve of the Mulinello River at the hanging wall of MF1 (Figure 10C,E) should support the idea that this fault is actually active as a reverse one. All the geomorphic index anomalies occur within the same lithological formation (VPP) without the influence of lithological changes or the presence of marine terraces.
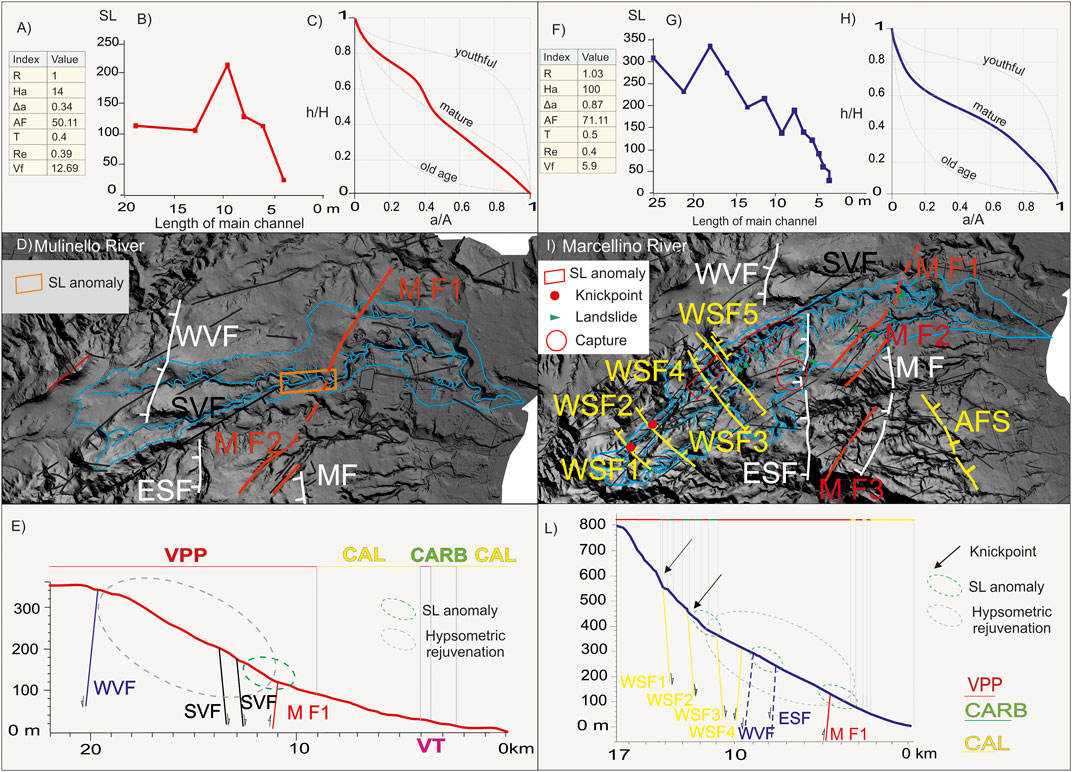
FIGURE 10. From (A–E) Mulinello River analysis. From (F–L) Marcellino River analysis. (A,F) Hierarchical parameters (R, Ha and Δa) and geomorphic indexes (AF, T average Re and Vf average). (B,G) SL index graph. (C,H) Hypsometric curve. (D,I) River and faults crossing the area. (E,L) Long stream-profile and litho-types on which the main channel of the river flows (colored bar, see Figure 2 for the key); the upward arrow on MF1 indicates the likely reverse kinematics of this fault.
The Marcellino River reaches the 4th Strahler order. High values of R parameter indicate that the fluvial network has a scant hierarchical organization. In addition, Ha and Δa parameters establish a very high hierarchical anomaly degree (Figure 10F). AF value, greater than 50, shows that the main channel is shifted toward the hydrographic left, whereas T index highlights an important asymmetry of the basin, characterized by the main channel flowing next to the watershed (Figure 10F). The maximum asymmetry is reached in proximity of MF1 and MF2 interception. SL higher values have been observed at the hanging wall of MF1 (between 100 m and 150 m a.s.l.) and at the hanging wall of ESF and at the footwall of WVF (between 250 and 300 m a.s.l), likely prosecuting in depth (Figures 10G,I,L). Re index indicates an anomalous elongated shape that, along with the rejuvenation of the Hypsometric curve at the hanging wall of MF1 and MF2, suggests the uplift of the western side of the basins producing the fast fluvial head retreat (Figures 10F,H,L). Furthermore, Vf low value (Supplementary Table S5) indicates V-shape valleys caused by strong fluvial incision due to a fast uplift. Anomalies of the geomorphic indexes occur either within the same geological formation (VPP). However, the knick points at 420 m and 560 m a.s.l. (Figure 10L), occur where there is an alternation of VT and CARB and the river is crossed by minor faults WSF1 and WSF2. Since VT and CARB have similar lithological characteristics with a medium erodibility degree, these knick points can be due to the fault activity. These results allow us to affirm that MF1 and MF2 seem to be actually active as reverse faults.
The Cantera River reaches the 4th Strahler order. The value of R parameter indicates that the fluvial network has a not regular hierarchical organization but it is better than the other analyzed rivers. In addition, Ha and Δa parameters highlight an important hierarchical anomaly degree (Figure 11A). AF index shows a symmetric shape of the basin and Re value indicates a more regular and circular shape; however, the T index shows local asymmetries in the final tract of the drainage (close to the shoreline) (Supplementary Table S5). Vf value indicates the occurrence of V-shape incised valleys (Supplementary Table S5), suggesting that the basin is suffering a fast uplift. The mature stage is supported by the fact the drainage reaches the 4th Strahler order. However, this evidence of mature stage is in contrast with the young stage showed by the hypsometric curve (Figure 11C). In the Cantera River, SL high values are between 150 and 200 m a.s.l., indicating a local increase of the slope in a sector ranging between MF3 and MF (Figures 11B,D,E); then, values remain high indicating that the anomalous increase of slope persists as far as the upper stream. This evidence supports that MF3 is moving as reverse fault, as well. Long stream-profile shows four knick points in absence of lithological change. The first two well-shaped steps dip in the same direction of the slope and are due to the minor faults F1 and F2; the others are an inflection of the long stream-profile at the hanging wall of ESF. SL anomalies and knick points are observed without lithological change, in the CARB and VT terrains. Thus, lithological change as cause of these anomalies can be excluded.
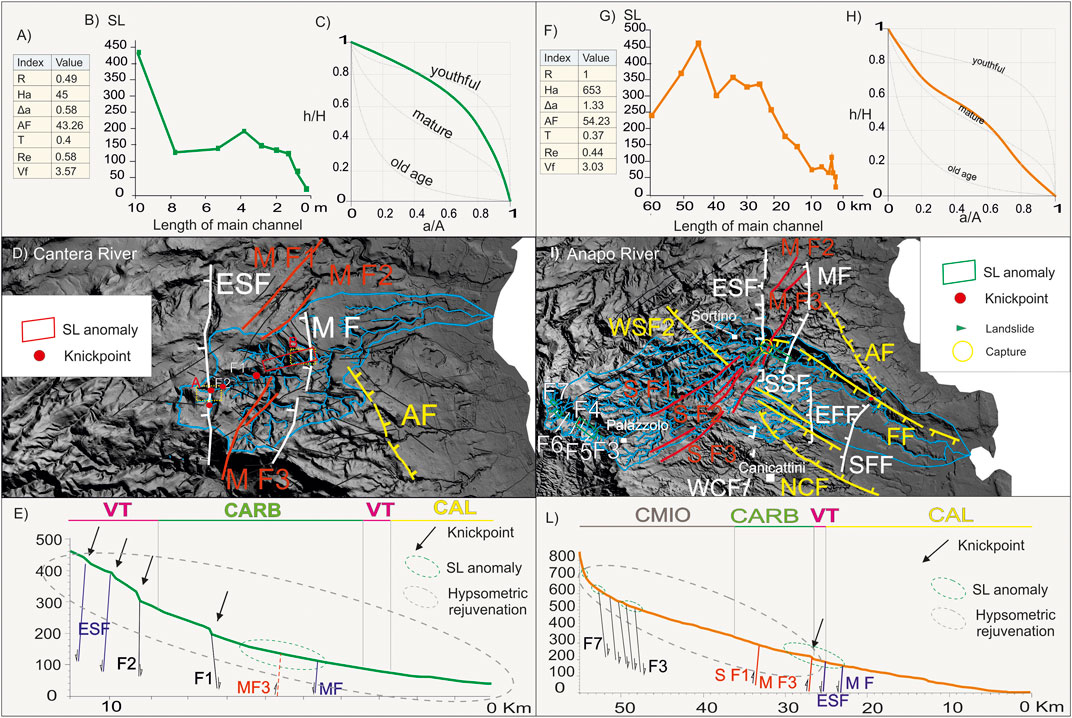
FIGURE 11. From (A–E): Cantera River analysis. From (F–L): Anapo River analysis. (A,F) Hierarchical parameters (R, Ha and Δa) and geomorphic indexes (AF, T average, Re and Vf average). (B,G) SL index graph. (C,H) Hypsometric curve. (D,I) River and faults crossing the area; in (D) the rectangles labeled A and B refer to the location of Figures 12D,E, respectively. (E,L) Long stream-profile and litho-types on which the main channel flows (colored bar, see Figure 2 for the key).
The Anapo River reaches the 4th Strahler order. The R value indicates a scant hierarchical organization and Ha and Δa parameters show the highest degree of hierarchical anomaly with respect to the other rivers of the study area. AF and T indexes indicate an almost regular symmetry. Re suggests anomalous elongated shape, which can be associated to tectonic control (Figure 11F). Vf indicates the presence of incised V-shape valleys suggesting a fast tectonic uplift with respect to the base level (Supplementary Table S5). In the Anapo River, SL high values (between 150 m and 200 m a.s.l) support the activity of MF, ESF and MF3 (Figures 11G,I,L). Others anomalous values are observed (between 500 m and 550 m a.s.l and between 600 m and 650 m a.s.l.) where the drainage is intercepted by secondary faults. High values of SL at the hanging wall of MF3 support the inversion of movement of this fault. The rejuvenation in the central sector of the Anapo River, observed in the hypsometric curve, occurring at the hanging wall of MF3 and SF1, testifies the up-throwing of the hanging wall of these faults suggesting that they can be active as a reverse fault. Only a knick point, occurring on MF3, corresponds to a lithological passage between CARB and VT, but we consider that this knickpoint is rather due to the fault activity, because the presence and activity of MF3 is supported by other markers.
We mapped geomorphological markers of active tectonics, such as deflected streams, offset streams, offset ridges, fluvial captures and landslides, similar to those mapped in other active tectonic contexts of eastern Sicily (Guarnieri and Pirrotta, 2008; Pirrotta and Barbano, 2011; Pirrotta et al., 2016; Pappalardo et al., 2018) and of other areas worldwide (e.g., Ouchi, 1985; Kirby et al., 2003; Molin et al., 2004).
In the fluvial basins analyzed herein, several markers of possible active tectonics have been observed, such as anomalous confluences, deflected streams, multiple confluences, fluvial catchments, slope anomalies, asymmetric valleys, hierarchy anomalies, deflected ridges and valleys where drainage is intercepted by faults. In addition, several landslides are observed along the river courses in proximity of the faults, testifying the strong link between tectonics, landslides and river path. The most remarkable capture affects the Anapo River, close to the Sortino town. Here EFS and FF caused the grow of the Augusta Horst, which acted as a barrier, hampering the fluvial course of the river and causing the abandonment of the old NE-SW drainage and the clockwise deflection toward the current NW-SE flow (orange arrow in Figure 12A). The Cantera River (yellow arrow on right in Figure 12A) now occupies the abandoned drainage path.
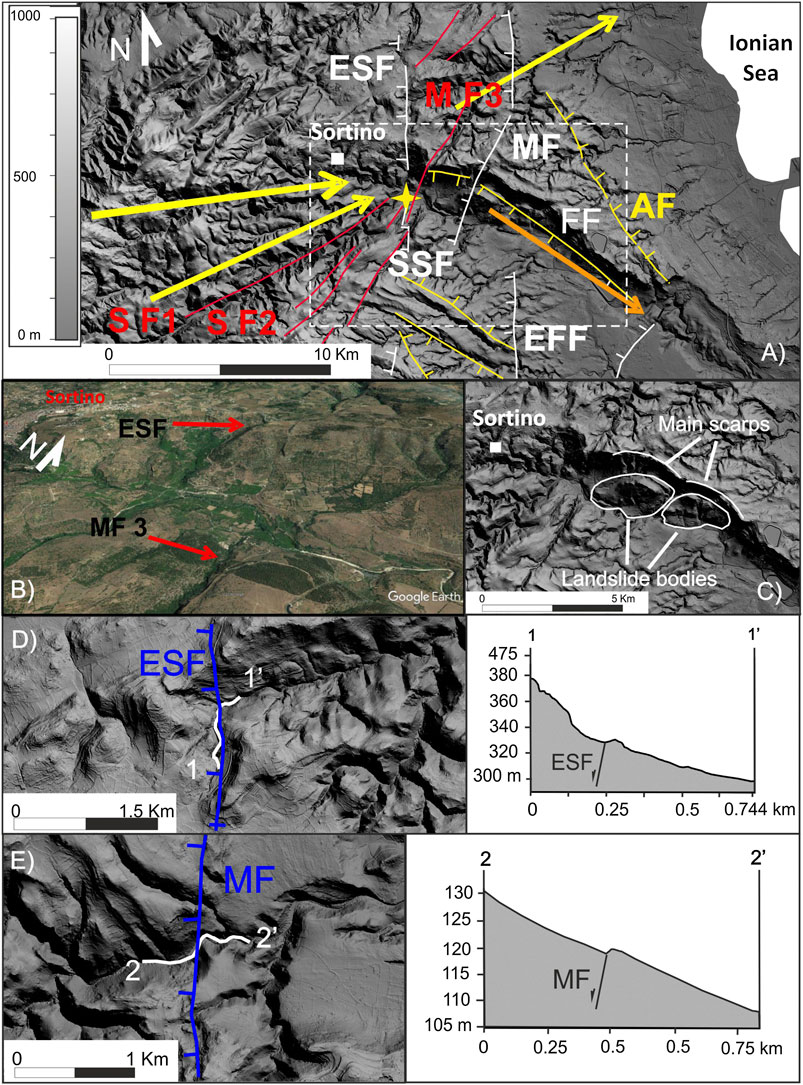
FIGURE 12. (A) DEM detail of the central part of the Anapo River (figure location in Figure 6B) showing the direction change of the drainage network due to ESF and FF activity, which caused the uplift of a block north of the Anapo River partially coincident with the Augusta Horst. Yellow arrows on the left indicate the present-day ENE–WSW direction of the western sector of the Anapo River; in the eastern sector, orange and yellow arrows indicate the present-day NW-SE direction and the old direction of the Anapo River, respectively. The latter corresponds to the actual Cantera River. White lines are the river watersheds. Yellow star is the location of the google earth image of Figure 8B. (B) Google Earth image showing ESF and MF3. (C) Detail of the DEM showing two paleo-landslides along FF to the east of Sortino, likely triggered by the 1693 earthquakes. Landslide bodies are eroded and incised by the Anapo River. (D) DEM and main channel profiles of the Cantera River, where it is intercepted by ESF and (E) by MF; (see Figure 11D).
It is evident that, initially, the western part of the Anapo River flowed into the current Cantera River, since these two rivers show the same mature stage. Indeed, although the Cantera River is small and its hypsometric curve indicates a young stage, it shows a mature hierarchical stage reaching the 4th Strahler order and it has incised V- shape valleys similarly to the western part of the Anapo River (similar Vf values). In this area, two paleo-landslides were mapped along FF, which are incised by the present-day fluvial network (Figure 12C). The 1693 earthquakes could have triggered the two landslides, as reported by historical accounts that describe several landslides occurred near Sortino (Figure 5). Moving southwards, the recent fluvial drainage suffers captures and shapes orthogonal deflections where it is crossed by SFF (Figure 9A). The river valley shows indeed an asymmetric path with a rejuvenated and steeper footwall side with respect to the hanging wall, which shows a concave profile (Figure 9D). Typical effects of the action of the mapped faults on the drainage are the morphological scarps, with an opposite dip if compared to the normal slope of the main river course (Figure 12D and 12E). Southwards, WCF shows some evidence of left-lateral component of movement, indeed this fault seems to dislocate two ridges and their valley northwest and west of Canicattini town, respectively (Figure 8A).
Through the revision of the macroseismic data of the 1693 shocks, two NNE-SSW trending, partly interlaced seismic sources for the 1693 fore and main-shocks were obtained. According to the model presented in this paper, the January 9 seismic source is located south to Sortino, whereas the January 11 main-shock source is located northwards comprising also the Catania Plain (Figure 1B).
The fault mapping, the field survey and the morphotectonic analysis (qualitative geomorphological and morphometric study) of the rivers allowed observing three main active fault systems: i) the NW-SE-trending AFFS, characterized by normal dip-slip kinematics, responsible for the basins opening; ii) the NE-SW up to NNE-SSW-striking west-dipping PVFS with some faults (SF1, MF1 and MF3) showing inversion of kinematics from normal to reverse; iii) the CVFS with almost N-S-trending, W-dipping normal faults, some of which show left-lateral component of movement. The CVFS is characterized by a segmented pattern, with gaps and stepovers of few kilometres. Achieved results support the hypothesis that AFFS, PVFS and CVFS are active fault systems acting contemporarily. The activity of AFFS is also testified by active deformation of Holocene deposits and late Pleistocene marine terrace observed offshore in the Augusta Bay (Pirrotta et al., 2013). The coexistence and contemporaneity of contractional, extensional and strike-slip structures suggest a complex tectonic frame that can be resolved with the hypothesis of a left-lateral shear zone. In this model, the CVFS can be the segmented superficial expression of a unique NNE-SSW to N-S-trending master fault; that is the Y-shear along the deep shear zone axis. AFFS and PVFS should be the extensional and contractional structures associated to the propagating shear zone (Figure 13A). Indeed, according to the diffuse strike-slip experiments, the crustal sector into a shear zone can be deformed with the formation of both extensional and contractional secondary faults. Furthermore, upthrust blocks and open tensional basins, similar to that observed in the study area, characterize the bend surrounding the strike-lateral fault (e.g., Cunningham and Mann, 2007). The directions and kinematics of the shear zone, and of the annex structures at the surface (PVFS, AFFS, and CVFS) agree with the recent stress field, characterized by a maximum horizontal stress axis NW–SE to NNW–SSE oriented, that follows the Eurasia–Nubia direction of convergence. However, in the frame of the NW-SE plate tectonic convergence, the contraction seems to be accommodated by PVFS, which are located in the narrow, east-west-trending belt of the northern Hyblean Plateau, were contraction was observed by GPS data (Palano et al., 2012). On the other hand, the normal component of movement of the CVFS can be explained by the different velocity and direction of convergence of the two blocks separated by the shear, in the geodynamic frame of the north-westward movement. Alternatively, the extension on CVFS, with the lowering of the western sector, can be due to the persistent flexure of the Hyblean Plateau below the orogenic chain. CVFS lies across the southern part of the new-modelled boxes (Figure 13B) and well matches with some previously modeled seismic sources of the 1693 earthquakes (Figure 1) (e.g., Sirovich and Pettenati, 2001; Barbano and Rigano, 2001). Furthermore, CVFS runs along an NNE-SSW shocks alignment. Indeed, instrumental seismicity suggests that the highest number of earthquakes (Figure 3A) has occurred within an NNE-SSW oriented area running from west of Canicattini to Catania, crossing the Catania Plain. Both here and in the central sector of the Hyblean Plateau, a maximum of instrumental earthquake density (Figures 3A,B) is observed and the strongest historical earthquakes of south-eastern Sicily occurred (Figures 1B). Furthermore, PVFS and CVFS lie in correspondence of the fractured crustal sector detected analyzing Vp/Vs ratio map (Figures 3D,E, Musumeci et al., 2014). It is not excluded that CVFS can continue northwards in the Catania plain or offshore in the Ionian Sea. Indeed, the new-modelled seismic source of the January 11 shock extends as far as south of Catania. CVFS is composed by up to 10 km long segments, with a total length at the surface of about 35 km. It is demonstrated that the sub-surface rupture length (RLD) is longer than the surface rupture length (SRL) up to 35–45% (Wells and Coppersmith, 1994; Boncio et al., 2004). Therefore, considering the wide area of generated deformation, and that the fault can continue in the Catania plain, CVFS shows a suitable geometrical dimension (SRL ∼35 km; RLD more than 40 km) to generate earthquakes with magnitude greater than 7, as those occurred during 1693 (Mw 7.1–7.3). Moreover, upper Pleistocene slip-rate of the CVFS, estimated around 0.3 mm/yr, is comparable to the one observed on the Apenninic faults, responsible for the disastrous earthquakes occurred in the last twenty years (e.g. Pace et al., 2006). Ground deformation effects reported by the historical accounts (Supplementary Table S2) could be related to either the coseismic faulting, or secondary ruptures not directly connected with the seismogenic fault at depth, that we searched in the field, although these are no longer visible after more than three hundred years. Given the previous discussed evidence, the master fault related to CVFS is hypothesized as a possible candidate for the southeastern strong earthquakes and, in particular, for the 1693 seismic sequence. In our assumption, the January 9 foreshock nucleated south of Sortino, probably at the WCF segment, and strongly damaged the localities along the eastern side of the Hyblean Plateau (Figure 4A). The January 11 mainshock nucleated northwards, at either the ESF or WVF segment and propagated in the Catania plain, where the CVFS could continue buried by the alluvial deposits, and completely destroyed the previous damaged localities, along with the villages located north of Catania that were not damaged by the foreshock (Figure 4B). This model suggests a cascade-style rupture as already proposed by Burrato and Valensise (2008) for the 1857 Southern Italy earthquakes. The first shock nucleated in the southern segment, while the second shock in the northern one (Figure 13A). The arrows show the hypothesized rupture directivity, which could explain the anomalously extensive damage from the Sortino area, where sources are partially interlaced, moving toward the southern Etna, where most of the towns and villages were destroyed as well.
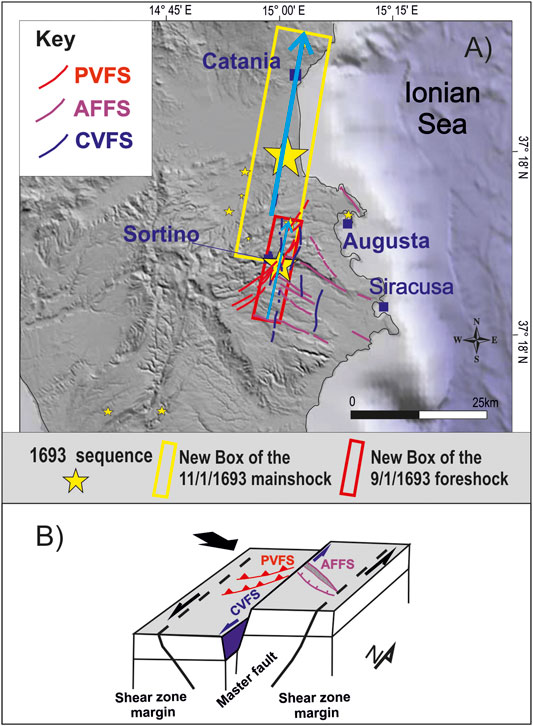
FIGURE 13. (A) South-eastern Sicily DEM; red and yellow rectangles are the new modeled seismic sources; arrows indicate the hypothesized rupture directivity and verse of propagation of the rupture. (B) Model of a transtensive fault with its associated extensional and contractional faults; black arrow indicates sigma 1.
The seismic sources modeled herein are more suitable to produce the observed seismo-induced effects and damage. Indeed, the EMS-98 based damage assessment gives a maximum intensity of X-XI and the evaluation of Seismic Intensity with the ESI 2007 scale, based on the effects triggered by earthquakes in the natural environment, returns an Intensity X ESI, since the affected area was about 6,000 km2 wide. At this intensity, frequent large landslides under the sea level in coastal areas can be triggered. Furthermore, coseismic effects are concentrated in the central part of Catania Plain (Figure 5) where there is a lack of intensity information (due to uninhabitability) (Figure 4A), whereas there are two maximum intensity concentrations at the margins of the plain. The large tsunami that followed the mainshock was probably triggered by coseismic tectonic subsidence or uplift, since the deformation could have propagated in the sea. Otherwise, the shock could have triggered the numerous sub-marine slides observed along the entire slope of the Malta Escarpment by geophysical surveys (e.g., Torelli et al., 1998; Pirrotta et al., 2013), which could have caused the wide tsunami. Sub-marine slides are induced effects expected at intensity X in the ESI 2007 scale and several Authors, who consider the 1693 seismogenic faults on land, have already suggested similar hypotheses (e.g., Billi et al., 2010). With respect to the faults located offshore (Figure 1; Supplementary Table S1), our new seismic sources (Table 1) are characterized by magnitude values that are similar to those reported in the Italian parametric catalog (Rovida et al., 2019) for the strongest Italian earthquakes. Seismic sources located offshore, such as both the Malta Escarpment and the subduction plane, should have generated much greater magnitude earthquakes to justify the 1693 distribution of damages (e.g. Sirovich and Pettenati, 2001; Gutscher et al., 2006).
In this paper, we propose a new fault model for the 1693 earthquakes based on a new analysis of the macroseismic historical data and morphotectonics constraints.
The analysis of historical data of the 1693 earthquakes allowed us to model two NNE-SSW trending, partly interlaced seismic sources for the fore and main-shocks, running from the Hyblean Plateau as far as the southern sector of Etna.
Fault mapping and morphotectonic analysis revealed a complex fault belt in the Hyblean Plateau. Among these, a segmented N-S trending fault system (the Canicattini Villasmundo Fault System) could be a unique main fault, whose length in depth could reach about 35 km.
This Fault System well matches with part of the almost N-S trending seismic sources modeled for the 1693 shocks, representing a valuable candidate for these earthquakes. Furthermore, CVFS has a suitable dimension to generate earthquakes with Mw up to 7.3. Achieved model suggests a cascade-style rupture for the 1693 seismic events, where the January 9 shock nucleated in a southern segment and the mainshock in a northern segment of CVFS (Figure 13A).
The geometry and kinematics of this system are compatible with SE Sicily instrumental seismicity and support the hypothesis of the Hyblean Plateau indenter segmentation with different movement of the adjacent crustal blocks, in the frame of the Africa-Eurasia convergence. This is in accordance with other regional master faults, i.e. the Scicli Ragusa Fault System and the Malta Escarpment Fault System.
As a final consideration, some questions remain to be addressed:
• Could the northern segment of the fault prosecute northwards? It could either be partially buried under the sediments of the Catania plain or continue offshore. This open question deserves to be the subject of future researches.
• Is the tsunami due to the propagation of the deformation offshore? If not, are the landslides mapped offshore capable to trigger a tsunami such as the January 11, 1693 one? The new fault model should be used to model the tsunami data.
Achieved results represent useful data for further geomorphic, geologic, paleoseismic, geophysical, and seismological research in the region aimed at proving the new proposed seismogenic model in southeastern Sicily and at resolving the open questions.
The raw data supporting the conclusions of this article will be made available by the authors, without undue reservation.
MB and CP conceived the study by planning the macroseismic analysis, the fault mapping and the morphotectonic analysis. CP carried out the fault mapping and the morphotectonic analysis. MB analyzed macroseismic data and instrumental seismicity. CP and MB surveyed faults in the field, performed interpretation and wrote the draft of the manuscript.
This study has been partly funded by the project MUSE 4D-Overtime tectonic, dynamic and rheologic control on destructive multiple seismic events - Special Italian Faults and Earthquakes: From real 4-D cases to models, in the frame of PRIN 2017 and partly by the University of Catania funds (Project PIA.CE.RI. 2020–2022, Open Access line).
The authors declare that the research was conducted in the absence of any commercial or financial relationships that could be construed as a potential conflict of interest.
We wish to thank G. Barreca, S. Mineo, and C. Monaco for the useful discussion on the active faults in Eastern Sicily. We also wish to thank the two anonymous reviewers and Editor Federica Ferrarini for their valuable comments on the manuscript.
The Supplementary Material for this article can be found online at: https://www.frontiersin.org/articles/10.3389/feart.2020.550851/full#supplementary-material
Adam, J., Reuther, C. D., Grasso, M., and Torelli, L. (2000). Active fault kinematics and crustal stresses along the Ionian margin of southeastern Sicily. Tectonophysics 326, 273–288. doi:10.1016/S0040-1951(00)00141-4
Amato, A., Azzara, R., Basili, A., Chiarabba, C., Cocco, M., Di Bona, M., et al. (1995). Main shock and aftershocks of the December 13, 1990, eastern Sicily earthquake. Ann. Geophys. 38 (2), 255–266. doi:10.4401/ag-4122
Argnani, A., and Bonazzi, C. (2005). Malta escarpment fault zone offshore eastern Sicily: Pliocene-Quaternary tectonic evolution based on new multichannel seismic data. Tectonics 24, 1–12. doi:10.1029/2004TC001656
Avena, G. C., Giuliano, G., and Lupia Palmieri, E. (1967). Sulla valutazione quantitativa della gerarchizzazione ed evoluzione dei reticoli fluviali. Boll. Soc. Geol. It. 86, 781–796.
Azzaro, R., and Barbano, M. S. (2000). Analysis of seismicity of Southeastern Sicily: a proposed tectonic interpretation. Ann. Geophys. 43, 171–188. doi:10.4401/ag-3628
Azzaro, R., Barbano, M. S., Moroni, A., Mucciarelli, M., and Stucchi, M. (1999). The seismic history of Catania. J. Seismol. 3 (3), 235–252. doi:10.1023/A:1009818313629
Azzaro, R., Barbano, M. S., Tertulliani, A., and Pirrotta, C. (2020). A reappraisal of the 1968 Valle del Belìce Seismic Sequence (Western Sicily): a case study of intensity assessment with cumulated damage effects. Ann. Geophys. 63 (1), SE105. doi:10.4401/ag-8308
Barbano, M. S., Pirrotta, C., and Gerardi, F. (2010). Large boulders along the southeastern Ionian coast of Sicily: storm or tsunami deposits? Mar. Geol. 275, 140–154. doi:10.1016/j.margeo.2010.05.005
Barbano, M. S., and Rigano, R. (2001). Earthquake sources and seismic hazard in south-eastern Sicily. Ann. Geophys. 44, 723–738. doi:10.4401/ag-3570
Ben Avraham, Z., and Grasso, M. (1990). Collisional zone segmentation in Sicily and surrounding areas in the central Mediterranean. Ann. Tect. 4, 131–139.
Bianca, M., Monaco, C., Tortorici, L., and Cernobori, L. (1999). Quaternary normal faulting in southeastern Sicily (Italy): a seismic source for the 1693 large earthquake. Geophys. J. Int. 139, 370–394. doi:10.1046/j.1365-246x.1999.00942.x
Billi, A., Minelli, L., Orecchio, B., and Presti, D. (2010). Constraints to the cause of three historical tsunamis (1908, 1783, and 1693) in the Messina Straits region, Sicily, southern Italy. Seismol Res. Lett. 81 (6), 907–915. doi:10.1785/gssrl.81.6.907 6
Boccone, P. (1697). Intorno il terremoto della Sicilia seguito l’anno 1693. Venezia, Italy: Museo di Fisica, 1–31.
Boncio, P., Lavecchia, G., and Pace, B. (2004). Defining a model of 3D seismogenic sources for seismic hazard assessment applications: the case of central Apennines (Italy). J. Seismol. 8 (3), 407–425. doi:10.1023/B:JOSE.0000038449.78801.05
Bonforte, A., Catalano, S., Maniscalco, R., Pavano, F., Romagnoli, G., Sturiale, G., et al. (2015). Geological and geodetic constraints on the active deformation along the northern margin of the Hyblean Plateau (SE Sicily). Tectonophys. 640-641, 80–89. doi:10.1016/j.tecto.2014.11.024
Bottone, D. (1718). De immani Trinacrie terremotu. Idea historico-physica, in qua non solum telluris concussiones transacte recensetur, sed novissime anni 1717. Messina, Italy.
Bull, W. B., and McFadden, L. (1977). “Tectonic geomorphology north and south of the Garlock Fault, California,” in Geomorphology in arid regions. Editor D. O. Doering, (Binghamton, NY: State University of New York, Binghamton), 115–138.
Burbank, D. W., and Anderson, R. S. (2001). Tectonic geomorphology. Oxford, UK: Blackwell Science, 274.
Burrato, P., and Valensise, G. (2008). Rise and fall of a hypothesized seismic gap: source complexity in the Mw 7.0 16 December 1857 southern Italy earthquake. Bull. Seismol. Soc. Am. 98 (1), 139–148. doi:10.1785/0120070094
Catalano, S., Romagnoli, G., and Tortorici, G. (2010). Kinematics and dynamics of the late quaternary rift flank deformation in the Hyblean Plateau (SE Sicily). Tectonophysics 486, 1–14. doi:10.1016/j.tecto.2010.01.013
Centorbi, M. (1694). “Raguaglio lacrimevole per la desolatione della terra d’Occhiolà nell’occorso terremoto (ms. 1694),” in Occhiolà. Editors G. Gianformaggio, (Catania, Italy), 211–235.
Cox, R. T. (1994). Analysis of drainage basin symmetry as a rapid technique to identify areas of possible Quaternary tilt-block tectonics: an example from the Mississippi Embayment. Geol. Soc. Am. Bull. 106, 571–581. doi:10.1130/0016-7606(1994)106<0571:AODBSA>2.3.CO;2
Cultrera, F., Barreca, G., Scarfì, L., and Monaco, C. (2015). Fault reactivation by stress pattern reorganization in the Hyblean foreland domain of SE Sicily (Italy) and seismotectonic implications. Tectonophysics 661, 215–228. doi:10.1016/j.tecto.2015.08.043
Cunningham, W. D., and Mann, P. (2007). Tectonics of strike-slip restraining and releasing bends. Geol. Soc. Spec. Publ. 290, 1–12. doi:10.1144/SP290.1
De Soldanis, G. P. (1746). Gozo – Ancient and modern, Religious and profane (translation into English by Rev. Fr. Anthony Mercieca of original manuscript, 1999). Malta: Media Centre Publications, permissions to use the work granted by this license.
Dewey, J. F., Helman, M. L., Knott, S. D., Turco, E., and Hutton, D. H. W. (1989). Kinematics of the western Mediterranean. Geol. Soc. Spec. Publ. 45 (1), 265–283. doi:10.1144/GSL.SP.1989.045.01.15.
DISS Working Group (2018). Database of Individual Seismogenic Sources (DISS), Version 3.2.1: a compilation of potential sources for earthquakes larger than M 5.5 in Italy and surrounding areas. Rome: Istituto Nazionale di Geofisica e VulcanologiaAvailable at: http://diss.rm.ingv.it/diss/. doi:10.6092/INGV.IT-DISS3.2.1 (Accessed April 10, 2020)
Doglioni, C., Innocenti, F., and Mariotti, G. (2001). Why Mt Etna? Terra. Nova 13, 25–31. doi:10.1046/j.1365-3121.2001.00301.x
D’Addezio, G., and Valensise, G. (1991). “Metodologie per l'individuazione della struttura sismogenetica responsabile del terremoto del 13 Dicembre 1990,” in Contributi allo studio del terremoto della Sicilia orientale del 13 Dicembre 1990. Editors E. Boschi, and A. Basili, (Rome: Istituto Nazionale di Geofisica), Vol. 537, 115–125.
Gasperini, P., Bernardini, F., Valensise, G., and Boschi, E. (1999). Defining seismogenic sources from historical earthquake felt reports. Bull. Seismol. Soc. Am. 89, 94–110.
G. Grünthal, (Editor) (1998). European macroseismic scale 1998 (EMS-98). European seismological commission, subcommission on engineering Seismology, working Group macroseismic scales. Conseil de l’Europe, Cahiers du Centre Européen de Géodynamique et de Séismologie, Luxembourg, Vol. 15, 99. Available at: http://www.ecgs.lu/cahiersbleus/.
Grasso, M., and Pedley, H. M. (1990). Neogene and Quaternary sedimentation patterns in the northwestern 699 Hyblean Plateau (SE Sicily): the effects of a collisional process on a foreland margin. Riv. Ital. Paleontol. Stratigr. 96 (2–3), 219–240. doi:10.13130/2039-4942/9035
Guarnieri, P., Pirrotta, C., Barbano, M. S., De Martini, P. M., Pantosti, D., Gerardi, F., et al. (2009). Paleoseismic investigation of historical liquefactions along the Ionian coast of Sicily. J. Earthq. Eng. 13, 68–79. doi:10.1080/13632460802212030
Guarnieri, P., and Pirrotta, C. (2008). The response of drainage basins to the late Quaternary tectonics in the Sicilian side of the Messina Strait (NE Sicily). Geomorphology 95, 260–273. doi:10.1016/j.geomorph.2007.06.013
Guidoboni, E., Ferrari, G., Mariotti, D., Comastri, A., Tarabusi, G., Sgattoni, G., et al. (2018). CFTI5Med, Catalogo dei Forti Terremoti in Italia (461 a.C.-1997) e nell’area Mediterranea (760 a.C.-1500). Rome: Istituto Nazionale di Geofisica e Vulcanologia (INGV). doi:10.6092/ingv.it-cfti5
Gutscher, M. A., Roger, J., Baptista, M. A., Mirando, J. M., and Tinti, S. (2006). Source of the 1693 Catania earthquake and tsunami (southern Italy): new evidence from tsunami modelling of a locked subduction fault plane. Geophys. Res. Lett. 33, L08309. doi:10.1029/2005GL025442
Hack, J. T. (1973). Stream-profile analysis and stream-gradient index. J. Res. U. S. Geol. Surv. 1, 421–429.
Hare, P. W., and Gardner, T. W. (1985). “Geomorphic indicators of vertical neotectonism along converging plate margins, Nicoya Peninsula, Costa Rica,” in Tectonic geomorphology. Proceedings of the 15th annual Binghamton geomorphology symposium. Editors M. Morisawa, and J. T. Hack (Boston, MA: Allen & Unwin), 123–134.
Horton, R. E. (1945). Erosional development of streams and their drainage basins. Hydro-physical approach to quantitative morphology. Geol. Soc. Am. Bull. 56 (3), 275–370. doi:10.1130/0016-7606(1945)56[275:EDOSAT]2.0.CO;2
Jacques, E., Monaco, C., Tapponier, P., Tortorici, L., and Winter, T. (2001). Faulting and earthquake triggering during the 1783 Calabria seismic sequence. Geophys. J. Int. 147, 499–516. doi:10.1046/j.0956-540x.2001.01518.x
Kirby, E., Whipple, K. X., Tang, W., and Chen, Z. (2003). Distribution of active rock uplift along the eastern margin of the Tibetan Plateau: inferences from bedrock channel longitudinal profiles. J. Geophys. Res. 108 (B4), 2217. doi:10.1029/2001JB000861
Lavecchia, G., Ferrarini, F., De Nardis, R., Visini, F., and Barbano, M. S. (2007). Active thrusting as a possible seismogenic source in Sicily (Southern Italy): some insights from integrated structural-kinematic and seismological data. Tectonophysics 445, 145–167. doi:10.1016/j.tecto.2007.07.007
Lentini, F., Carbone, S., and Catalano, S. (1994). Main structural domains of the central Mediterranean region and their Neogene tectonic evolution. Boll. Geofis. Teor. Appl. 36, 141–144.
Maesano, F. E., Tiberti, M. M., and Basili, R. (2020). Deformation and fault propagation at the lateral termination of a subduction zone: the Alfeo fault system in the calabrian arc, Southern Italy. Front. Earth Sci., 8, 107. doi:10.3389/feart.2020.00107
Mariucci, M. T., and Montone, P. (2018). IPSI 1.1, database of Italian present-day stress indicators. Rome: Istituto Nazionale di Geofisica e Vulcanologia (INGV). doi:10.6092/INGV.ITIPSI.1.1
Merritts, D., and Vincent, K. R. (1989). Geomorphic response of coastal streams to low, intermediate, and high rates of uplift, Medocino triple junction region, northern California. Geol. Soc. Am. Bull. 101 (11), 1373–1388. doi:10.1130/0016-874
Michetti, A. M., Esposito, E., Guerrieri, L., Porfido, S., Serva, L., Tatevossian, R., et al. (2007). Environmental seismic intensity scale 2007 – ESI 2007. Memorie descrittive della Carta geologica d’Italia. Roma, Italy: Servizio Geologico d’Italia – Dipartimento Difesa del Suolo, APAT, Vol. 74, 7–54.
Molin, P., Pazzaglia, F. J., and Dramis, F. (2004). Geomorphic expression of the active tectonics in a rapidly-deforming forearc, Sila Massif, Calabria, Southern Italy. Am. J. Sci. 304, 559–589. doi:10.2475/AJS.304.7.559
Mongitore, A. (1743). “Istoria cronologica de’ terremoti di Sicilia,” in Della Sicilia ricercata nelle cose più memorabili. (Palermo, Italy), 445, t. II.
Musumeci, C., Scarfì, L., Palano, M., and Patanè, D. (2014). Foreland segmentation along an active convergent margin: new constraints in southeastern Sicily (Italy) from seismic and geodetic observations. Tectonophysics 630, 137–149. doi:10.1016/j.tecto.2014.05.017.
Nicoletti, P. G. (2005). Inconsistent patterns of historical seismicity and earthquake-triggered landsliding in southeastern Sicily: an alarm bell? Geomorphology 65, 257–278. doi:10.1016/j.geomorph.2004.09.005.
Ouchi, S. (1985). Response of alluvial rivers to slow active tectonic movement. Geol. Soc. Am. Bull. 96, 504–515. doi:10.1130/0016-7606(1985)96<504:ROARTS>2.0.CO;2
Pace, B., Peruzza, L., Lavecchia, G., and Boncio, P. (2006). Layered seismogenic source model and probabilistic seismic-hazard analyses in Central Italy. Bull. Seismol. Soc. Am., 96 (1),107–132. doi:10.1785/0120040231
Palano, M., Ferranti, L., Monaco, C., Mattia, M., Aloisi, M., Bruno, V., et al. (2012). GPS velocity and strain fields in Sicily and southern Calabria, Italy: updated geodetic constraints on tectonic block interaction in the central Mediterranean. J. Geophys. Res. 117, b07401. doi:10.1029/2012JB009254
Paparo, M. A., Armigliato, A., Pagnoni, G., Zaniboni, F., and Tinti, S. (2017). Earthquake-triggered landslides along the Hyblean-Malta Escarpment (off Augusta, eastern Sicily, Italy) – assessment of the related tsunamigenic potential. Adv. Geosci. 44, 1–8. doi:10.5194/adgeo-44-1-2017
Pappalardo, G., Imposa, S., Barbano, M. S., Grassi, S., and Mineo, S. (2018). Study of landslides at the archaeological site of Abakainon necropolis (NE Sicily) by geomorphological and geophysical investigations. Landslides 15, 1279–1297. doi:10.1007/s10346-018-0951-y
Piatanesi, A., and Tinti, S. (1998). A revision of the 1693 eastern Sicily earthquake and tsunami. J. Geophys. Res. 103, 2749–2758.
Pinter, N. (2005). “Applications of tectonic geomorphology for deciphering active deformation in the Pannonian Basin Hungary,” in Proceedings of the workshop on “applications of GPS in plate tectonics in research on fossil energy resources and in earthquake hazard assessment,” Occasional Papers of the Geological Institute of Hungary. Editors L. Fodor, , and K. Brezsnyánszky, 204, 25–51.
Pirrotta, C., and Barbano, M. S. (2011). Analysis of deformation structures in Pliocene and quaternary deposits of the Hyblean plateaux (South-eastern Sicily). Tectonophysics 499, 41–53. doi:10.1016/j.tecto.2010.12.003
Pirrotta, C., Barbano, M. S., Guarnieri, P., and Gerardi, F. (2007). A new dataset and empirical relationships between magnitude/intensity and epicentral distance for liquefaction in central-eastern Sicily. Ann. Geophys. 50, 763–774. doi:10.4401/ag-3055
Pirrotta, C., Barbano, M. S., and Monaco, C. (2016). Evidence of active tectonics in Southern Calabria (Italy) by geomorphic analysis: the examples of the Catona and Petrace rivers. Ital. J. Geosci. 135 (1), 142–156. doi:10.3301/IJG.2015.20
Pirrotta, C., Barbano, M. S., Pantosti, D., and De Martini, P. M. (2013). Evidence of active tectonics in the Augusta basin (eastern Sicily, Italy) by chirp sub-bottom sonar investigation. Ann. Geophys. 56, 1–18. doi:10.4401/ag-6371
Polonia, A., Torelli, L., Gasperini, L., and Mussoni, P. (2012). Active faults and historical earthquakes in the Messina Straits area (Ionian Sea). Nat. Hazards Earth Syst. Sci. 12, 2311–2328. doi:10.5194/nhess-12-2311-2012
Rovida, A., Locati, M., Camassi, R., Lolli, B., and Gasperini, P. (2019). Catalogo Parametrico dei Terremoti Italiani (CPTI15), versione 2.0. Istituto Nazionale di Geofisica e Vulcanologia (INGV). doi:10.13127/CPTI/CPTI15.2
Scandone, P., Patacca, E., Radoicic, R., Ryan, W. B. F., Cita, M. B., Rawson, M., et al. (1981). Mesozoic and cenozoic rocks from the Malta escarpment (central Mediterranean). Am. Assoc. Pet. Geol. Bull. 65, 1299–1319. doi:10.1306/03B5949F-16D1-11D7-8645000102C1865D
Scarfì, L., Messina, A., and Cassisi, C. (2013). Sicily and southern Calabria focal mechanism database: a valuable tool for local and regional stress-field determination. Ann. Geophys. 56 (1), D0109. doi:10.4401/ag-6109
Schmincke, H. U., Behncke, B., Grasso, M., and Raffi, S. (1997). Evolution of the northwestern Hyblean mountains, Sicily: uplift, Pliocene/Pleistocene sea-level changes and volcanism. Geol. Rundsch. 86, 637–669.
Sirovich, L., and Pettenati, F. (2001). Test of source-parameter inversion of the intensities of a 54,000-death shock of the seventeenth century in southeastern Sicily. Bull. Seismol. Soc. Am. 91, 792–811. doi:10.1785/0120000037
Snyder, N., Whipple, K. X., Tucker, G. E., and Merritts, D. J. (2000). Landscape response to tectonic forcing: digital elevation model analysis of stream profiles in the Mendocino triple junction region, northern California. Geol. Soc. Am. Bull. 112, 1250–1263. doi:10.1130/0016-7606(2000)112<1250:LRTTFD>2.0.CO;2
Strahler, A. N. (1952). Hypsometric (area-altitude) analysis of erosional topography. Geol. Soc. Am. Bull. 63, 1117–1142. doi:10.1130/0016-7606(1952)63[1117:HAAOET]2.0.CO;2
Tonini, R., Armigliato, A., Pagnoni, G., Zaniboni, F., and Tinti, S. (2011). Tsunami hazard for the city of Catania, eastern Sicily, Italy, assessed by means of worst-case credible tsunami Scenario analysis (WCTSA). Nat. Hazards Earth Syst. Sci. 11, 1217–1232. doi:10.5194/nhess-11-1217-2011
Torelli, L., Grasso, M., Mazzoldi, G., and Peis, D. (1998). Plio–quaternary tectonic evolution and structure of the Catania foredeep, the northern Hyblean Plateau and the Ionian shelf (SE Sicily). Tectonophysics 298, 209–221. doi:10.1016/S0040-1951(98)00185-1
Vannucci, G., Gasperini, P., Lolli, B., and Gulia, L. (2019). Fast characterization of sources of recent Italian earthquakes from macroseismic intensities. Tectonophysics 750, 70–92. doi:10.1016/j.tecto.2018.11.002
Visini, F., De Nardis, R., Barbano, M. S., and Lavecchia, G. (2009). Testing the seismogenic sources of the January 11th 1693 Sicilian earthquake (Io X/XI): insights from macroseismic field simulations. Ital. J. Geosci. 128 (1), 147–156.
Keywords: seismicity, active tectonics, faults, seismotectonics, Hyblean Plateau, morphotectonic analysis
Citation: Pirrotta C and Barbano MS (2020) New Macroseismic and Morphotectonic Constraints to Infer a Fault Model for the 9 (Mw6.1) and 11 January (Mw7.3) 1693 Earthquakes (Southeastern Sicily). Front. Earth Sci. 8:550851. doi: 10.3389/feart.2020.550851
Received: 10 April 2020; Accepted: 30 September 2020;
Published: 20 November 2020.
Edited by:
Federica Ferrarini, G. d’Annunzio University of Chieti and Pescara, ItalyReviewed by:
Sotiris Sboras, National Observatory of Athens, GreeceCopyright © 2020 Pirrotta and Barbano. This is an open-access article distributed under the terms of the Creative Commons Attribution License (CC BY). The use, distribution or reproduction in other forums is permitted, provided the original author(s) and the copyright owner(s) are credited and that the original publication in this journal is cited, in accordance with accepted academic practice. No use, distribution or reproduction is permitted which does not comply with these terms.
*Correspondence: C. Pirrotta, Yy5waXJyb3R0YUB1bmljdC5pdA==
Disclaimer: All claims expressed in this article are solely those of the authors and do not necessarily represent those of their affiliated organizations, or those of the publisher, the editors and the reviewers. Any product that may be evaluated in this article or claim that may be made by its manufacturer is not guaranteed or endorsed by the publisher.
Research integrity at Frontiers
Learn more about the work of our research integrity team to safeguard the quality of each article we publish.