- 1School of Earth Sciences, University of Western Australia, Perth, WA, Australia
- 2 Institute of Astronomy, Geophysics and Atmospheric Sciences, University of Sao Paulo, Brazil
Eastern Australian hotspots produce the longest continental tracks on Earth (
Introduction
Hotspot tracks are linear arrays of age-progressive volcanoes that mark the surface terminations of upwelling, hot mantle plumes (Wilson, 1963; Morgan, 1971). At their oldest end, hotspots are sometimes associated with a large igneous province, or flood basalt, presumed to denote the arrival of a plume head (Courtillot et al., 2003). The age progressive track that follows is associated with a plume tail, a structure that anchors the hotspot, the plume tail’s surface termination, to lower mantle convection (Steinberger, 2000). Presently active hotspots (e.g., Hawaii, Iceland) have an active volcano and a topographic high (related to the buoyancy flux of material flow from the mantle) above them, as well as a low shear wave velocity (
Hotspot track geometry reflects the relative motion between the tectonic plate and the hotspot, modified to a lesser degree by lateral magma transport along the lithosphere-asthenosphere boundary (Sleep, 1996; Sleep, 1997). Plate motions can be described by rotations about an Euler pole relative to a reference frame (Cox and Hart, 1986). Euler rotations can be defined by fitting the geometry and age progressions of a pair (or more) of hotspot tracks underlying a given plate (e.g., Hawaii and Louisville on the Pacific Plate), defining plate motion relative to the mantle (absolute plate motion), anchoring relative rotation models to a common reference. Commonly Euler rotations are defined relative to a neighboring plate (this is the case when reconstructing seafloor isochrons) and, by combining rotations for multiple plate pairs, a hierarchy can be constructed to define a relative plate rotation model. The observation that hotspot tracks get older in the direction of plate motion led to the early hypothesis that hotspots were stationary in the mantle (Morgan, 1971), and as such, might provide a means for defining a mantle reference frame, so linking surface tectonic processes to the deep Earth. But fixed Pacific hotspot reference frames failed to predict the age progression and geometry of those in the Indo-Atlantic realms (and vice versa) (Molnar and Atwater, 1973; Duncan, 1981; Molnar and Stock, 1987; Müller et al., 1993; Wessel and Kroenke, 2008). Uncertainties in the relative rotations between plates (forming plate circuits), used to translate hotspot geometries from one plate to another were originally hypothesized to account for these misfits, with possible Eocene extension between East and West Antarctica being the supposed cause of misfit between Pacific and Indo-Atlantic fixed hotspot reference frames. Failing to account for all the degrees of freedom when fitting rotations to hotspot tracks also contributed (Andrews et al., 2006) Sharp changes in hotspot track geometry, such as the Hawaiian-Emperor bend have been reproduced by Indo-Atlantic fixed hotspot reference frames by taking this circuit (Torsvik et al., 2017), but relative motion between hotspots is still indicated (the predicted length of the Emperor bend being ∼800 km shorter than observed) (Torsvik et al., 2019).
Relative motion between hotspots, inferred from the misfit between different, fixed hotspot reference frames, indicates that a combination of hotspot motion, non-rigid plate behavior, and errors in plate motions is required to explain them (Wang et al., 2017). Although the rate of relative motion between hotspots is estimated to be quite slow ( 4.5±3.8 mm a−1) (Wang et al., 2017), a new generation of hotspot reference frames emerged, based upon plume conduits embedded within whole-mantle convection cells (Steinberger and O’Connell, 1998; Steinberger, 2000; Torsvik et al., 2008; Doubrovine et al., 2012). Using a plate model for surface boundary conditions, this innovation allowed for hotspot motion, accommodating the motion inferred between earlier, fixed reference frames, while also defining a mantle reference of global extent. Such models predicted that hotspots are anchored by their plume tails to lower mantle return flow, moving away from subduction zones, and toward mid-ocean ridges (Steinberger, 2000).
Paleomagnetism has also proven to be a useful tool for examining hotspot motion, yielding paleolatitude estimates for extinct volcanoes along hotspot tracks. Paleomagnetic data provide latitude constraints with respect to Earth’s geocentric axial dipole (symmetry prevents reconstruction of paleolongitude). If hotspots are fixed in the mantle, and true polar wander (TPW), that is, the rotation of the entire solid Earth (both lithosphere and mantle) with respect to Earth’s axis of rotation were negligible, then paleolatitudes for extinct hotspot volcanoes should be invariant, and coincide with the hotspot’s present day position. On the other hand, if hotspots were moving in latitude, then the paleolatitudes along their tracks should reflect this history. Paleolatitudes for both Hawaii and Kerguelen indicate past motion of these hotspots with respect to the spin axis (Grommé and Vine, 1972; Kono, 1980; Gordon and Cape, 1981; Cox and Gordon, 1984; Tarduno and Cottrell, 1997; Antretter et al., 2002; Tarduno et al., 2003; Doubrovine and Tarduno, 2004; Tarduno, 2007; Tarduno et al., 2009). As such, paleolatitude estimates reflect the combination of any hotspot motion together with TPW. Correcting for TPW involves subtracting absolute plate motion (in the mantle reference frame) from a continent’s apparent polar wander path (APWP), that describes its motion with respect to the rotation axis. Conventionally this is done by rotating paleomagnetic data from the continents to a common reference frame, constructing a global apparent polar wander path (e.g., Torsvik et al., 2012), and then subtracting absolute plate motion away. That said, TPW corrected paleolatitudes for Hawaii and Kerguelen are incompatible with being caused entirely by TPW (Antretter et al., 2002; Torsvik et al., 2017). As such, a component of hotspot drift (with respect to the mantle) has been inferred from these results. Ridge-plume interactions have also been suggested to account for latitude changes at the time these hotspots were passing over or nearby ridges (Site 1140 for Kerguelen and Detroit Seamount for Hawaii, Antretter et al., 2002; Tarduno et al., 2009), suggesting that lithosphere-asthenosphere topography might play some role in augmenting hotspot volcano distribution.
Paleolatitudes for both of these oceanic hotspots were calculated from inclination-only drillcore of seamounts, by determining a virtual geomagnetic latitude (λVGL) for each flow mean inclination (
Intraplate volcanism is widespread in Eastern Australia during the Cenozoic (Figure 1) and provides an ideal natural laboratory to study hotspot motion. Three types of magmatic provinces are classified onshore: 1) central volcanoes are complexes with differentiated magmatic products dominated by early basaltic flows and late-stage, felsic plugs intruding central vents; 2) leucitite suite edifices are low-volume features formed by distinctive potassium-rich, silica-poor lavas; and 3) lava fields are characterized by thin, effusive flows, scoria cones and maars (Wellman and McDougall, 1974). The location and age of lava fields follow no obvious trends (Vasconcelos et al., 2008), and are thought to result from edge-driven convection and shear-induced decompression melting over localized regions of thinner lithosphere (Conrad et al., 2011; Davies and Rawlinson, 2014; Aivazpourporgou et al., 2015; Rawlinson et al., 2017). In contrast, the central volcanoes and leucitite magmatic provinces define clear age-progressive tracks that reflect the Cenozoic motion of Australia over several hotspot anomalies. These tracks provide an important link between hotspots in the Pacific and Indo-Atlantic, and, together with the fact that they have not been used to determine hotspot reference frames, mean that their paleolatitudes provide a useful test case for evaluating the global moving hotspot reference frame (GMHRF), global apparent polar wander pathl (APWP) and their associated TPW estimates (Doubrovine et al., 2012; Torsvik et al., 2012).
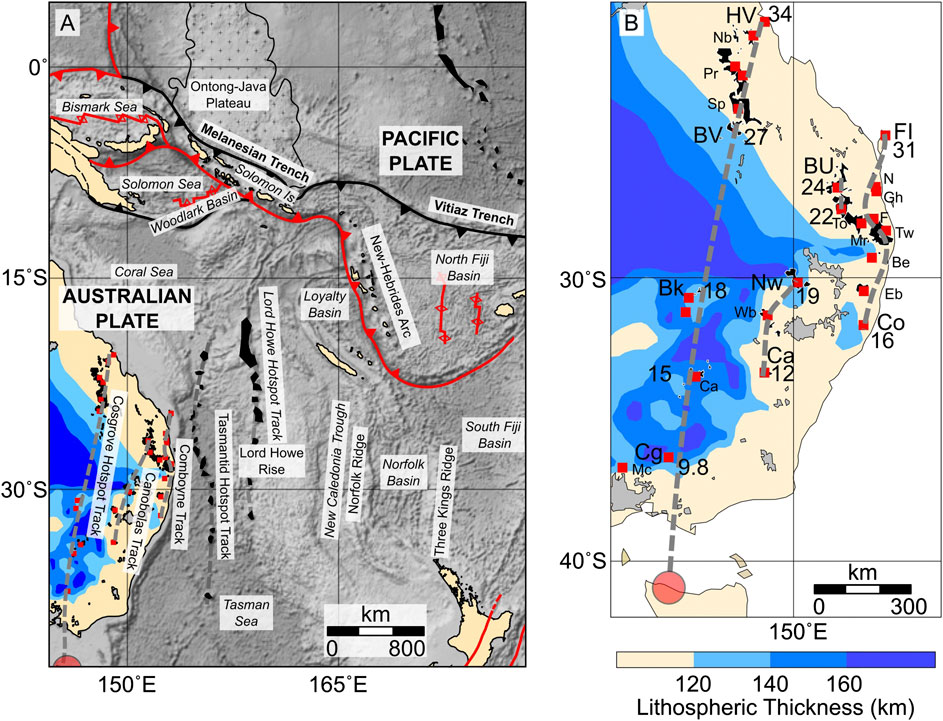
FIGURE 1. Distribution of eastern Australian Cenozoic Volcanism, hotspot tracks and lithospheric thickness. Central volcanic fields are indicated in black, lava field provinces in gray (Wellman and McDougall, 1974). Hotspot tracks are indicated by dashed gray lines, with ages (in Ma) indicated (Cohen et al., 2007; Cohen et al., 2008; Knesel et al., 2008; Sutherland et al., 2012; Cohen et al., 2013). The red circle indicates a 100 km diameter melt region for the Cosgrove hotspot above its present day position as inferred from tomography (Montelli et al., 2006). HV, Hillsborough Volcano; Nb, Nebo Volcano; Pr, Peak Ranges (North and South); Sp, Springsure Volcano; BV, Buckland Volcano; Bk, Byrock Leucitite; Ca, Cargelligo; Cg, Cosgrove Leucitite; Mc, Macedon; FI, Fraser Island; N, Noosa; Gh, Glasshouses; F, Flinders Volcano; Tw, Tweed Volcano; BU, Bunya Volcano; To, Toowoomba Volcano; Mr, Main Range; Be, Belmore Volcano; Eb, Ebor Volcano; Nw, Nandewar Volcano; Wb, Warrumbungle Volcano; Ca, Canobolas Volcano; Co, Comboyne Volcano.
From the roughly North to South trajectory of eastern Australian hotspot tracks, it is generally suggested that the underlying hotspots moved little with respect to one another, and that volcano termination accurately reflects the location of the underlying mantle plume (McDougall and Duncan, 1988; Knesel et al., 2008; Cohen et al., 2013; Crossingham et al., 2017; Mortimer et al., 2018). By applying linear, or segmented linear regression to fit volcano latitude with age along individual tracks, these authors derived rates for Australian plate motion from the slope, although strictly speaking, these estimates represent the relative motion between each hotspot and the Australian plate. Longitude is ignored in these analyses, and although multiple hotspots on the same plate occur, tests for relative motion between these hotspots have not been performed. If the fixed hotspot assumptions are valid, then hotspot tracks will be concentric small circles of one another, as would be expected for plate motion alone over a set of stationary hotspots (Cox and Hart, 1986). As such, the angular distance between pairs of hotspots should remain constant with time (Harada and Hamano, 2000; Wessel et al., 2006). Mantle modeling (dataset S1, Doubrovine et al., 2012) suggests eastern Australian hotspots moved relatively little with respect to one another and the GMHRF (
The Cosgrove track comprises the longest ( ∼2,250 km) and westernmost of Australia’s hotspot tracks, beginning with the formation of Hillsborough Volcano ( 34‐33 Ma) in central Queensland, followed by Nebo, Peak Range, Springsure and Buckland Volcanoes along a
Along the coast of eastern Australia the Comboyne hotspot track defines a SSW trend bookended by Fraser Island (
Two remaining segments of volcanoes also occur onshore, from Bunya-Toowoomba (24–22 Ma), and Nandewar-Canobolas (19–12 Ma), that have been grouped together as the Canobolas hotspot track (Davies et al., 2015), although a track joining these volcanoes would have a large westward offset between Toowoomba and Nandewar volcanos, not observed in either tracks onshore, or the two tracks offshore. The close temporal and spatial association between Bunya-Toowoomba and Main Range-Tweed volcanoes suggest these Bunya-Toowoomba volcanoes might be associated with the Comboyne hotspot, rather than a separate hotspot. The lack of younger volcanoes South of Comboyne and Canobolas volcanoes, together with decreasing estimated volumes of magma at progressively younger volcanoes (Jones and Verdel, 2015) is good evidence that these hotspots are now extinct, their plume tails presumably shearing away once their flux decreased below a critical value (Steinberger and O’Connell, 1998).
In the Tasman Sea are the Tasmantid ( ∼33.5−6.5 Ma) (Crossingham et al., 2017), and Lord Howe (
Materials and Methods
Hotspot Geometries
We performed geometric analyses on hotspot tracks in eastern Australia to evaluate predicted present day positions for them, and to explore the possibility of relative motion between eastern Australian hotspots. To estimate present day positions of hotspots we determined motion paths based upon Doubrovine et al. (2012) plate model, anchored to well dated volcanoes along each track.
Available age data along each track are influenced by geological preservation, and so are not uniformly sampled with time. As such, it is required to approximate track geometry and for this we use spherical splines (Thompson and Clark, 1981). The smoothing parameter controls the trade-off between smoothness of the spline curve, and accuracy of the approximation. Smaller values will more accurately fit the data, but the spline will have greater curvature (smoothing of one will interpolate between points), while greater values will reduce the curvature, by allowing departure of the curve from data. We follow the criteria of Doubrovine et al. (2012) in evaluating appropriate smoothing parameter 1) track geometry should be accurately reproduced, 2) ages along curves should increase monotonically, and 3) the distance between predicted and observed track locations should not exceed 150 km. Angular distances of less than this could conceivably be the result of lateral magma transport between the hotspot melt region and its surface termination (Sleep, 1996; Sleep, 1997). The lack of ages for many of the seamounts along the Lord Howe track is problematic, and we interpolate ages for undated seamounts along this track using our linear latitude model for this track. To test for relative motion between hotspots, we compared angular distance between pairs of tracks using spline fits. If angular distances remain constant with time, we can be confident that particular pair of hotspots have remained stationary with respect to one another. Conversely, changes in this distance over time indicate relative motion between the two hotspots compared.
Paleomagnetic Poles From VGP Level Data
Reconstruction of paleolatitudes using the pole approach requires a robust set of poles over the time interval concerned. For reference, we compare paleomagnetic poles presented in Hansma and Tohver (2019), as this work presents a significant number of new Australian paleomagnetic results, together with a comprehensive review of existing Cenozoic paleomagnetic data. While these poles do justice in reconciling paleomagnetic data with the speading history between Antarctica and Australia, we take advantage of the commonplace overlapping magnetization ages between Australian paleomagnetic studies to systematically determine combined paleomagnetic poles for the Cenozoic interval, accounting for positional uncertainty (
Our reasoning for this approach is justified because although PSV timesacles range from
We provide a synthesis of the extant body of site-level paleomagnetic data for Cenozoic Australia (557 sites total, excluding undated sites from laterites) from studies where basic demagnetization techniques have been performed. Magnetization ages have been updated using modern geochronoloic and biostratigraphic constraints (Figure 2; Supplementary Table S1;). Multiple studies of coeval rocks from different formations allow us to both validate the consistency of results between studies, and also develop a more robust technique for the determination of paleomagnetic poles, compared to traditional grouping of data by individual geologic formation, and subsequent averaging of these formation-based poles. Our new approach returns the calculation of a paleomagnetic pole to site-level statistics, using VGPs of equivalent age, incorporated from potentially multiple coeval geologic formations. We argue that this approach is superior to existing methods because it provides 1) poles for specific age intervals based on the largest possible dataset, 2) a more robust averaging of PSV during intervals constrained by multiple studies, 3) consistent identification of transitional VGPs, and 4) systematic treatment of VGP age uncertainties. A further advantage is that this method reduces to a traditional, study based average in the case of paleomagnetic data that do not overlap in time.
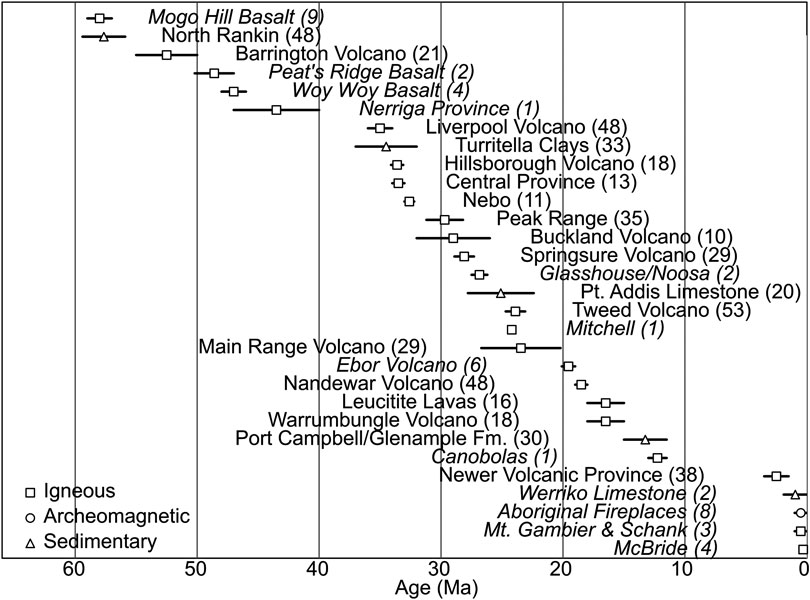
FIGURE 2. Magnetization age bounds for Australian Cenozoic paleomagnetic data. Number of sites indicated in parenthesis. Studies are italicized where limited sampling indicate that secular variation has not been averaged within the region itself.
We compile the directional vector of individual VGPs for each site, together with upper and lower age bounds for the magnetization. Where multiple, comprehensive studies of a province have been conducted, e.g., replication studies of Barrington Volcano (Wellman et al., 1969; Hill et al., 2002), and the Newer Volcanic Province (Rahman, 1971; Opdyke and Musgrave, 2004), we exclude the legacy study to maintain VGP independence, and prevent duplication. We then perform common mean tests between contemporaneous VGPs from different studies formations to ascertain whether the results across coeval intervals are self-consistent. This validation process is described in detail in Hansma and Tohver (2018), Hansma and Tohver (2019), but we note here that blanket demagnetized sites from the Older Volcanics (Mumme, 1963) reject common mean tests with multiple coeval studies, and are for this reason excluded. In some cases common mean testing is rejected marginally [e.g., Oligocene results described in Section 3.5.5 of Hansma and Tohver (2019)], but these all fall within one circular standard deviation of each other. It is plausible that VGPs from these studies, taken individually, each represent a slightly biased sampling of PSV, manifesting itself as slight differences between the means of each study. Rather than selecting a subset here, it is more robust to include all of these results in analysis. Of the 557 VPGs that pass selection, 220 are blanket demagnetized (
By first performing a common means test for contemporaneous VGP populations, we provide a better a priori test for suspect results, giving context to “quality filters” that are generally applied to individual formation-based poles (Van der Voo, 1990; Besse and Courtillot, 2002). Filtering based on a fixed quality score threshold is known to result in false positives and negatives, a caution that was both originally stressed (Van der Voo, 1990) and later reiterated (Van der Voo, 1993). Contextualization of results in the manner described above, followed by examination of their quality scores where differences are identified, does better justice to existing data. It can help minimize the false exclusion of lower score, but otherwise apparently reliable data, while also preventing the inclusion of any suspect data that quality schema fail to recognize.
To calculate poles, we apply a sliding-window approach after determining an optimum window size for the dataset. Two processes contribute to the observed distribution of VGP data with time: 1) short term variation as a consequence of PSV, and 2) long term variation caused by APW. There is a natural trade-off between averaging PSV, which is more reliably achieved with larger intervals, and minimizing the averaging of APW, where the smaller intervals are desirable. To identify the optimum interval we systematically vary the window size from a narrow interval, to progressively larger and larger ones (here from 1 to 20 Ma). At narrow intervals PSV is unlikely to be adequately sampled; as such the variance in VGP scatter across the dataset is expected to be large. As window size is increased, this variance will stabilize as PSV is sampled. Similarly, the median VGP scatter across all intervals is examined for different window sizes and is expected to be unstable when these are narrow, stabilize as PSV is sampled, and then gradually increase as the interval size grows beyond the ideal interval, due to the averaging of increasing amounts of APW together with PSV.
For our dataset, window sizes below 10 Ma produce poles with large ranges of S, indicating that for some intervals of the Cenozoic Australian VGP dataset, such narrow window sizes do not adequately sample PSV (Figure 3). Window sizes
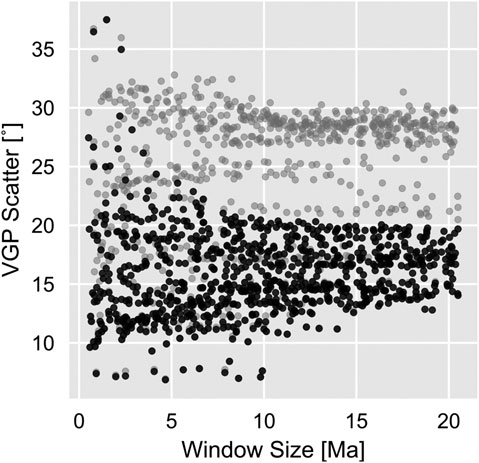
FIGURE 3. Variation in VGP scatter across intervals of increasing window size for Australian VGPs during the Cenozoic. Black points are filtered with a variable VGP cutoff, gray points are unfiltered (each point is randomly jittered about their window size to prevent overplotting by Ma). The wide range of values at interval sizes (
For reference, the procedure for determining poles is depicted in Figure 4, which we will describe in detail here. We calculate a Fisher mean pole where
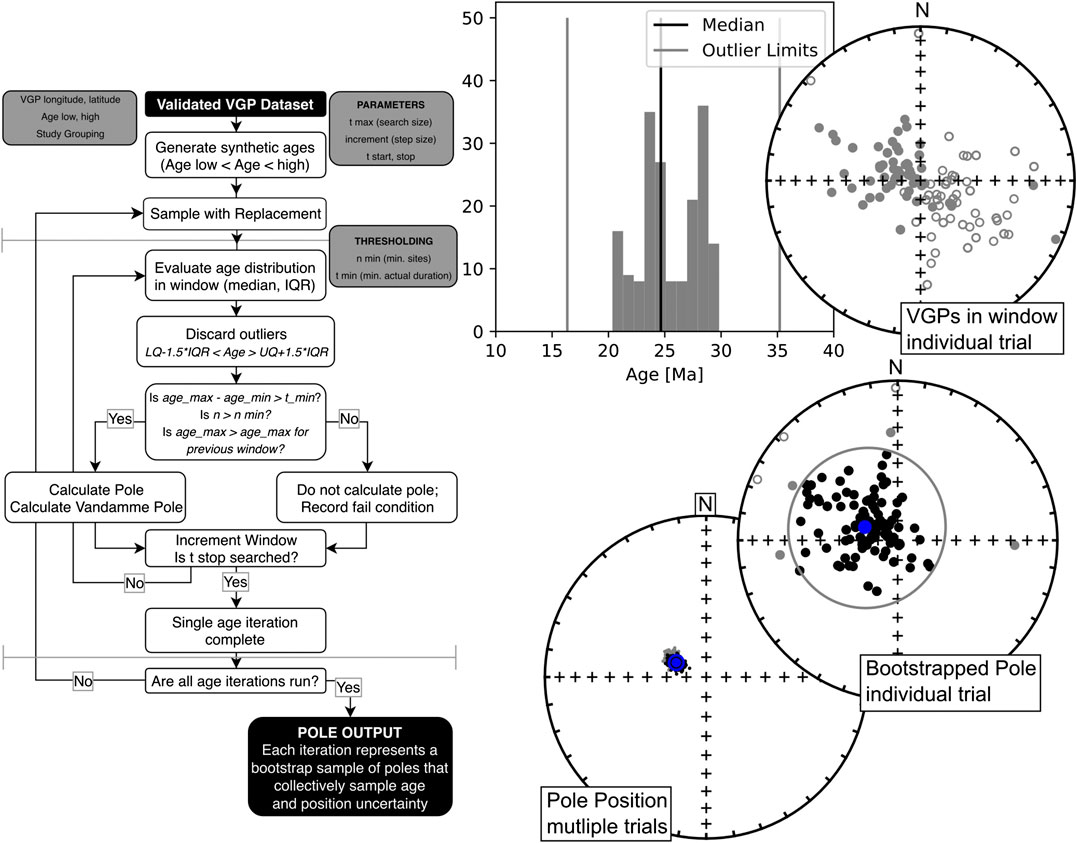
FIGURE 4. Control flow diagram (left) describing method used to generate bootstrapped poles and an accompanying example (right) for the 20–30 Ma search window. t start and t stop represent the age range desired for the entire search (the Cenozoic in this case), t max being the window size. Thresholding rules n min (minimum number of sites) and t min (minimum age range for VGPs in a given interval) can be specified. Thresholding can, of course, be applied to pole results after the fact (by setting n min and t min to zero), but results in longer runtime for reasons described in text. Age distributions within each interval are evaluated first, and thresholding rules applied (in the example histogram these fall beyond the search domain as VGPs are well represented over the interval). A bootstrap paleomagnetic pole is calculated, both including and excluding transitional sites (the example showing the variable VGP cutoff-angle in gray) (Vandamme, 1994). The window is then incremented, and the process repeated for multiple trials until the search is complete, leading to a collection of bootrapped poles from which the pole position and uncertainty can be estimated.
For the Australian Cenozoic dataset, the early Eocene represents a sparsely sampled interval, with a few sites distributed within it. The minimum sites threshold prevents poles from being calculated here. The minimum time interval threshold was chosen to prevent the calculation of poles where the ages of VGPs are concentrated into a narrow range, far below than the 10 Ma suggested by VGP scatter analysis described earlier. In our dataset, this affects one search interval, between 34 and 44 Ma, where VGPs are concentrated in the 2 Ma between 34 and 36 Ma, and there are few VGPs in the remaining 8 Ma (36–44 Ma). Such narrow intervals of VGP averaging are unsatisfactory given VGP scatter analysis (Figure 3) indicating these poles are not robust. Interquartile ranges for sites within this interval were all below 1.5 Ma, with ranges of
There is uncertainty associated with the individual age of every VGP, regardless of accuracy and precision of the geochronological assay of the rock unit. This introduces a source of uncertainty in the set of poles that lie within a given interval, as VGPs with magnetization ages that straddle its boundary may, or may not fall within it. Although this is conventionally ignored in paleomagnetic analysis, we account for this by randomizing the set of VGP ages within their age bounds, and sampling with replacement (1,000 iterations, Supplementary Table S2). When reconstructing a feature over a given interval of time, the 95% confidence region surrounding bootstrapped poles with median ages within the interval is used.
Paleolatitude Reconstruction
Paleolatitudes were calculated using distance between corresponding paleomagnetic poles and sites for both for hotspot volcanoes (where hotspot magmas terminated at the surface and have been dated with geochronologic methods), as well as for the estimated position of each hotspot over time, using aforementioned spline fits (Section 2.1). This was done to quantify hotspot position with respect to the spin axis through time for each hotspot. Individual volcano estimates are based upon available geochronologic data presented in existing literature, following preferred ages of original authors (McDougall et al., 1981; McDougall and Duncan, 1988; Ashley et al., 1995; Cohen et al., 2007; McQueen et al., 2007; Cohen et al., 2008; Mortimer et al., 2010; Sutherland et al., 2012; Cohen et al., 2013; Crossingham et al., 2017; Mortimer et al., 2018; Crossingham et al., 2018a; Crossingham et al., 2018b).
There are two processes that can affect observed paleolatitudes for hotspots, either their independent motion in the mantle, or the changing moment of inertia of the solid Earth (relative rotation between the solid Earth and the spin axis). Paleolatitudes for the present day position of hotspots were corrected for TPW using the preferred synthetic global apparent polar wander path (and its uncertainties) presented in Torsvik et al. (2012) together with the plate rotations relative to the GMHRF presented in Doubrovine et al. (2012), following the procedure described in Torsvik et al. (2017).
Results
Geometric Analysis
The present day position for each hotspot was predicted by defining a motion path anchored to a well dated volcano at the age of activity along each track (Table 1) using the plate model of Doubrovine et al. (2012). The motion paths for each hotspot are depicted in (Figure 5). The estimate for Cosgrove lies close to the position inferred by Montelli et al. (2006), being half a degree farther North in latitude and the same longitude. The estimate for Tasmantid hotspot is remarkably close to that estimated by Courtillot et al. (2003), but the position given by these authors for the latitude of Lord Howe hotspot corresponds to Lord Howe Island, where volcanic rocks are dated at

TABLE 1. Estimated present day positions of eastern Australian hotspots derived from motion paths (Doubrovine et al., 2012), and from hotspot catalogs (Courtillot et al., 2003; Montelli et al., 2006) (in degrees N and E). λ indicates latitude, ϕ indicates longitude.
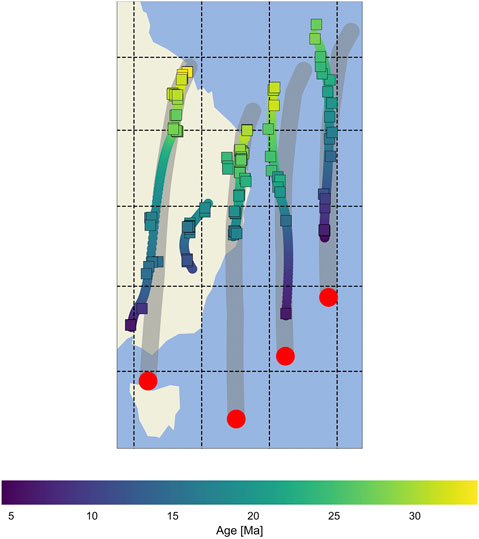
FIGURE 5. Spline fits to eastern Australian hotspots based on geochronologic data (squares, Ashley et al., 1995; McDougall et al., 1981; McDougall and Duncan, 1988; Cohen et al., 2007; McQueen et al., 2007; Cohen et al., 2008; Knesel et al., 2008; Mortimer et al., 2010; Cohen et al., 2013; Crossingham et al., 2017; Mortimer et al., 2018; Crossingham et al., 2018a; Crossingham et al., 2018b; Sutherland et al., 2012). Present day positions are shown in red, based upon motion paths (in gray) derived from Doubrovine et al. (2012) (Table 1).
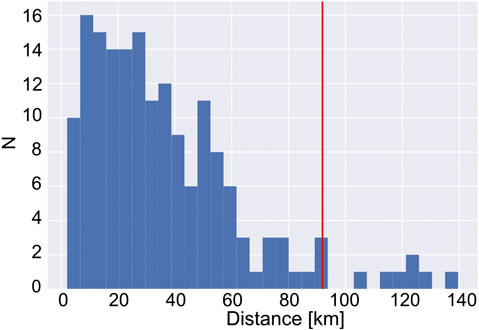
Spline fits (Figure 5) were used to interpolate along hotspot tracks without invoking parametric assumptions inherent to linear models. The spline fit provides the best estimate for the position of the hotspot at any given time because individual volcanoes may not terminate precisely above their hotspot, and volcanism along each track is not always continuous. With one exception, misfits between spline fits and volcanoes are less than our cut-off distance. Only one datum from Comboyne volcano (sample Q83 from Cohen et al., 2007) has a larger misfit (178 km), but other analyses from this same area are suitably fit. The paucity of ages along the Lord Howe hotspot track meant that several seamount ages were interpolated using a linear age-latitude model and the spline fit using these seamounts. The angular distance between predicted hotspot location at any given time and their volcano termination is normally distributed away from the predicted hotspot center, with 2σ = 90 km (Figure 6).
The angular distance between spline fits was used to test for relative motion between hotspot pairs during time intervals where both are active (Figure 7). Cosgrove and Comboyne hotspots appear most constant, but most hotspot pairs accumulate changes in angular distance over time. The cumulative effect of this is generally small, and within the uncertainty of spline misfits for both hotspots (±368 km). The largest angular distance change was between Tasmantid and Lord Howe hotspot tracks (382 km), but ages were interpolated along the track and little significance is placed on this result. The second largest was between Cosgrove and Tasmantid tracks (361 km), but this was still within the uncertainties of the spline fit. While consistent with estimates of the relative motion of eastern Australian hotspots based upon mantle flow modeling (Doubrovine et al., 2012, auxiliary dataset 1) it is not necessary to invoke movement between Australia hotspots to explain the distribution of volcanoes along each of their tracks.
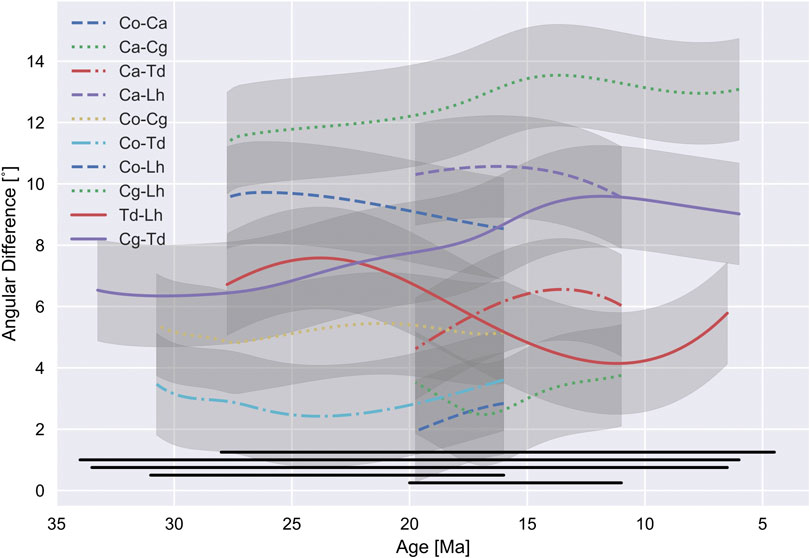
FIGURE 7. Angular difference between hotspot track pairs with respect to time, showing relative motion between eastern Australian hotspots. Gray regions indicate 95% confidence limits. Black horizontal lines indicate range of ages over which each hotspot is active (from bottom to top: Ca, Canobolas; Co, Comboyne; Td, Tasmantid; Cg, Cosgrove; Lh, Lord Howe).
Age vs. latitude trends of Eastern Australian hotspot volcanoes have been used to infer changes in Australian plate speeds during the Oligo-Miocene (Knesel et al., 2008; Cohen et al., 2013), but this interpretation is complicated by misfits between eastern Australian hotspot track geometries (Figure 7). Plate rate changes implied in these studies occur over narrow time intervals and in our analysis equate to only small misfits between volcano termination and predicted position (Figure 6). While they may possibly represent changes in plate speed, they could also reasonably be explained by small amounts (
Cenozoic Poles for Australia
Our combined paleomagnetic poles are in general agreement with APWPs inferred from sea-floor spreading between Australia and Antarctica during the Cenozoic, as well as conventional APWP analysis (Hansma and Tohver, 2019) (Figure 8). Our new approach provides a more continuous record of Australian paleomagnetic poles for intervals that are well-represented by VGPs from penecontemporaneous rock formations. Confidence limits on our poles are more conservative, due to the inclusion of VGP age uncertainties. Pole latitudes change with time at a faster rate after Eocene times, consistent with an increase in Australia-Antarctica spreading rate, from slower NE-SW spreading to faster N-S directed spreading during the Eocene (there is a paucity of Eocene VGP data and more detailed comparison is not possible) (Whittaker et al., 2007; Whittaker et al., 2013). The change in spreading direction, from NE-SW to N-S, cannot currently be resolved from Australian Paleocene paleomagnetic data. For convenience, Table 2 gives a summary of poles within each search window, while Supplementary Table S2 gives results for all bootstrap samples.
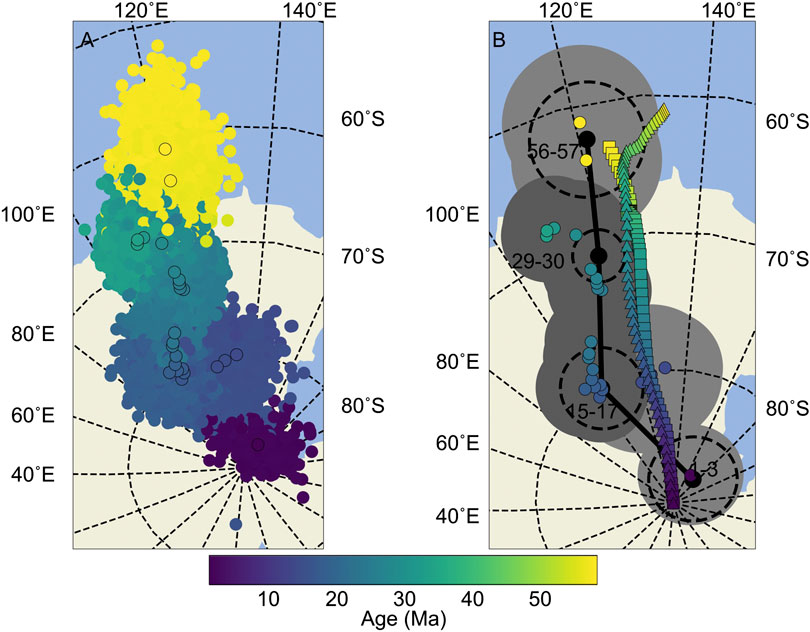
FIGURE 8. Combined Paleomagnetic Poles for Cenozoic Australia. (A) Clusters of similar colored circles without outlines are bootstrap poles, while outlined are markers indicate the poles found in each 10 Ma search window (Table 2). Discontinuities in poles through time occur over intervals where VGP data are insufficient for pole calculation (e.g., between 2–12 Ma). (B) Poles from A. plotted with their
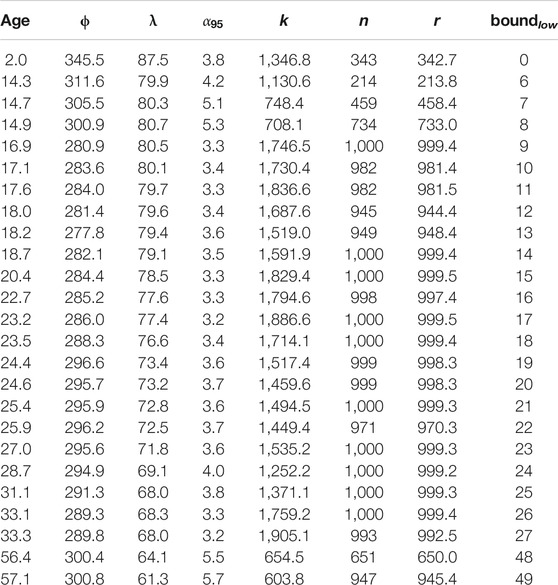
TABLE 2. Summary Poles (Vandamme (1994) filtered) for 10 Ma search intervals (in degrees N and E). Median age assigned to pole (in Ma), λ indicates pole latitude, ϕ indicates pole longitude, with in degrees, k: precision parameter, n: number of valid bootstrap samples (out of 1,000), r: resultant, and indicates low age bound of search window. For bootstrap samples, unfiltered poles and hotspot paleolatitudes interpolated with spline fits see Supplementary Material.
In the 0–10 Ma interval, paleomagnetic data mostly come from the Newer Volcanic Province (Opdyke and Musgrave, 2004), and here our pole calculation reduces to the pole position for these VGPs. This demonstrates that where VGPs from different studies do not overlap continuously in time our method reduces to a conventional pole calculation.
VGP scatter for bootstrapped poles show a decrease from Paleocene times to present day (Figure 9). Australia has moved from high latitudes to lower ones throughout the Cenozoic, and a decrease in VGP scatter is consistent with geomagnetic field models and recent lavas (Tauxe and Kent, 2004). Including transitional VGPs increases the scatter because scatter is sensitive to the presence of outliers. Recent lavas from low latitudes have VGPs that are less scattered than those from higher latitudes, and it is remarkable that such an observation can be observed in aggregate through time for Australia.
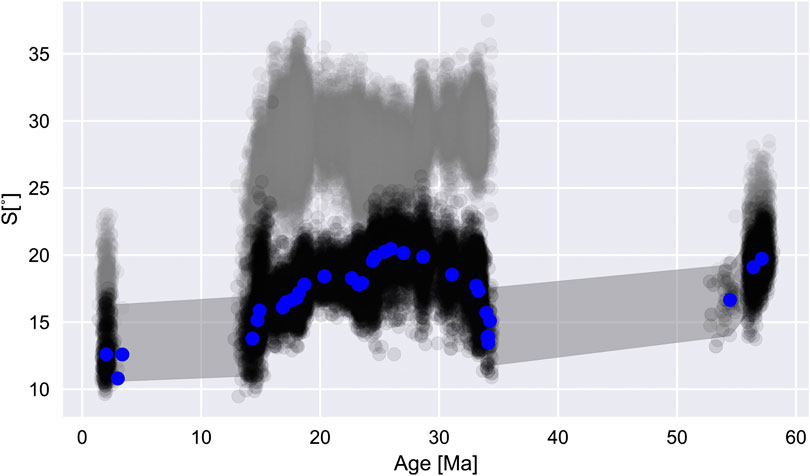
FIGURE 9. VGP scatter and 95% confidence limits with time for Australian Cenozoic paleomagnetic data (1,000 iterations). Black data with indicate filtered values (Vandamme, 1994), with medians given by blue markers. Gray (unfiltered values) are also shown. Marker transparency of 1% per iteration was used. A trend of decreasing VGP scatter with time is consistent with northward motion for Australia, and falls within expected values based on field models (Tauxe and Kent, 2004) over this time interval.
The proportion of transitional sites identified by variable VGP cut-off is possibly, but not clearly related to reversal frequency (Ogg, 2012) (Figure 10). Such a correlation would be expected if transitional sites are chance recordings of magnetic field reversals. Correlation of their normalized values between 15 and 28 Ma, as well as between 55 and 60 Ma is encouraging, but transitional directions are recovered less often than would be expected before 5 Ma, and more often between 28 and 34 Ma. There are numerous reasons for imperfect correlation between these quantities. Transitional VGPs could be over- or under-represented by sampling. Transitional VGPs could reflect magnetic excursions. Other factors that might produce sites with VGPs apparently distant from their means may also play a role (e.g., unrecognized local rotation, local lightning remagnetization, or for the case of blanket demagnetized data, incompletely removed overprints). The interval compared does not contain superchrons, and does not sample intervals of low reversal rate, and as such does not sample the entire range observed for the polarity history of Earth. In spite of this, the correlations between reversal rate and proportion of transitional sites recovered are exciting and warrant further study.
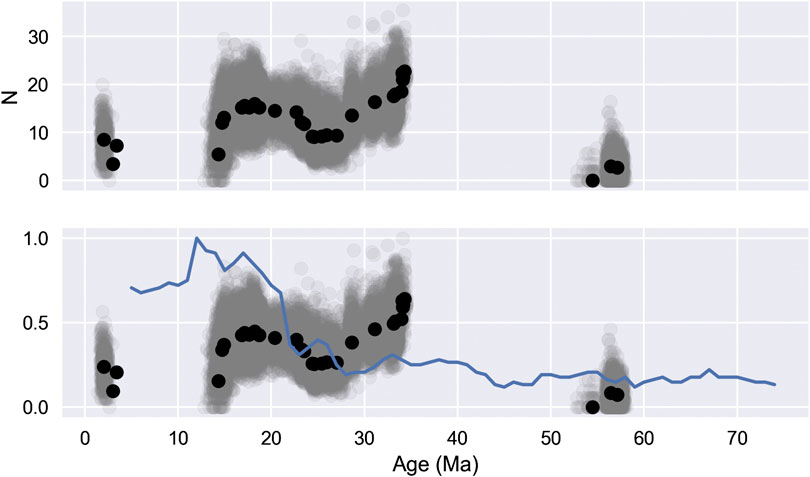
FIGURE 10. Number of transitional sites identified from Australian continental paleomagnetic data (top), and these values normalized, plotted with normalized reversal rate per Ma for 10 Ma intervals (below) (Ogg, 2012).
Paleolatitudes for Australian Hotspots
Despite the relatively large uncertainties inherent in paleomagnetic data and the small effect size expected given TPW manifest since 35 Ma, paleolatitude estimates for eastern Australian hotspots are incompatible with hotspots that are fixed with respect to Earth’s spin axis, but within uncertainty are all compatible with hotspots that are embedded in the convecting deep mantle (Figure 11). Estimates plotted in Figure 11 are tabulated in Supplementary Material. Contemporary estimates of TPW presented here (Doubrovine et al., 2012; Torsvik et al., 2012) have a resolution of 10 Ma, and even at our finer resolution, our results agree remarkably well with these estimates. Within uncertainties, differentiating between TPW models is not possible. Eastern Australian hotspots lie between the Pacific (Hawaii and Louisville) and Atlantic (New England, Reunion and Tristan) hotspots that constitute the basis for the GMHRF. Paleolatitude estimates from eastern Australian hotspots provide important validation of this reference frame for Oligocene and younger times.
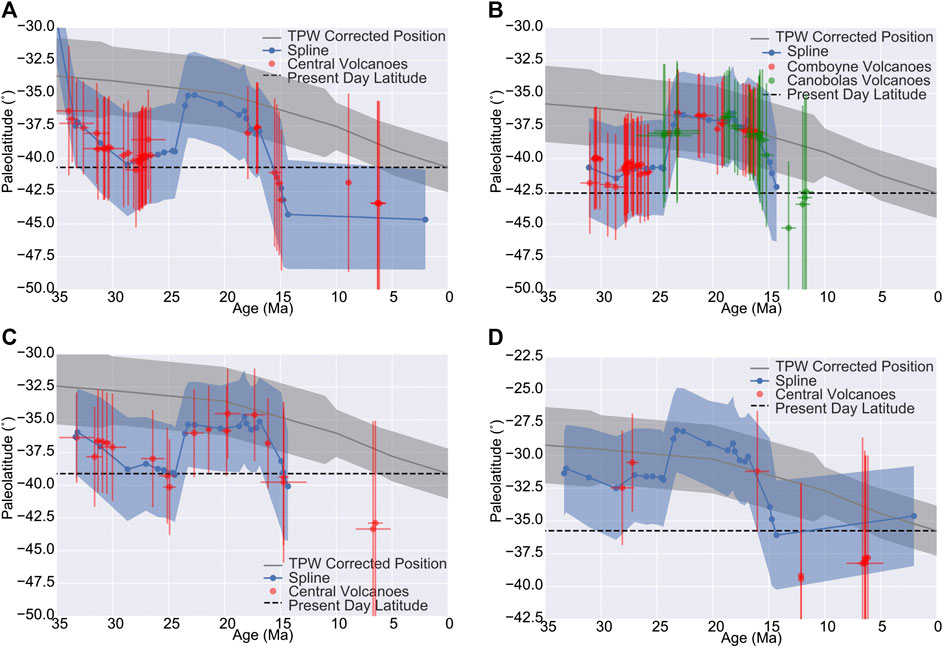
FIGURE 11. Paleolatitudes for the (A) Cosgrove, (B) Comboyne, Canobolas, (C) Tasmantid, and (D) Lord Howe hotspots. Red (and green) data indicate paleolatitude of volcanic rock localities with geochronologic constraint (with
A northward shift of hotspot paleolatitudes between 15 and 24 Ma is observed for both volcanoes and spline interpolated positions along the Comboyne, Canobolas, and Tasmantid tracks, and for interpolated positions along the Cosgrove and Lord Howe tracks where volcano or seamount age data are absent (Table 2). To illustrate the magnitude of this, at 23.2 Ma the Comboyne hotspot paleolatitude is
Before 24 Ma most data plot to the North of a fixed present day hotspot location in the paleomagnetic reference but
Conclusion
The distribution of hotspot volcanoes along tracks in eastern Australia, combined with Australia’s Cenozoic paleomagnetic data indicate that hotspots moved little with respect to one another and were not fixed to the geocentric axial dipole. That the changes in hotspot paleolatitude with respect to the paleomagnetic reference frame are consistent across all of the eastern Australian hotspots is remarkable, especially so as the motion observed corresponds with the predicted amount of true polar wander over the interval for which these hotspots are active (Doubrovine et al., 2012). The results from eastern Australian hotspots, lie between the Pacific and Indo-Atlantic hotspots used to define this prediction, and so provide important validation for the GMHRF and TPW estimate for Oligocene and younger times.
Data Availability Statement
The datasets analyzed for this study are included in the manuscript/Supplementary Material.
Author Contributions
ET and JH both worked on the original idea of reconstructing eastern Australian hotspot paleolatitudes. JH developed the combined pole approach and wrote the Python implementation. ET and JH both wrote and edited the manuscript. We wish to thank both reviewers for their insightful comments that significantly improved the final version of this manuscript.
Funding
The University of Western Australia supported JH with a Robert and Maude Gledden Scholarship and was supported by an Australian Government Research Training Program (RTP) Scholarship. ET acknowledges Visiting Professor Fellowship from the Fundação CAPES.
Conflict of Interest
The authors declare that the research was conducted in the absence of any commercial or financial relationships that could be construed as a potential conflict of interest.
Supplementary Material
The Supplementary Material for this article can be found online at: https://www.frontiersin.org/articles/10.3389/feart.2020.544496/full#supplementary-material
References
Aivazpourporgou, S., Thiel, S., Hayman, P. C., Moresi, L. N., and Heinson, G. (2015). Decompression melting driving intraplate volcanism in Australia: evidence from magnetotelluric sounding. Geophys. Res. Lett. 42, 346–354. doi:10.1002/2014gl060088
Andrews, D. L., Gordon, R. G., and Horner-Johnson, B. C. (2006). Uncertainties in plate reconstructions relative to the hotspots; Pacific-hotspot rotations and uncertainties for the past 68 million years. Geophys. J. Int. 166, 939–951. doi:10.1111/j.1365-246x.2006.03029.x
Antretter, M., Steinberger, B., Heider, F., and Soffel, H. (2002). Paleolatitudes of the Kerguelen hotspot: new paleomagnetic results and dynamic modeling. Earth Planet Sci. Lett. 203, 635–650. doi:10.1016/s0012-821x(02)00841-5
Arason, P., and Levi, S. (2010). Maximum likelihood solution for inclination-only data in paleomagnetism. Geophys. J. Int. 182, 753–771. doi:10.1111/j.1365-246X.2010.04671.x
Ashley, P. M., Duncan, R. A., and Feebrey, C. A. (1995). Ebor Volcano and crescent complex, northeastern new south wales: age and geological development. Aust. J. Earth Sci. 42, 471–480. doi:10.1080/08120099508728217
Besse, J., and Courtillot, V. (2002). Apparent and true polar wander and the geometry of the geomagnetic field over the last 200 Myr. J. Geophys. Res. 107, 6. doi:10.1029/2000JB000050
Butler, R. F. (1992). Paleomagnetism: magnetic domains to geologic terranes. Palo Alto, CA: Blackwell Science.
Chivas, A. R. (1982). Geochemical evidence for magmatic fluids in porphyry copper mineralization. Contrib. Mineral. Petrol. 78, 389–403. doi:10.1007/bf00375201
Cohen, B. E., Knesel, K. M., Vasconcelos, P. M., Thiede, D. S., and Hergt, J. M. (2008). 40Ar/39Ar constraints on the timing and origin of Miocene leucitite volcanism in southeastern Australia 39Ar constraints on the timing and origin of Miocene leucitite volcanism in southeastern Australia. Aust. J. Earth Sci. 55, 407–418. doi:10.1080/08120090701769514
Cohen, B. E., Knesel, K. M., Vasconcelos, P. M., and Schellart, W. P. (2013). Tracking the Australian plate motion through the Cenozoic: constraints from 40Ar/39Ar geochronology 40Ar/39Ar geochronology. Tectonics 32, 1371–1383. doi:10.1002/tect.20084
Cohen, B. E., Vasconcelos, P. M., and Knesel, K. M. (2007). 40Ar/39Ar constraints on the timing of Oligocene intraplate volcanism in southeast Queensland. Aust. J. Earth Sci. 54, 105–125. doi:10.1080/08120090600981483
Conrad, C. P., Bianco, T. A., Smith, E. I., and Wessel, P. (2011). Patterns of intraplate volcanism controlled by asthenospheric shear. Nat. Geosci. 4, 317–321. doi:10.1038/ngeo1111
Courtillot, V., Davaille, A., Besse, J., and Stock, J. (2003). Three distinct types of hotspots in the Earth's mantle. Earth Planet Sci. Lett. 205, 295–308. doi:10.1016/s0012-821x(02)01048-8
Cox, A., and Gordon, R. G. (1984). Paleolatitudes determined from paleomagnetic data from vertical cores. Rev. Geophys. 22, 47–72. doi:10.1029/rg022i001p00047
Cox, A., and Hart, R. (1986). Plate tectonics: how its works. Palo Alto, CA: Blackwell Science Publications.
Crossingham, T. J., Ubide, T., Vasconcelos, P. M., and Mallmann, G. (2018a). Parallel plumbing systems feeding a pair of coeval volcanoes in eastern Australia. J. Petrol. 59, 1035–1066. doi:10.1093/petrology/egy054
Crossingham, T. J., Ubide, T., Vasconcelos, P. M., Knesel, K. M., and Mallmann, G. (2018b). Temporal constraints on magma generation and differentiation in a continental volcano: Buckland, eastern Australia. Lithos 302-303, 341–358. doi:10.1016/j.lithos.2018.01.009
Crossingham, T. J., Vasconcelos, P. M., Cunningham, T., and Knesel, K. M. (2017). 40Ar/39Ar geochronology and volume estimates of the Tasmantid Seamounts: support for a change in the motion of the Australian plate 39Ar geochronology and volume estimates of the Tasmantid Seamounts: support for a change in the motion of the Australian plate. J. Volcanol. Geoth. Res. 343, 95–108. doi:10.1016/j.jvolgeores.2017.06.014
Davies, D. R., Rawlinson, N., Iaffaldano, G., and Campbell, I. H. (2015). Lithospheric controls on magma composition along Earth’s longest continental hotspot track. Nature 525, 511–514. doi:10.1038/nature14903
Davies, D. R., and Rawlinson, N. (2014). On the origin of recent intraplate volcanism in Australia. Geology 42, 1031–1034. doi:10.1130/g36093.1
Doubrovine, P., and Tarduno, J. (2004). Late Cretaceous paleolatitude of the Hawaiian hot spot: new paleomagnetic data from Detroit Seamount (ODP Site 883). Geochem. Geophys. Geosyst. 5, Q11L04. doi:10.1029/2004gc000745
Doubrovine, P. V., Steinberger, B., and Torsvik, T. H. (2012). Absolute plate motions in a reference frame defined by moving hot spots in the Pacific, Atlantic, and Indian oceans. J. Geophys. Res. 117, 30. doi:10.1029/2011jb009072
Duncan, R. A. (1981). Hotspots in the Southern Oceans—an absolute frame of reference for motion of the Gondwana continents. Tectonophysics 74, 29–42. doi:10.1016/0040-1951(81)90126-8
French, S. W., and Romanowicz, B. (2015). Broad plumes rooted at the base of the Earth’s mantle beneath major hotspots. Nature 525, 95–99. doi:10.1038/nature14876
Gordon, R. G., and Cape, C. D. (1981). Cenozoic latitudinal shift of the Hawaiian hotspot and its implications for true polar wander. Earth Planet Sci. Lett. 55, 37–47. doi:10.1016/0012-821x(81)90084-4
Grommé, S., and Vine, F. J. (1972). Paleomagnetism of Midway Atoll lavas and northward movement of the Pacific plate. Earth Planet Sci. Lett. 17, 159–168. doi:10.1016/0012-821x(72)90271-3
Hackman, B. (1980). The geology of Guadalcanal. Solomon Islands: Overseas memoir of the Institute of Geological Sciences, Vol. 6, 115.
Hansma, J., and Tohver, E. (2018). Palaeomagnetism of mid-Miocene leucitite volcanics in eastern Australia. Geophys. J. Int. 215, 303–313. doi:10.1093/gji/ggy281
Hansma, J., and Tohver, E. (2019). Paleomagnetism of Oligocene hot spot volcanics in central Queensland, Australia. J. Geophys. Res. Solid Earth 124, 6280–6296. doi:10.1029/2019JB017639
Harada, Y., and Hamano, Y. (2000). “Recent progress on the plate motion relative to hotspots,” in The history and dynamics of global plate motions. Editors Richards, M. A., Gordon, R. G., and van der Hilst, R. D. (Washington, DC: American Geophysical Union), 121. 327–338.
Hill, M. J., Gratton, M. N., and Shaw, J. (2002). Palaeomagnetic investigation of Tertiary lava from Barrington Tops, NSW, Australia, using thermal and microwave techniques. Earth Planet Sci. Lett. 198, 245–256. doi:10.1016/s0012-821x(02)00534-4
Jones, I., and Verdel, C. (2015). Basalt distribution and volume estimates of Cenozoic volcanism in the Bowen Basin region of eastern Australia: implications for a waning mantle plume. Aust. J. Earth Sci. 62, 255–263. doi:10.1080/08120099.2015.997796
Jones, I., Verdel, C., Crossingham, T., and Vasconcelos, P. (2017). Animated reconstructions of the Late Cretaceous to Cenozoic northward migration of Australia, and implications for the generation of east Australian mafic magmatism. Geosphere 13, 460–481. doi:10.1130/ges01405.1
Kirschvink, J. L. (1980). The least-squares line and plane and the analysis of palaeomagnetic data. Geophys. J. Int. 62, 699–718. doi:10.1111/j.1365-246x.1980.tb02601.x
Knesel, K. M., Cohen, B. E., Vasconcelos, P. M., and Thiede, D. S. (2008). Rapid change in drift of the Australian plate records collision with Ontong Java plateau. Nature 454, 754. doi:10.1038/nature07138
Kono, M. (1980). Initial reports of the deep sea drilling project. Washington, DC: U.S. Government Printing Office, Vol. 55.
Matthews, K. J., Maloney, K. T., Zahirovic, S., Williams, S. E., Seton, M., and Müller, R. D. (2016). Global plate boundary evolution and kinematics since the late Paleozoic. Glob. Planet. Change 146, 226–250. doi:10.1016/j.gloplacha.2016.10.002
McDougall, I., and Duncan, R. A. (1988). Age progressive volcanism in the Tasmantid seamounts. Earth Planet Sci. Lett. 89, 207–220. doi:10.1016/0012-821x(88)90173-2
McDougall, I., Embleton, B. J. J., and Stone, D. B. (1981). Origin and evolution of Lord Howe Island, southwest pacific ocean. Aust. J. Earth Sci. 28, 155–176. doi:10.1080/00167618108729154
McElhinny, M. W., Embleton, B. J. J., and Wellman, P. (1974). A synthesis of Australian Cenozoic palaeomagnetic results. Geophys. J. Int. 36, 141–151. doi:10.1111/j.1365-246x.1974.tb03629.x
McFadden, P. L., and Reid, A. B. (1982). Analysis of palaeomagnetic inclination data. Geophys. J. Int. 69, 307–319. doi:10.1111/j.1365-246x.1982.tb04950.x
McQueen, K. G., Gonzalez, O. R., Roach, I. C., Pillans, B. J., Dunlap, W. J., and Smith, M. L. (2007). Landscape and regolith features related to Miocene leucitite lava flows, el capitan northeast of cobar, new south wales. Aust. J. Earth Sci. 54, 1–17. doi:10.1080/08120090600923311
Molnar, P., and Atwater, T. (1973). Relative motion of hot spots in the mantle. Nature 246, 288–291. doi:10.1038/246288a0
Molnar, P., and Stock, J. (1987). Relative motions of hotspots in the pacific, atlantic and Indian oceans since late cretaceous time. Nature 327, 587–591. doi:10.1038/327587a0
Montelli, R., Nolet, G., Dahlen, F. A., and Masters, G. (2006). A catalogue of deep mantle plumes: new results from finite-frequency tomography. Geochem. Geophys. Geosyst. 7, Q11007. doi:10.1029/2006gc001248
Morgan, W. J. (1971). Convection plumes in the lower mantle. Nature 230, 42–43. doi:10.1038/230042a0
Mortimer, N., Gans, P. B., Meffre, S., Martin, C. E., Seton, M., Williams, S., et al. (2018). Regional volcanism of northern Zealandia: post-Gondwana break-up magmatism on an extended, submerged continent. Geol. Soc. Spec. Pub. 463, 199–226. doi:10.1144/sp463.9
Mortimer, N., Gans, P. B., Palin, J. M., Meffre, S., Herzer, R. H., and Skinner, D. N. B. (2010). Location and migration of Miocene-Quaternary volcanic arcs in the SW Pacific region. J. Volcanol. Geotherm. Res. 190, 1–10. doi:10.1016/j.jvolgeores.2009.02.017
Mumme, W. G. (1963). Thermal and alternating magnetic field demagnetization experiments on Cainozoic basalts from Victoria, Australia. Geophys. J. Int. 7, 314–327. doi:10.1111/j.1365-246x.1963.tb05553.x
Müller, R. D., Royer, J.-Y., and Lawver, L. A. (1993). Revised plate motions relative to the hotspots from combined Atlantic and Indian Ocean hotspot tracks. Geology 21, 275–278. doi:10.1130/0091-7613(1993)021<0275:rpmrtt>2.3.co;2
Musgrave, R. J. (1990). Paleomagnetism and tectonics of malaita, Solomon Islands. Tectonics 9, 735–759. doi:10.1029/tc009i004p00735
Musgrave, R. J. (2013). Evidence for late Eocene emplacement of the malaita terrane, Solomon Islands: implications for an even larger Ontong java nui oceanic plateau. J. Geophys. Res. Solid Earth 118, 2670–2686. doi:10.1002/jgrb.50153
Ogg, J. (2012). “Geomagnetic polarity time scale,” in The geologic time scale. New York, NY: Elsevier. 85–113.
Opdyke, N. D., and Musgrave, R. (2004). Paleomagnetic results from the Newer Volcanics of Victoria: contribution to the time averaged field initiative. Geochem. Geophys. Gepsyst. 5, Q03H09. doi:10.1029/2003gc000632
Petterson, M. G., Babbs, T., Neal, C. R., Mahoney, J. J., Saunders, A. D., Duncan, R. A., et al. (1999). Geological-tectonic framework of Solomon Islands, SW Pacific: crustal accretion and growth within an intra-oceanic setting. Tectonophysics 301, 35–60. doi:10.1016/s0040-1951(98)00214-5
Petterson, M. G., Neal, C. R., Mahoney, J. J., Kroenke, L. W., Saunders, A. D., Babbs, T. L., et al. (1997). Structure and deformation of north and central Malaita, Solomon Islands: tectonic implications for the Ontong Java Plateau-Solomon arc collision, and for the fate of oceanic plateaus. Tectonophysics 283, 1–33. doi:10.1016/s0040-1951(97)00206-0
Rahman, A.-u. (1971). Palaeomagnetic secular variation for recent normal and reversed epochs, from the newer volcanics of victoria, Australia. Geophys. J. Int. 24, 255–269. doi:10.1111/j.1365-246x.1971.tb02177.x
Rawlinson, N., Davies, D. R., and Pilia, S. (2017). The mechanisms underpinning Cenozoic intraplate volcanism in eastern Australia: insights from seismic tomography and geodynamic modeling. Geophys. Res. Lett. 44, 9681–9690. doi:10.1002/2017gl074911
Seton, M., Müller, R. D., Zahirovic, S., Gaina, C., Torsvik, T., Shephard, G., et al. (2012). Global continental and ocean basin reconstructions since 200Ma. Earth Sci. Rev. 113, 212–270. doi:10.1016/j.earscirev.2012.03.002
Sleep, N. H. (1996). Lateral flow of hot plume material ponded at sublithospheric depths. J. Geophys. Res. 101, 28065–28083. doi:10.1029/96jb02463
Sleep, N. H. (1997). Lateral flow and ponding of starting plume material. J. Geophys. Res. 102, 10001–10012. doi:10.1029/97jb00551
Steinberger, B. (2000). Plumes in a convecting mantle: models and observations for individual hotspots. J. Geophys. Res. 105, 11127–11152. doi:10.1029/1999jb900398
Steinberger, B., and O’Connell, R. J. (1998). Advection of plumes in mantle flow: implications for hotspot motion, mantle viscosity and plume distribution. Geophys. J. Int. 132, 412–434. doi:10.1046/j.1365-246x.1998.00447.x
Sutherland, F. L., Graham, I. T., Meffre, S., Zwingmann, H., and Pogson, R. E. (2012). Passive-margin prolonged volcanism, East Australian Plate: outbursts, progressions, plate controls and suggested causes. Aust. J. Earth Sci. 59, 983–1005. doi:10.1080/08120099.2012.688293
Tarduno, J. A. (2007). On the motion of Hawaii and other mantle plumes. Chem. Geol. 241, 234–247. doi:10.1016/j.chemgeo.2007.01.021
Tarduno, J. A., and Cottrell, R. D. (1997). Paleomagnetic evidence for motion of the Hawaiian hotspot during formation of the Emperor seamounts. Earth Planet Sci. Lett. 153, 171–180. doi:10.1016/s0012-821x(97)00169-6
Tarduno, J. A., Duncan, R. A., Scholl, D. W., Cottrell, R. D., Steinberger, B., Thordarson, T., et al. (2003). The emperor seamounts: southward motion of the Hawaiian hotspot plume in Earth’s mantle. Science 301, 1064–1069. doi:10.1126/science.1086442
Tarduno, J., Bunge, H.-P., Sleep, N., and Hansen, U. (2009). The bent Hawaiian-Emperor hotspot track: inheriting the mantle wind. Science 324, 50–53. doi:10.1126/science.1161256
Tauxe, L., Constable, C., Johnson, C. L., Koppers, A. A., Miller, W. R., and Staudigel, H. (2003). Paleomagnetism of the southwestern USA recorded by 0–5 Ma igneous rocks. Geochem. Geophys. Geosyst. 4, 8802. doi:10.1029/2002gc000343
Tauxe, L., and Kent, D. (2004). “A simplified statistical model for the geomagnetic field and the detection of shallow bias in paleomagnetic inclinations: was the ancient magnetic field dipolar?,” in Timescales of the paleomagnetic field. Editors Channell, J. E. T., Kent, D. V., Lowrie, W., and Meert, J. G. (Washington, DC: American Geophysical Union), 145, 101–116.
Tauxe, L., Kylstra, N., and Constable, C. (1991). Bootstrap statistics for paleomagnetic data. J. Geophys. Res. 96, 11723–11740. doi:10.1029/91jb00572
Thompson, R., and Clark, R. M. (1981). Fitting polar wander paths. Phys. Earth Planet. In. 27, 1–7. doi:10.1016/0031-9201(81)90082-0
Torsvik, T. H., Doubrovine, P. V., Steinberger, B., Gaina, C., Spakman, W., and Domeier, M. (2017). Pacific plate motion change caused the Hawaiian-emperor bend. Nat. Commun. 8, 1–12. doi:10.1038/ncomms15660
Torsvik, T. H., Müller, R. D., Van der Voo, R., Steinberger, B., and Gaina, C. (2008). Global plate motion frames: toward a unified model. Rev. Geophys. 46, RG3004. doi:10.1029/2007rg000227
Torsvik, T. H., Steinberger, B., Shephard, G. E., Doubrovine, P. V., Gaina, C., Domeier, M., et al. (2019). Pacific‐panthalassic reconstructions: overview, errata and the way forward. Geochem. Geophys. Geosyst. 20, 3659–3689. doi:10.1029/2019gc008402
Torsvik, T. H., Van der Voo, R., Preeden, U., Mac Niocaill, C., Steinberger, B., Doubrovine, P. V., et al. (2012). Phanerozoic polar wander, palaeogeography and dynamics. Earth Sci. Rev. 114, 325–368. doi:10.1016/j.earscirev.2012.06.007
Van der Voo, R. (1990). The reliability of paleomagnetic data. Tectonophysics 184, 1–9. doi:10.1016/0040-1951(90)90116-p
Van der Voo, R. (1993). Paleomagnetism of the atlantic, tethys, and iapetus oceans. Cambridge, United Kingdom: Cambridge University Press.
Vandamme, D. (1994). A new method to determine paleosecular variation. Phys. Earth Planet. In. 85, 131–142. doi:10.1016/0031-9201(94)90012-4
Vasconcelos, P. M., Knesel, K. M., Cohen, B. E., and Heim, J. A. (2008). Geochronology of the Australian Cenozoic: a history of tectonic and igneous activity, weathering, erosion, and sedimentation. Aust. J. Earth Sci. 55, 865–914. doi:10.1080/08120090802120120
Wang, C., Gordon, R. G., and Zhang, T. (2017). Bounds on geologically current rates of motion of groups of hot spots. Geophys. Res. Lett. 44, 6048–6056. doi:10.1002/2017gl073430
Wellman, P., and McDougall, I. (1974). Cainozoic igneous activity in eastern Australia. Tectonophysics 23, 49–65. doi:10.1016/0040-1951(74)90110-3
Wellman, P., McElhinny, M. W., and McDougall, I. (1969). On the polar-wander path for Australia during the Cenozoic. Geophys. J. Int. 18, 371–395. doi:10.1111/j.1365-246x.1969.tb03575.x
Wessel, P., Harada, Y., and Kroenke, L. W. (2006). Toward a self-consistent, high-resolution absolute plate motion model for the Pacific. Geochem. Geophys. Geosyst. 7, Q03L12. doi:10.1029/2005GC001000
Wessel, P., and Kroenke, L. (2008). Pacific absolute plate motion since 145 Ma: an assessment of the fixed hotspot hypothesis. J. Geophys. Res. 113, 21. doi:10.1029/2007jb005499
Whittaker, J. M., Müller, R. D., Leitchenkov, G., Stagg, H., Sdrolias, M., Gaina, C., et al. (2007). Major Australian-Antarctic plate reorganization at Hawaiian-Emperor Bend time. Science 318, 83–86. doi:10.1126/science.1143769
Whittaker, J. M., Williams, S. E., and Müller, R. D. (2013). Revised tectonic evolution of the eastern Indian Ocean. Geochem. Geophys. Geosyst. 14, 1891–1909. doi:10.1002/ggge.20120
Keywords: paleomagnetism, hotspots, true polar wander, combined poles, Australia, Cenozoic
Citation: Hansma J and Tohver E (2020) Southward Drift of Eastern Australian Hotspots in the Paleomagnetic Reference Frame Is Consistent With Global True Polar Wander Estimates. Front. Earth Sci. 8:544496. doi:10.3389/feart.2020.544496
Received: 21 March 2020; Accepted: 29 September 2020;
Published: 06 November 2020.
Edited by:
Anita Di Chiara, Istituto Nazionale di Geofisica e Vulcanologia (INGV), ItalyReviewed by:
Augusto Ernesto Rapalini, University of Buenos Aires, ArgentinaGary Dean Acton, Texas A&M University, United States
Copyright © 2020 Hansma and Tohver. This is an open-access article distributed under the terms of the Creative Commons Attribution License (CC BY). The use, distribution or reproduction in other forums is permitted, provided the original author(s) and the copyright owner(s) are credited and that the original publication in this journal is cited, in accordance with accepted academic practice. No use, distribution or reproduction is permitted which does not comply with these terms.
*Correspondence: Jeroen Hansma, amVyb2VuLmhhbnNtYUBleHhvbm1vYmlsLmNvbQ==
 Jeroen Hansma
 Eric Tohver2