- 1Yellow River Institute of Hydraulic Research, Yellow River Conservancy Commission, Zhengzhou, China
- 2Key Laboratory of Soil and Water Loss Process and Control in the Loess Plateau, MWR, Yellow River Institute of Hydraulic Research, Zhengzhou, China
- 3Yellow River Conservancy Commission, Zhengzhou, China
The Yellow River is one of the rivers with the largest amount of sediment in the world. The amount of incoming sediment has an important impact on water resources management, sediment regulation schemes, and the construction of water conservancy projects. The Loess Plateau is the main source of sediment in the Yellow River Basin. Floods caused by extreme precipitation are the primary driving forces of soil erosion in the Loess Plateau. In this study, we constructed the extreme precipitation scenarios based on historical extreme precipitation records in the main sediment-yielding area in the middle reaches of the Yellow River. The amount of sediment yield under current land surface conditions was estimated according to the relationship between extreme precipitation and sediment yield observations in the historical period. The results showed that the extreme rainfall scenario of the study area reaches to 159.9 mm, corresponding to a recurrence period of 460 years. The corresponding annual sediment yield under the current land surface condition was range from 0.821 billion tons to 1.899 billion tons, and the median annual sediment yield is 1.355 billion tons, of which more than 91.9% of sediment yields come from the Hekouzhen to Longmen sectionand the Jinghe River basin. Therefore, even though the vegetation of the Loess Plateau has been greatly improved, and a large number of terraces and check dams have been built, the flood control and key project operation of the Yellow River still need to be prepared to deal with the large amount of sediment transport.
Introduction
Global warming increases the water holding capacity of the atmosphere, which is expected to increase the probability of extreme precipitation at the regional scale (Meehl et al., 2000; IPCC, 2012). Extreme climate events have received increasingly attentions in hydro-meteorological research since they are the driving forces behind many natural disasters, such as floods and landslides (Alexander et al., 2006; Du et al., 2013). Extreme precipitation also plays a key role in soil erosion processes (Frich et al., 2002; Trenberth, 2011; Fischer et al., 2012). The amount of soil erosion caused by a rainstorm can account for 60% or even more than 90% of the total annual erosion (Wang et al., 2016; Comino et al., 2017).
Many studies have investigated the effects of extreme precipitation on sediment yields worldwide. Buendia et al. (2015) found that when extreme rainfall changed in the Mediterranean region, river sediment discharge significantly decreased or increased. Zhong et al. (2017) found that there was a significant correlation between the river sediment discharge and extreme precipitation indicators in the Songhua River basin, China. Keo et al. (2018) analyzed the change in rainfall erosivity over the past 50 years in the Loess Plateau and found that extreme rainfall was the main factor affecting soil erosion. By combining climate models with hydrological models, Garbrecht et al. (2014) indicated that the amount of sediment discharge in different basins in the United States would increase by 127–157% compared with the period of 1970–1999 due to the increase in extreme precipitation events. Kao and Milliman (2008) found that the sediment discharge during the transit of Typhoon Dandelion was twice the average annual sediment discharge. Moreover, many studies have found that even if the total precipitation is constant, the increase in rainfall intensity will cause an increase in soil erosion (Nearing et al., 2005; Garbrecht et al., 2014).
The Yellow River is one of the rivers with the highest sediment content in the world. About 90% of the sediment comes from the Loess Plateau in the middle reaches of the YRB (Wang et al., 2007). The average annual sediment discharge at the Shanxian section of the YRB was 1.6 billion tons during the period 1919–1959, and the maximum sediment discharge was 3.91 billion tons in 1933. However, the sediment discharge of the YRB has gradually decreased since 1980. The average annual sediment discharge from 2000 to 2018 was only 250 million tons, of which the maximum was 620 million tons in 2003. The prediction of the sediment discharge is essential in the YRB, which directly affects the water resources management and planning, the allocation of sediment resources, and the application of water conservancy projects. Therefore, the causes of the changes in sediment yields have been the focus of previous studies on the YRB since the 1990s (Liu et al., 2014a; Shi and Wang, 2015; Xin et al., 2015; Dang et al., 2018; Zhao et al., 2018). Many studies have been carried out on the causes of sediment reduction, changes in precipitation and their effects on sediment discharge, and changes in extreme precipitation in the YRB (Miao et al., 2011; Wang et al., 2016; Gao et al., 2017; Gao and Wang, 2017; Zhang et al., 2018; Dang et al., 2019).
In terms of the impact of extreme precipitation on the sediment discharge of the YRB, some scholars have carried out comparative analyses of some small watersheds in the middle reaches of the YRB. Ran et al. (2015) analyzed the effects of soil and water conservation measures on the sediment discharge of the Jialu River Basin during an extraordinary rainstorm in 2012. Cheng et al. (2016) revealed the impact of changes in precipitation of different intensities on sediment discharge in the Yanhe River Basin and found that with the increase in precipitation intensity, the impact of precipitation on sediment discharge gradually increased. Jiao et al. (2017) analyzed the effects of vegetation changes on sediment yield during heavy rainstorms in the Yanhe River Basin in 2013. Chen et al. (2018) performed a comparative analysis of the changes in sediment discharge and the causes of two heavy rainstorms in the Yanhe River Basin in 1977 and 2013. These studies have analyzed the impact of heavy rainfall on the sediment discharge in a typical year in a tributary in the middle reaches of the YRB, and there are still few studies on the prediction of the possible sediment yield of the YRB under large-scale extreme precipitation in the Loess Plateau. However, the average annual sediment yield and the maximum sediment yield in the case of extreme rainstorms are both important basic data influencing the decisions about major issues in the management of the YRB, among which the maximum sediment yield is more important for the arrangement and application of major water conservancy projects.
In the context of substantial vegetation improvement and large-scale construction of soil and water conservation projects in the Loess Plateau (Liu et al., 2014a; Fu et al., 2017), the maximum sediment yield of the YRB in the event of extreme rainfall in the future has received increasing concerns. Floods caused by extreme precipitation is the key driving force for soil erosion and sediment yield. In this study, the main sediment-yielding area in the middle reaches of the YRB was taken as the study area, and extreme precipitation scenarios were constructed based on the analysis of historical extreme precipitation. According to recent sediment yield indicators and the relationship between precipitation and sediment yield, the corresponding sediment yield under the current surface conditions in the study area was analyzed.
Material and Methods
Study Area
The sediment in the YRB mainly comes from the Loess Plateau in the middle reaches. Considering that the sediment from the Fenhe River Basin has been stable at extremely low levels in the past 40 years, it is not included in the study area. Therefore, the study area in this article includes four subregions, namely, the HLR, the area above Liujiahe in the Beiluo River Basin (BLR), the area above Jingcun in the Jinghe River Basin (JHR), and the area above Tuoshi in the Weihe River Basin (WHR), also known as the main sediment yield region of the YRB (Figure 1).
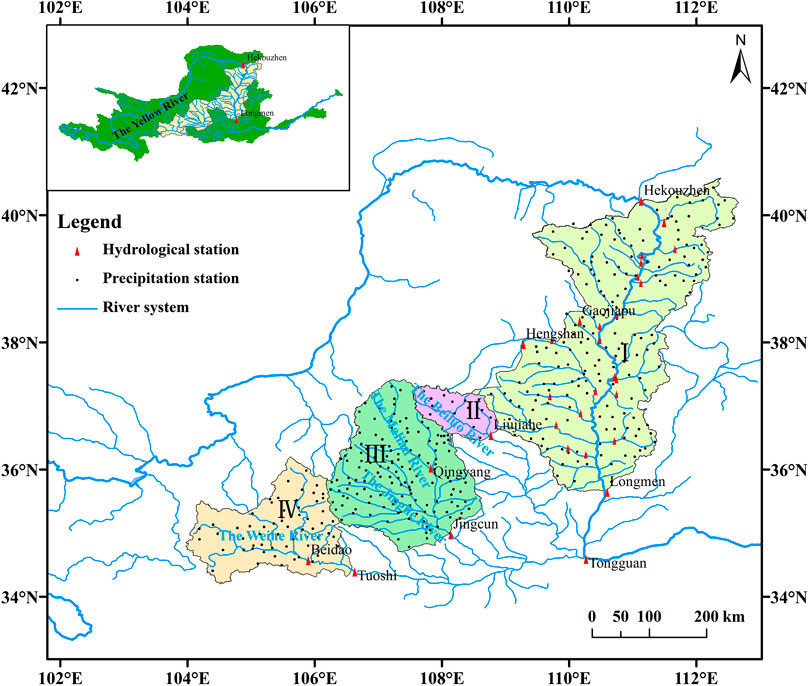
FIGURE 1. Sketch map of the study area: I. HLR (excluding the sandy area in the upper reaches of the Wuding River Basin and Tuwei River Basin); II. BLR; III. JHR; and IV. WHR.
The upper reaches of the Wuding River Basin and the upper reaches of the Tuwei River Basin in the HLR are mostly covered by sand, and the erosion modulus in most areas is relatively small. Moreover, 55% of the medium and large reservoirs and 1/3 of the small reservoirs in the HLR are concentrated, and there is very little sediment moving downstream, therefore, it is not included in the study area of this paper. The study area is 163,500 km2, mainly in the loess hilly and gully area of the Loess Plateau, with some feldspathic sandstone area. According to the measured data from 1934–1959, the average annual sediment discharge in the study area is 1.495 billion tons, accounting for 86.9% of the total sediment discharge in the region above Tongguan station in the YRB.
Data
Precipitation Data
The precipitation data from the 436 precipitation stations from 1966 to 2018 were from the hydrological yearbook and Hydrological Bureau of Yellow River Conservancy Commission (Figure 1). The annual precipitation with daily rainfall greater than 10, 25, 50, and 100 mm for each station was calculated, represented by P10, P25, P50 and P100, respectively, and in units of mm. The surface average precipitation of each watershed or subregion was interpolated by the Thiessen polygon method.
Based on historical extreme precipitation records in the main sediment-yielding area in the middle reaches of the Yellow River, three extreme precipitation scenarios were constructed in this study.
Scenario A
Most of the rainfall in the Loess Plateau does not produce runoff and sediment (Tang, 2004; Wang et al., 2019), and the measured data show that the main factor that determines the annual sediment load of the YRB is several heavy storms or extraordinarily heavy storms, most of which have rainfall of more than 50 mm (Wang et al., 2019). According to the statistics of annual P50 and the corresponding sediment yield of typical tributaries in the middle reaches of the YRB, although the proportion of P50 in annual rainfall is only 2.3–7.8%, the corresponding sediment yield accounts for 44% of the annual sediment yield, of which the proportion of the HLR reached 50.5% (Liu et al., 2016).
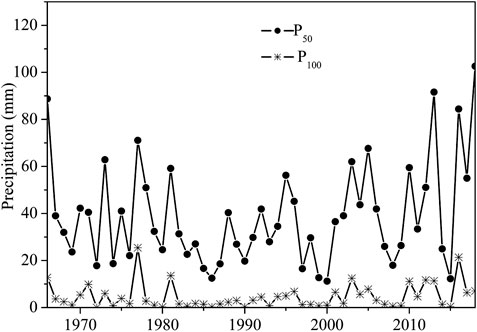
The analysis of the changes in P50 and P100 in the study area from 1966 to 2018 showed that except in 2011 and 2015, the heavy rainfall in the other seven years since 2010 was significantly higher and was the most abundant period since 1966, as shown in Figure 2. During this period, P50 was 43.5% more than its multiyear average value, and P100 was 93.7% higher. It is assumed that the years with the heaviest rainstorms in each tributary since 2010 are all relocated to one year, indicating that all tributaries have experienced the heaviest rainstorm measured from 2010 to 2018 in the same year, but not simultaneously. This extreme precipitation scenario is called scenario A.
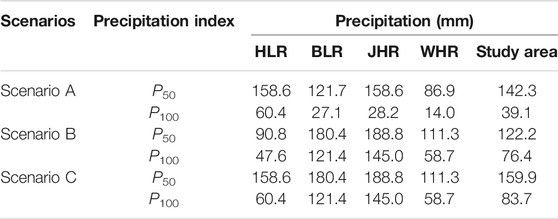
For scenario A, the covered areas of maximum daily rainfall ≥50 mm and maximum daily rainfall ≥100 mm are 153,900 and 45,500 km2, respectively (Figure 3A), and the regional average rainfall of P50 and P100 is 142.3 and 39.1 mm, respectively. As shown in Figure 3, this value is much larger than that of any other year from 1966 to 2018. The area with P50 reaching three times of the average annual P50 from 1966 to 2018 accounts for approximately 70% of the study area.
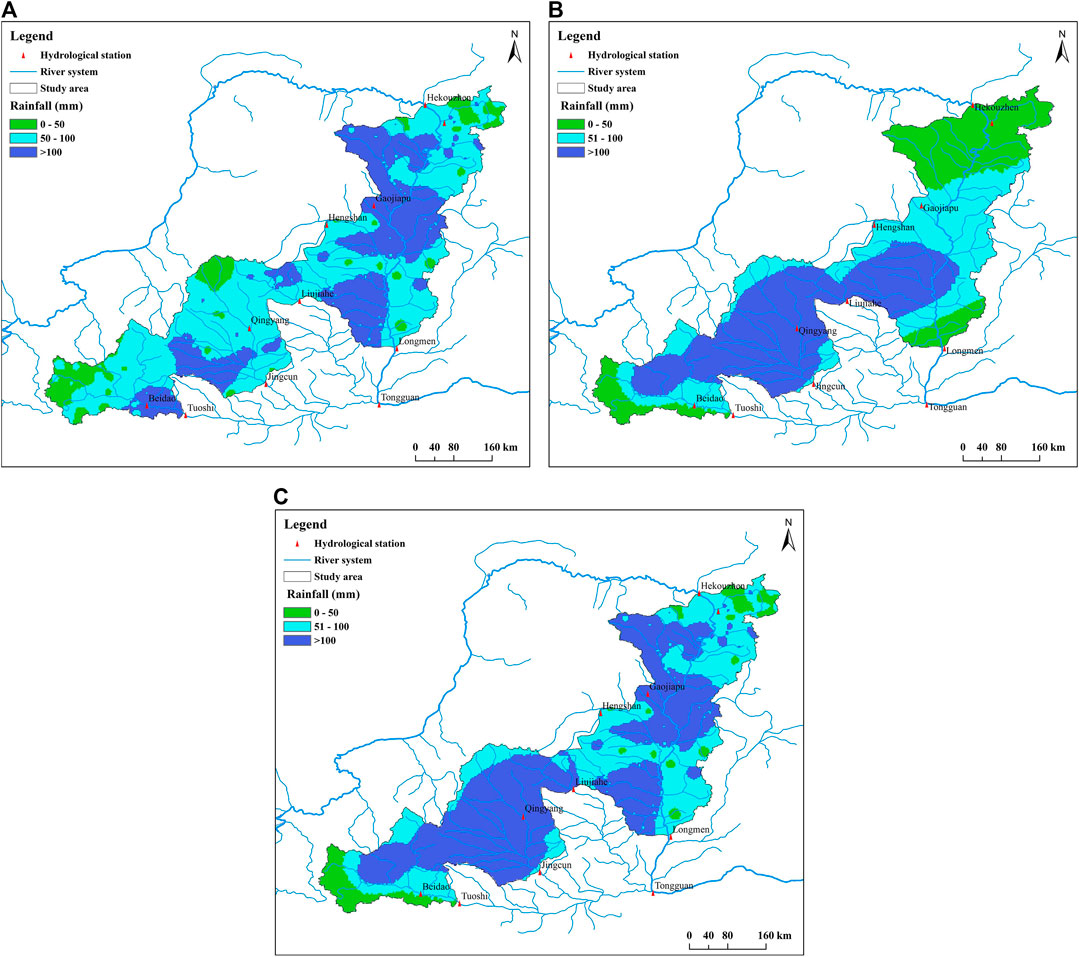
FIGURE 3. The covered area of rainstorms for (A) scenario A, (B) scenario B and (C) scenario C in the study area.
Scenario B
The rainstorm in August 1933 was the most famous rainstorm in the Loess Plateau. The measured sediment discharge at Shanxian station in that year was 3.91 billion tons, which was the largest since 1919. The rainstorm formed the largest flood peak (22,000 m3/s) at Shanxian station in the main stream of the Yellow River since 1919, the second largest flood peak at Zhangjiashan station in the Jinghe River, Longmen station in the Yellow River and Xianyang station in the Weihe River since 1919. The maximum 12 days flood volume at the Shaanxi section was 9.07 billion m3, which was ranked as the largest flood in the YRB since 1919 (Yellow River Conservancy Commission, 2008). Therefore, the flood in 1933 was recognized as a rare hydrological event in the YRB (Liu, 2016), and the flood control department of the Yellow River Conservancy Commission always took it as a key flood prevention object (Yellow River Conservancy Commission, 2008).
Based on the rainstorm analysis results in 1933 (Zheng, 1981; Shi and Yi, 1984), the P50 and P100 in 1933 in the study area were calculated by using the relationship between rainfall and sediment discharge in 1956–1975, known as scenario B. The results showed that the regional average rainfall of P50 and P100 in the study area in 1933 was 122.2 and 76.4 mm, respectively. Among them, the P50 of the HLR, WHR, JHR and BLR in 1933 were 90.8, 111.3, 188.8, and 180.4 mm, respectively. Figure 5 shows the estimated ranges of P50 and P100 during the entire flood season of 1933, with a total rainfall of 23.88 billion m3. The coverage area of maximum daily rainfall ≥50 mm is 122,000 km2 (Figure 3B), which is less than that of scenario A. However, the range of maximum daily rainfall ≥100 mm is 69,500 km2, which is 1.5 times that of scenario A.
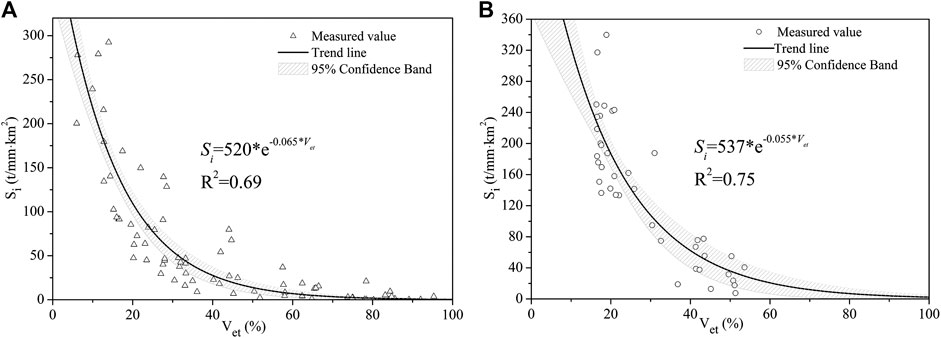
FIGURE 4. The relationships between
Scenario C
It can be seen from Figure 3A and Figure 3B that the rainstorm center of scenario A is mainly located in the HLR, and P50 and P100 are larger than that of scenario B (Table 2). The rainstorm center of scenario B is mainly located in the BLR, JHR and WHR, and the P50 and P100 in these three regions are larger than those of scenario A (Table 1). Therefore, when designing the extreme precipitation scenario, both the rainstorm amount and the distribution of the storm center were considered, and scenarios A and B were combined. That is, the rainfall data of scenario A were used in the HLR, while the rainfall data of scenario B were used in other areas to construct a new extreme rainfall scenario, scenario C. The proportion of rainfall coverage area of the maximum daily rainfall ≥50 mm and maximum daily rainfall ≥100 mm for scenario C in the study area was 92.7 and 56.2%, respectively (Figure 3C). Table 2 shows that the regional average rainfall of P50 and P100 in the study area is 159.9 and 83.7 mm, respectively, and both P50 and P100 in the study area and each subregion were the largest in scenario C.
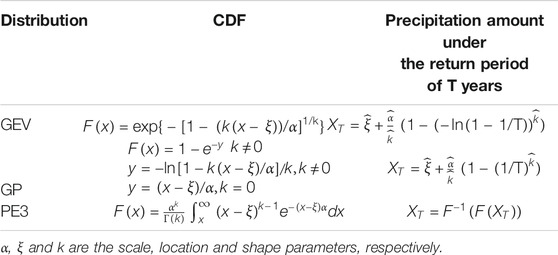
TABLE 2. The cumulative distribution functions (CDF) and precipitation amount under the return period of T years of GEV, GP and PE3 distributions.
Sediment Data
The sediment discharge data from 1966 to 2018 were from the hydrological yearbook and Hydrological Bureau of Yellow River Conservancy Commission. The locations of the hydrological stations are shown in Figure 1. The sediment yield capacity of the basin is expressed by the sediment yield index (
where
Vegetation Data
Vegetation coverage of forest and grassland (referred to as forest and grassland coverage) refers to the proportion of the projected area of leaves and stems of forest and grassland
On a large spatial scale, the normalized difference vegetation index (NDVI) extracted from remote sensing images can be used to calculate
where
The erosion-prone areas and the forest and grassland areas in the study area in 2010 were obtained based on the satellite remote sensing images of HJ CCD with a spatial resolution of 30m (Liu et al., 2014a; Liu et al., 2018).
Terraces Data
The construction of terraces is also an important human activity that affects sediment yield. The terrace area in the study area in 2012 and 2017 was obtained from China Resources No. 3 satellite remote sensing data with a spatial resolution of 2.1 m. The images are mainly from January to May and partly from October to December to minimize the impact of dense vegetation on the identification of terraces. The terrace area of each tributary before 2012 was obtained from the statistics of counties. To scientifically describe the scale of terraces in different regions, the concept of effective terrace coverage
Methods
Precipitation Frequency Distributions
To describe the characteristics of the precipitation series and the probability of extreme precipitation, it is necessary to identify the optimal fitting statistical models. Three commonly used statistical models, i.e., generalized extreme value distribution, generalized Pareto distribution (GP) and Pearson type III distribution (PE3), were used in this study to fit the precipitation series. The cumulative distribution functions of the selected models are shown in Table 2.
The L-moments method proposed by Hosking is a convenient and robust method for parameter estimation (Hosking, 1990; Hosking, 1997; Hosking and Wallis, 1997; She et al., 2013; Chen et al., 2014), and it was used to estimate the parameters of the three selected models in this study. The optimal distribution was selected by three goodness-of-fit methods: the Kolmogorov-Smirnov (K-S) test method, Akaike Information Criterion (AIC) and OLS (Akaike, 1974).
The test statistic of the K-S method can be calculated as
where
The OLS and AIC can be calculated as follows:
where
The return period values can be obtained from the best-fitted distribution.
Prediction of Sediment Yield
Rainfall and land surface conditions are the key factors influencing sediment yield, among which vegetation, soil and terrain are the main land surface factors. The terrain and soil are relatively stable for a region, but the vegetation in the study area has changed significantly in recent years (Feng et al., 2016). To analyze the relationship between vegetation change and sediment yield in the study area, and ensure that the sediment yield change is only the result of vegetation change, the selected sample watershed should have few terraced fields, preferably have no check dams or reservoirs, or alternatively, the sediment volume of check dams and reservoirs can be accurately obtained, and there are no alluvial channels in the sample watershed. Based on these principles, 77 and 40 pairs of data were selected in the loess hilly area and feldspathic sandstone area to analyze the relationships between
According to Figure 6, it can be seen that the sediment yield index
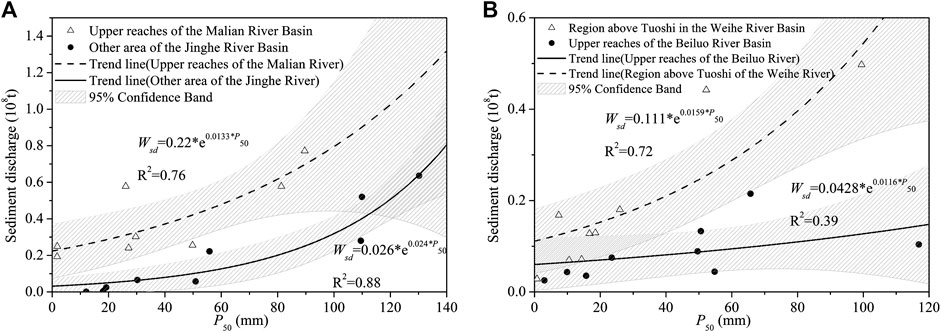
FIGURE 6. The observed rainfall and annual sediment discharge of (A) the JHR and (B) the WHR and BLR from 2010 to 2018.
Based on the relationship between
Results
Frequency Analysis of Extreme Precipitation
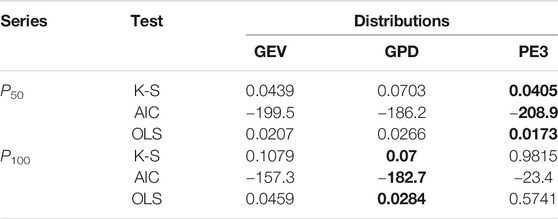
Three distribution functions, generalized extreme value, GPD and PE3, were used to fit the P50 and P100 series in the study area, and the results are shown in Table 3. The optimal distribution function of the P50 series is PE3, and the optimal distribution function of the P50 series is generalized Pareto. The sample size of the P50 and P100 series is 53, and the critical value of the K-S test is 0.1868 at the significance level of 0.05. According to the K-S test results in Table 3, both of the optimal distribution functions of the P50 and P100 series passed the significance test.
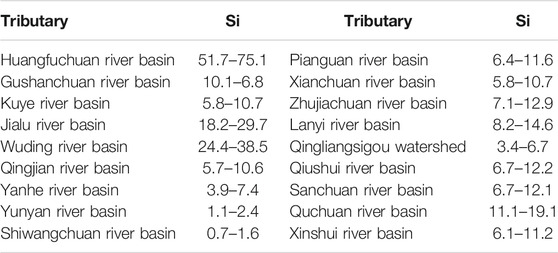
TABLE 4. Sediment yield index of the main tributaries in the HLR under current underlying surface conditions [t/(km2 mm)].
The probability distribution function corresponding to the bolded values is the distribution function most suitable for the P50 or P100 series. The smaller the goodness-of-fit test value is, the better the probability distribution function.
According to the optimal probability distribution function of the P50 series, the recurrence periods of P50 under extreme precipitation scenarios A, B and C are 250, 116, and 460 years, respectively, and scenario C has the largest recurrence period. Therefore, scenario C was used in this paper as an extreme precipitation scenario to calculate the potential sediment yield in the study area in the future.
Calculation of the Sediment Yield Under Extreme Precipitation
The sediment yield under current land surface conditions in the study area was composed of two parts, that is, the sediment yield in the HLR was calculated using the sediment yield index, and the sediment yield in the other regions was calculated according to the relationships between rainfall and sediment yield from 2010 to 2018.
Sediment Yield in the HLR
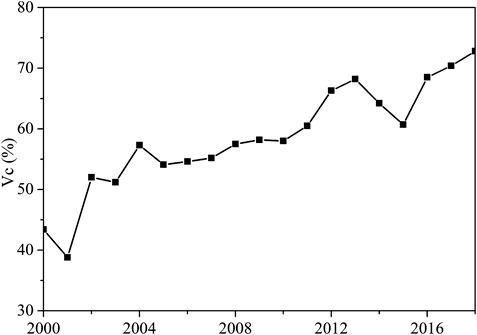
According to the change in vegetation coverage in the HLR from 2000 to 2018 (Figure 5), the vegetation coverage in the HLR has been improved continually since 2000. After 2012, the vegetation coverage significantly improved compared with that in 2000–2011 and tended to be stable. Moreover, the terrace area and the quantity of check dams and reservoirs in the HLR have been basically stable since 2012, so the land surface for 2012–2018 was set as the current land surface.
Based on the remote sensing data of vegetation, terraces, and dam field,
Sediment Yield in the Other Areas
The annual sediment yield in the other regions of the study area was calculated according to the relationships between rainfall and annual sediment yield from 2010 to 2018.
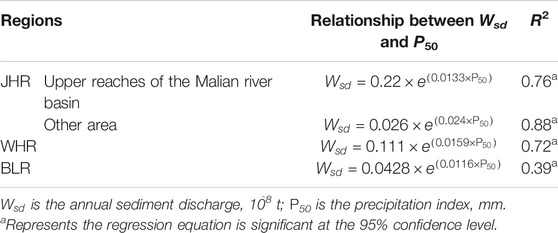
Based on the measured rainfall and annual sediment discharge data from 2010 to 2018, the relationships between rainfall (P50) and annual sediment discharge
In summary, under the current underlying surface conditions, the annual sediment yield in the study area is range from 0.821 billion tons to 1.889 billion tons under extreme precipitation, and the median annual sediment yield is 1.355 billion tons. The median annual sediment yield of the HLR, JHR, WHR and BLR was 627.3 million tons, 619.2 million tons, 73.5 million tons, and 35.3 million tons, respectively. The annual sediment yield of HLR and JHR accounted for 91.9% of the total sediment yield in the study area. The areas with high sediment yield capacity are the Wuding River Basin, Huangfuchuan River Basin and Jialu River Basin in the HLR and the area above Qingyang in the Jinghe River Basin.
Discussion
Rationality Analysis of the Calculated Sediment Yield
The calculated sediment yield in the HLR was verified by the restored sediment yield, which is the sum of measured sediment discharge and the sediment deposited in the check dams and reservoirs. In scenario C, the measured sediment discharge of each tributary in the year with the maximum rainstorm during 2010–2018 in the HLR was added up, and the result was the measured sediment discharge under the current land surface conditions and this extreme precipitation scenario. Then, the sediment yield under the current land surface conditions and this extreme precipitation scenario can be obtained by adding the sediment deposited in the check dams and reservoirs in the corresponding year of each tributary.
For tributaries controlled by hydrological stations (hereinafter referred to as controlled tributaries), the maximum annual sediment discharge from 2010 to 2018 can be directly obtained from measured data. For the area of 25,500 km2 not controlled by hydrological stations in the HLR (hereinafter referred to as uncontrolled area), the maximum annual sediment discharge from 2010 to 2018 was calculated, according to the area ratio based on the assumption that the sediment discharge per unit area of controlled tributaries is the same as that of the uncontrolled area. Based on the measured data from 2010 to 2018, the annual sediment discharge and sediment yield (
According to the sediment yield index method, the annual sediment yield in the HLR is range from 496.4 million tons to 758.2 million tons, and the median calculated annual sediment yield is 627.3 million tons, which is 5.2% smaller than the
The Effect of Gravity Erosion on Sediment Yield
Gravity erosion refers to the process of deformation, destruction, movement and accumulation of rock and soil on the slope under the action of gravity, including collapse, landslide, mud flow and so on. Gravity erosion is an important component of soil erosion (Neill and Mollard, 1982; Wetzel, 1994). Due to the large porosity, vertical joints and fragility of the loess (Derbyshire, 2001), collapse and landslide events are common in the Loess Plateau (Zhang et al., 2009; Zhang and Liu, 2010). Due to the fragile natural environment and intensified human activities, gravity erosion in the Loess Plateau is particularly serious, and its occurrence and development have an important impact on erosion and sediment yield in the basins (Cai, 1997; Han et al., 2011; Yang et al., 2013). Gravity erosion not only affects the total amount of soil erosion but also increases the sediment concentration of water flow to 1,000 kg/m3 (Li et al., 2009).
In 1933, the sediment discharge at the Zhangjiashan station in the Jinghe River Basin was 1.17 billion tons. The relationship between the annual sediment discharge and runoff during the flood season (Figure 7) shows that the sediment discharge of the Jinghe River Basin was unusually high in 1933. This outcome is related not only to the large-scale and high-intensity rainstorms in the basin but also to gravity erosion during the continuous 11 years dry period from 1922 to 1932. The Jinghe River Basin has a special landform, most of which belongs to the loess tableland area, and gravity erosion accounts for a high proportion of sediment yield in the basin. The measured data of the small Nanxiaohegou watershed in the basin from 1955 to 1974 showed that the sediment yield from gravity erosion accounts for 57.4% of the annual sediment yield (Tian et al., 2008), while the proportion of sediment yield by gravity erosion in the loess hilly area generally accounts for no more than 25%.
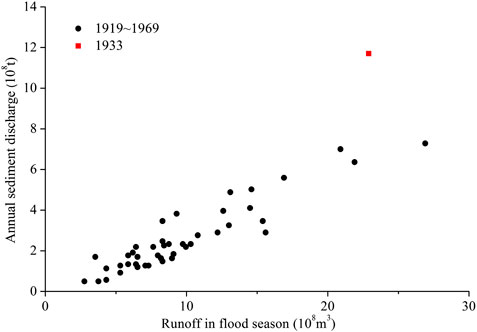
FIGURE 7. Comparison of runoff in the flood season and annual sediment discharge relationships at the Zhangjiashan station in the Jinghe River Basin in 1933 and other years.
Gravity erosion occurs all year round in the Loess Plateau, and the erosion products accumulate at the foot of gullies and slopes and are carried out of the gullies when heavy rains and floods occur (Tian et al., 2008). During the 11 years continuous drought in 1922–1932, gravity erosion still occurred, which increased the sediment supply sources during the heavy rainfall flood in 1933. Therefore, the sediment yield in the study area affected by gravity erosion should be greater than the current calculated value, when extreme rainfall occurs after continuous drought.
The randomicity of gravity erosion is large, so it is difficult to perform effective continuous observations at fixed points in the field. Field investigation is an important method for the study of gravity erosion in typical areas and has been widely used (Shakoor and Smithmyer, 2005; Wang et al., 2016). The rare Earth tracer method (Shi et al., 2012; Heimsath, 2014), remote sensing technology and other new methods and technologies have been applied to the monitoring of gravity erosion (Velicogna and Wahr, 2006; Roering et al., 2009; Zhao et al., 2012; Fuller et al., 2016), but gravity erosion and hydraulic erosion still cannot be distinguished. It is easier to measure large-scale landslides with remote sensing technology, but it is more difficult to monitor gravity erosion with small volumes. Therefore, the establishment of a new method for the quantitative observation of gravity erosion and the quantitative analysis of sediment yield by gravity erosion would be a focus and challenge for future research.
Impact of Check Dam on Sediment Discharge
The survey shows that there are 55,124 check dams in the Loess Plateau above Tongguan station, including 5,546 main check dams, 8,596 medium-sized dams, and 40,982 small dams, about 88% of which are located in the HLR and BLR. The designed sediment retention life of main check dams, medium-sized dams and small-sized dams is 15–30 years, 5–10 years, and 3–5 years, respectively. 33% of main dams, 57% of medium-sized dams and 85% of small-sized dams were built before 1979 and distributed in the HLR and BLR. After decades of sand interception, about 46% of large and medium-sized dams and 95% of small dams have lost their sand control capacity. Moreover, many check dams are aging and out of repair, making them at great risk of water damage. In the future, once it encounters a large-scale extreme rainstorm, it is very likely to appear the phenomenon of mass water destruction, increasing sediment discharge.
Effects of Reverse Vegetation Development Risk on Sediment Yield
The significant improvement of forest and grass vegetation in the Loess Plateau occurred mainly after 1998, especially from 2006 to 2008 (Liu et al., 2016; Jia et al., 2019). People and sheep leaving the land is the main social reason, followed by planting trees and grass, suitable rainfall and temperature conditions, which are the main driving force of natural vegetation restoration in recent years (Liu et al., 2016). The contribution of vegetation improvement to sediment reduction accounts for about 50% (Liu et al., 2016; Gao et al., 2019). If the Loess Plateau can continue to implement the policies of returning farmland to forest and grassland, forbidding grazing and natural restoration, and the social and economic environment can remain stable, the future vegetation status in the study area will be mainly determined by the objective laws of local vegetation succession. However, the ecological environment in the main sediment-yielding area of the Yellow River basin is very fragile. The fluctuation of climatic conditions and human production activities will significantly affect the forest and grass vegetation conditions.
Uncertainties
The maximum sediment yield scenario projected in this paper is based on the current underlying surface conditions and the constructed extreme rainfall scenario in the study area. The uncertainty of the calculation results mainly comes from three aspects. Firstly, uncertainties associated with the input data may still exist, even though the data used in this study has undergone rigorous quality control. Rainfall is a key driving force for regional erosion and sediment yield. The uncertainty of extreme rainfall prediction and the influence of rainfall spatial distribution will increase the uncertainty of sediment yield forecast. Both the extreme rainfall scenarios constructed in this study and the prediction results of the Global Climate Model are subject to certain uncertainties. The simulation results of hydrological models show that the rainfall intensity and spatial distribution of rainstorm have significant influence on the simulation of runoff and sediment yield, and the uncertainty of simulated sediment yield is greater than that of rainfall (Chaubey et al., 1999; Hao et al., 2003; Inamdar and Naumov, 2006). Secondly, the model adopted is a statistical model, which lacks mechanism analysis of the influence of different factors on sediment yield. In particular, the calculations of the JHR, WHR and BLR only use the measured data in recent years to establish the relationship between rainfall and sediment yield, and the data series are relatively short. Thirdly, the interference of human activities may cause statistical models to be inapplicable in the future. It is necessary to further determine the definable observables of human activities, as well as the specific functions or regression equations between it and other natural elements and the sediment yield of the watershed. This will be the focus and challenge for future research.
Conclusion
In this study, the extreme precipitation scenario of the main sediment-yielding areas in the middle reaches of the YRB was constructed, and the corresponding sediment yield under the current underlying surface conditions was calculated. The results showed that the areal rainfall of rainstorms in the constructed extreme rainfall scenario was 159.9 mm, and the recurrence period was 460 years. The corresponding annual sediment yield of the study area was range from 0.821 billion tons to 1.899 billion tons, and the median value is 1.355 billion tons. The median annual sediment yield of the HLR, JHR, WHR and BLR was 627.3, 619.2, 73.5, and 35.3 million tons, respectively. The annual sediment yield of HLR and JHR accounted for 91.9% of the total sediment yield in the study area. The areas with high sediment yield capacity are the Wuding River Basin, Huangfuchuan River Basin and Jialu River Basin in the HLR and the area above Qingyang in the Jinghe River Basin. If extreme rainfall occurs after a continuous drought period, the sediment yield in the study area would be greater.
Although the vegetation in the Loess Plateau has been greatly improved in recent years and large-scale terraces and check dams have been built, the sediment yield of the YRB will still be large if extreme rainfall occurs. The water and sediment regulation projects and flood control projects in the YRB must always be prepared for major floods and large sediment discharge. The main factors of erosion and sediment yield were changed by vegetation improvement in the Loess Plateau, this study only discusses the regional sediment yield of extreme rainfall under the current land surface conditions, and the change of regional sediment yield should be studied in the future by combining vegetation change and other factors.
Data Availability Statement
The datasets generated for this study will not be made publicly available as they are licensed by the Hydrological Bureau of Yellow River Conservancy Commission. Requests for the original datasets can be directed to the Hydrological Bureau of Yellow River Conservancy Commission, Email: c3dqeXJjY0Bzb2h1LmNvbQ==.
Author Contributions
All authors contributed to this study. SD analyzed the data; XL provided important advice on the results of this study; HY and XG contributed to data collection and processing. SD wrote the main manuscript, and all authors reviewed the manuscript and contributed to editing it.
Funding
This research was supported by the National Key R&D Program of China (2017YFC0403604, 2016YFC0402403) and the National Natural Science Foundation of China (51779099, 51809104, and 51909099).
Conflict of Interest
The authors declare that the research was conducted in the absence of any commercial or financial relationships that could be construed as a potential conflict of interest.
References
Akaike, H. (1974). A new look at the statistical model identification. IEEE Trans. Automat. Contr. 19, 716–723. doi:10.1007/978-1-4612-1694-0_16
Alexander, L. V., Zhang, X. B., Peterson, T. C., Caesar, J., and Vazquez-Aguirre, J. L. (2006). Global observed changes in daily climate extremes of temperature and precipitation. J. Geophys. Res. Atmos. 111, D05109. doi:10.1029/2005JD006290
Buendia, C., Bussi, G., Tuset, J., Vericat, D., Sabater, S., Palau, A., et al. (2015). Effects of afforestation on runoff and sediment load in an upland Mediterranean catchment. Sci. Total Environ. 540, 144–157. doi:10.1016/j.scitotenv.2015.07.005
Cai, Q. G. (1997). Relationship of sediment production between hillslope and gully slope in a small basin in the hilly loess region, North China. Int. J. Sediment Res. 12 (3), 353–359. doi:10.13031/2013.18122
Carlson, T., and Ripley, D. A. (1997). On the relation between NDVI, fractional vegetation cover, and leaf area index. Remote Sens. Environ. 62 (3), 241–252. doi:10.1016/S0034-4257(97)00104-1
Chaubey, I., Haan, C. T., Salibury, J. M., and Grunwald, S. (1999). Quantifying model output uncertainty due to spatial variability of rainfall. J. Am. Water Resour. Assoc. 35 (5), 1113–1123. doi:10.1111/j.1752-1688.1999.tb04198.x
Chen, R. D., Wen, Y. F., Gao, P., Mu, X. M., Zhao, G. J., and Sun, W. Y. (2018). Comparative analysis of flow and sediment characteristics of the Yanhe River under extreme rainfall conditions and research on influence factors. Acta Ecol. Sin. 38 (6), 1920–1929 [in Chinese, with English summary].
Chen, Y., Zhang, Q., Xiao, M. Z., Singh, V. P., Leung, Y., and Jiang, L. G. (2014). Precipitation extremes in the Yangtze River Basin, China: regional frequency and spatial-temporal patterns. Theor. Appl. Climatol. 116 (3–4), 447–461. doi:10.1007/s00704-013-0964-3
Cheng, Y., He, H. M., Cheng, N. N., and He, W. M. (2016). The effects of climate and anthropogenic activity on hydrologic features in Yanhe River. Adv. Meteorol. 9, 1–11. 10.1155/2016/5297158
Comino, J. R., Senciales, J. M., Ramos, M. C., Ramos, M. C., Casasnovas, J. A. M., Lasanta, T., et al. (2017). Understanding soil erosion processes in Mediterranean sloping vineyards (Montes de Málaga, Spain), Geoderma 296, 47–59. doi:10.1016/j.geoderma.2017.02.021
Dang, S. Z., Liu, X. Y., Li, X. Y., Yao, M. F., and Zhang, D. (2018). Changes in different classes of precipitation and the impacts on sediment yield in the Hekouzhen-Longmen region of the Yellow River basin, China. Adv. Meteorol. 1–15. doi:10.1155/2018/3537512
Dang, S. Z., Yao, M. F., Liu, X. Y., and Dong, G. T. (2019). Variations and statistical probability characteristic analysis of extreme precipitation in the Hekouzhen-Longmen region of the Yellow River, China. Asia-Pacific J. Atmos. Sci. doi:10.1007/s13143-019-00117-w
Derbyshire, E. (2001). Geological hazards in loess terrain, with particular reference to the loess regions of China. Earth Sci. Rev. 54 (1–3SI), 231–260. doi:10.1016/S0012-8252(01)00050-2
Du, H. B., Wu, Z. F., Zong, S. W., Meng, X. J., and Wang, L. (2013). Assessing the characteristics of extreme precipitation over northeast China using the multifractal detrended fluctuation analysis. J. Geophys. Res. Atmos. 118, 6165–6174. doi:10.1002/jgrd.50487
Feng, X., Fu, B., Piao, S., Wang, S., Ciais, P., Zeng, Z. Z., et al. (2016). Revegetation in China’s Loess Plateau is approaching sustainable water resource limits. Nat. Clim. Change 6, 1019–1022. doi:10.1038/nclimate3092
Fischer, T., Gemmer, M., Liu, L. L., and Su, B. D. (2012). Change-points in climate extremes in the Zhujiang river basin, south China, 1961-2007. Clim. Change 110, 783–799. doi:10.1007/s10584-011-0123-8
Frich, P. L., Alexander, L., Della-Marta, P. M., Gleason, B., Haylock, M., Klein, T. A., et al. (2002). Observed coherent changes in climatic extremes during the second half of the twentieth century. Clim. Res. 19, 193–212. doi:10.3354/cr019193
Fu, B. J., Wang, S., Liu, Y., Liu, J. B., Liang, W., and Miao, C. Y. (2017). Hydrogeomorphic ecosystem responses to natural and anthropogenic changes in the Loess Plateau of China. Annu. Rev. Earth Planet Sci. 45, 223–243. doi:10.1146/annurev-earth-063016-020552
Fuller, I. C., Riedler, R. A., Bell, R., Marden, M., and Glade, T. (2016). Landslide-driven erosion and slope-channel coupling in steep, forested terrain, Ruahine Ranges, New Zealand, 1946-2011. Catena 142, 252–268. doi:10.1016/j.catena.2016.03.019
Gao, G. Y., Zhang, J. J., Liu, Y., Ning, Z., Fu, B. J., and Sivapalan, M. (2017). Spatio-temporal patterns of the effects of precipitation variability and land use/cover changes on long-term changes in sediment yield in the Loess Plateau, China. Hydrol. Earth Syst. Sci. 21, 4363–4378. doi:10.5194/hess-21-4363-2017
Gao, H. D., Liu, H., Jia, L. L., Pang, G. W., and Wang, J. (2019). Attribution analysis of precipitous decrease of sediment loads in the Hekou-Longmen section of Yellow River since 2000. Acta Geograph. Sin. 74 (09), 1745–1757 [in Chinese, with English summary]. doi:10.11821/dlxb201909004
Gao, T., and Wang, H. L. (2017). Trends in precipitation extremes over the Yellow River basin in North China: changing properties and causes. Hydrol. Process. 31, 2412–2428. doi:10.1002/hyp.11192
Garbrecht, J. D., Nearing, M. A., Shields, F. D., Tomer, M. D., Sadler, E. J., Bonta, V., et al. (2014). Impact of weather and climate scenarios on conservation assessment outcomes. J. Soil Water Conserv. 69, 374–392. doi:10.2489/jswc.69.5.374
Han, P., Ni, J. R., Hou, K. B., Miao, C. Y., and Li, T. H. (2011). Numerical modeling of gravitational erosion in rill systems. Int. J. Sediment Res. 26 (4), 403–415. doi:10.1016/S1001-6279(12)60001-8
Hao, F. H., Chen, L. Q., Liu, C. M., and Zhang, X. S. (2003). Model output uncertainty due to spatial variability of rainfall. Prog. Geogr. 22 (5), 446–453 [in Chinese, with English summary].
Heimsath, A. M. (2014). Limits of soil production? Science 343 (6171), 617–618. doi:10.1126/science.1250173
Hosking, J. R. M. (1990). L-moments analysis and estimation of distributions using linear combination of order statistics. J. Roy. Stat. Soc. 52 (1), 105–124. doi:10.2307/2345653
Hosking, J. R. M., and Wallis, J. R. (1997). Regional frequency analysis. Cambridge, England: Cambridge University Press.
Inamdar, S., and Naumov, A. (2006). Assessment of sediment yields for a mixed-landuse Great Lakes Watershed: lessons from field measurements and modeling[J]. J. Great Lake. Res. 32 (3), 471–488. doi:10.3394/0380-1330(2006)32 [471:AOSYFA]2.0.CO;2
IPCC (2012). Managing the risks of extreme events and disasters to advance climate change adaptation. A special report of Working Groups I and II of the Intergovernmental Panel on Climate Change. Cambridge, UK: Cambridge University Press. Available at: https://www.ipcc.ch/site/assets/uploads/2018/03/SREX_Full_Report-1.pdf (Accessed October 14, 2012).
Jia, P. P., Xue, H. Z., Dong, G. T., Zhou, J. L., Yin, H. J., and Dang, S. Z. (2019). Variations of NDVI and its response to climate in Hekouzhen-Tongguan reach of the Yellow River. Yellow River 41 (4), 31–41 [in Chinese, with English summary].
Jiao, J. Y., Wang, Z. J., Wei, Y. H., Su, Y., Cao, B., and Li, Y. (2017). Characteristics of erosion sediment yield with extreme rainstorms in Yanhe watershed based on field measurement. Trans. Chin. Soc. Agric. Eng. 33 (13), 159–167. [in Chinese, with English summary]. doi:10.11975/j.issn.1002-6819.2017.13.021
Kao, S. J., and Milliman, J. (2008). Water and sediment discharge from small mountainous rivers, Taiwan: the roles of lithology, episodic events, and human activities. J. Geol. 116, 431–448. doi:10.1086/590921
Keo, S., He, H. Y., and Zhao, H. F. (2018). Analysis of rainfall erosivity change and its impacts on soil erosion on the Loess Plateau over more than 50 years. Res. Soil Water Conserv. 25 (2), 1–7. [in Chinese, with English summary].
Li, T. J., Wang, G. Q., Xue, H., and Wang, K. (2009). Soil erosion and sediment transport in the gullied Loess Plateau: scale effects and their mechanisms. Sci. China Technol. Sci. 52 (5), 1283–1292. doi:10.1007/s11431-009-0076-6
Liu, X. Y. (2016). Causes of sharp decrease in water and sediment in recent years in the Yellow River. Beijing, China: Science Press.
Liu, X. Y., Dang, S. Z., and Gao, Y. F. (2019). Sediment yield of current underlying surface under simulated extreme rainstorm in middle reaches of Yellow River Basin. Trans. Chin. Soc. Agric. Eng. 35 (11), 131–138 [in Chinese, with English summary].
Liu, X. Y., Dong, G. T., Gao, Y. F., Xia, R. L., Sun, Y., and Dang, S. Z. (2018). The sediment producing mechanism of the No. 5 sub-region of the loess hilly region in the Loess Plateau. J. Hydraul. Eng. 49 (3), 282–290 [in Chinese, with English summary]. doi:10.13243/j.cnki.slxb.20171082
Liu, X. Y., Li, X. Y., and Dang, S. Z. (2016). Spatial pattern of precipitation change in the main sediment-yielding area of the Yellow River basin in recent years. J. Hydraul. Eng. 47 (4), 463–472 [in Chinese, with English summary]. doi:10.13243/j.cnki.slxb.20150875
Liu, X. Y., Wang, F. G., Yang, S. T., Li, X. Y., Ma, H. B., and He, X. Z. (2014c). Sediment reduction effect of level terrace in the hilly-gully region in the Loess Plateau. J. Hydraul. Eng. 45 (7), 793–800 [in Chinese, with English summary]. doi:10.13243/j.cnki.slxb.2014.07.005
Liu, X. Y., Yang, S. T., Dang, S. Z., Luo, Y., Li, X. Y., and Zhou, X. (2014a). Response of sediment yield to vegetation restoration at a large spatial scale in the Loess Plateau. Sci. China Technol. Sci. 57 (8), 1482–1489. doi:10.1007/s11431-014-5605-2
Liu, X. Y., Yang, S. T., Wang, F. G., He, X. Z., Ma, H. B., and Luo, Y. (2014b). Analysis on sediment yield reduced by current terrace and shrubs-herbs-arbor vegetation in the Loess Plateau. J. Hydraul. Eng. 45 (11), 1293–1300 [in Chinese, with English summary]. doi:10.13243/j.cnki.slxb.2014.11.004
Meehl, G. A., Karl, T., Easterling, D., Changnon, S., Pielke, R., Changnon, D., et al. (2000). An Introduction to trends in extreme weather and climate events: observations, socioeconomic impacts, terrestrial ecological impacts, and model projections. Bull. Am. Meteorol. Soc. 81, 413–416. doi:10.1175/1520-0477(2000)081<0413:AITTIE>2.3.CO;2
Miao, C. Y., Ni, J. R., Borthwick, A. G. L., and Yang, L. (2011). A preliminary estimate of human and natural contributions to the changes in water discharge and sediment load in the Yellow River. Global Planet. Change 76, 196–205. doi:10.1016/j.gloplacha.2011.01.008
Nearing, M. A., Jetten, V. G., Baffaut, C., Cerdan, O., Couturier, A., Hernandez, M., et al. (2005). Modeling response of soil erosion and runoff to changes in precipitation and cover. Catena 61 (2–3), 131–154. doi:10.1016/j.catena.2005.03.007
Neill, C. R., and Mollard, J. D. (1982). Erosional processes and sediment yield in the upper oldman river basin, Alberta, Canada. Hydrol. Sci. J. 27 (2), 239.
Ran, D. C., Qi, B., and Xiao, P. Q. (2015). Response of extraordinary rainstorm and flood to the harnessing for underlying surface in Jialu River Basin. Res. Soil Water Conserv. 22 (6), 7–13 [in Chinese, with English summary].
Roering, J. J., Stimely, L. L., Mackey, B. H., and Schmidt, D. A. (2009). Using DInSAR, airborne LiDAR, and archival air photos to quantify landsliding and sediment transport. Geophys. Res. Lett. 36, L19402. doi:10.1029/2009GL040374
Shakoor, A., and Smithmyer, A. J. (2005). An analysis of storm-induced landslides in colluvial soils overlying mudrock sequences, southeastern Ohio, USA. Eng. Geol. 78 (3–4), 257–274. doi:10.1016/j.enggeo.2005.01.001
She, D. X., Xia, J., Song, J. Y., Du, H., Chen, J. X., and Wan, L. (2013). Spatio-temporal variation and statistical characteristic of extreme dry spell in Yellow River Basin, China. Theor. Appl. Climatol. 112 (1–2), 201–213. doi:10.1007/s00704-012-0731-x
Shi, F. C., Yi, Y. J., and Gao, Z. D. (1984). Flood in the middle reaches of the Yellow River in August 1933. J. China Hydrol. 4 (6), 55–58. [in Chinese with English abstract]
Shi, H. Y., and Wang, G. Q. (2015). Impacts of climate change and hydraulic structures on runoff and sediment discharge in the middle Yellow River. Hydrol. Process. 29, 3236–3246. doi:10.1002/hyp.10439
Shi, Z., Wen, A., Zhang, X., He, X., Li, H., and Yan, D. (2012). Cs-137 and Pb-210(ex) as soil erosion tracers in the hilly Sichuan Basin and the three Gorges area of China. J. Mt. Sci. 9 (1), 27–33. doi:10.1007/s11629-012-2200-5
Tang, K. L. (2004). Soil and water conservation in China. Beijing, China: Science Press. [in Chinese, with English summary].
Tian, X. F., Jia, Z. X., and Liu, B. (2008). Analysis and study on the law of soil and water loss and benefits of soil and water conservation in typical small watersheds in the loess gully region. Zhengzhou: Yellow River Conservancy Press [in Chinese, with English summary].
Trenberth, K. E. (2011). Changes in precipitation with climate change. Clim. Res. 47, 123–138. doi:10.3354/cr00953
Velicogna, I., and Wahr, J. (2006). Measurements of time-variable gravity show mass loss in Antarctica. Science 311 (5768), 1754–1756. doi:10.1126/science.1123785
Wang, H. J., Yang, Z. S., Saito, Y., Liu, J. P., Sun, X. X., and Wang, Y. (2007). Stepwise decreases of the Huanghe (Yellow River) sediment load (1950–2005): impacts of climate change and human activities. Global Planet. Change 57 (3–4), 331–354. doi:10.1016/j.gloplacha.2007.01.003
Wang, S., Fu, B. J., Piao, S. L., Lu, Y. H., Ciais, P., Feng, X. M., et al. (2016). Reduced sediment transport in the Yellow River due to anthropogenic changes. Nat. Geosci. 9 (1), 38–41. doi:10.1038/ngeo2602
Wang, W. Z., Jiao, J. Y., and Wei, Y. H. (2019). Relationship between sediment and rainfall and sediment variation in the main sediment yield area of the Yellow River. J. Sediment. Res. 44 (2), 41–47 [in Chinese, with English summary].
Wei, Y. H., Jiao, J. Y., Zhao, G. J., Zhao, H. K., He, Z., and Mu, X. M. (2016). Spatial–temporal variation and periodic change in streamflow and suspended sediment discharge along the mainstream of the Yellow River during 1950–2013. Catena 140, 105–115. doi:10.1016/j.catena.2016.01.016
Wetzel, K. (1994). “The significance of fluvial erosion, channel storage and gravitational processes in sediment production in a small mountainous catchment area,” in Dynamics and geomorphology of mountain rivers. Editors P. Ergenzinger, and K. H. Schmidt (New York: Springer Berlin Heidelberg), 141–160.
Xin, Z. B., Yu, B. F., and Han, Y. G. (2015). Spatiotemporal variations in annual sediment yield from the middle Yellow River, China, 1950–2010. J. Hydrol. Eng. 20. doi:10.1061/(ASCE)HE.1943-5584.0001113
Yang, J., Yao, W., and Wang, L. (2013). Study on the mechanism and process of gravity erosion on the gully slope of Qiaogou Watershed. Proceedings of the 35th IAHR World Congress, Chengdu, China, September 8–13, 2013, VOLS I AND II, 4083–4091.
Yellow River Conservancy Commission (2008). Flood control planning for the Yellow River basin. Zhengzhou, China: Yellow River Conservancy Press [in Chinese, with English summary].
Zhang, D. X., Wang, G. H., Luo, C. Y., Chen, J., and Zhou, Y. X. (2009). A rapid loess flowslide triggered by irrigation in China. Landslides 6 (1), 55–60. doi:10.1007/s10346-008-0135-2
Zhang, M. S., and Liu, J. (2010). Controlling factors of loess landslides in western China. Environ. Earth Sci. 59 (8), 1671–1680. doi:10.1007/s12665-009-0149-7
Zhang, Y., Xia, J., and She, D. X. (2018). Spatiotemporal variation and statistical characteristic of extreme precipitation in the middle reaches of the Yellow River Basin during 1960–2013. Theor. Appl. Climatol. 135 (15), 1–18. doi:10.1007/s00704-018-2371-2
Zhao, C. Y., Lu, Z., Zhang, Q., and Fuente, J. D. L. (2012). Large-area landslide detection and monitoring with ALOS/PALSAR imagery data over Northern California and Southern Oregon, USA. Rem. Sens. Environ. 124, 348–359. doi:10.1016/j.rse.2012.05.025
Zhao, G. J., Mu, X. M., Jiao, J. Y., Peng, G., Sun, W. Y., Li, E. H., et al. (2018). Assessing response of sediment load variation to climate change and human activities with six different approaches. Sci. Total Environ. 639, 773–784. doi:10.1016/j.scitotenv.2018.05.154
Zheng, S. P. (1981). Contour map of heavy rainfall in August 1933 in the middle reaches of the Yellow River. Yellow River, 1981, 3 (5), 28–32. (in Chinese with English abstract)
Keywords: extreme precipitation, sediment yield, Yellow River basin, frequency distribution, sediment yield index
Citation: Dang S, Liu X, Yin H and Guo X (2020) Prediction of Sediment Yield in the Middle Reaches of the Yellow River Basin Under Extreme Precipitation. Front. Earth Sci. 8:542686. doi: 10.3389/feart.2020.542686
Received: 13 March 2020; Accepted: 26 October 2020;
Published: 11 December 2020.
Edited by:
Xingcai Liu, Chinese Academy of Sciences, ChinaCopyright © 2020 Dang, Liu, Yin and Guo. This is an open-access article distributed under the terms of the Creative Commons Attribution License (CC BY). The use, distribution or reproduction in other forums is permitted, provided the original author(s) and the copyright owner(s) are credited and that the original publication in this journal is cited, in accordance with accepted academic practice. No use, distribution or reproduction is permitted which does not comply with these terms.
*Correspondence: Suzhen Dang, ZGFuZ3N6X2hreUAxNjMuY29t
 Suzhen Dang
 Xiaoyan Liu3