
94% of researchers rate our articles as excellent or good
Learn more about the work of our research integrity team to safeguard the quality of each article we publish.
Find out more
ORIGINAL RESEARCH article
Front. Earth Sci., 29 September 2020
Sec. Petrology
Volume 8 - 2020 | https://doi.org/10.3389/feart.2020.531911
This article is part of the Research TopicCrystal Archives of Magmatic ProcessesView all 14 articles
 Megan E. Newcombe1*
 Terry Plank2Youxue Zhang3Megan Holycross4
 Anna Barth2
 Alexander S. Lloyd2,5
 David Ferguson6Bruce F. Houghton7Erik Hauri8†
We have constrained syneruptive pressure-temperature-time (P-T-t) paths of mafic magmas using a combination of short-timescale cooling and decompression chronometers. Recent work has shown that the thermal histories of crystals in the last few seconds to hours of eruption can be constrained using concentration gradients of MgO inside olivine-hosted melt inclusions, produced in response to syneruptive cooling and crystallization of olivine on the inclusion walls. We have applied this technique to the study of melt inclusions erupted by arc and ocean island volcanoes, including the 1974 subplinian eruption of Fuego volcano; the 1977 fire-fountain eruption of Seguam volcano; and three eruptions of Kilauea volcano (episode 1 of the 1959 Kilauea Iki fire-fountain eruption, the 1500 CE vigorous fire-fountain eruption, and the 1650 CE subplinian eruption). Of the eruptions studied so far, melt inclusions from the 1959 Kilauea Iki eruption record the highest syneruptive cooling rates (3–11°C/s) and the shortest cooling durations (4–19 s), while inclusions from the 1974 Fuego eruption record the slowest cooling rates (0.1–1.7°C/s) and longest cooling durations (21–368 s). The high cooling rates inferred for the Kilauea Iki and Seguam fire fountain eruptions are consistent with air quenching over tens of seconds during and after fragmentation and eruption. Melt inclusions sampled from the interiors of small (∼6 cm diameter) volcanic bombs at Fuego are found to have cooled more slowly on average than inclusions sampled from ash (with particle diameters < 2 mm) during the same eruption, as expected based on conductive cooling models. We find evidence for a systematic relationship between cooling rates and decompression rates of magmas, in which rapidly ascending gas-bearing magmas experience slower cooling during ascent and eruption than slowly ascending magmas. Our magma P-T-t constraints for the Kilauea Iki eruption are in broad agreement with isentropic models that show that the dominant driver of cooling in the conduit is adiabatic expansion of a vapor phase; however, at Fuego and Seguam, our results suggest a significant role for latent heat production and/or open-system degassing (both of which violate assumptions required for isentropic ascent). We thereby caution against the application of isentropic conduit models to magmas containing relatively high initial water concentrations (e.g., arc magmas containing ∼4 wt% water). We note that several processes that have been inferred to occur in volcanic conduits such as magma stalling, magma mingling, open- and closed-system degassing, vapor fluxing, and vapor accumulation (in foam layers or as slugs of gas) are associated with different implied vapor volume fractions during syneruptive ascent. Given the sensitivity of magma P-T-t paths to vapor volume fraction, the syneruptive thermometer presented here may be a means of identifying these processes during the seconds to hours preceding the eruption of mafic magmas.
The temperature of magma during ascent through the volcanic conduit exerts an important control on magma crystallinity and viscosity, which in turn affect magma rheology and ascent dynamics (Costa et al., 2007; Vona et al., 2011; Shea and Hammer, 2013; La Spina et al., 2016; Bamber et al., 2020). A recent numerical modeling effort by La Spina et al. (2015) found that “a temperature variation of 30 K at the base of the conduit has a bigger effect on mass discharge rate than an increase of 1 wt% in water content,” thereby highlighting the impact of seemingly small temperature variations on the vigor of explosive basaltic eruptions. Temperature variations during ascent and eruption also influence the speciation and oxygen fugacity of exsolved vapor (Oppenheimer et al., 2018; Moussallam et al., 2019). Recently developed real-time monitoring tools for gas geochemistry are now providing continuous records of volcanic gas emissions (Aiuppa et al., 2005; Shinohara, 2005; Aiuppa et al., 2007; de Moor et al., 2016), but in order to interpret and harness the information provided by these records, we must decipher the relationships between the dynamics of magma degassing and escape, magma temperature, and vapor speciation.
In addition to the importance of syneruptive temperature changes as a control on eruption dynamics and outgassed vapor speciation, the syneruptive cooling rate of tephra is also a key parameter for accurately determining pre-eruptive CO2 and H2O concentrations of melt inclusions, which are widely used to estimate magma storage depths (e.g., Métrich and Wallace, 2008; Ruth et al., 2018; Rasmussen et al., 2019). CO2 may effectively partition into vapor bubbles during post-entrapment cooling, thereby compromising the utility of melt inclusions as magma barometers (Hartley et al., 2014; Moore et al., 2015). This challenge has been met by the development of several analytical (Hartley et al., 2014; Moore et al., 2015), modeling (Wallace et al., 2015; Maclennan, 2017; Tucker et al., 2019; Rasmussen et al., 2020) and experimental (Mironov et al., 2015; Rasmussen et al., 2020) approaches to correct for diffusion of CO2 from melt inclusions into their vapor bubbles. Syneruptive cooling rate sets the time available for CO2 diffusion within melt inclusions: Eruptive deposits that cool slowly allow extensive loss of CO2 into vapor bubbles, while rapidly cooled melt inclusions pass through a higher closure temperature for CO2 diffusion and allow less diffusion of CO2 into vapor bubbles. One of the largest sources of error in the models that have been developed to account for diffusion of CO2 into vapor bubbles is uncertainty in estimates of the syneruptive cooling rate (Maclennan, 2017; Tucker et al., 2019; Rasmussen et al., 2020). Similarly, it is widely recognized that olivine-hosted melt inclusions are susceptible to syneruptive and post-eruptive water loss via diffusion of water through the host olivine (Massare et al., 2002; Gaetani et al., 2012; Bucholz et al., 2013; Lloyd et al., 2013; Le Voyer et al., 2014). Melt inclusions from pyroclasts that cool slowly suffer more extensive water loss than those sampled from rapidly quenched pyroclasts, demonstrating the strong control of syneruptive cooling rate on the extent of post-eruptive water loss from melt inclusions.
Despite the importance of the thermal evolution of magma as a control on eruptive processes (Costa et al., 2007; Vona et al., 2011; Shea and Hammer, 2013; La Spina et al., 2016; Bamber et al., 2020) and the post-entrapment evolution of melt inclusion volatile contents, petrologic studies of magma temperature changes during ascent and eruption are limited. Blundy et al. (2006) used plagioclase-melt thermometry to infer temperature increases of ∼100°C over several months of magma ascent during dome-building eruptions of Mount Saint Helens and Shiveluch volcanoes. Plagioclase-melt thermometry also reveals apparent temperature increases during magma ascent at Soufrière Hills, Mount Unzen, and Izu Oshima (Humphreys et al., 2016); however, Humphreys et al. (2016) suggest that post-entrapment water loss and/or disequilibrium crystallization could explain some or all of the apparent temperature increases during magma ascent inferred by plagioclase-melt thermometry. Other authors have exploited changes in water speciation during quenching (Zhang et al., 1997) and calorimetry (Wilding et al., 2000; Gottsmann and Dingwell, 2002; Potuzak et al., 2008; Nichols et al., 2009) to infer cooling rates of silicate melts as they pass through the closure temperature for water diffusion or the glass transition temperature, respectively.
The techniques listed above are not sensitive to temperature changes over the minute-to-hour timescales of magma ascent during explosive eruptions. Newcombe et al. (2014) developed a technique that uses MgO concentration gradients in olivine-hosted melt inclusions to constrain multi-stage thermal histories of magmas during the last few seconds to hours of ascent and syneruptive quenching, potentially providing a means to bridge the gap in timescales accessible with previously developed methods. So far, this technique has been applied to melt inclusions from submarine lavas, a sub-aerial hornito eruption, olivine-bearing sand from Papakaloa Beach (Hawaii), sand from the Kilauea Iki crater, and olivines from martian meteorite Yamato 980459 (Newcombe et al., 2014; Saper and Stolper, 2020). The application of this technique to explosive basaltic-to-intermediate systems that exhibit a range of eruptive styles could reveal systematics of temperature changes during late-stage magma ascent, eruption, and quenching. Additionally, constraints of cooling rates from individual olivine-hosted melt inclusions will allow more accurate reconstruction of pre-eruptive volatile contents using published models of vapor bubble formation (Maclennan, 2017; Tucker et al., 2019; Rasmussen et al., 2020).
In this study, we apply recently developed magma temperature and ascent chronometers in concert to determine P-T-t paths of magmas erupted at arc and ocean island volcanoes. The studied eruptions exhibited a variety of eruptive styles [their volcanic explosivity indices (VEI) range from 1 to 4] and their pre-eruptive magmas contained variable water concentrations (from ∼0.5 to ∼4 wt% H2O). Previously published determinations of magma decompression rates for the eruptions considered in this study indicate a range of linear decompression rates from ∼0.05 to 0.4 MPa/s (Lloyd et al., 2014; Ferguson et al., 2016; Newcombe et al., 2020). There is increasing evidence that the decompression rate of mafic magmas correlates with eruption explosivity (Ferguson et al., 2016; Cassidy et al., 2018; Barth et al., 2019); however, links between syneruptive T-t and P-t paths have not previously been investigated via petrologic methods. By exploring a range of magma properties and eruptive styles, we aim to identify the dominant controls on syneruptive magma P-T-t paths that can be used to guide future conduit modeling efforts.
During ascent from depth to the surface, magma experiences an increase in its gravitational potential energy and an increase in its kinetic energy. In order to satisfy conservation of energy, these energy increases must be balanced by a decrease in the internal energy of the magma. Whether or not this decrease in the magma’s internal energy is associated with a decrease in temperature depends on the extent to which the system (i.e., the ascending parcel of magma) is open to transfer of heat, work, and mass. If a parcel of magma ascends rapidly enough to prevent significant melt-vapor segregation and conduction of heat across the conduit walls, then its ascent may closely follow an adiabatic path (i.e., the system is closed to transfer of heat and mass). If, furthermore, this parcel of magma experiences minimal syneruptive crystallization, irreversible gas exsolution (Sahagian and Proussevitch, 1996), or viscous heating, then its ascent may be considered approximately isentropic. During isentropic decompression of a melt-vapor mixture, expansion of the magma (which is dominated by expansion of the vapor phase) does work against its surroundings, and this is compensated by a decrease in the enthalpy and temperature of the magma. Isentropic ascent is an endmember scenario that produces maximal cooling (Mastin and Ghiorso, 2001). Temperature changes expected during adiabatic ascent of magma along both isentropic and isenthalpic paths are considered in detail by Mastin and Ghiorso (2001).
A parcel of magma that ascends slowly enough to allow significant loss of heat and/or mass through the conduit walls cannot be approximated as an adiabatic system. Loss of vapor from the magma may trigger degassing-driven crystallization which produces latent heat (Blundy and Cashman, 2005). Irreversible processes such as viscous heating and irreversible vapor exsolution also lead to heat production during magma ascent (Fujii and Uyeda, 1974; Sahagian and Proussevitch, 1996; Koyaguchi, 2005; Mastin, 2005; Vedeneeva et al., 2005; Costa et al., 2007). If minimal expansion or lifting work is done by the magma (e.g., slow-moving magma extruded during a dome-building eruption), and if heat production is able to exceed heat loss by conduction through the conduit walls, then the temperature of the magma may increase during ascent (Blundy et al., 2006; Glazner, 2019).
Here, we consider magma ascent during explosive eruptions of mafic magmas. These magmas have lower viscosities and higher decompression rates (Lloyd et al., 2014; Ferguson et al., 2016; Newcombe et al., 2020) than the andesitic magmas of the dome-building eruptions considered by Blundy et al. (2006) that were inferred to experience syneruptive heating. Conduit models typically neglect to account for temperature variations during ascent (Sahagian, 2005), but the small subset of models that explicitly consider temperature variations during magma ascent do so either by considering the contributions of both adiabatic vapor expansion and latent heat of crystallization to the temperature evolution of the magma (Kavanagh and Sparks, 2009; La Spina et al., 2015), or by making the assumption that the ascending magma follows an isentropic path (Mastin and Ghiorso, 2000; Mastin and Ghiorso, 2001; Campagnola et al., 2016; Kilinc, 2018). In particular, the popular Conflow and Confort models that calculate temperature changes of magmas undergoing isentropic ascent often predict tens of degrees of syneruptive cooling in the conduit (Mastin and Ghiorso, 2000; Campagnola et al., 2016). However, the assumptions of isentropic models are easily violated, e.g., if the magma crystallizes or stalls on ascent, or if melt-vapor segregation occurs. Given the many challenges of numerically reproducing the complex and dynamic conduit environment, we turn instead to the development of syneruptive magma thermometers that can more directly assess syneruptive P-T-t paths of magmas with fewer a priori assumptions.
Olivine phenocrysts containing melt inclusions and/or melt embayments were selected from the 1974 subplinian eruption of Fuego volcano; the 1977 fire-fountain eruption of Seguam volcano; and three eruptions of Kilauea volcano (episode 1 of the 1959 Kilauea Iki fire-fountain eruption, the 1500 CE vigorous fire-fountain eruption, and the 1650 CE subplinian eruption). These samples were selected primarily because their syneruptive ascent histories have been previously constrained using volatile concentration gradients in melt embayments (Lloyd et al., 2014; Ferguson et al., 2016; Newcombe et al., 2020), volatile loss from olivine-hosted melt inclusions (Lloyd et al., 2013), and concentration gradients of water preserved in olivine and/or clinopyroxene phenocrysts (Lloyd et al., 2016a; Newcombe et al., 2020). These previous studies of syneruptive magma ascent will allow us to examine potential relationships between thermal histories and ascent histories of magmas in the last few seconds to hours of their transport to the surface. The studied eruptions span a range of eruptive styles, from the low-intensity fire-fountain eruptions of Seguam and Kilauea Iki to the high-intensity subplinian eruption of Fuego. Further details of the studied eruptions are provided below.
We selected 19 olivine-hosted melt inclusions from the same airfall samples studied by Lloyd et al., (2013, 2014, 2016a). These samples erupted on 17th October, 1974, and were collected during the eruption by S. Bonis of the Instituto Geográphico Nacional, Guatemala City and provided by William Rose (IGSN: ASL000001, ASL000002 and ASL000003). Olivine from this phase of the eruption ranges in composition from Fo72 to Fo78 (Lloyd et al., 2013). Of the melt inclusions selected, four were previously characterized for major, minor, and volatile element concentrations by Lloyd et al. (2013) (sample names 127-1, 132-2, 136-9, and 134D-R7). The melt inclusions were derived from tephra with a range of clast sizes, and therefore they likely experienced a range of post-eruptive thermal conditions: Twelve of the melt inclusions were derived from ash (particles with diameter < 2 mm; Lloyd et al., 2013); one inclusion was derived from a lapillus (sample 136-9 of Lloyd et al., 2013; lapilli range in size from 2 to 64 mm); and six were derived from the outer rim of a volcanic bomb (sample 134D-R7 of Lloyd et al., 2013; volcanic bombs are classified here as clasts with diameters > 64 mm).
The 17th October event had a volcanic explosivity index (VEI) of 4 and its eruptive column is estimated to have reached a height of ∼15 km (Rose et al., 1978). The average decompression rate of magma erupted during the 17th October subplinian event was estimated by modeling the generation of volatile concentration gradients in olivine-hosted melt embayments. The H2O, CO2 and S profiles in four embayments yielded decompression rates between 0.3 and 0.5 MPa/s for magma that ascended from its pre-eruptive storage region (at a depth of ∼10 km) over a time period of 8–12 min and at a velocity of 11–17 m/s (Lloyd et al., 2014). Shapes of water concentration gradients measured across clinopyroxene phenocrysts from this eruption are consistent with the timescales of magma ascent derived from the olivine-hosted melt embayments (Lloyd et al., 2016a).
We selected 12 olivine-hosted melt inclusions from a rapidly quenched tephra sample (sample SEG-07-06 of Zimmer et al., 2010). Melt inclusions from this sample were previously reported to contain 3.3 ± 0.33 wt% water and their olivine hosts have compositions that range from Fo80 to Fo85 (Zimmer et al., 2010). Lloyd et al. (2016a) report water concentrations of clinopyroxene phenocrysts and associated melt inclusions from tephra sample SEG-07-06 and from a coevally erupted lava flow, for which they developed a model of post-eruption water loss from the lava samples during slow cooling. Newcombe et al. (2020) report best-fit decompression rates for the Seguam 1977 eruption spanning 0.02 to 0.23 MPa/s, based on fitting volatile concentration gradients in olivine-hosted melt embayments and fitting water concentration gradients along the crystallographic “a” axis of olivine phenocrysts. Plateaus in sulfur concentration observed along the profiles of melt embayments from Seguam suggest pre-eruptive stalling and/or crystallization of the Seguam magma at a range of depths. Best-fit decompression histories derived from Seguam melt embayments suggest magma ascent durations of 9–320 min from initial pressures of 61–308 MPa (Newcombe et al., 2020).
We selected olivine-hosted melt inclusions from three contrasting summit eruptions of Kilauea volcano, Hawaii, which were previously studied by Ferguson et al. (2016), who used volatile concentration gradients in olivine-hosted melt embayments to determine magma ascent rates during each eruption. A brief description of the three eruptions is provided below.
The Kilauea Iki fire-fountain eruption began on November 14, 1959, and its 16 main eruptive episodes spanned 36 days (Richter et al., 1970; Mueller et al., 2019). Each eruptive episode began with a phase of pyroclastic fountaining and coeval filling of a lava lake, followed by the abrupt cessation of fountaining and subsequent draining of part of the lava lake back into the vent (Eaton et al., 1987). For this reason, magma erupted during every eruptive episode after episode 1 suffered from mixing with lava that drained back into the vent during the previous eruptive episode(s) (Eaton et al., 1987; Wallace and Anderson, 1998; Sides et al., 2014). In order to avoid potential complexities in the ascent and thermal histories of magmas that have mixed with degassed and cooled drainback lava in the conduit, we focus on tephra from episode 1 of the eruption which was the least affected by lava drainback and shallow storage. Fire fountains from episode 1 of the Kilauea Iki eruption reached a maximum height of ∼380 m and produced ∼30 × 106 m3 of lava over 7 days (Richter et al., 1970; Eaton et al., 1987).
We selected six olivine-hosted melt inclusions from tephra layer ρ17 of Stovall et al. (2011) collected and provided by Bruce Houghton. Tephra from this layer is relatively coarse, with a mean maximum clast size of ∼55 mm (Stovall et al., 2011). The host olivine phenocrysts range in composition from Fo86 to Fo89 and the inclusions contain 0.65–0.81 wt% water [D. Ferguson, unpublished data; see also Sides et al. (2014)]. Ferguson et al. (2016) used volatile concentration gradients along an olivine-hosted melt embayment from this sample to constrain a magma decompression rate of ∼0.05 ± 0.005 MPa s–1 from 110 MPa (∼4 km depth) during episode 1, corresponding to an ascent duration of ∼36 min at an average velocity of ∼2 ms–1.
The basal reticulite of the Keanakāko’i tephra is thought to have erupted c. 1500 CE from widely spaced vents around the rim of Kilauea’s caldera (Swanson et al., 2012; May et al., 2015). The Keanakāko’i basal reticulite forms in a thick layer (up to ∼65 cm) along much of the caldera rim (Swanson et al., 2012). The deposition of reticulite so close to its vent is consistent with its eruption in a high fire fountain (estimated to be >600 m) from a deep caldera (estimated to be ∼200–300 m deep), such that any denser pumice and scoria fell back into the caldera, thereby allowing the preservation of the delicate reticulite along the caldera rim (Swanson et al., 2012). The reticulite is golden-brown in color with clast diameters from <1 cm to ∼20 cm, and it exhibits a distinctive open-cell polyhedral structure (i.e., similar to honeycomb) with vesicularities of ∼95–98 vol.% (May et al., 2015). The formation of this distinctive and delicate texture is thought to require rapid ascent and late vesiculation of supersaturated melt, followed by a period of textural maturation by Ostwald ripening in the eruptive fountain, which is estimated to occur in <20 s (Mangan and Cashman, 1996). Given these textural constraints, we might expect the syneruptive thermal history of the reticulite to be consistent with rapid ascent along a liquid adiabat followed by quenching in air over a timescale on the order of 10 s.
We have analyzed two olivine-hosted melt inclusions from the 1500 CE reticulite also collected by Bruce Houghton. Their host olivine crystals range in composition from Fo87 to Fo89 and the inclusions contain ∼0.6 wt% water. Ferguson et al. (2016) report magma decompression rates for the basal reticulite of 0.1–0.32 ± 0.02 MPa s–1 from an initial pressure of 40 MPa (∼1.5 km depth), based on diffusion modeling of volatile concentration gradients in melt embayments.
The 1650 CE subplinian layer 6 deposit of the Keanoakāko’i tephra is a widely dispersed and conspicuously coarse layer of fall scoria (McPhie et al., 1990). The deposit can be mapped to the coast, ∼20 km from the vent, and its dispersal in a southeasterly direction suggests that the eruptive plume reached the jet stream, thereby implying plume heights of ∼10–20 km (Swanson et al., 2012). The layer 6 deposit is thought to be the product of a small-volume, explosive eruption with no evidence for groundwater involvement (McPhie et al., 1990). The compositions of glasses in layer 6 juvenile clasts exhibit linear trends on MgO variation diagrams of TiO2 and K2O that are consistent with magma mixing, possibly involving three endmember components (Garcia et al., 2018).
We have analyzed one olivine-hosted melt inclusion from the scoriaceous component of the 1650 CE layer 6 deposit collected by Don Swanson. The olivine host of this melt inclusion has a composition of Fo89, and the inclusion contains 0.6 wt% water. Ferguson et al. (2016) report a magma decompression rate for the layer 6 deposit of 0.45 ± 0.01 MPa s–1 from an initial pressure of 60 MPa (∼2 km depth), based on diffusion modeling of volatile concentration gradients in an olivine-hosted melt embayment.
Melt inclusions and their host olivine phenocrysts were analyzed for major, minor, and trace elements using a Cameca SX100 microprobe (EMP) at the American Museum of Natural History (AMNH). We analyzed linear traverses along the diameters of the melt inclusions (beginning and ending in the adjacent host olivine), with each analysis along the traverse being spaced ∼2 μm apart (see also Newcombe et al., 2014). The traverses were analyzed using a 10 nA beam current and a 15 kV accelerating potential with a focused beam (nominal beam diameter ∼1 μm). On-peak counting times for major elements varied between 5 s (Na), 20 s (Mg, Si, K Ca, Al, and Fe), and 40 s (Mn, Ti, and P). Background counting times for the elements were set to 50% of their on-peak counting times. All analyses were corrected for inter-run calibration offsets using factors determined by replicate analyses of in-house, hydrous basaltic glass standards FR:ND-60-01 and MR:ND-70-01 (Lloyd et al., 2013; Ferguson et al., 2016). Raw data, corrected data, accepted compositions of glass standards, and correction factors are provided in the Supplementary Data Tables. Replicate analyses of glass standards FR:ND-60-01 and MR:ND-70-01 yielded average RSDs of <1% for SiO2, <2% for Al2O3 and MgO, and <3% for FeO and CaO. We note that use of a focused beam on hydrous glasses is known to cause sodium loss (London, 2005). We aimed to minimize this effect while maximizing the spatial resolution and precision of our major element analyses by reducing the on-peak counting time for Na to 5s and by analyzing sodium during the first pass of analyses.
Concentrations of volatiles (H2O, CO2, S, Cl, and F) in 11 melt inclusions from Seguam volcano were characterized using the Cameca NanoSIMS 50L at the Department of Terrestrial Magnetism, Carnegie Institute of Washington, following previously developed analytical protocols (Hauri et al., 2002, 2011; Lloyd et al., 2014; Ferguson et al., 2016). Samples were mounted in dental resin; polished to 0.25 μm; cleaned in ultrasonic baths of toluene, acetone and isopropanol; baked in a vacuum oven at ∼110°C for several days; pressed into indium mounts; coated in gold; and placed into the sample exchange chamber of the nanoSIMS 1–3 days prior to the beginning of the analytical session. The Cs+ primary beam was tuned to achieve an approximate beam diameter of ∼5 μm and a current of ∼4 nA, with charge compensation provided by an electron gun. Prior to data collection, the sample area was pre-sputtered for 120 s in order to remove the gold coat and surface contamination. The primary beam was rastered over a 10 × 10 μm area. During data collection, electronic gating was applied to ensure the collection of ions from only the inner 14% of the measurement area (corresponding to an area of 3.7 × 3.7 μm). Negatively charged ions of 12C–, 16O1H–, 19F–, 30Si–, 32S–, and 35Cl– were detected simultaneously using six electron multipliers. 30Si– was used as a denominator of all reported ion intensity ratios, and the mass resolution power was sufficient to resolve 16O1H– from 17O. A selection of basaltic and basaltic andesitic glasses with well-characterized major element and volatile contents were used as standards (see Supplementary Data Tables). 35 replicate analyses of basaltic andesite standard glass MR:ND-70-01 yielded relative standard deviations (100∗standard deviation/mean) of 4.4% for CO2, 4.5% for H2O, 2.8% for F, 6.0% for S, and 16.1% for Cl.
We also provide in the Supplementary Data Tables analyses of volatile concentrations in five olivine-hosted melt inclusions from Seguam volcano that were measured using the Cameca IMS 6f SIMS at the Department of Terrestrial Magnetism, Carnegie Institute of Washington. The sample preparation protocols and analytical standards were the same as used for the nanoSIMS analyses described above. Analytical protocols and measurements of secondary standards are provided in Newcombe et al. (2020).
During syneruptive cooling, olivine-hosted melt inclusions typically crystallize a thin rim (on the order of ∼1 μm) on their walls. Rapid crystallization of this olivine rim results in the production of a diffusive boundary layer in the adjacent melt that is depleted in elements that are compatible in olivine (e.g., Mg and Fe) and enriched in incompatible elements (e.g., Al, Ca, Na, K, and Ti). If cooling and crystallization are sufficiently slow, this boundary layer will diffusively propagate toward the center of the melt inclusion. Newcombe et al. (2014) characterized chemical zonation in olivine-hosted melt inclusions from MORB and OIB settings, and they developed a numerical method for using the shape of the MgO zonation in the inclusions to constrain the rate and duration of syneruptive cooling from the liquidus to the temperature corresponding to the lowest measured MgO in the melt. A calculation to demonstrate the expected evolution of MgO zonation in an olivine-hosted melt inclusion in response to cooling and syneruptive crystallization is provided in Figure 1. We have applied the method of Newcombe et al. (2014) to olivine-hosted melt inclusions from arc and OIB settings with well constrained ascent histories with the aim of determining syn- and post-eruptive thermal histories of melt inclusions from explosive eruptions of basaltic and basaltic andesitic magmas containing up to ∼4 wt% water. The consideration in this study of hydrous melts warrants reexamination of parameterizations adopted by the model of Newcombe et al. (2014) to account for changes in the physical and chemical properties of basaltic melts resulting from water addition.
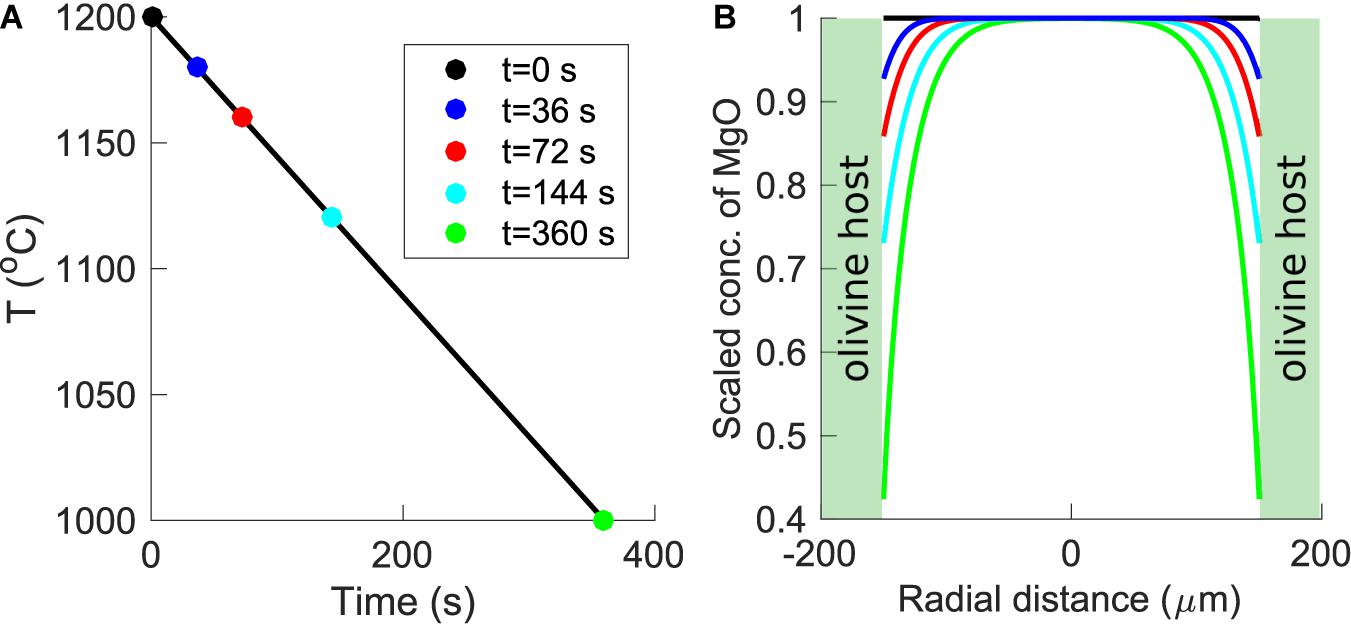
Figure 1. Forward model of the generation of MgO zonation in an olivine-hosted melt inclusion subjected to cooling from 1200 to 1000°C at a rate of 0.6°C/s (based on Figure 7 of Newcombe et al., 2014). (A) Temperature-time path imposed by the forward model. Colored circles indicate “snapshots” of the thermal history that are plotted in (B). (B) Development of MgO zonation in a 150-μm radius melt inclusion in response to the temperature-time path displayed in (A). The inclusion is assumed to have an initially homogenous composition (black line). As the temperature decreases, the MgO concentration in the melt at the edge of the inclusion evolves according to the temperature-dependent partition coefficient of MgO between melt and olivine (Newcombe et al., 2014). In response to the cooling and crystallization-induced decrease of MgO at the inclusion edges, MgO diffuses from the center to the edges of the inclusion. Blue, red, cyan, and green curves show snapshots of the evolution of MgO zonation in the melt inclusion after 36, 72, 144, and 360 s, respectively. The green shaded regions are olivine. Note that the position of the olivine-melt interface is assumed to be fixed. Mass balance calculations indicate that the width of the olivine growth rim produced during syneruptive cooling is typically ∼1% of the radius of the inclusion such that the movement of the olivine-melt boundary can safely be neglected (Newcombe et al., 2014).
The model of Newcombe et al. (2014) applies a temperature-dependent, effective binary MgO diffusivity based on experiments by Chen and Zhang (2008) of olivine dissolution in basaltic melt from the Juan de Fuca (JDF) Ridge. The consideration in this study of melt compositions that are significantly different (particularly in terms of their water concentrations) to JDF basalt raises the question of the extent to which MgO diffusivity (DMgO) varies with melt composition. Natural silicate melts are multicomponent systems, and the diffusion of any one component depends on the concentration gradients of all of the other components. Full treatment of the development of boundary layers within olivine-hosted melt inclusions would require knowledge of the multicomponent diffusion matrix for basaltic and basaltic andesitic melts. While much progress has been made (Kress and Ghiorso, 1995; Liang, 2010; Guo and Zhang, 2016, 2018, 2020), multicomponent diffusion matrices are still only available for dry haplobasaltic and basaltic melts at a few temperatures. Effective binary treatment of MgO diffusion during olivine dissolution has been shown to work well experimentally (Chen and Zhang, 2008) and multicomponent diffusion calculations are consistent with effective binary calculations for MgO (Guo and Zhang, 2020). The advantage of multicomponent diffusion treatment is the ability to simultaneously model diffusion profiles of other major oxides, but the temperature dependence of the multicomponent diffusion matrices are less well constrained than that of the effective binary diffusivity of MgO. Hence, the effective binary treatment is better suited for inferring thermal histories (Newcombe et al., 2014), which is our goal here.
The experimental studies described above constrain DMgO in nominally anhydrous melts; however, no experimental studies are currently available that constrain the effect of H2O on DMgO in basaltic melts. In order to address this uncertainty in our model, we performed an experiment to determine DMgO in hydrous arc basaltic melt. Our experimental setup is similar to that of the olivine dissolution experiments performed by Chen and Zhang (2008), except that a hydrous arc basalt composition (synthesized using reagent-grade powdered oxides; the composition of the starting material is provided in the Supplementary Data Tables) was used in place of JDF basalt, and ∼3.8 wt% water was added to the mixture as Al(OH)3. The powdered starting material was placed in a Ni capsule containing a polished piece of San Carlos olivine. The Ni capsule was placed in a 3/4-inch pyrex-NaCl assembly and was held at 10 kbar and 1225°C in a piston cylinder apparatus (at the Smithsonian Institution) for 2400 s, at which point the experiment was quenched by shutting off the power. The quenched experimental charge was cut and polished along its diameter, and major and minor elements were analyzed by electron microprobe along a traverse normal to the olivine-glass interface. The electron microprobe traverse across the quenched melt reveals that olivine dissolution took place during the experiment, producing diffusive boundary layers that propagated into the adjacent melt (see Supplementary Figure S1). In order to assess the likely effect of water addition on DMgO, we have applied the approach of Chen and Zhang (2008) to constrain DMgO = 3.13(±0.15) × 10–11 m2s–1 in our experimental melt at 1225°C, which is a factor of 3.44 higher than DMgO calculated at 1225°C using the parameterization of Chen and Zhang (2008) for dry basalt. Based on this result, when fitting MgO data in melt inclusions containing hydrous arc basaltic melts (i.e., inclusions from Fuego and Seguam) we reduce our cooling timescales (calculated using the Chen and Zhang (2008) parameterization of DMgO) by multiplying by a factor of 0.29 [i.e., we assume the relationship , where x is the characteristic diffusion length-scale and t is time, such that an increase in DMgO by a factor of 3.44 must be compensated by a decrease in t by a factor of 1÷3.44 (which is equal to 0.29)].
We have also assessed potential uncertainties in our modeled timescales associated with the application of the Chen and Zhang (2008) parameterization of DMgO to our Kilauea melt inclusions. These inclusions contain slightly higher water concentrations (∼0.65–0.81 wt% H2O) than JDF basalt (∼0.3 wt% H2O), and they have different major element compositions (e.g., Kilauea basalts are depleted in Al2O3 and FeO and enriched in MgO compared to JDF basalts). Zhang et al. (2010) proposed a parameterization of DMgO as a function of anhydrous melt composition, and application of this parameterization suggests that DMgO in anhydrous Kilauea melt could be ∼1.5 times DMgO in JDF melt, such that our modeled cooling durations at Kilauea could be off by a factor of ∼0.7 (i.e., 1÷1.5) if we assume the Chen and Zhang (2008) parameterization of DMgO. We note that this offset is within the uncertainty of the DMgO parameterization of Zhang et al. (2010), which is able to reproduce experimental data within a factor of ∼2, so we consider the Chen and Zhang (2008) parameterization of DMgO to be acceptable for our Kilauea melt inclusions.
A key component of the model of Newcombe et al. (2014) is the assumption of a simple relationship between temperature and MgO concentration of silicate melt in equilibrium with olivine. Many such olivine-liquid thermometers have been proposed (e.g., Roeder and Emslie, 1970; Ford et al., 1983; Beattie, 1993; Sugawara, 2000; Chen and Zhang, 2008; Putirka, 2008). The original model of Newcombe et al. (2014) adopted a thermometer developed by Chen and Zhang (2008), which was calibrated using dissolution experiments of Fo90 San Carlos olivine in basaltic melt from the Juan de Fuca Ridge. Here, we instead adopt the olivine-liquid thermometer of Sugawara (2000), which has the advantages of being calibrated over a wider range of olivine and melt compositions than the thermometer of Chen and Zhang (2008) and of being easy to implement due to the simplicity of the parameterization for which temperature and liquid MgO content are the only variables. We have adapted the Sugawara (2000) thermometer to account for the effect of water on the liquidus temperature of olivine-saturated melt by adding a water-dependent temperature offset based on the results of Médard and Grove (2008):
In equations (1) and (2), T is temperature in Kelvin, ΔTH2O is degrees by which the liquidus temperature is depressed due to water addition, and H2O and MgO are in wt%. Temperatures calculated for our Fuego and Seguam melts using equation (2) are up to ∼50°C lower than temperatures calculated using the model of Putirka et al. (2007). We have tested the effect of this temperature offset on our modeled thermal histories and we find that increasing our temperatures by ∼50°C results in an increase in our best-fit cooling rates by a factor of ∼2 (see Supplementary Material). We note that, while the choice of thermometer affects absolute values of temperatures and cooling rates calculated by our model, our focus here is on relative changes in temperature and cooling rate during syneruptive magma cooling, and we expect relative differences between thermal histories of the melt inclusions to be preserved with the consistent application of any thermometer.
The starting temperature for the thermal history modeling is calculated based on an estimate of the pre-eruptive MgO concentration of each melt inclusion, and the final temperature considered by the model is the temperature corresponding to the lowest measured MgO concentration at the edge of the melt inclusion. For the Fuego melt inclusions (in Fo71–76 olivine hosts), we estimated the pre-eruptive MgO concentration of the inclusions by calculating the liquid MgO concentration that would be in equilibrium with the far-field olivine host (Figure 2), assuming an Fe-Mg exchange coefficient (KD) of 0.35 (Toplis, 2005; Lloyd et al., 2013) and a molar Fe3+/Fe2+ ratio of 0.20 (Lloyd et al., 2013). Four of the largest Fuego melt inclusions (VF-127-1; VF-132-2; FuegoNL-7; and VF-136-6) were found to contain slightly higher MgO concentrations than implied by equilibrium with their host olivine crystals (see Figure 2 and Supplementary Data Tables); for these inclusions the average of the central ∼5 measurements of MgO concentration were adopted as the initial MgO concentration. The Fuego melt inclusions exhibit a clear relationship between their central MgO concentrations and the size of the inclusions (Figure 3): On average, the smallest inclusions have the lowest central MgO concentrations and vice versa. This trend is consistent with the idea that the post-entrapment crystallization of this suite of inclusions occurred syneruptively rather than during long-timescale magma chamber processing (i.e., the boundary layer of MgO depletion produced during syneruptive olivine crystallization is able to propagate to the centers of the small inclusions in the suite, while this boundary layer is confined to the edges of the large inclusions such that their central MgO concentrations are unmodified).
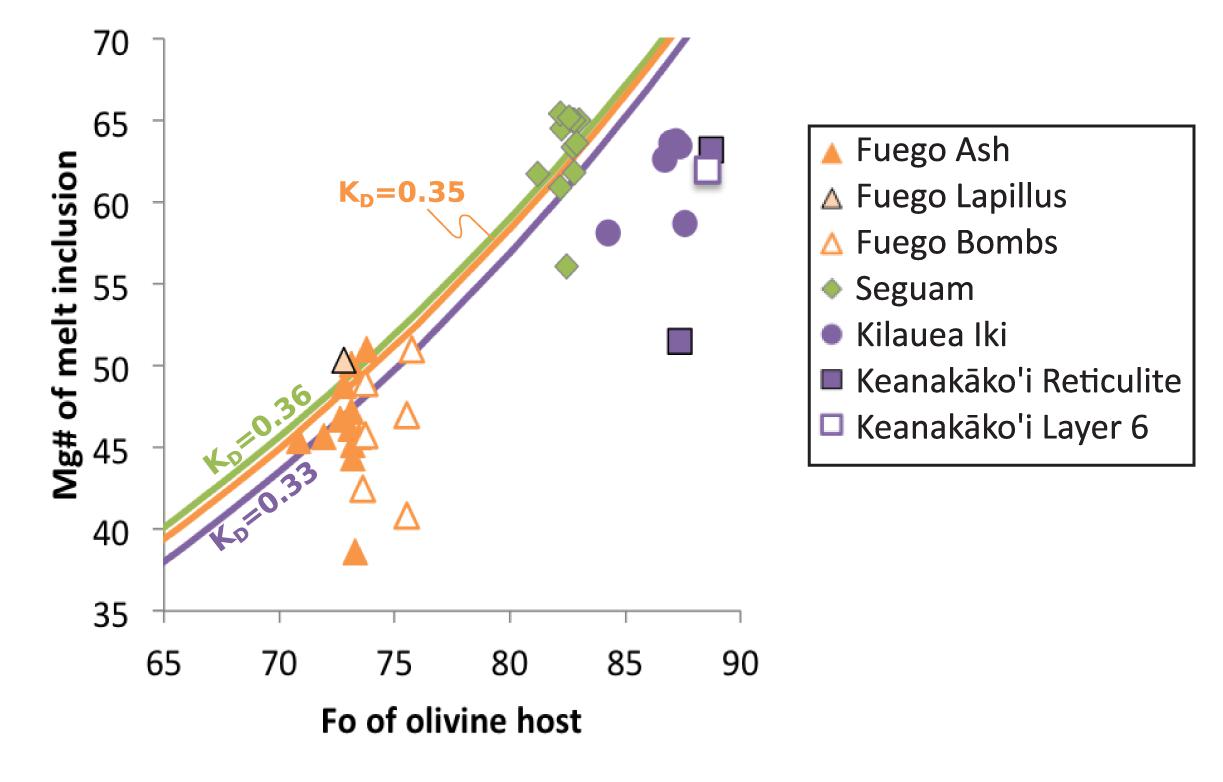
Figure 2. Mg# [molar Mg/(Mg + Fe2+)] of melt inclusions against forsterite content of their host olivine crystals. Fe3+/(Fe3+ + Fe2+) in the melt is assumed to be 0.2 at Fuego (Lloyd et al., 2013), 0.23 at Seguam (Zimmer et al., 2010), and 0.18 at Kilauea (Helz et al., 2017). The colored curves indicate equilibrium between olivine and melt, assuming the composition-dependent model for KD proposed by Toplis (2005) (Fuego in green, Seguam in orange, and Kilauea in purple). Note that all Kilauea melt inclusions and the majority of Fuego melt inclusions have undergone some amount of post-entrapment crystallization of olivine (i.e., their measured compositions lie below the equilibrium curve), while several of the Seguam inclusions appear to have undergone post-entrapment melting (i.e., their compositions are too Mg-rich to be in equilibrium with their olivine hosts).
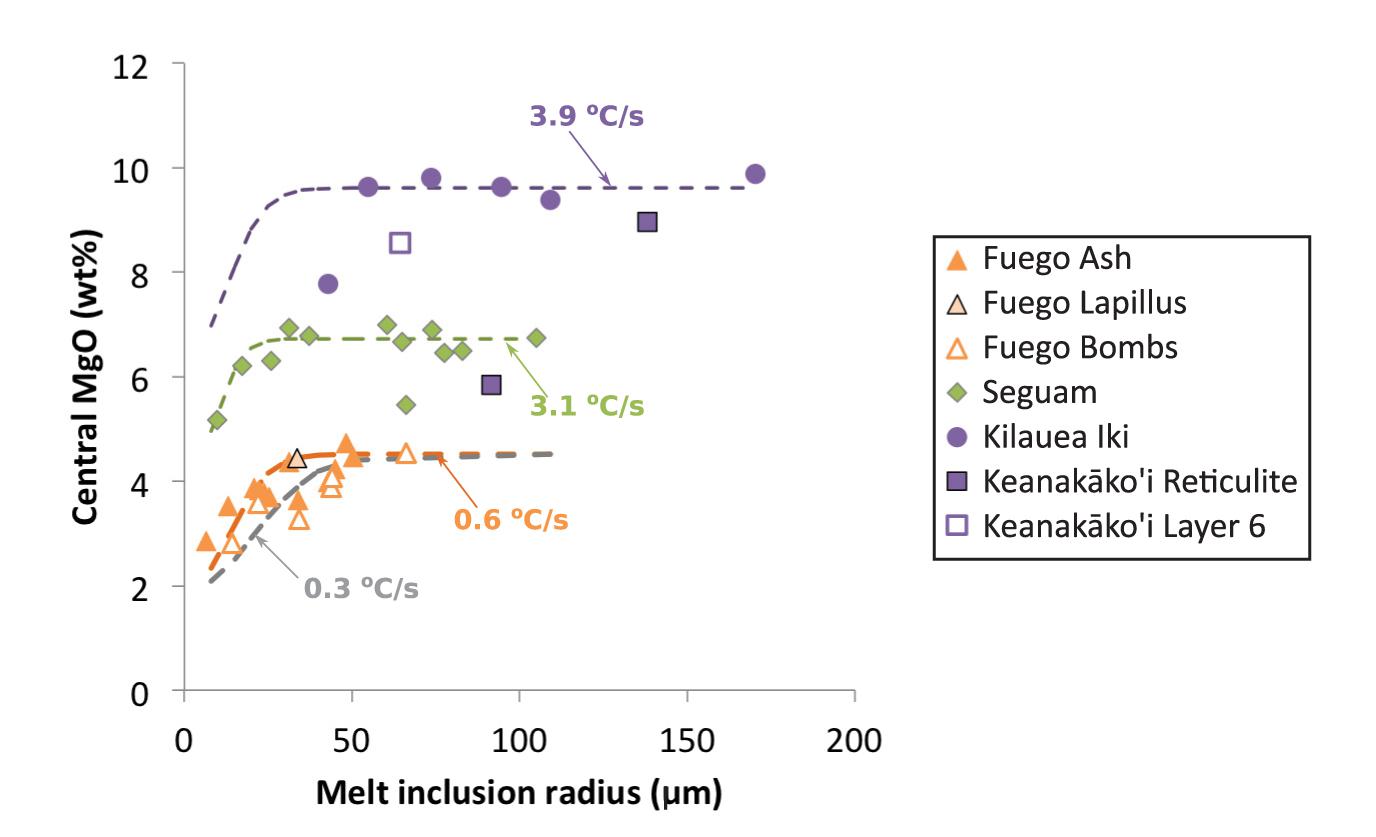
Figure 3. MgO concentration measured in the centers of melt inclusions (not corrected for post-entrapment crystallization) plotted against inclusion radius. Each point represents an average of ∼5 MgO measurements. Inclusions from Fuego with radii <∼50 μm and inclusions from Seguam with radii <∼30 μm are depleted in MgO in their centers due to the propagation of a diffusive boundary layer of MgO depletion produced during syneruptive olivine crystallization on the inclusion walls. Colored dashed curves show relationships between central MgO concentrations and inclusion radii calculated by a one-stage linear cooling model. The initial MgO concentration and cooling rate for each model were set to the average best-fit values determined by fitting MgO concentration gradients in individual melt inclusions from Fuego ash and bombs, Seguam, and Kilauea Iki (see Figure 4). The purple curve uses an initial MgO of 9.6 wt% and a cooling rate of 3.9°C/s (designed to match the Kilauea Iki melt inclusions); the green curve uses an initial MgO of 6.7 wt% and a cooling rate of 3.1°C/s (to match the Seguam inclusions); the orange curve uses an initial MgO of 4.5 wt% and a cooling rate of 0.6°C/s; and the gray curve uses an initial MgO of 4.5 wt% and a cooling rate of 0.3°C/s (to match the Fuego bombs).
For the Seguam melt inclusions (in Fo82–83 hosts), calculation of the liquid MgO concentration implied by equilibrium with the far-field olivine [using the model of Toplis (2005) to calculate a KD of 0.34 and assuming a molar Fe3+/Fe2+ ratio of 0.23 (Zimmer et al., 2010)] reveals that several of the melt inclusions have MgO concentrations that lie above their expected equilibrium values (Figure 2). This suggests that several of the inclusions may have undergone a small amount of post-entrapment melting prior to eruption. For these inclusions, we assume an initial MgO concentration equal to the average of ∼5 MgO measurements from their center. For the few inclusions that appear to have undergone syneruptive post-entrapment crystallization (Seg1-MI2; Seg6-MI2; Seg6-MI3), we assume an MgO concentration implied by equilibrium with their olivine host. Notably, those inclusions for which diffusion has reached the inclusion centers are the smallest in diameter in the Seguam suite (Figure 3).
For the Kilauea melt inclusions (in Fo83–88 hosts), calculation of the liquid MgO concentration implied by equilibrium with the far-field olivine [using the model of Toplis (2005) to calculate a KD of 0.33 and assuming a molar Fe3+/Fe2+ ratio of 0.18 (Helz et al., 2017)] reveals that all of the melt inclusions in this suite have undergone extensive post-entrapment crystallization (9.25–25%; see Figure 2). The Kilauea inclusions are all relatively large (radii range from 43 to 170 μm; see Figure 3 and Supplementary Data Tables), and many of the inclusions exhibit long central plateaus of approximately constant MgO, Al2O3, CaO and SiO2 concentrations (Figure 4 and Supplementary Data Tables). The existence of central plateaus in MgO and other major element concentrations in these inclusions indicates that the post-entrapment crystallization that impacted the central compositions of the inclusions must have happened long enough prior to ascent and syneruptive quenching that the inclusions had time to diffusively re-homogenize. The minimum timescale required for re-homogenization of a ∼102 μm diameter inclusion at magmatic temperatures is only ∼102 min (Newcombe et al., 2014), much shorter than the hours to years available for melt re-homogenization during residence of the inclusion in a magma chamber (Danyushevsky et al., 2000, 2002; Lynn et al., 2017; Rasmussen et al., 2018). Once re-homogenized, information about the timescale of post-entrapment crystallization is lost from the melt inclusion, although information concerning the timescale of crystallization may be derived from chemical gradients in the surrounding host olivine (Danyushevsky et al., 2002). The focus of this study is on syneruptive thermal histories of olivine-hosted melt inclusions, so we have used the average of the central ∼5 MgO measurements in each of the Kilauea melt inclusions as the initial MgO concentration for the thermal history modeling. We note that this choice of initial condition does not consider the pre-eruptive magmatic histories of these melt inclusions in the hours to years prior to ascent and eruption, but instead focuses on temperature changes during the seconds to hours of magma ascent and syneruptive quenching.
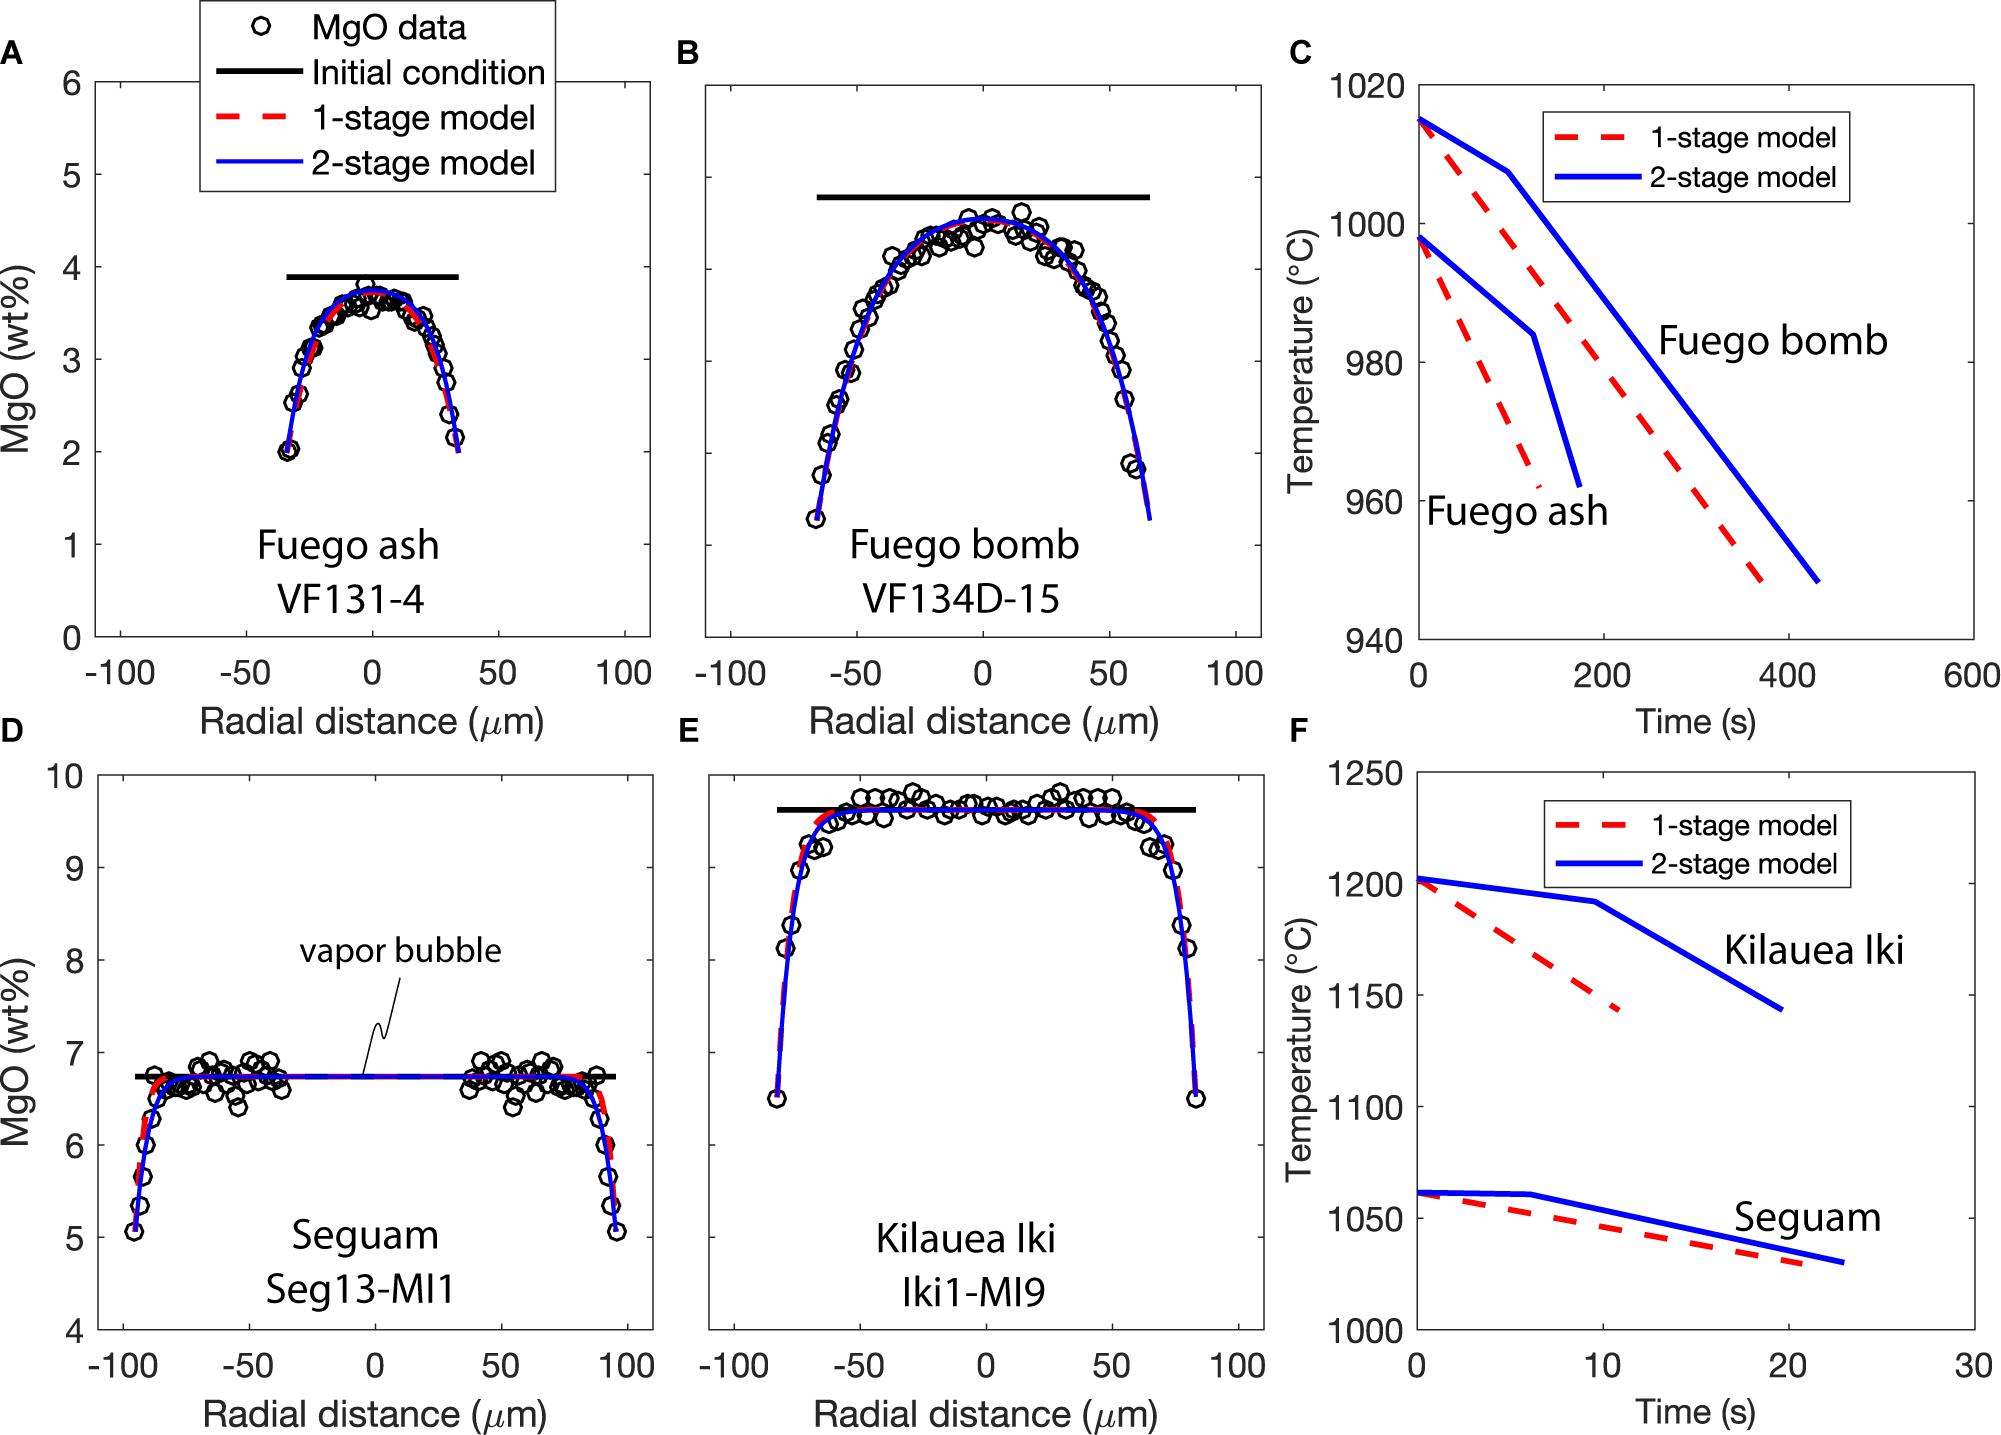
Figure 4. Results of thermal history fitting to MgO concentration gradients in melt inclusions using the model of Newcombe et al. (2014), modified as described in section “Constraint of Syneruptive Thermal Histories Using MgO Zonation in Olivine-Hosted Melt Inclusions.” One representative melt inclusion is shown for Fuego ash and volcanic bombs, Seguam, and Kilauea Iki. Data and model fits for all melt inclusions are provided in the Supplement. MgO data from each inclusion have been fit to both one- and two-stage linear thermal histories. MgO data and best-fit thermal history model curves for (A) Fuego ash inclusion VF131-4, (B) Fuego bomb inclusion VF134D-15, (D) Seguam inclusion Seg13-MI1, and (E) Kilauea inclusion Iki1-MI9. Best-fit one- and two-stage thermal histories for (C) Fuego inclusions VF131-4 and VF134D-15 and (F) Seg13-MI1 and Iki1-MI9. Note difficult scales for (C,F).
We measured major element concentration gradients across a total of 40 olivine-hosted melt inclusions: 19 from Fuego (12 inclusions from ash, 6 inclusions from bomb interiors, and 1 inclusion from lapilli), 12 from Seguam, and 9 from Kilauea (6 inclusions from Kilauea Iki, 2 inclusions from the 1500 CE reticulite, and 1 inclusion from the 1650 CE subplinian deposit). Every melt inclusion analyzed exhibits chemical zonation consistent with that described by Newcombe et al. (2014). All of the inclusions have regions of MgO depletion at their edges, indicative of rapid crystallization of olivine on the inclusion walls in response to syneruptive cooling. Interestingly, some of the Seguam inclusions (Seg4-MI1, Seg5-MI1, Seg6-MI1, and Seg7-MI1; see Supplementary Material) exhibit subtle hints of concave-up concentration gradients of MgO across their centers, which may reflect a period of heating prior to quenching on eruption. This would be consistent with the observation that these inclusions have melt compositions that are too primitive to be in equilibrium with their host olivine (Figure 2), which could be explained if they had undergone a small amount of post-entrapment melting prior to eruption. Alternatively, the concave-up MgO profiles could be a consequence of multicomponent diffusion effects (Saper and Stolper, 2020) or they could conceivably be an artifact of melt advection during growth of the large vapor bubbles observed in the majority of these inclusions.
There are some other notable characteristics of the MgO zonation observed in melt inclusions from each eruption. For example, the largest of the melt inclusions erupted during the Seguam and Kilauea Iki fire-fountain eruptions exhibit long plateaus of approximately constant MgO across their centers and sharp decreases in MgO that are confined to the outer ∼10–20 μm of the inclusions (e.g., Seg4-MI1, Seg5-MI1, Seg7-MI1, Seg13-MI1, Seg15-MI1, Iki-MI6, Iki-MI7, and Iki-MI9; see Figure 4 and Supplementary Material). These narrow zones of MgO depletion indicate that the syneruptively generated boundary layer was unable to reach the centers of these melt inclusions before they cooled below the closure temperature for MgO diffusion through the melt. In contrast, syneruptively generated MgO concentration gradients in the Fuego melt inclusions appear to have propagated to the centers of even the largest inclusions in this sample suite.
We have used the model of Newcombe et al. (2014), modified as described in section “Constraint of Syneruptive Thermal Histories Using MgO Zonation in Olivine-Hosted Melt Inclusions,” to find one- and two-stage linear thermal histories that are best able to reproduce the shapes of the MgO concentration gradients measured in our olivine-hosted melt inclusions. A Monte Carlo approach is used to find the best-fit cooling rates and the uncertainties associated with these cooling rates for each melt inclusion (details of this approach are described in Newcombe et al., 2014). Our code is freely available on Github1, the best-fit thermal histories and fits to the data are provided in the Supplementary Material, and the results of fitting the MgO gradients to the one-stage model are summarized in Figure 5. Melt inclusions from the 1959 Kilauea Iki fire fountain eruption record the highest syneruptive cooling rates (3–11°C/s) and the shortest cooling durations (4–19 s), while inclusions from the 1974 subplinian eruption of Fuego volcano record the lowest cooling rates (0.1–1.7°C/s) and longest cooling durations (21–368 s) of the studied eruptions (Figure 5). Our best-fit cooling rates for Kilauea Iki are in excellent agreement with best-fit cooling rates for this eruption determined by Saper and Stolper (2020). Notably, the inclusions sampled from the interiors of small (∼6 cm diameter) volcanic bombs at Fuego are found to have cooled more slowly on average than inclusions sampled from ash (with particle diameters < 2 mm) during the same eruption (see discussion in section “Influence of Clast Size on Post-Eruptive Thermal Histories”).
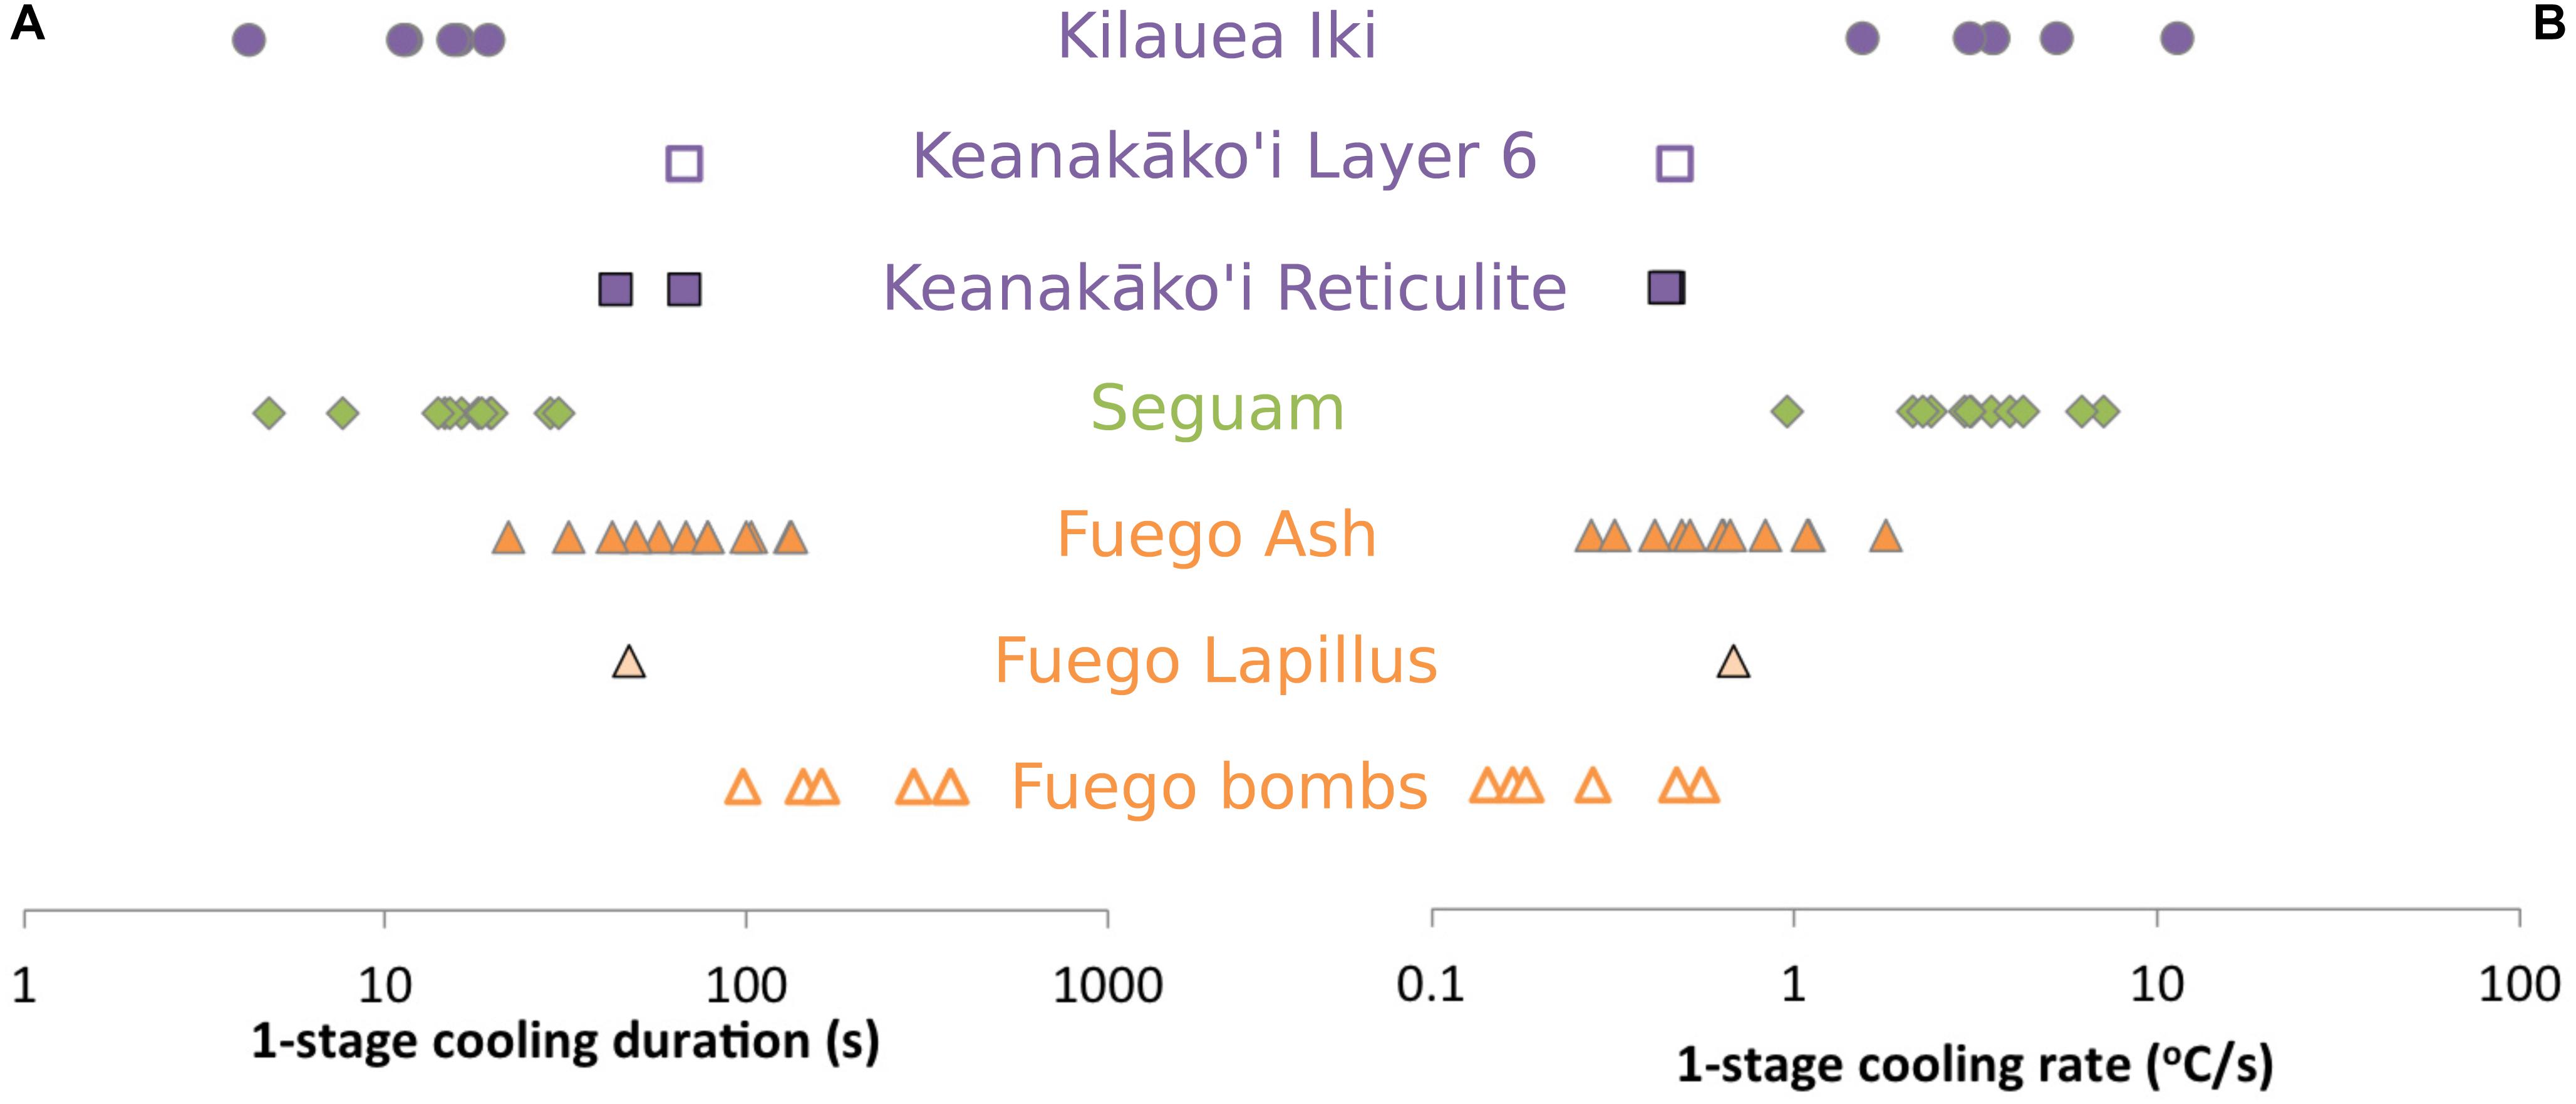
Figure 5. Results of thermal history modeling (A) Best-fit cooling durations obtained by fitting MgO concentration gradients in olivine-hosted melt inclusions to a one-stage linear cooling model. (B) Best-fit cooling rates obtained by fitting MgO concentration gradients in olivine-hosted melt inclusions to a one-stage linear cooling model. Estimated errors on best-fit parameters are provided in the Supplementary Data Tables.
In addition to fitting MgO concentration gradients in individual melt inclusions, we have also examined trends between the central MgO concentration of the inclusions and the radii of the inclusions (Figure 3). Our expectation is that, for a given cooling rate, there will be a critical melt inclusion radius above which the leading edge of the diffusive boundary layer produced during syneruptive olivine crystallization will not be able to propagate to the center of the inclusion, thereby leaving the centers of all inclusions that are larger than this critical radius unmodified from their pre-eruptive compositions. Inclusions smaller than this critical radius should exhibit a trend of decreasing central MgO with decreasing inclusion size (assuming that all inclusions in a suite experience similar cooling rates and have similar initial MgO concentrations). Such a trend was observed in melt inclusions from the Siqueiros transform fault and was successfully reproduced by a syneruptive cooling model (Figure 5 of Newcombe et al., 2014). Similar trends are observed here at Seguam and Fuego, and these trends can also be reproduced by single-stage linear cooling models (see curves on Figure 3). At Seguam, the critical radius above which the central compositions of the inclusions are unmodified from their pre-eruptive values is ∼30 μm, while at Fuego, the critical radius is ∼40 μm for the ash-derived melt inclusions and >60 μm for the bomb-derived melt inclusions (i.e., all of the bomb-derived inclusions have compositions that appear to have been modified by the propagation of syneruptive boundary layers to their centers). We note that inclusion Seg4-MI1 appears to be an outlier of the central MgO vs. melt inclusion radius relationship observed at Seguam; however, this particular inclusion is hosted in lower forsterite (Fo81.2) olivine than other inclusions in this suite, and despite the relatively low MgO content of this inclusion, its central composition does not appear to have been modified by syneruptive boundary layer propagation (see Supplementary Material and Data Tables). This inclusion may have been picked up from a cooler, more evolved part of the magmatic system during ascent.
The model curves on Figure 3 were generated using the average best-fit cooling rate determined by fitting MgO profiles across individual inclusions from each deposit: the Fuego ash cooling model assumes a cooling rate of 0.6°C/s; the Fuego bomb cooling model assumes a cooling rate of 0.3°C/s; and the Seguam cooling model assumes a cooling rate of 3.1°C/s.
Unlike the Seguam and Fuego inclusions, melt inclusions from Kilauea do not exhibit clear trends between their central MgO concentrations and inclusion size. The majority of these inclusions have plateaus of approximately constant MgO across their centers, with narrow zones of MgO depletion confined to the outer few tens of microns of the inclusions. All of the inclusions from Kilauea have undergone large amounts (∼10–25%) of post-entrapment olivine crystallization (see Supplementary Data Tables). The central plateaus of MgO concentration across these inclusions indicate that this post-entrapment cooling and crystallization occurred long enough prior to eruption that the inclusion compositions were able to re-homogenize before the generation of syneruptive boundary layers. The relatively uniform central MgO concentrations of the Kilauea Iki inclusions is consistent with a model of rapid syneruptive cooling (the Kilauea cooling model curve on Figure 3 assumes a cooling rate of 3.9°C/s) such that only inclusions with radii <30 μm (i.e., smaller than any of the inclusions analyzed) would have their center compositions modified by boundary layer diffusion.
In summary, we find significant differences between best-fit thermal histories of melt inclusions from Fuego ash, Fuego bombs, Seguam, and Kilauea. These differences can be distinguished by fitting MgO concentration gradients in individual melt inclusions from each deposit, but they can also be discerned by examining trends in central MgO versus inclusion size.
We observe a negative correlation between syneruptive magma decompression rates and cooling rates (Figure 6). Magmas erupted during fire-fountain-style eruptions (Seguam, Kilauea Iki, and the Keanakāko’i reticulite) decompressed relatively slowly (Ferguson et al., 2016; Newcombe et al., 2020) and experienced relatively rapid cooling over relatively short durations, while magmas erupted during subplinian eruptions (Fuego and the Keanakāko’i layer 6 deposit) decompressed relatively rapidly (Lloyd et al., 2014; Ferguson et al., 2016) and experienced relatively slow cooling over relatively long durations. The origins of the correlation observed in Figure 6 are discussed in section “Causes of Variations in Best-Fit Thermal Histories Among Different Eruptions.”
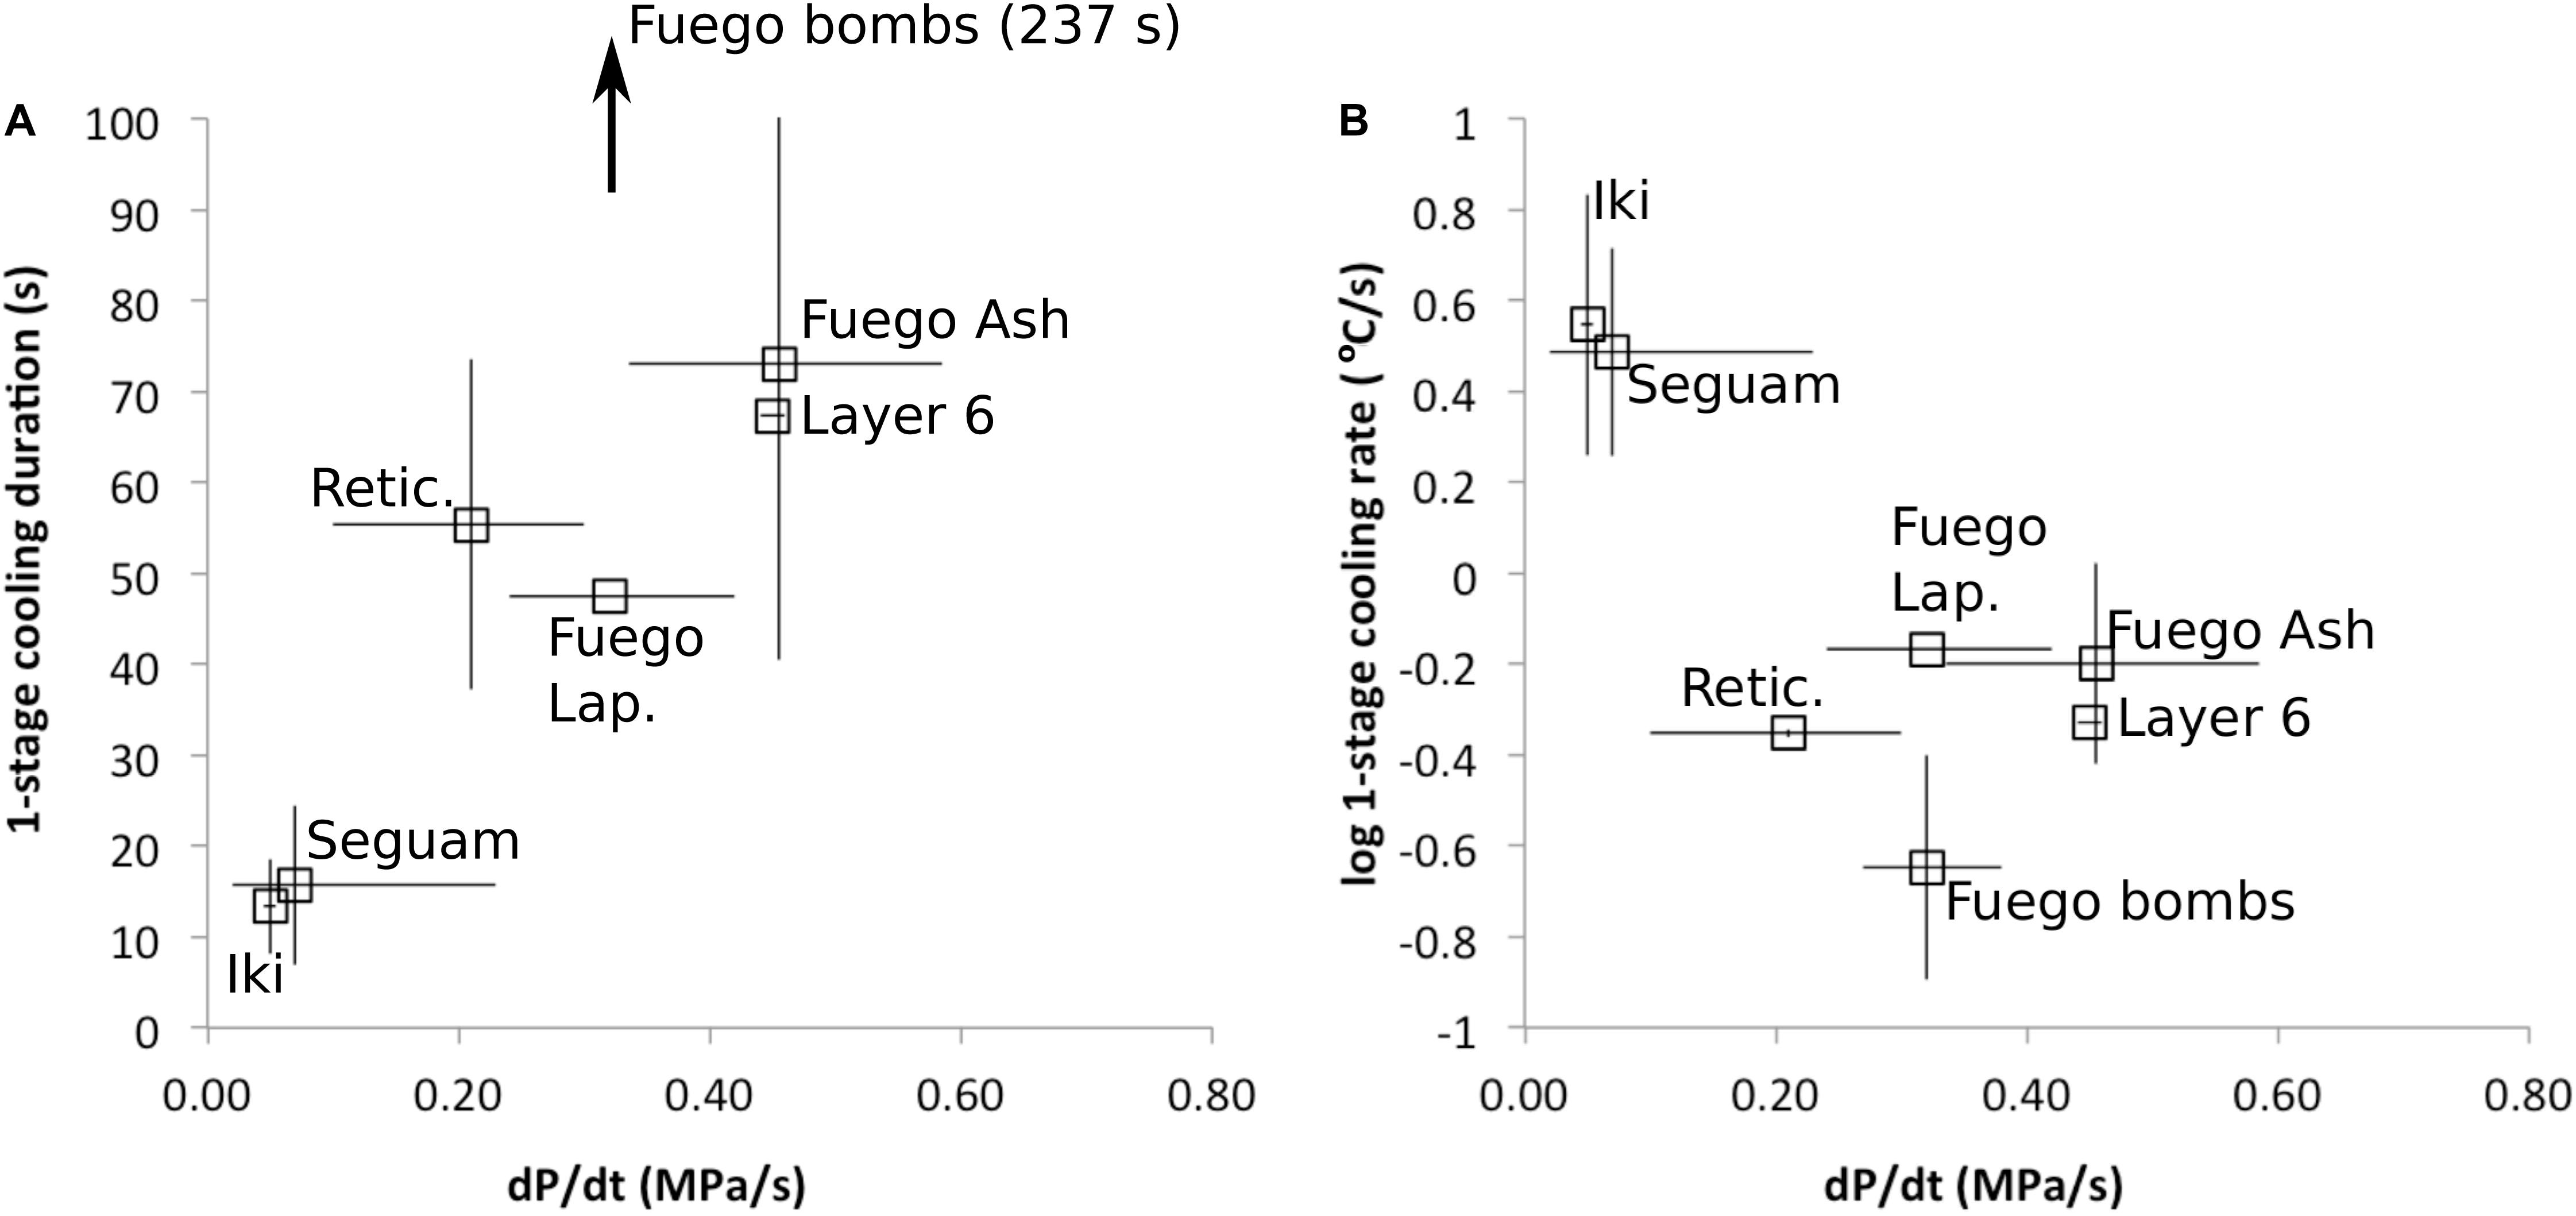
Figure 6. Average best-fit cooling durations and cooling rates versus best-fit decompression rates for each eruption. Decompression rates (and associated error bars) are from the one-stage ascent models of Lloyd et al. (2014), Ferguson et al. (2016), and Newcombe et al. (2020). (A) Average best-fit cooling durations are positively correlated with magma decompression rate. Melt inclusions from the subplinian eruptions (Fuego and the Keanakāko’i layer 6 deposit) experienced longer durations of syneruptive cooling and higher magma decompression rates on average than inclusions from the fire-fountain eruptions (Seguam, Kilauea Iki, and the Keanakāko’i Reticulite). (B) Average best-fit cooling rates are negatively correlated with magma decompression rate. Inclusions from the subplinian eruptions experienced slower cooling, consistent with cooling during ascent in the conduit just prior to quenching on eruption (and/or cooling in the volcanic plume), while inclusions from the fire-fountain eruptions experienced rapid cooling, consistent with sub-aerial quenching, but not consistent with significant cooling in the conduit just prior to eruption.
A recent study by Lloyd et al. (2013) characterized water concentrations of olivine-hosted melt inclusions from clasts of different sizes (fine-grained ash, lapilli, and bombs) erupted at Fuego on 17th October, 1974, and they found that those inclusions from the interiors of the large bomb clasts had lost more water than the inclusions derived from the fine-grained ash. This finding is consistent with the longer expected durations of post-eruptive cooling of large versus small clasts based on simple conductive cooling models.
Conductive cooling models are relatively straightforward to implement and they provide estimates of the thermal histories experienced by volcanic clasts as a function of clast diameter and distance from the cooling surface. However, many parameters required by these models are poorly constrained (see analysis by Birnie and Dyar, 1986) and the models make many simplifying assumptions (e.g., the easiest models to implement are analytical solutions to the heat equation that assume a constant boundary temperature) such that they cannot capture the complexities of syn- and post-eruptive thermal histories of real volcanic clasts. For example, pyroclasts likely break up and change shape during eruptions; grains may migrate from center to edge of a pyroclast (or vice versa) during eruption; tephra may suffer comminution in the conduit; lavas may experience drain-back and re-eruption; clasts may be re-heated by subsequent eruptive events; or post-depositional processing may dislodge individual grains from large clasts. Given the many simplifying assumptions and limitations of most conductive cooling models, and the importance of cooling rate as a control on physical properties of erupting magma (and the ability of olivine-hosted melt inclusions to preserve pre-eruptive water concentrations), much effort has been made to develop techniques for directly measuring syn-eruptive cooling rates of pyroclasts (Zhang et al., 1997, 2000; Gottsmann and Dingwell, 2002; Xu and Zhang, 2002; Potuzak et al., 2008; Nichols et al., 2009; Newcombe et al., 2014; Saper and Stolper, 2020).
The technique developed by Newcombe et al. (2014) of using MgO concentration gradients in olivine-hosted melt inclusions to constrain their syneruptive thermal histories provides a direct record of syn- and post-eruptive magma temperatures during cooling from liquidus temperature to the temperature corresponding to the lowest measured MgO in the melt. This record could potentially be used to identify slowly cooled inclusions, and thereby assess the likelihood of syn- or post-eruptive water loss from the inclusions prior to making expensive and time-consuming measurements of their volatile contents. Additionally, syneruptive cooling rates determined from MgO zonation in melt inclusions can be used to estimate the closure temperature for CO2, which is an important parameter for assessing the extent of CO2 diffusion into melt inclusion vapor bubbles (Maclennan, 2017; Tucker et al., 2019; Rasmussen et al., 2020). To our knowledge, it is the only technique currently available that enables multi-stage syneruptive thermal histories of magma to be constrained.
We have tested the ability of this technique to resolve variations in post-eruptive thermal histories by applying it to the same Fuego ash, lapilli, and bomb samples considered by Lloyd et al. (2013). We observe that the mean duration of cooling experienced by inclusions derived from the bomb clasts is longer (up to ∼6 min; see Figure 5A) than the mean duration of cooling experienced by inclusions derived from ash (up to ∼2 min; Figure 5A), confirming expectations of their relative cooling durations based on conductive cooling models [e.g., Lloyd et al. (2013) use the model of Recktenwald (2006) to estimate post-eruptive cooling durations from ∼1030 to ∼450°C of ∼10 min in the interior of the Fuego bombs and <1 s for the fine-grained ash].
It is notable that the best-fit cooling durations for the ash-derived melt inclusions are significantly longer than the <1 s post-eruptive cooling duration calculated by the conductive cooling model employed by Lloyd et al. (2013). In part, this is due to the assumption made by this conductive cooling model of a constant ambient temperature surrounding the pyroclasts of 30°C, while models of the temperature evolution of fire fountains and volcanic plumes suggest that the ambient temperature experienced by pyroclasts as they exit the conduit decreases from the eruption temperature to temperatures below the closure temperatures for H2O and MgO diffusion over time periods of ∼101 s (Hort and Gardner, 2000; Porritt et al., 2012; Ayris et al., 2014). In addition to post-fragmentation cooling, it is likely that the magma experienced cooling in the conduit prior to fragmentation in response to adiabatic expansion of vapor bubbles, thereby further increasing the durations of cooling recorded by MgO zonation in the ash-derived melt inclusions.
In addition to post-eruptive water loss from melt inclusions derived from large clasts, Lloyd et al. (2013) discuss the possibility that water could be diffusively lost from olivine-hosted melt inclusions during magma ascent and degassing in the conduit. This raises the question of the extent to which water loss (which is known to drive olivine crystallization) could be contributing to the apparent temperature decreases inferred from MgO zonation in the Fuego inclusions. In order to address this question, we have calculated the expected diffusive water loss from melt inclusions with radii of 10–80 μm, positioned 110 μm away from the nearest edge of their host olivine crystal, during magma ascent from 220 MPa to the surface (Figure 7A). Model setup and parameters are provided in the caption to Figure 5. For ascent durations of 10 min (Lloyd et al., 2014), we calculate that melt inclusions with radii as small as 10 μm would lose < 2% of their initial water. This water loss would drive an amount of olivine crystallization equivalent to a temperature decrease of < 4°C [assuming an initial water concentration of 4.2 wt% and the H2O-liquidus temperature function of Médard and Grove (2008)]. Thus, we consider cooling rather than water loss to be the dominant driver of syneruptive crystallization in our Fuego ash melt inclusions.
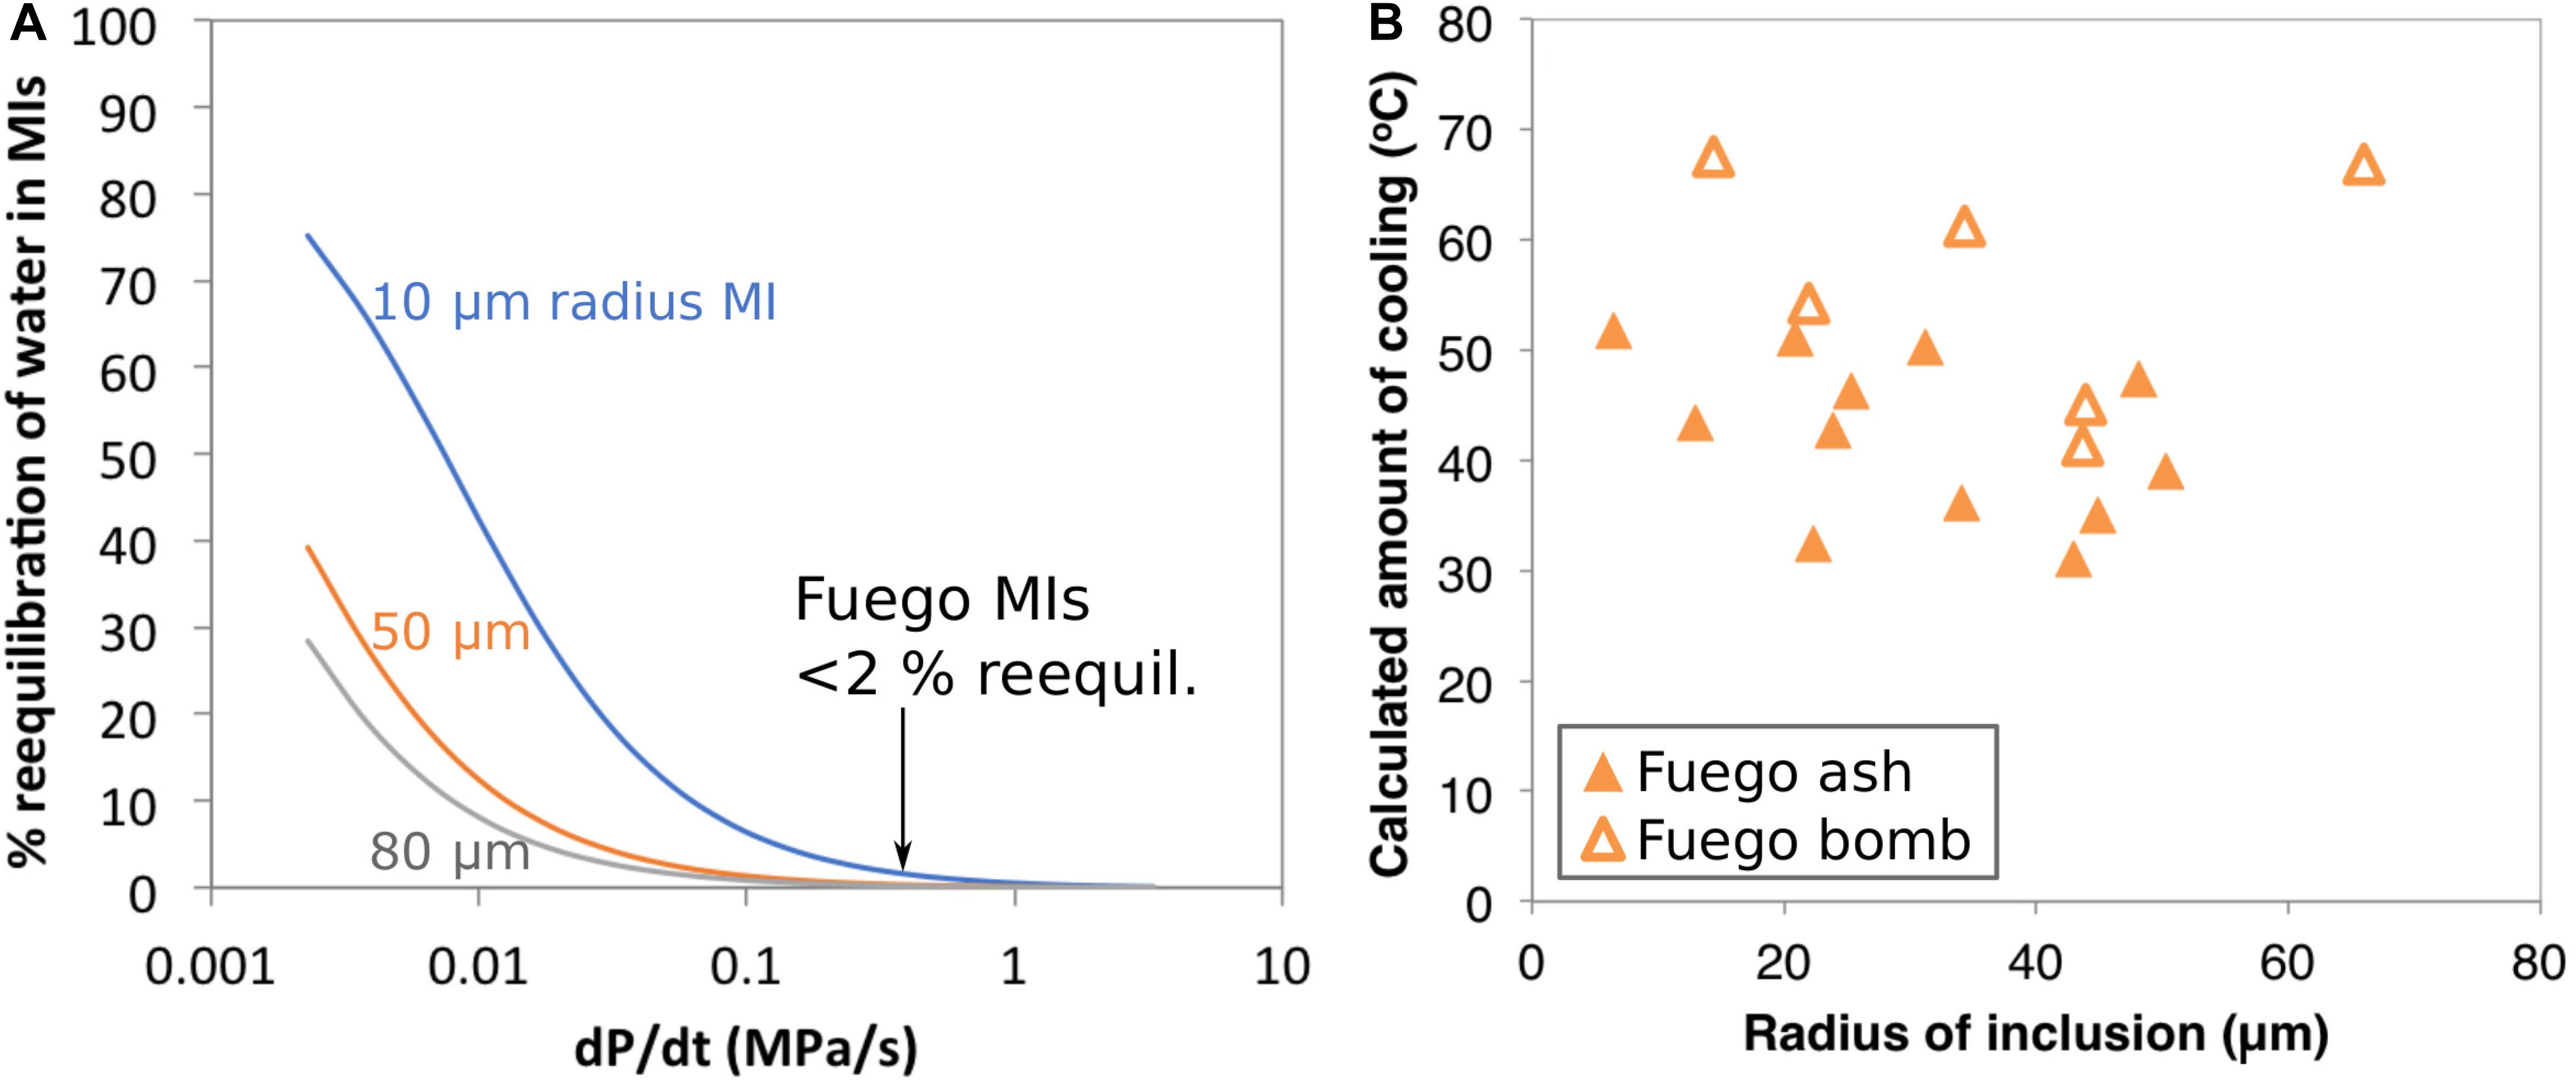
Figure 7. (A) Model of diffusive water loss from olivine-hosted melt inclusions during syneruptive magma decompression. Calculations are shown for melt inclusions with radii of 10, 50, and 80 μm, positioned 110 μm away from the nearest edge of their host olivine crystal. The magma is assumed to ascend from 220 MPa to the surface and to contain an initial water concentration of 4.2 wt%. Parameters for this calculation are chosen based on observations of Fuego olivine-hosted melt inclusions and embayments (Lloyd et al., 2013, 2014). Water diffusivity through olivine is 2.45 × 10– 11 m2s– 1 based on the Arrhenius relationship from Barth et al. (2019) and assuming 1D diffusion along the crystallographic ‘a’ direction at 1030°C. The partition coefficient for water between melt and olivine is assumed to be 0.001 and the external magma is assumed to follow a closed-system degassing path (Newman and Lowenstern, 2002). At a magma decompression rate of ∼0.4 MPa/s (Lloyd et al., 2014) we expect very little water loss (<2%) from the Fuego melt inclusions during ascent. (B) Calculated amount of cooling (i.e., the temperature implied by the maximum measured MgO minus the temperature implied by the minimum measured MgO in each melt inclusion) versus inclusion radius. The lack of a clear negative correlation between these variables supports the conclusion of the calculations in (A) that the Fuego inclusions lose minimal water during magma ascent. The bomb-derived inclusions have higher calculated temperature drops on average than the ash-derived inclusions, consistent with slower cooling of the bomb-derived inclusions to a lower MgO closure temperature and/or post-eruptive water-loss-driven olivine crystallization.
It is apparent on Figure 7B that the bomb-derived melt inclusions have higher calculated amounts of cooling than the ash-derived inclusions, consistent with the lower closure temperature for MgO afforded by slower cooling of these inclusions (see further discussion in the Supplementary Material), and also consistent with some amount of post-eruptive water loss from the bomb-derived inclusions prior to passing through the closure temperature for MgO. The total amount of post-eruptive water loss from the bomb-derived inclusions is estimated to be ∼1 wt% (Lloyd et al., 2013). If this water loss happened above the closure temperature for MgO, it would drive crystallization equivalent to a temperature drop of 37.5°C. However, the temperature drop recorded by the bomb melt inclusions is only ∼20°C greater than recorded by the ash inclusions, suggesting that much of the post-eruptive water loss happened after the cessation of post-entrapment olivine crystallization and diffusion of MgO through the melt. This makes sense given the higher diffusivity, and hence lower closure temperature, of H2O.
Figures 5, 6 demonstrate variations in best-fit thermal histories among our studied eruptions. Some of this variability can be explained as a result of variable clast sizes; e.g., the slower cooling experienced by Fuego bombs versus ash (section “Influence of Clast Size on Post-Eruptive Thermal Histories”). However, clast size is not responsible for all of the observed variation; e.g., our Fuego ash-derived melt inclusions record slower cooling than our Kilauea Iki inclusions despite the smaller average grain size of Fuego ash compared with the average grain size of the Kilauea Iki tephra. Instead, it appears that eruptive style may play a role in controlling the thermal histories recorded by our melt inclusions (Figure 6); e.g., tephra from the Kilauea Iki and Seguam fire fountain eruptions experienced more rapid cooling than tephra from the higher VEI eruptions that generated ash clouds (Fuego and the Keanakāko’i layer 6 deposit).
Why would tephra from the more explosive eruptions experience slower cooling? One possibility is that post-fragmentation cooling of tephra in subplinian ash columns could be slower than post-fragmentation cooling in fire-fountain plumes. Several models of the temperature evolution of volcanic plumes suggest that tephra rapidly cools below the closure temperature of MgO within ∼101 s in both fire-fountain plumes (Porritt et al., 2012) and during Plinian eruptions (Sparks, 1986; Hort and Gardner, 2000). Models and experiments by Ayris et al. (2014) suggest that HCl adsorption by volcanic glasses at temperatures of ∼200–800°C can occur over minute timescales in volcanic plumes, although we note that these adsorption reactions occur below the closure temperature for MgO diffusion. Based on these modeling efforts, we consider it unlikely that the longer thermal histories we observe for our subplinian eruptions are a result of slower post-fragmentation cooling.
Another possibility for explaining the longer cooling durations recorded by melt inclusions from our more explosive eruptive deposits is that the carrier magma for these melt inclusions contained a high vapor fraction in the shallow conduit that drove cooling via adiabatic decompression during the last few minutes of magma ascent in the conduit (considered in greater detail below). We cannot definitively rule out either endmember scenario described above (or indeed, a hybrid model in which the subplinian tephras experienced slower cooling than the fire-fountain tephras both pre- and post-fragmentation). However, regardless of which scenario is correct, the following observations allow us to place constraints on the pre-eruptive P-T-t paths of these magmas during their ascent through the conduit:
• Our largest Fuego and Seguam melt inclusions have central MgO concentrations that are approximately in equilibrium with their far-field olivine hosts (Figures 2, 3). This requires the net temperature change between melt inclusion entrapment and the onset of syneruptive cooling to be minimal (see section “Do the MgO Plateaus Observed in Our Kilauea and Seguam Melt Inclusions Require Approximately Isothermal Magma Ascent, or Are More Complex Thermal Histories Possible”).
• Our largest Seguam and Kilauea Iki melt inclusions have plateaus of MgO across their centers and narrow zones of MgO depletion at their edges that are consistent with approximately isothermal ascent followed by quenching on eruption (although we note that such profiles may not require isothermal ascent; see section “Do the MgO Plateaus Observed in Our Kilauea and Seguam Melt Inclusions Require Approximately Isothermal Magma Ascent, or Are More Complex Thermal Histories Possible”).
In the following sections, we use these constraints and our best-fit thermal histories to assess the validity of syneruptive temperature variations calculated by conduit models.
The observations described in section “Characteristics of Chemical Zonation in the Melt Inclusions” and section “Results of Thermal History Modeling” suggest that magmas erupted during the Kilauea Iki and Seguam fire-fountain eruptions ascended approximately isothermally, while magmas represented by the 1974 Fuego Ash, the Keanakāko’i basal reticulite, and the Keanakāko’i layer 6 deposit underwent net cooling during the last ∼minute of ascent and eruption. As described in the Introduction, the most reasonable process responsible for driving magma cooling on ascent is adiabatic expansion of a vapor phase. In this section, we compare the thermal histories we have determined using MgO concentration gradients in olivine-hosted melt inclusions to results of calculations using the conduit model “Conflow” (Mastin and Ghiorso, 2000; Mastin and Ghiorso, 2001; Campagnola et al., 2016) to explore the meaning and implications of the syneruptive thermal histories experienced by each of the magmas erupted at Fuego, Seguam, and Kilauea.
The Conflow model is used here to calculate the expected changes in temperature, pressure, velocity, and vapor volume fraction during syneruptive ascent of magmas at Fuego, Seguam, and Kilauea volcanoes. This model is one of few existing conduit models that consider temperature changes of magma during ascent (Sahagian, 2005). Assumptions made by the Conflow model include: (1) the magma-gas mixture is treated as a homogeneous fluid (i.e., there is no relative movement between gas and liquid during ascent); (2) gas exsolution is assumed to follow equilibrium solubility laws; (3) the conduit is assumed to be vertical and cylindrical; (4) flow properties are uniform across the radius of the conduit (i.e., the model is one-dimensional); (5) flow is assumed to be steady-state; (6) no heat is transferred across the conduit walls; (7) gas, melt, and crystals are at thermal equilibrium; (8) H2O is the only vapor species; (9) no vapor escapes across the conduit walls; (10) no crystallization occurs during ascent; and (11) magma ascent is assumed to be adiabatic and reversible (i.e., the magma-gas mixture follows an isentropic path). The model is designed to be most applicable to sustained eruptions of rapidly ascending magmas (e.g., basaltic fire-fountain eruptions like the eruptions of Seguam and Kilauea Iki, and Plinian or subplinian eruptions like the Fuego 1974 eruption), and justifications and limitations of the above listed model assumptions are provided in Mastin and Ghiorso (2000). In addition to the assumptions listed above, we further assume a constant conduit diameter of 10 m (Barth et al., 2019), zero crystallinity, and a fragmentation criterion of 0.75 vapor volume fraction. Additional input parameters and model outputs are provided in the Supplementary Data Tables.
The Conflow model calculates the temperature change of ascending magma by applying the following expression of energy conservation (Mastin and Ghiorso, 2001):
where h is specific enthalpy of the magma-gas mixture, u is velocity, z is depth, and g is gravitational acceleration. Integration of equation (3) gives the following expression (Mastin and Ghiorso, 2000):
where h1 is the enthalpy of the melt-vapor mixture at the base of the conduit, u1 is the velocity at the base of the conduit, and z1 is the depth at the base of the conduit. The enthalpy of a crystal-free melt-vapor mixture can be calculated as follows (Mastin and Ghiorso, 2000):
where mg and mM are the mass fractions of gas and melt, respectively, and hg and hM are the specific enthalpies of gas and melt. The specific enthalpy of water vapor is a function of pressure and temperature and can be calculated using the method of Haar et al. (1984). Similarly, the specific enthalpy of the melt is a function of temperature, pressure and composition, and can be calculated using the method of Ghiorso and Sack (1995). As the model magma ascends through the conduit, its enthalpy at each pressure is calculated using equation (2). The temperature of the magma is then adjusted until the enthalpy of the melt-vapor mixture calculated by equation (3) is in agreement with the enthalpy prescribed by equation (2) (Mastin and Ghiorso, 2000). We note that the assumption made by the Conflow model of isentropic ascent produces maximal cooling because the model neglects to account for heat-producing processes such as crystallization and also prevents the loss of vapor from the system (Mastin and Ghiorso, 2001). As such, ascent-driven temperature decreases predicted by Conflow calculations should be considered upper bounds.
Figure 8 shows a comparison between temperature-time paths calculated by Conflow and best-fit temperature-time paths determined by fitting MgO concentration gradients in olivine-hosted melt inclusions. For each eruption, we plot an overall best-fit thermal history determined by averaging the best-fit parameters for all of the individually fit melt inclusions.
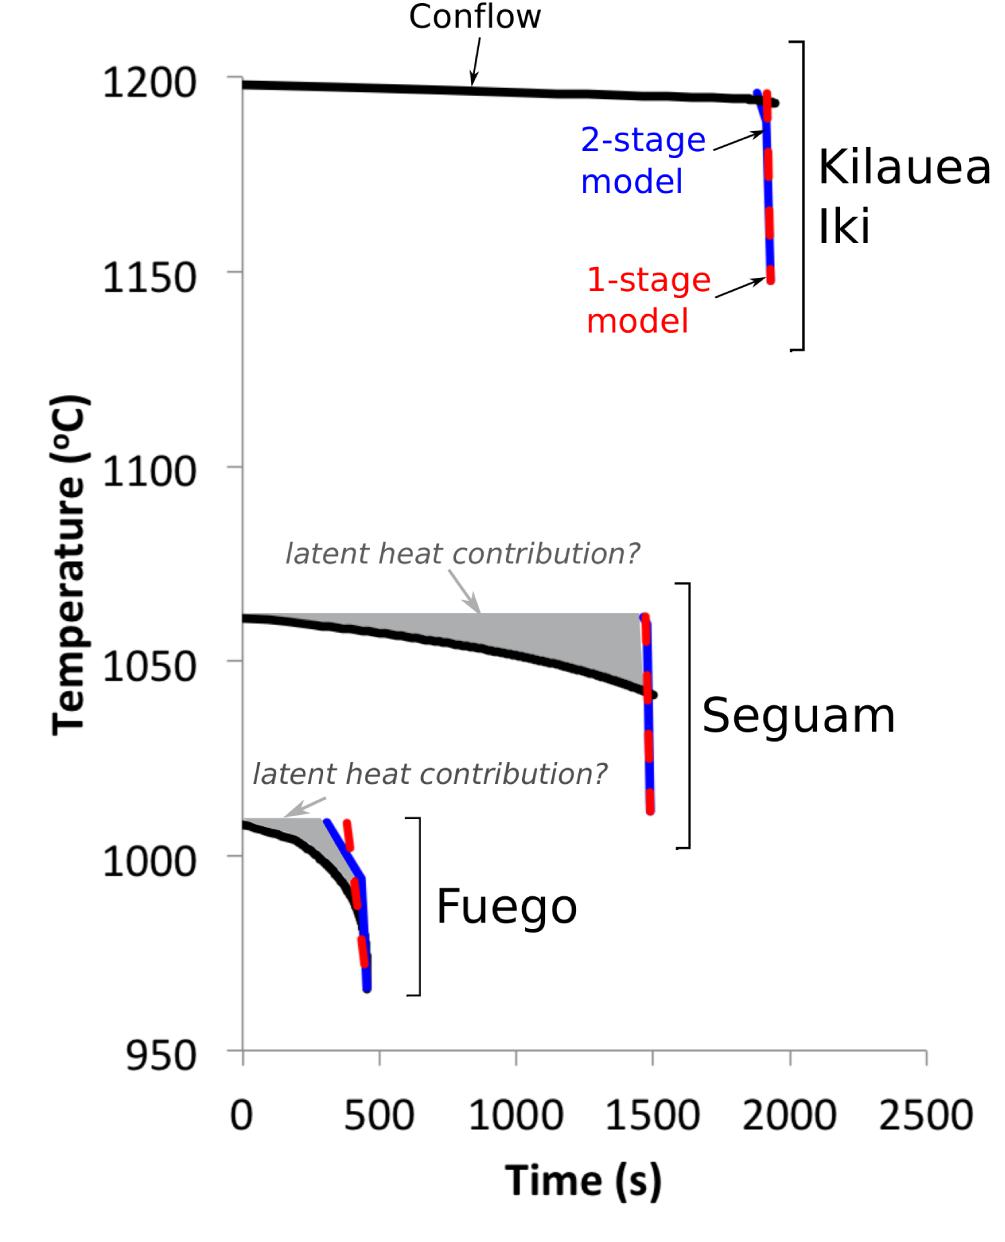
Figure 8. Thermal histories of syneruptive magmas from Fuego, Seguam, and Kilauea Iki, as determined by fitting melt inclusion MgO concentration gradients to one-stage (red dashed lines) and two-stage (blue lines) cooling models, and as calculated by the ‘Conflow’ model (Mastin and Ghiorso, 2000; Campagnola et al., 2016) (black curves). At Kilauea Iki, the Conflow model suggests that the magma cooled very little during ascent through the conduit. We interpret the ∼10 s of cooling recorded by the inclusions to represent quenching in the fire-fountain. At Seguam and Fuego, we do not find good agreement between our inclusion-derived thermal histories and the Conflow calculation: Conflow predicts 20–40°C of magma cooling during ascent, while the MgO concentrations in the centers of our Seguam and Fuego inclusions are approximately in equilibrium with their olivine hosts, which suggests that they did not experience net cooling during ascent. One- and two-stage cooling model parameters are averages of parameters obtained by fitting individual melt inclusions from a given eruption (see Supplementary Data Tables). Values of input parameters for the Conflow model curves (e.g., initial ascent velocity, initial pressure and magma composition) are provided in the Supplementary Data Tables. Initial ascent velocities for Seguam and Kilauea Iki are based on ascent histories derived from volatile concentration gradients along melt embayments; the choice of initial velocity and initial pressure determines the duration of the calculated ascent history for each of these eruptions. For the subplinian Fuego eruption, we assume that the magma reaches sonic velocity at the surface (i.e., the theoretical maximum velocity). Application of this assumption for the Conflow calculation results in magma ascent velocities that are comparable to those obtained by fitting volatile concentration gradients in melt embayments (Lloyd et al., 2014).
At Kilauea Iki, Conflow predicts that the magma undergoes very little cooling on ascent (Figure 8). This is consistent with our thermal history modeling based on MgO zonation in the olivine-hosted melt inclusions from this eruption: Several of the inclusions exhibit plateaus of MgO concentration across their centers that are consistent with approximately isothermal magma ascent. The lack of adiabatic cooling experienced by Kilauea Iki magma is likely a result of the low initial water concentration of the magma. The relatively dry Kilauea Iki magma exsolves water vapor very late in its ascent history (Figure 9A), so the magma follows a liquid-only adiabat for most of its ascent. Significant cooling begins just a few hundred meters from the surface when water vapor rapidly exsolves, driving fragmentation, greater adiabatic expansion and cooling. Short durations (∼101 s) of cooling implied by MgO decreases in the outer ∼101 μm of the melt inclusions are consistent with expected durations of sub-aerial quenching in a fire fountain (Porritt et al., 2012). We note that the lack of evidence of cooling during ascent of the Kilauea Iki magma is consistent with the rise-speed-dependent model for fire-fountain eruptions in which vapor bubbles are retained in the magma in which they formed (Parfitt and Wilson, 1995). On the other hand, our Kilauea Iki results may be in conflict with the collapsing foam model (Jaupart and Vergniolle, 1989) in which fire-fountain eruptions are driven by the ascent of a CO2-rich foam through the conduit. In this case we would expect much longer durations of cooling in the conduit, driven by adiabatic expansion of the vapor-rich foam. It is possible that the collapsing foam model could apply to the Keanakāko’i basal reticulite and the Keanakāko’i layer 6 deposit, both of which exhibit longer cooling durations (∼44–67 s) than those observed at Kilauea Iki; however, as noted in section “Samples From Kilauea Volcano (Hawaii),” the formation of reticulite is estimated to occur in <20 s (Mangan and Cashman, 1996), so textural constraints suggest that expansion of a foam layer in the conduit may not be a viable explanation for the relatively long thermal histories observed for the Keanakāko’i basal reticulite. An alternative explanation for the longer cooling durations observed for the Keanakāko’i basal reticulite is the effect of clast size (see section “Influence of Clast Size on Post-Eruptive Thermal Histories”). We do not have constraints on the size of the specific clasts from which our reticulite melt inclusions were derived, but we note that clasts of up to ∼20 cm have been observed in the Keanakāko’i basal reticulite (May et al., 2015). Clast sizes of just a few cm could explain the slower cooling rates experienced by our reticulite-derived melt inclusions.
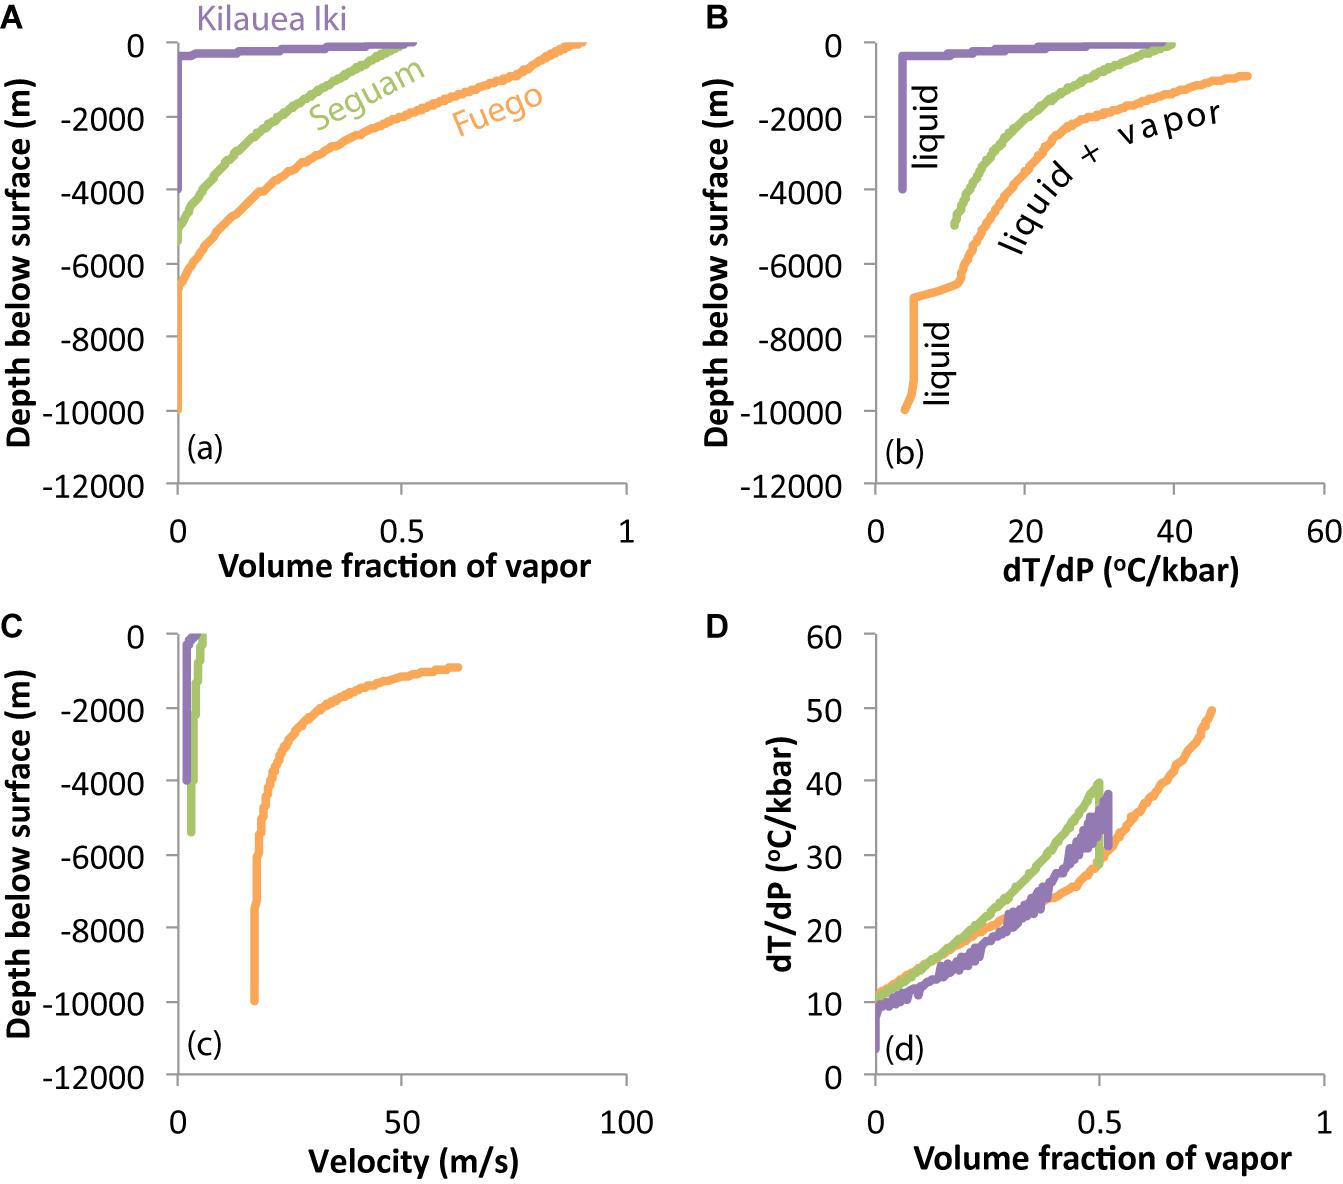
Figure 9. Results of Conflow modeling of the Fuego, Seguam, and Kilauea Iki eruptions. (A) Relationships between volume fraction of exsolved vapor and depth in the conduit. Fuego and Seguam magmas each begin their ascent histories with ∼4 wt% water, so these magmas exsolve a vapor phase at greater depths than the relatively dry (∼0.75 wt%) magma erupted at Kilauea Iki. (B) Variations in the slope of the adiabat (dT/dP) with depth. Prior to exsolution of a vapor phase, dT/dP of silicate liquid is relatively low (≤5°C/kbar). Following the exsolution of vapor dT/dP rapidly increases in response to adiabatic expansion and cooling of the vapor (which has a much higher thermal expansivity than the silicate liquid). (C) Variations in magma ascent velocity with depth. (D) Relationship between dT/dP and volume fraction of vapor in the magma. Despite significant differences among our studied eruptions for all other parameters explored in this figure, the relationships between dT/dP and vapor volume fraction are approximately identical, illustrating that vapor volume fraction is the dominant control on dT/dP during adiabatic magma ascent.
At Seguam and Fuego, we do not find good agreement between the Conflow model and our thermal histories determined from modeling of MgO gradients in olivine-hosted melt inclusions. Conflow predicts cooling of ∼20°C during ascent of the Seguam magma over a time period of ∼40 min (Figure 8), while plateaus of MgO concentration across the centers of the largest Seguam melt inclusions are suggestive of approximately isothermal magma ascent. As described in section “Characteristics of Chemical Zonation in the Melt Inclusions,” some inclusions exhibit hints of concave-up MgO profiles across their centers that could be indicative of a small amount of magma heating during ascent, but the Conflow model predicts monotonic cooling. As observed at Kilauea, MgO decreases in the outer ∼101 μm of Seguam melt inclusions are consistent with expected durations (∼101 s) of sub-aerial quenching in a fire-fountain plume and thus do not appear to require any cooling in during ascent in the conduit.
Our best-fit thermal histories for Fuego melt inclusions provide an excellent match to the overall amount of cooling predicted by Conflow, but we find shorter durations of cooling than the Conflow model [Conflow predicts cooling of ∼40°C over ∼8 min during ascent of the Fuego magma, while our thermal history modeling of Fuego ash-derived melt inclusions suggests cooling of ∼40°C over 0.4–2.2 min]. Our Fuego melt inclusion MgO zonation profiles do not enable us to constrain the ascending magma’s thermal history prior to the final couple of minutes of syneruptive ascent and quenching; however, the fact that the centers of our largest Fuego inclusions are approximately in equilibrium with their olivine hosts (Figures 2, 3) suggests minimal net change in temperature from entrapment until the final couple of minutes of ascent and eruption.
The mismatch between the Conflow model and our best-fit thermal histories at Fuego and Seguam suggest that the assumption of isentropic ascent made by the Conflow model may be inappropriate for these eruptions. Unlike the relatively dry Kilauea magma, Fuego and Seguam magmas contain ∼4 wt% water. Degassing of this water begins at ∼300 MPa (Newcombe et al., 2020) and likely triggers crystallization (Blundy and Cashman, 2005). We note that clinopyroxenes from the Seguam eruption display textures and melt inclusions compositions consistent with rapid growth conditions during magma ascent (Lloyd et al., 2016b). Latent heat produced by crystallization on ascent would act to counter (to some extent) the cooling effect of vapor expansion. Conflow does not account for latent heat production, so it is therefore unsurprising that the Conflow model overestimates the extent (at Seguam) and duration (at Seguam and Fuego) of cooling experienced by wet magmas undergoing degassing-driven crystallization.
Another potential issue with the application of the Conflow model to hydrous arc magmas is the likelihood of vapor loss from the magma during ascent (i.e., open-system degassing), which would violate the closed system assumption of the isentropic model. Slow ascent of hot, basaltic magma may allow migration and escape of vapor bubbles, thereby reducing the adiabatic cooling experienced by the magma (which is dominated by the expansion of the vapor phase). This process could potentially produce a systematic relationship between magma temperature change and syneruptive ascent rate, in which fast-ascending magmas (in which vapor bubbles are more efficiently retained) experience more net cooling than slow-ascending magmas (in which vapor bubbles may migrate and escape). This idea is explored further in section “Systematics of Magma Temperature Changes During Ascent.”
As discussed in section “Characteristics of Chemical Zonation in the Melt Inclusions,” several Kilauea Iki and Seguam melt inclusions exhibit plateaus of approximately constant MgO across their centers. The simplest interpretation of these MgO plateaus is that the Kilauea and Seguam magmas ascended the conduit approximately isothermally prior to quenching on eruption. However, it seems likely that the Seguam magma, which underwent significant crystallization and degassing of ∼4 wt% water during ascent, may have experienced periods of both cooling and heating in the conduit. This assertion is supported by the results of conduit modeling by La Spina et al. (2015) that accounts for latent heat production. La Spina et al. (2015) find evidence for ∼20°C of cooling followed by ∼20°C of heating during magma ascent just prior to the 2007 effusive eruption of Stromboli, Italy (e.g., their Figure 1). We have conducted some simple forward models to test whether the MgO plateaus observed in our Seguam melt inclusions are consistent with the kinds of temperature variations predicted by the La Spina et al. (2015) model (Figure 10). We impose thermal histories with durations of ∼100 min (chosen to match the average duration of magma ascent determined via modeling of volatile diffusion in melt embayments; Newcombe et al., 2020) in which the temperature varies by up to ± 20°C prior to quenching on eruption. Models in which the net temperature change during magma ascent is 0°C (prior to quenching) provide a reasonably good match to the MgO profile measured in Seg5-MI1 (Figures 10A,B). However, models in which the net temperature change during magma ascent is 10°C (prior to quenching) are unable to match the MgO profile (Figures 10C,D). We conclude from this exercise that it is possible to erase the effects of temperature variations of tens of °C on MgO zonation in our Seguam melt inclusions. This behavior is more likely to occur in wet magmas in which DMgO is enhanced (see section “Effect of Water Addition and Major Element Composition on the Diffusivity of MgO in Basaltic Melt”) and in magmas that ascend slowly enough to provide time for MgO variations to diffusively homogenize. However, the fact that the central MgO concentrations of our Seguam melt inclusions are approximately in equilibrium with their olivine hosts requires minimal net temperature change during magma ascent (we estimate a maximum net temperature change of ∼4°C can be tolerated by our Seg5-MI1 data). We note that the thermal histories imposed in Figure 10 are highly non-unique. The incorporation into our model of chemical zonation of oxides other than MgO could narrow the range of viable thermal histories (Saper and Stolper, 2020); e.g., we note that concave-up profiles of CaO across our Seguam inclusions likely rule out thermal histories with prolonged cooling prior to quenching (such as the thermal history plotted in red in Figure 10A). Future efforts are needed to constrain the families of possible thermal histories that satisfy major element zonation data in olivine-hosted melt inclusions, perhaps by coupling with models of magma ascent based on thermodynamic and fluid dynamic principles; however, such efforts are beyond the scope of this work.
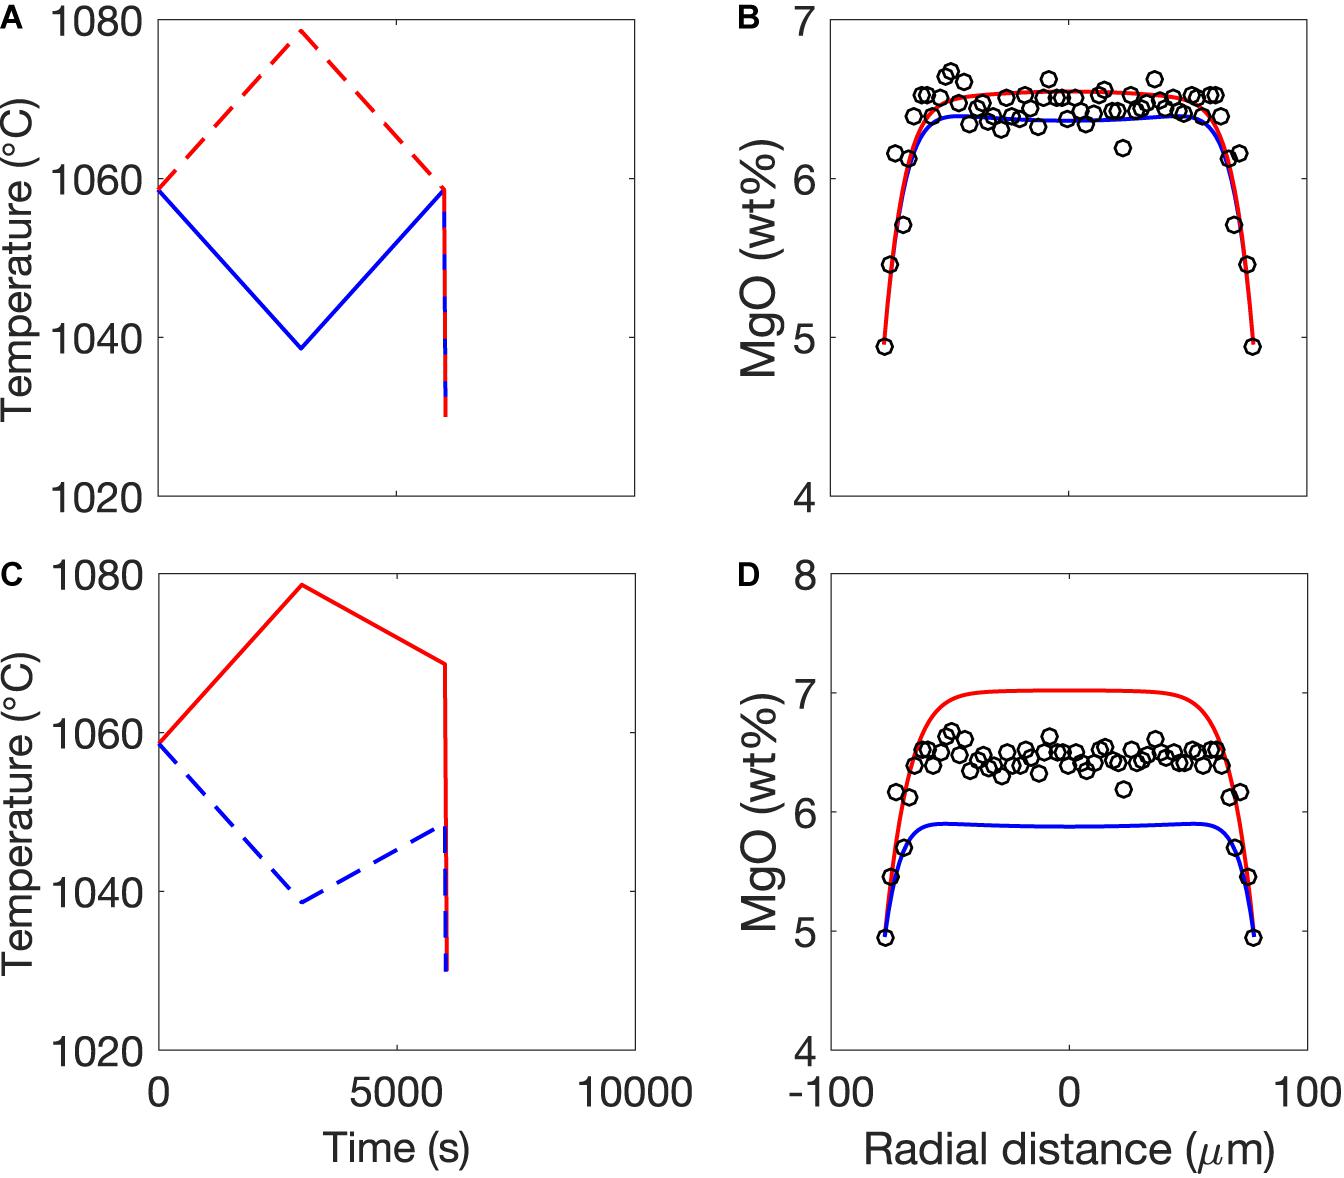
Figure 10. Forward modeling to calculate the effects of temperature variations of ± 20°C on the generation of MgO zonation in inclusion Seg5-MI1. (A) Two separate thermal histories are imposed: one in which the temperature increases and decreases by 20°C over a period of 100 min before quenching at 0.9°C/s (red dashed lines); and one in which the temperature first decreases and then increases by 20°C over a period of 100 min before quenching at 0.9°C/s (blue lines). (B) Modeled MgO zonation in melt inclusion Seg5-MI1 in response to the thermal histories imposed in (A). Both models (red and blue curves) provide a reasonably good match to the data (black circles). In these examples, the imposed temperature variations occur over a long enough duration that MgO variations are able to approximately homogenize by diffusion, thereby erasing the evidence of the prior thermal histories. (C) Imposed thermal histories used to generate the model curves in (D). Note that in these examples, there is a net temperature change of ±10°C between the initial temperature and the temperature reached just prior to quenching. (D) Modeled MgO zonation in melt inclusion Seg5-MI1 in response to the thermal histories imposed in (C). Thermal histories in which we impose a net 10°C increase (red curve) or net 10°C decrease (blue curve) in temperature prior to quenching are unable to match our Seg5-MI1 data. This demonstrates the sensitivity of MgO zonation in Seguam melt inclusions to net temperature changes during magma ascent.
We have used MgO concentration gradients in olivine-hosted melt inclusions to constrain syneruptive temperature changes of magmas during five basaltic eruptions. The syneruptive magmas involved in these eruptions had variable decompression rates (Fuego > Keanakāko’i layer 6 > Keanakāko’i reticulite > Seguam > Kilauea Iki) and contained different initial water concentrations (Fuego > = Seguam > > Kilauea). What are the underlying processes and controls driving temperature changes during these eruptions?
Thermodynamic models of adiabatic magma ascent (Mastin and Ghiorso, 2000; Mastin and Ghiorso, 2001) support the idea that the dominant control on adiabatic cooling is the volume fraction of vapor in the magma: Kilauea Iki, Seguam, and Fuego magmas experienced very different ascent histories (e.g., Figures 9A–C), but relationships between the slope of the adiabat (dT/dP) and the volume fraction of vapor calculated by Conflow are almost identical for all three magmas (Figure 9D).
The clear importance of vapor volume fraction as a driver of syneruptive magma cooling suggests that we may be able to explain the systematics of magma temperature changes in terms of a magma’s ability to produce and retain vapor bubbles during ascent. As described in the previous section, magmas erupted at Fuego and Seguam both initially contained ∼4 wt% water such that the volume fraction of vapor exsolved by each magma must have been approximately equal; however, rapid magma ascent at Fuego (Lloyd et al., 2014) allowed this magma to retain its vapor, while slower ascent at Seguam (Newcombe et al., 2020) likely led to melt-vapor segregation and crystallization on ascent. The lower initial volatile content of the Kilauea Iki magma resulted in delayed (i.e., shallower) vapor exsolution from this magma compared to the magmas erupted at Fuego and Seguam, thereby explaining the lack of cooling in the conduit inferred from MgO gradients in the melt inclusions from Kilauea.
Several studies have been conducted of pre- and syn-eruptive temperature changes during andesitic dome-building eruptions. Blundy et al. (2006) used plagioclase-melt thermometry to infer temperature increases of ∼100°C of andesitic magmas leading up to dome-building eruptions of Shiveluch and Mount Saint Helens volcanoes. Blundy et al. (2006) proposed that this temperature increase was a result of latent heat production during degassing-driven crystallization. Additionally, several studies of dome-building eruptions at Soufriere Hills (Devine et al., 1998; Rutherford and Devine, 2003) have found evidence for heating events just prior to and/or during magma ascent and eruption (much of this heating was attributed to recharge of hot basaltic magma, but some of the heating could conceivably be a result of syneruptive degassing-driven crystallization). Placing these results in the context of our findings at Fuego, Seguam, and Kilauea, we hypothesize that there may be a direct relationship between magma ascent rate and temperature change during magma ascent, with the slowest ascending magmas experiencing net temperature increases during ascent due to crystallization and vapor loss, and the fastest ascending magmas experiencing net temperature decreases during ascent due to retention and adiabatic expansion of exsolved vapor (Figure 11).
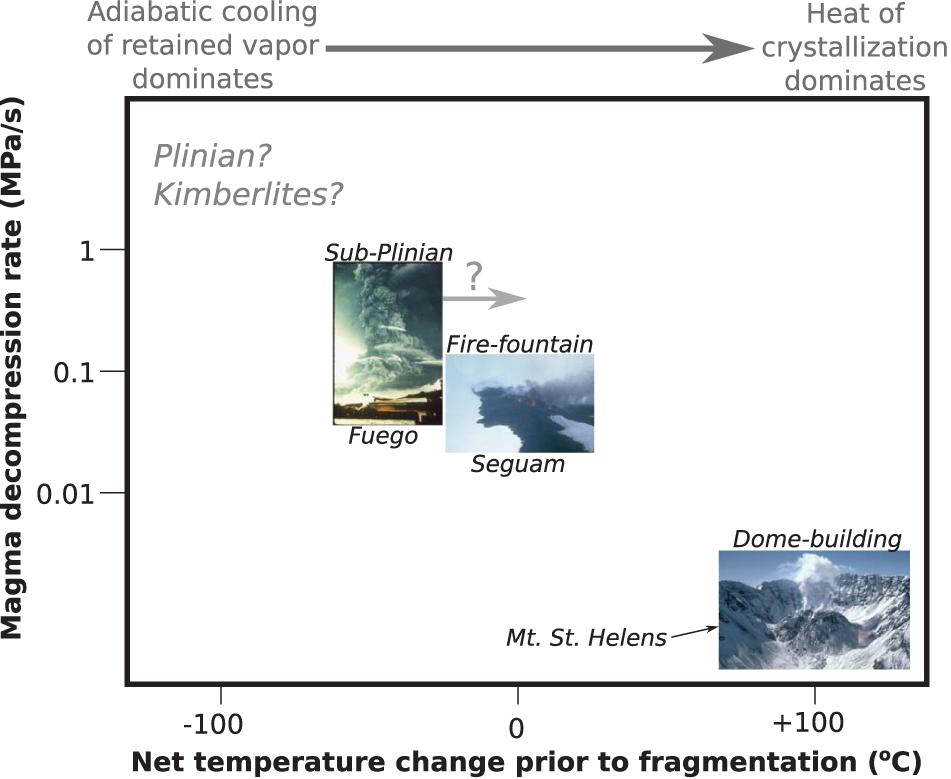
Figure 11. Hypothesized trend between magma decompression rate and temperature change during ascent. We find evidence that the Seguam 1977 magma experienced a net temperature change of ∼0°C during syneruptive ascent and the Fuego 1974 magma experienced a net temperature change between ∼–40°C (if our best-fit thermal histories reflect cooling in the conduit) and ∼0°C (if our best-fit thermal histories reflect cooling in the volcanic plume). Blundy et al. (2006) report a temperature increase of ∼100°C accompanying slow extrusion of magma during dome-building eruptions at Mount Saint Helens and Shiveluch volcanoes. Together, these results are suggestive of a negative correlation between decompression rate and temperature change during ascent, which likely relates to higher degrees of melt-vapor segregation and more crystallization in slower ascending magmas. Studies of ascent and syneruptive temperature changes at volcanoes with a wider variety of eruptive styles (e.g., Plinian eruptions) and magma compositions will be required to test the validity of this hypothesized trend. Photo credit: USGS.
The application of olivine-hosted melt inclusion thermometry to the study of syneruptive temperature changes during explosive basaltic eruptions suggests that thermal histories of hydrous arc magmas are not well-reproduced by isentropic models of magma ascent, likely due to the occurrence of open-system degassing and/or degassing-driven crystallization, so we caution against the use of isentropic conduit models for arc magmas. Future work (e.g., application of this technique to kimberlitic magmas and effusively erupted magmas) will further elucidate the systematics of pressure-temperature-time conditions experienced by syneruptive basaltic magmas. Similar techniques could be applied to silicic systems (e.g., Blundy et al., 2006; Myers et al., 2018), where higher melt viscosities may produce different behaviors on magma ascent (e.g., higher shear heating and increased vapor retention).
• We have used MgO concentration gradients in olivine-hosted melt inclusions to estimate syneruptive T-t paths of mafic magmas erupted at Fuego, Seguam, and Kilauea volcanoes. By combining our syneruptive T-t constraints with previously determined decompression histories for these magmas, we are able to place constraints on the P-T-t paths of basaltic magmas during ascent and eruption.
• Melt inclusions from the 1959 Kilauea Iki fire fountain eruption record the highest syneruptive cooling rates (3–11°C/s) and the shortest cooling durations (4–19 s), while inclusions from the 1974 subplinian eruption of Fuego volcano record the lowest cooling rates (0.1–1.7°C/s) and longest cooling durations (21–368 s) of the studied eruptions.
• A comparison of bomb- and ash-derived melt inclusions from Fuego demonstrates the importance of clast size as a control on syneruptive cooling rates. Melt inclusions sampled from the interiors of small (∼6 cm diameter) volcanic bombs at Fuego are found to have cooled more slowly on average than inclusions sampled from ash (with particle diameters < 2 mm) during the same eruption, as expected based on conductive cooling models. The effects of clast size may also explain the relatively long durations of cooling recorded by melt inclusions from the Keanakāko’i basal reticulite.
• Our constraints on the P-T-t paths of magmas erupted at Kilauea Iki are consistent with the predictions of conduit models that assume isentropic magma ascent and little degassing-driven crystallization.
• Our P-T-t constraints at Seguam and Fuego (both containing initial water concentrations of ∼4 wt%) reveal less cooling than predictions of isentropic magma ascent models, and may indicate the importance of open-system degassing and/or degassing-driven crystallization in the minutes to hours preceding these eruptions.
• We find evidence for a systematic relationship between magma thermal history and decompression rate, in which rapidly ascending gas-bearing magmas experience slower cooling during ascent and eruption than slowly ascending magmas. This relationship may be rationalized by thermodynamic models that show that the dominant driver of cooling in the conduit is adiabatic expansion of a vapor phase, because a corollary of these models is that, in order to drive syneruptive cooling, the magma must ascend rapidly enough to prevent significant melt-vapor separation.
Given the expected sensitivity of magma P-T-t paths to vapor volume fraction, it may be possible to use the syneruptive ascent chronometers and thermometers presented here as a means of identifying processes that are otherwise difficult to constrain, such as magma stalling, open- and closed-system degassing, vapor fluxing, and vapor accumulation during syneruptive ascent of mafic magmas.
All datasets generated for this study are included in the article/Supplementary Material. Code developed over the course of this study is freely available on Github (doi: 10.5281/zenodo.3998246).
MN and TP designed the study. BFH collected Kilauea samples. MN, ASL, DF, and EH performed geochemical analyses. MN performed the thermal history modeling with guidance from YZ. MH ran the piston cylinder experiment. YZ fit the results of the piston cylinder experiment. AB modeled syneruptive water loss from Fuego melt inclusions. MN wrote the manuscript with input from all co-authors.
This work was funded by NSF GeoPRISMS award 1551868.
The authors declare that the research was conducted in the absence of any commercial or financial relationships that could be construed as a potential conflict of interest.
We are grateful to Adrian Fiege at the American Museum of Natural History for his help with the electron microprobe analyses, and to Jianhua Wang at the Carnegie Institution for Science for his help with the SIMS and nanoSIMS analyses. Philipp Ruprecht is thanked for his support and mentorship. We thank Bill Rose and Don Swanson for sharing their samples of the Fuego and Kilauea eruptions, and we thank Lee Saper and Edward Stolper for sharing the results of their controlled cooling experiments. We greatly appreciate AK and TK for their insightful reviews, and TU for her thoughtful editorial handling.
The Supplementary Material for this article can be found online at: https://www.frontiersin.org/articles/10.3389/feart.2020.531911/full#supplementary-material
Aiuppa, A., Federico, C., Giudice, G., and Gurrieri, S. (2005). Chemical mapping of a fumarolic field: La Fossa Crater, Vulcano Island (Aeolian Islands, Italy). Geophys. Res. Lett. 32, doi: 10.1029/2005gl023207
Aiuppa, A., Moretti, R., Federico, C., Giudice, G., Gurrieri, S., Liuzzo, M., et al. (2007). Forecasting Etna eruptions by real-time observation of volcanic gas composition. Geology 35, 1115–1118. doi: 10.1130/g24149a.1
Ayris, P. M., Delmelle, P., Cimarelli, C., Maters, E. C., Suzuki, Y. J., and Dingwell, D. B. (2014). HCl uptake by volcanic ash in the high temperature eruption plume: mechanistic insights. Geochim. Cosmochim. Acta 144, 188–201. doi: 10.1016/j.gca.2014.08.028
Bamber, E. C., Arzilli, F., Polacci, M., Hartley, M. E., Fellowes, J., Di Genova, D., et al. (2020). Pre- and syn-eruptive conditions of a basaltic Plinian eruption at Masaya Volcano, Nicaragua: the Masaya Triple Layer (2.1 ka). J. Volcanol. Geotherm. Res. 392, 106761. doi: 10.1016/j.jvolgeores.2019.106761
Barth, A., Newcombe, M. E., Plank, T., Gonnermann, H., Hajimirza, S., Soto, G. J., et al. (2019). Magma decompression rate correlates with explosivity at basaltic volcanoes – constraints from water diffusion in olivine. J. Volcanol. Geotherm. Res. 387, 106664. doi: 10.1016/j.jvolgeores.2019.106664
Beattie, P. (1993). Olivine-melt and orthopyroxene-melt equilibria. Contrib. Mineral. Petrol. 115, 103–111. doi: 10.1007/bf00712982
Birnie, D. P., and Dyar, M. D. (1986). Cooling rate calculations for silicate glasses. J. Geophys. Res. Solid Earth 91, 509–513. doi: 10.1029/JB091iB04p0D509
Blundy, J., and Cashman, K. (2005). Rapid decompression-driven crystallization recorded by melt inclusions from Mount St. Helens volcano. Geology 33, 793–796. doi: 10.1130/g21668.1
Blundy, J., Cashman, K., and Humphreys, M. (2006). Magma heating by decompression-driven crystallization beneath andesite volcanoes. Nature 443, 76–80. doi: 10.1038/nature05100
Bucholz, C. E., Gaetani, G. A., Behn, M. D., and Shimizu, N. (2013). Post-entrapment modification of volatiles and oxygen fugacity in olivine-hosted melt inclusions. Earth Planet. Sci. Lett. 374, 145–155. doi: 10.1016/j.epsl.2013.05.033
Campagnola, S., Romano, C., Mastin, L., and Vona, A. (2016). Confort 15 model of conduit dynamics: applications to Pantelleria Green Tuff and Etna 122 BC eruptions. Contrib. Mineral. Petrol. 171:60.
Cassidy, M., Manga, M., Cashman, K., and Bachmann, O. (2018). Controls on explosive-effusive volcanic eruption styles. Nat. Commun. 9:2839.
Chen, Y., and Zhang, Y. (2008). Olivine dissolution in basaltic melt. Geochim. Cosmochim. Acta 72, 4756–4777. doi: 10.1016/j.gca.2008.07.014
Costa, A., Melnik, O., and Vedeneeva, E. (2007). Thermal effects during magma ascent in conduits. J. Geophys. Res. Solid Earth 112, doi: 10.1029/2007jb004985
Danyushevsky, L. V., Della-Pasqua, F. N., and Sokolov, S. (2000). Re-equilibration of melt inclusions trapped by magnesian olivine phenocrysts from subduction-related magmas: petrological implications. Contrib. Mineral. Petrol. 138, 68–83. doi: 10.1007/pl00007664
Danyushevsky, L. V., Sokolov, S., and Falloon, T. J. (2002). Melt inclusions in olivine phenocrysts: using diffusive re-equilibration to determine the cooling history of a crystal, with implications for the origin of olivine-phyric volcanic rocks. J. Petrol. 43, 1651–1671. doi: 10.1093/petrology/43.9.1651
de Moor, J. M., Aiuppa, A., Pacheco, J., Avard, G., Kern, C., Liuzzo, M., et al. (2016). Short-period volcanic gas precursors to phreatic eruptions: insights from Poás Volcano, Costa Rica. Earth Planet. Sci. Lett. 442, 218–227. doi: 10.1016/j.epsl.2016.02.056
Devine, J. D., Murphy, M. D., Rutherford, M. J., Barclay, J., Sparks, R. S. J., Carroll, M. R., et al. (1998). Petrologic evidence for pre-eruptive pressure-temperature conditions, and recent reheating, of andesitic magma erupting at the Soufriere Hills Volcano, Montserrat, W.I. Geophys. Res. Lett. 25, 3669–3672. doi: 10.1029/98GL01330
Eaton, J. P., Richter, D. H., and Krivoy, H. L. (1987). Cycling of magma between the summit reservoir and Kilauea Iki lava lake during the 1959 eruption of Kilauea volcano. US Geol. Surv. Prof. Pap. 1350, 1307–1335.
Ferguson, D. J., Gonnermann, H. M., Ruprecht, P., Plank, T., Hauri, E. H., Houghton, B. F., et al. (2016). Magma decompression rates during explosive eruptions of Kîlauea volcano, Hawaii, recorded by melt embayments. Bull. Volcanol. 78:71.
Ford, C., Russell, D., Craven, J., and Fisk, M. (1983). Olivine-liquid equilibria: temperature, pressure and composition dependence of the crystal/liquid cation partition coefficients for Mg, Fe2+, Ca and Mn. J. Petrol. 24, 256–266. doi: 10.1093/petrology/24.3.256
Fujii, N., and Uyeda, S. (1974). Thermal instabilities during flow of magma in volcanic conduits. J. Geophys. Res. 79, 3367–3369. doi: 10.1029/JB079i023p03367
Gaetani, G. A., O’Leary, J. A., Shimizu, N., Bucholz, C. E., and Newville, M. (2012). Rapid reequilibration of H2O and oxygen fugacity in olivine-hosted melt inclusions. Geology 40, 915–918. doi: 10.1130/g32992.1
Garcia, M. O., Mucek, A. E., Lynn, K. J., Swanson, D. A., and Norman, M. D. (2018). Geochemical evolution of Keanakāko’i Tephra, Kîlauea Volcano, Hawai ‘i. Field Volcanol. 538:203.
Ghiorso, M. S., and Sack, R. O. (1995). Chemical mass transfer in magmatic processes IV. A revised and internally consistent thermodynamic model for the interpolation and extrapolation of liquid-solid equilibria in magmatic systems at elevated temperatures and pressures. Contrib. Mineral. Petrol. 119, 197–212. doi: 10.1007/s004100050036
Glazner, A. F. (2019). The ascent of water-rich magma and decompression heating: a thermodynamic analysis. Am. Mineral. 104, 890–896. doi: 10.2138/am-2019-6925
Gottsmann, J., and Dingwell, D. (2002). The thermal history of a spatter-fed lava flow: the 8-ka pantellerite flow of Mayor Island, New Zealand. Bull. Volcanol. 64, 410–422. doi: 10.1007/s00445-002-0220-7
Guo, C., and Zhang, Y. (2016). Multicomponent diffusion in silicate melts: SiO2–TiO2–Al2O3–MgO–CaO–Na2O–K2O System. Geochim. Cosmochim. Acta 195, 126–141. doi: 10.1016/j.gca.2016.09.003
Guo, C., and Zhang, Y. (2018). Multicomponent diffusion in basaltic melts at 1350° C. Geochim. Cosmochim. Acta 228, 190–204. doi: 10.1016/j.gca.2018.02.043
Guo, C., and Zhang, Y. (2020). Multicomponent diffusion in a basaltic melt: temperature dependence. Chem. Geol. 549, 119700. doi: 10.1016/j.chemgeo.2020.119700
Haar, L., Gallagher, J. S., and Kell, G. S. (1984). NBS/NRC Steam Tables: Thermodynamic and Transport Properties and Computer Programs for Vapor and Liquid States of Water in SI Units. Washington, DC: Hemisphere Publishing Corporation, 320.
Hartley, M. E., Maclennan, J., Edmonds, M., and Thordarson, T. (2014). Reconstructing the deep CO2 degassing behaviour of large basaltic fissure eruptions. Earth Planet. Sci. Lett. 393, 120–131. doi: 10.1016/j.epsl.2014.02.031
Hauri, E., Wang, J., Dixon, J. E., King, P. L., Mandeville, C., and Newman, S. (2002). SIMS analysis of volatiles in silicate glasses: 1. Calibration, matrix effects and comparisons with FTIR. Chem. Geol. 183, 99–114. doi: 10.1016/S0009-2541(01)00375-8
Hauri, E. H., Weinreich, T., Saal, A. E., Rutherford, M. C., and Van Orman, J. A. (2011). High pre-eruptive water contents preserved in lunar melt inclusions. Science 333, 213–215. doi: 10.1126/science.1204626
Helz, R. T., Cottrell, E., Brounce, M. N., and Kelley, K. A. (2017). Olivine-melt relationships and syneruptive redox variations in the 1959 eruption of Kîlauea Volcano as revealed by XANES. J. Volcanol. Geotherm. Res. 33, 1–14. doi: 10.1016/j.jvolgeores.2016.12.006
Hort, M., and Gardner, J. (2000). Constraints on cooling and degassing of pumice during Plinian volcanic eruptions based on model calculations. J. Geophys. Res. Solid Earth 105, 25981–26001. doi: 10.1029/2000jb900186
Humphreys, M. C., Edmonds, M., and Klöcking, M. S. (2016). The validity of plagioclase-melt geothermometry for degassing-driven magma crystallization. Mineral. Soc. Am. 101, 769–779. doi: 10.2138/am-2016-5314
Jaupart, C., and Vergniolle, S. (1989). The generation and collapse of a foam layer at the roof of a basaltic magma chamber. J. Fluid Mech. 203, 347–380. doi: 10.1017/s0022112089001497
Kavanagh, J. L., and Sparks, R. S. J. (2009). Temperature changes in ascending kimberlite magma. Earth Planet. Sci. Lett. 286, 404–413. doi: 10.1016/j.epsl.2009.07.011
Kilinc, A. (2018). “Temperature variations in isentropic (Adiabatic) uprise of Magma,” in Proceedings of the AGU Fall Meeting Abstracts, Washington, DC.
Koyaguchi, T. (2005). An analytical study for 1-dimensional steady flow in volcanic conduits. J. Volcanol. Geotherm. Res. 143, 29–52. doi: 10.1016/j.jvolgeores.2004.09.009
Kress, V. C., and Ghiorso, M. S. (1995). Multicomponent diffusion in basaltic melts. Geochim. Cosmochim. Acta 59, 313–324. doi: 10.1016/0016-7037(94)00286-u
La Spina, G., Burton, M., de’ Michieli, and Vitturi, M. (2015). Temperature evolution during magma ascent in basaltic effusive eruptions: a numerical application to Stromboli volcano. Earth Planet. Sci. Lett. 426, 89–100. doi: 10.1016/j.epsl.2015.06.015
La Spina, G., Burton, M., Vitturi, MdM, and Arzilli, F. (2016). Role of syn-eruptive plagioclase disequilibrium crystallization in basaltic magma ascent dynamics. Nature communications 7, 13402.
Le Voyer, M., Asimow, P. D., Mosenfelder, J. L., Guan, Y., Wallace, P. J., Schiano, P., et al. (2014). Zonation of H2O and F concentrations around melt inclusions in olivines. J. Petrol. 55, 685–707. doi: 10.1093/petrology/egu003
Liang, Y. (2010). Multicomponent diffusion in molten silicates: theory, experiments, and geological applications. Rev. Mineral. Geochem. 72, 409–446. doi: 10.1515/9781501508394-010
Lloyd, A., Plank, T., Ruprecht, P., Hauri, E., and Rose, W. (2013). Volatile loss from melt inclusions in pyroclasts of differing sizes. Contrib. Mineral. Petrol. 165, 129–153. doi: 10.1007/s00410-012-0800-2
Lloyd, A. S., Ferriss, E., Ruprecht, P., Hauri, E. H., Jicha, B. R., and Plank, T. (2016a). An assessment of clinopyroxene as a recorder of magmatic water and magma ascent rate. J. Petrol. 57, 1865–1886. doi: 10.1093/petrology/egw058
Lloyd, A. S., Newcombe, M. E., and Plank, T. (2016b). “Constraining magma ascent and degassing paths with olivine- and clinopyroxene-hosted melt inclusions: evidence for multiple depths of crystallization and boundary-layer entrapment,” in Proceedings of the AGU Fall Meeting on 2016, San Francisco, CA.
Lloyd, A. S., Ruprecht, P., Hauri, E. H., Rose, W., Gonnermann, H. M., and Plank, T. (2014). NanoSIMS results from olivine-hosted melt embayments: Magma ascent rate during explosive basaltic eruptions. J. Volcanol. Geotherm. Res. 283, 1–18. doi: 10.1016/j.jvolgeores.2014.06.002
London, D. (2005). Effect of current density on the electron microprobe analysis of alkali aluminosilicate glasses. Am. Mineral. 90, 1131–1138. doi: 10.2138/am.2005.1769
Lynn, K. J., Garcia, M. O., Shea, T., Costa, F., and Swanson, D. A. (2017). Timescales of mixing and storage for Keanakāko’i Tephra magmas (1500–1820 C.E.), Kîlauea Volcano, Hawai‘i. Contrib. Mineral. Petrol. 172, 76. doi: 10.1007/s00410-017-1395-4
Maclennan, J. (2017). Bubble formation and decrepitation control the CO2 content of olivine-hosted melt inclusions. Geochem. Geophys. Geosyst. 18, 597–616. doi: 10.1002/2016gc006633
Mangan, M. T., and Cashman, K. V. (1996). The structure of basaltic scoria and reticulite and inferences for vesiculation, foam formation, and fragmentation in lava fountains. J. Volcanol. Geotherm. Res. 73, 1–18. doi: 10.1016/0377-0273(96)00018-2
Massare, D., Métrich, N., and Clocchiatti, R. (2002). High-temperature experiments on silicate melt inclusions in olivine at 1 atm: inference on temperatures of homogenization and H2O concentrations. Chem. Geol. 183, 87–98. doi: 10.1016/s0009-2541(01)00373-4
Mastin, L. G. (2005). The controlling effect of viscous dissipation on magma flow in silicic conduits. J. Volcanol. Geotherm. Res. 143, 17–28. doi: 10.1016/j.jvolgeores.2004.09.008
Mastin, L. G., and Ghiorso, M. S. (2000). A Numerical Program for Steady-State Flow of Magma-Gas Mixtures Through Vertical Eruptive Conduits. Vancouver, WA: U.S. Geological Survey.
Mastin, L. G., and Ghiorso, M. S. (2001). Adiabatic temperature changes of magma–gas mixtures during ascent and eruption. Contrib. Mineral. Petrol. 141, 307–321. doi: 10.1007/s004100000210
May, M., Carey, R. J., Swanson, D. A., and Houghton, B. F. (2015). “Reticulite-producing fountains from ring fractures in Kilauea Caldera ca. 1500 CE,” in Hawaiian Volcanoes: From Source to Surface, Vol. 208, eds R. Carey, V. Cayol, M. Poland, and D. Weis (Hoboken, NJ: John Wiley and Sons).
McPhie, J., Walker, G. P. L., and Christiansen, R. L. (1990). Phreatomagmatic and phreatic fall and surge deposits from explosions at Kilauea volcano, Hawaii, 1790 a.d.: Keanakāko’i Ash Member. Bull. Volcanol. 52, 334–354. doi: 10.1007/bf00302047
Médard, E., and Grove, T. L. (2008). The effect of H2O on the olivine liquidus of basaltic melts: experiments and thermodynamic models. Contrib. Mineral. Petrol. 155, 417–432. doi: 10.1007/s00410-007-0250-4
Métrich, N., and Wallace, P. J. (2008). Volatile abundances in basaltic magmas and their degassing paths tracked by melt inclusions. Rev. Mineral. Geochem. 69, 363–402.
Mironov, N., Portnyagin, M., Botcharnikov, R., Gurenko, A., Hoernle, K., and Holtz, F. (2015). Quantification of the CO2 budget and H2O–CO2 systematics in subduction-zone magmas through the experimental hydration of melt inclusions in olivine at high H2O pressure. Earth Planet. Sci. Lett. 425, 1–11.
Moore, L. R., Gazel, E., Tuohy, R., Lloyd, A. S., Esposito, R., Steele-MacInnis, M., et al. (2015). Bubbles matter: an assessment of the contribution of vapor bubbles to melt inclusion volatile budgets. Am. Mineral. 100, 806–823. doi: 10.2138/am-2015-5036
Moussallam, Y., Oppenheimer, C., and Scaillet, B. (2019). On the relationship between oxidation state and temperature of volcanic gas emissions. Earth Planet. Sci. Lett. 520, 260–267.
Mueller, S. B., Houghton, B. F., Swanson, D. A., Poret, M., and Fagents, S. A. (2019). Total grain size distribution of an intense Hawaiian fountaining event: case study of the 1959 Kîlauea Iki eruption. Bull. Volcanol. 81:43. doi: 10.1007/s00445-019-1304-y
Myers, M. L., Wallace, P. J., Wilson, C. J., Watkins, J. M., and Liu, Y. (2018). Ascent rates of rhyolitic magma at the onset of three caldera-forming eruptions. Mineral. Soc. Am. 103, 952–965.
Newcombe, M. E., Fabbrizio, A., Zhang, Y., Ma, C., Le Voyer, M., Guan, Y., et al. (2014). Chemical zonation in olivine-hosted melt inclusions. Contrib. Mineral. Petrol. 168, 1–26. doi: 10.1007/s00410-014-1030-6
Newcombe, M. E., Plank, T., Asimow Paul, D., Barth, A., and Hauri, E. (2020). Water-in-olivine magma ascent chronometry: every crystal is a clock. J. Volcanol. Geotherm. Res. 398:106872.
Newman, S., and Lowenstern, J. B. (2002). VolatileCalc: a silicate melt–H2O–CO2 solution model written in visual basic for excel. Comput. Geosci. 28, 597–604. doi: 10.1016/S0098-3004(01)00081-4
Nichols, A. R. L., Potuzak, M., and Dingwell, D. B. (2009). Cooling rates of basaltic hyaloclastites and pillow lava glasses from the HSDP2 drill core. Geochim. Cosmochim. Acta 73, 1052–1066. doi: 10.1016/j.gca.2008.11.023
Oppenheimer, C., Scaillet, B., Woods, A., Sutton, A. J., Elias, T., and Moussallam, Y. (2018). Influence of eruptive style on volcanic gas emission chemistry and temperature. Nat. Geosci. 11, 678–681.
Parfitt, E., and Wilson, L. (1995). Explosive volcanic eruptions—IX. The transition between Hawaiian-style lava fountaining and Strombolian explosive activity. Geophys. J. Int. 121, 226–232.
Porritt, L., Russell, J., and Quane, S. (2012). Pele’s tears and spheres: examples from Kilauea Iki. Earth Planet. Sci. Lett. 333, 171–180.
Potuzak, M., Nichols, A. R. L., Dingwell, D. B., and Clague, D. A. (2008). Hyperquenched volcanic glass from Loihi Seamount. Hawaii. Earth Planet. Sci. Lett. 270, 54–62. doi: 10.1016/j.epsl.2008.03.018
Putirka, K. D. (2008). Thermometers and barometers for volcanic systems. Rev. Mineral. Geochem. 69, 61–120.
Putirka, K. D., Perfit, M., Ryerson, F., and Jackson, M. G. (2007). Ambient and excess mantle temperatures, olivine thermometry, and active vs. passive upwelling. Chem. Geol. 241, 177–206.
Rasmussen, D. J., Plank, T. A., and Roman, D. C. (2019). “Magmatic water content controls Magma storage depth,” in Proceedings of the American Geophysical Union Fall meeting 2019, San Francisco, CA.
Rasmussen, D. J., Plank, T. A., Roman, D. C., Power, J. A., Bodnar, R. J., and Hauri, E. H. (2018). When does eruption run-up begin? Multidisciplinary insight from the 1999 eruption of Shishaldin volcano. Earth Planet. Sci. Lett. 486, 1–14.
Rasmussen, D. J., Plank, T. A., Wallace, P. J., Newcombe, M. E., and Lowenstern, J. B. (2020). Vapor bubble growth in olivine-hosted melt inclusions. Am. Mineral. doi: 10.2138/am-2020-7377
Recktenwald, G. (2006). Transient, One-Dimensional Heat Conduction in a Convectively Cooled Sphere. Portland, OR: Portland State University.
Richter, D. H., Eaton, J. P., Murata, K. J., Ault, W. U., and Krivoy, H. L. (1970). Chronological Narrative of the 1959-60 Eruption of Kilauea Volcano, Hawaii. Reston, VA: United States Geological Survey.
Roeder, P., and Emslie, R. (1970). Olivine-liquid equilibrium. Contrib. Mineral. Petrol. 29, 275–289.
Rose, W. I., Anderson, A. T., Woodruff, L. G., and Bonis, S. B. (1978). The October 1974 basaltic tephra from Fuego volcano: description and history of the magma body. J. Volcanol. Geotherm. Res. 4, 3–53. doi: 10.1016/0377-0273(78)90027-6
Ruth, D. C., Costa, F., de Maisonneuve, C. B., Franco, L., Cortés, J. A., and Calder, E. S. (2018). Crystal and melt inclusion timescales reveal the evolution of magma migration before eruption. Nat. Commun. 9, 1–9.
Rutherford, M. J., and Devine, J. D. (2003). Magmatic conditions and Magma ascent as indicated by Hornblende phase equilibria and reactions in the 1995–2002 Soufrière Hills Magma. J. Petrol. 44, 1433–1453. doi: 10.1093/petrology/44.8.1433
Sahagian, D. (2005). Volcanic eruption mechanisms: insights from intercomparison of models of conduit processes. J. Volcanol. Geotherm. Res. 143, 1–15. doi: 10.1016/j.jvolgeores.2004.12.006
Sahagian, D. L., and Proussevitch, A. A. (1996). Thermal effects of magma degassing. J. Volcanol. Geotherm. Res. 74, 19–38. doi: 10.1016/S0377-0273(96)00047-9
Saper, L., and Stolper, E. (2020). Controlled cooling-rate experiments on olivine-hosted melt inclusions: chemical diffusion and quantification of eruptive cooling-rates on Hawaii and Mars. Geochem. Geophys. Geosyst. 21:e2019GC008772. doi: 10.1029/2019GC008772
Shea, T., and Hammer, J. E. (2013). Kinetics of cooling- and decompression-induced crystallization in hydrous mafic-intermediate magmas. J. Volcanol. Geotherm. Res. 260, 127–145. doi: 10.1016/j.jvolgeores.2013.04.018
Shinohara, H. (2005). A new technique to estimate volcanic gas composition: plume measurements with a portable multi-sensor system. J. Volcanol. Geotherm. Res. 143, 319–333. doi: 10.1016/j.jvolgeores.2004.12.004
Sides, I., Edmonds, M., Maclennan, J., Houghton, B., Swanson, D., and Steele-MacInnis, M. (2014). Magma mixing and high fountaining during the 1959 Kîlauea Iki eruption, Hawai ‘i. Earth Planet. Sci. Lett. 400, 102–112.
Sparks, R. (1986). The dimensions and dynamics of volcanic eruption columns. Bull. Volcanol. 48, 3–15.
Stovall, W. K., Houghton, B. F., Gonnermann, H., Fagents, S. A., and Swanson, D. A. (2011). Eruption dynamics of Hawaiian-style fountains: the case study of episode 1 of the Kîlauea Iki 1959 eruption. Bull. Volcanol. 73, 511–529. doi: 10.1007/s00445-010-0426-z
Sugawara, T. (2000). Empirical relationships between temperature, pressure, and MgO content in olivine and pyroxene saturated liquid. J. Geophys. Res. 105, 8457–8472.
Swanson, D. A., Rose, T. R., Fiske, R. S., and McGeehin, J. P. (2012). Keanakāko’i Tephra produced by 300years of explosive eruptions following collapse of Kîlauea’s caldera in about 1500CE. J. Volcanol. Geotherm. Res. 215, 8–25. doi: 10.1016/j.jvolgeores.2011.11.009
Toplis, M. J. (2005). The thermodynamics of iron and magnesium partitioning between olivine and liquid: criteria for assessing and predicting equilibrium in natural and experimental systems. Contrib. Mineral. Petrol. 149, 22–39. doi: 10.1007/s00410-004-0629-4
Tucker, J. M., Hauri, E. H., Pietruszka, A. J., Garcia, M. O., Marske, J. P., and Trusdell, F. A. (2019). A high carbon content of the Hawaiian mantle from olivine-hosted melt inclusions. Geochim. Cosmochim. Acta 254, 156–172.
Vedeneeva, E. A., Melnik, O. E., Barmin, A. A., and Sparks, R. S. J. (2005). Viscous dissipation in explosive volcanic flows. Geophys. Res. Lett. 32, doi: 10.1029/2004gl020954
Vona, A., Romano, C., Dingwell, D. B., and Giordano, D. (2011). The rheology of crystal-bearing basaltic magmas from Stromboli and Etna. Geochim. Cosmochim. Acta 75, 3214–3236. doi: 10.1016/j.gca.2011.03.031
Wallace, P. J., and Anderson, A. T. Jr. (1998). Effects of eruption and lava drainback on the H 2 O contents of basaltic magmas at Kilauea Volcano. Bull. Volcanol. 59, 327–344.
Wallace, P. J., Kamenetsky, V. S., and Cervantes, P. (2015). Melt inclusion CO2 contents, pressures of olivine crystallization, and the problem of shrinkage bubbles. Am. Mineral. 100, 787–794. doi: 10.2138/am-2015-5029
Wilding, M., Dingwell, D., Batiza, R., and Wilson, L. (2000). Cooling rates of hyaloclastites: applications of relaxation geospeedometry to undersea volcanic deposits. Bull. Volcanol. 61, 527–536. doi: 10.1007/s004450050003
Xu, Z., and Zhang, Y. (2002). Quench rates in air, water, and liquid nitrogen, and inference of temperature in volcanic eruption columns. Earth Planet. Sci. Lett. 200, 315–330.
Zhang, Y., Jenkins, J., and Xu, Z. (1997). Kinetics of the reaction H2O + O→2 2OH in rhyolitic glasses upon cooling: geospeedometry and comparison with glass transition. Geochim. Cosmochim. Acta 61, 2167–2173.
Zhang, Y., Ni, H., and Chen, Y. (2010). Diffusion data in silicate melts. Rev. Mineral. Geochem. 72, 311–408.
Zhang, Y., Xu, Z., and Behrens, H. (2000). Hydrous species geospeedometer in rhyolite: improved calibration and application. Geochim. Cosmochim. Acta 64, 3347–3355.
Keywords: syneruptive magma ascent, diffusion, melt inclusions, olivine, thermal histories, conduit processes
Citation: Newcombe ME, Plank T, Zhang Y, Holycross M, Barth A, Lloyd AS, Ferguson D, Houghton BF and Hauri E (2020) Magma Pressure-Temperature-Time Paths During Mafic Explosive Eruptions. Front. Earth Sci. 8:531911. doi: 10.3389/feart.2020.531911
Received: 01 February 2020; Accepted: 12 August 2020;
Published: 29 September 2020.
Edited by:
Teresa Ubide, The University of Queensland, AustraliaReviewed by:
Takeshi Kuritani, Hokkaido University, JapanCopyright © 2020 Newcombe, Plank, Zhang, Holycross, Barth, Lloyd, Ferguson, Houghton and Hauri. This is an open-access article distributed under the terms of the Creative Commons Attribution License (CC BY). The use, distribution or reproduction in other forums is permitted, provided the original author(s) and the copyright owner(s) are credited and that the original publication in this journal is cited, in accordance with accepted academic practice. No use, distribution or reproduction is permitted which does not comply with these terms.
*Correspondence: Megan E. Newcombe, bmV3Y29tYmVAdW1kLmVkdQ==
†Deceased
Disclaimer: All claims expressed in this article are solely those of the authors and do not necessarily represent those of their affiliated organizations, or those of the publisher, the editors and the reviewers. Any product that may be evaluated in this article or claim that may be made by its manufacturer is not guaranteed or endorsed by the publisher.
Research integrity at Frontiers
Learn more about the work of our research integrity team to safeguard the quality of each article we publish.