 Jungrack Kim
 Munkhzul Dorjsuren
 Yunsoo Choi
 Gomboluudev Purevjav
95% of researchers rate our articles as excellent or good
Learn more about the work of our research integrity team to safeguard the quality of each article we publish.
Find out more
BRIEF RESEARCH REPORT article
Front. Earth Sci. , 11 November 2020
Sec. Environmental Informatics and Remote Sensing
Volume 8 - 2020 | https://doi.org/10.3389/feart.2020.531104
This article is part of the Research Topic Desertification and Rehabilitation View all 16 articles
The Gobi Desert in southern Mongolia has been identified as the strongest dust storm hot spot threatening public health and socio-economic activities in East Asian countries. Despite its significance, the complete mapping of the aeolian surface erosion in southern Mongolia remains unresolved because of extensive region of interest cannot be interpreted easily by conventional approaches. Therefore, in this study, we built a mapping scheme to define on going aeolian erosion and applied it over the southern Gobi Desert. The remote sensing approach applied here was based on an interferometric synthetic-aperture radar (InSAR) time series technique. A number of Sentinel-1 InSAR pairs that generate phase coherences for a certain period were synthesized via the means of principle component analysis to extract the topographic persistence indicative of surface erosion rates. Validation analyses performed through inter-comparisons of phase coherence signals over landmark areas and residuals between global digital elevation models confirmed the reliability of outputs. The results revealed geological lineaments in southern Mongolia confining sandy deposits and the sediment transportation pathways. Apparently, such bounded eolian deposits and transportation mechanisms within geological structures have significantly contributed to dust generation in the Gobi Desert over southern Mongolia. In addition, this study demonstrated that the newly developed InSAR time series technique has great potential for identifying intensified land erosion and dust sources.
At present, eolian surface erosion and subsequent dust generation are emerging as serious environmental threats to local communities and the socio-economical aspects of surrounding regions. Therefore, comprehensive mapping of eolian surface erosion is a high priority task in dealing with the threat of such global environmental changes effectively through the use of appropriate countermeasures.
In regard to all previous research aimed at defining eolian land erosion, it is worth noting that a large number of approaches were based on spatial analysis techniques involving constraints on eolian erosion. For instance, interpretations of vegetation indices, land cover data, and topographic data have often been employed as tools to trace the susceptibility of land to eolian surface erosion and consequent dust generation. However, there have been no exemplary scientific contributions that directly measured the surface erosion rate by means of remote sensing techniques except for a very small number of special cases that were carried out over a limited local scale. In terms of reliability and applications, obviously there are huge differences between approaches that directly measure surface erosion rates and approaches that indirectly synthesize the involved constraints on surface erosion to forecast the erosion rates.
Even though spatial interpretations on the involved constraints have been regarded as an almost unique tool for identifying potential land erosion over an extensive target area, it is highly demanding to explore alternative ways for the direct and quantitative investigation of eolian surface erosion. Thus, given such a background, we developed a strategy to measure eolian surface erosion directly over sufficiently extensive target areas by means of an interferometric synthetic-aperture radar (InSAR) phase coherence time series method with the integration of complementary satellite remote sensing data.
Mongolia, which has undergone long-term desertification in conjunction with eolian land degradation and dust generation, is an ideal area for investigating the methods that can identify dust sources and eolian surface erosion. Therefore, a large number of scientific studies have been carried out in Mongolia, especially within the designated Gobi Desert regions in southern Mongolia, which are a major contributor to eolian erosion and dust generation. However, no previous studies have directly measured the eolian surface changes over the terrain of the target area, probably because of its enormous spatial extent and barren environments that may make it difficult to conduct field work. In that context, the target area to be investigated by the proposed scheme was established on the Gobi Desert in southern Mongolia. Earlier research mainly based on erosol optical depth (AOD) analyses with moderate resolution imaging spectroradiometer (MODIS) data identified this area as an intensified dust generation source (Ginoux et al., 2012; Zhang et al., 2015), where apparent dust hot spots implying significant eolian surface erosion are populated. Besides such research with mid-resolution satellite images to trace the trails of sand dust, the interpretations of the surface conditions regarding ecological/vegetation factors and land cover changes have shown the target area to be a prime contributor to dust storm generation in NE Asia (Eckert et al., 2015; Wu et al., 2016), and therefore, have subsequent surface erosion. The contexts of the target areas are presented in Figure 1. The focus here was placed on Bayankhongor (BA), Uvurkhangai (UV), Dundgovi (DU), and Umnugovi (UM) in southeastern Mongolia; wide barren terrains, sporadic sand dunes, grazing enclosures, and very rare villages are distributed throughout this area and add important context to the surface erosion process. Other notable attributes of the target area are as follows: 1) the geomorphic context consists of elongated fault zones and basins (Bayasgalan et al., 1999; Bayasgalan et al., 2020), which may play a role in dust sediment transportation; 2) the potential fluvial networks either in the forms of seasonal fluvial channels or paleo river beds (Owen et al., 1997). Other interesting geographic features in the target area are the presence of surface coal mines of considerable sizes and artificially planted forests for the purpose of combating desertification. We propose that the above cases have significant potential for the validation of research outcomes.
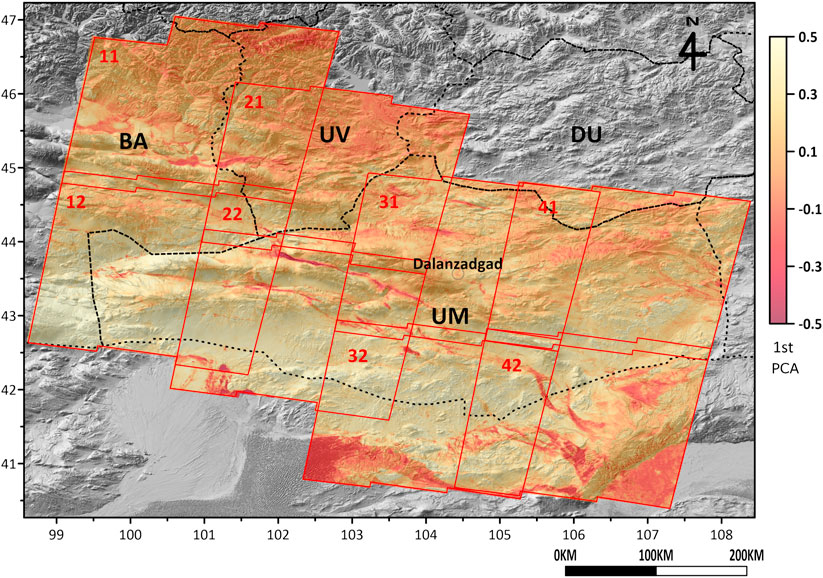
FIGURE 1. The context of the target area and the InSAR overages analyzed for the mapping of eolian surface erosion together with first PCA PC. Refer to Supplementary Table S1 for the detailed information of each InSAR coverage.
InSAR was devised for the measurement of topography and its deformation (Gabriel et al., 1989). This technology exploits the phase angle difference of electromagnetic waves and has been actively used in various applications. However, InSAR results are frequently marred by various error components including those induced by atmospheric artifacts (Li et al., 2005), the errors of base topography (Kim et al., 2018), and charged space particles that result in delays in InSAR signals (Gomba et al., 2015). Thus, the error of measured deformations needs to be compensated by a time series analyses of InSAR phase angles as shown in Berardino et al. (2002). As the task of splitting the genuine deformations and error components is difficult even with recently improved InSAR time series techniques, the mapping of surface deformations by eolian erosion over extensive arid land has never been the topic of InSAR phase angle analyses. Especially on a surface with constantly and heavily ongoing eolian erosion such as sand dune fields, there is no way to provide an “on-time” base DEM that properly depicts concurrent terrain and reduces the error of the InSAR phase angle approach. However, it is worth noting that there is another approach toward measuring surface erosion that uses another InSAR product, the so-called phase coherence, rather than the phase angle as shown in Liu et al. (2001). With the installment of contemporary InSAR assets such as Terra SAR X, Advanced Land Observing Satellite (ALOS) Phased Array type L-band Synthetic Aperture Radar (PALSAR) 1/2, and Sentinel-1, which have better resolution, revisiting times, and resolving power on the baseline conditions, nowadays some research has begun to establish methods of monitoring sand dune dynamics and eolian migrations as shown in Gaber et al. (2018), Gómez et al. (2018), and Havivi et al. (2018). A detailed study of phase coherence behaviors in arid deserts which may involve eolian erosions was reported by Ullmann et al. (2019) who showed that surface characteristics such as slope and wetness are not crucial for the loss of phase coherence, the so-called decorrelation. Thus, the prime factor affecting decorrelation is the change of topography induced by eolian migrations. This somehow contradicts the early study by Lee and Liu (2001) that stated the decorrelation dependency on the slope but the slope effect must not be an issue in the case of small temporal/spatial baseline observations such as the Sentinel-1 InSAR pair employed in this study. These observations form the basis of the approach of this study. It is also worth noting that such decorrelation effects on the heavy erosion topography is a major hindrance to the application of InSAR phase angle for this study.
The major data set used to accomplish the mapping of eolian erosion in this study was composed of European Space Agency (ESA) Sentinel-1 SAR images. Sentinel-1, which currently consists of two satellite constellations, enables a week of revisiting time that provides excellent temporal and spatial baseline conditions for interferometric analyses. Due to the incomparable spatial observation capabilities organized by its imaging mechanism (Yagüe-Martínez et al., 2016), Sentinel-1 has the potential to become a prime tool for measuring eolian erosion. We employed a total of eight InSAR coverages as presented in Figure 1 in the target area. Each coverage consisted of 25–80 InSAR image pairs. Although the revisiting time of Sentinel-1 InSAR pairs was very short, empty temporal durations in consecutive InSAR observations occurred frequently. Therefore, we had to choose the time period that had the best density of InSAR pairs. In this study, it was 2017.
The phase coherence of the interferometric SAR pairs representing the major remote sensing information used in this study was useful in the monitoring of the surface change between successful images. The phase coherence of two conjugated complex SAR pixels can be expressed as follows:
where SMi and S*Si are the complex conjugated signals of the master and slave SAR images, N is the total number of signals within the estimated window, and Ø(i) is the phase of the ith signal within the moving window for phase coherence extraction and Ø(i) is the phase of the ith pixel of the moving window.
Given that phase coherence largely depends on the geometric variation in reflectors, the reflection of radar waves over robust terrain such as barren bedrock, artificial structures, and solidified geomorphic structures produces high phase coherence. However, unstable time varying reflectors such as forestry coverage and materials with changing moistures in consistently eroded surfaces cause weak phase coherence values. Thus, the employment of phase coherences as the signatures for tracing surface erosion require the inspection of such incoherence components. The total coherences can be decomposed as follows:
Spatial coherence is dependent on the geometry of InSAR observation, implying that the perpendicular baseline (Hoen and Zebker, 2000) and its effect on total decorrelation are usually negligible in the case of small temporal/spatial baseline conditions of employed Sentinel-1 time series (Lee and Liu, 2001). Thermal coherence depends on radar thermal noise and is not related to the observation target (Wang et al., 2009). The parameters of Senitnel-1 InSAR time series observation, including temporal and spatial baselines are stated in Supplementary Table S1. Additionally, temporal coherence is a significant parameter in the exploitation of surface migrations. Lee et al. (2012) described the pattern of temporal coherence loss, i.e., temporal decorrelation, as follows:
where Ct is the decay constant of temporal coherence that is dependent on the physical and geometric characteristics of the target surface, and ΔT is the time period of InSAR pair observations. Therefore, construction of a phase coherence loss model to simulate surface change is extremely difficult owing to the prerequisites of determination of decay constants in accordance with the target landcover types and imaging conditions. For instance, vegetation usually causes random decreases in the phase coherence in the presence of biomass and the interactions with wind and moisture (Yun et al., 2019). Further, migration on base topography also decreases the phase coherence, however the aforementioned interactions with vegetation produces additional effects on the measured coherence. Our target area in southern Mongolia is characterized by extensive barren territory as well as sparse vegetation and small water bodies. Although we can assume that the major contributions to the decrease in phase coherence are associated with eolian surface erosion, the effects of cover vegetation or other factors such as, surface moisture are not negligible. The mathematical modeling of phase coherence involved with surface characteristics, particularly in vegetation, are described in Santoro et al. (2007, 2010). However, their studies only show the difficulties in vegetation effect modeling relative to temporal phase coherence, particularly due to the necessary complex information on the structures of vegetation canopy as well as the prevalent climatic factors such as, wind and moisture. Wegmuller et al. (2000) presented a phase coherence characteristic over arid topography using simple models and demonstrated the phase coherence associated with surface erosion, however the decomposition of vegetation effects is not feasible. Recent studies of detailed phase coherence modeling in Jiang et al. (2014), Jiang and Guarnieri (2020), and Monti-Guarnieri et al. (2020) demonstrated the mathematical modeling/simulation approaches of phase coherences. However, the results of those studies are not directly applicable to this study because of the modeling complexities of such an extensive target area with a variety of surface conditions exists.
A promising approach to address such problems involves the employment of a time series analysis of phase coherences over a certain time period rather than the mathematical modeling of all coherence components. We addressed these issues using following approach. First, the advantageous time series analysis, specifically that with the principle component analysis (PCA) of phase coherences, was exploited as the outputs of PCA analyses were expected to remove temporal outliers such as the responses of forest cover to the temporal wind and moisture variations and the remnants of thermal/spatial coherence components. In Yun et al. (2019), PCA analysis was successfully applied to suppress random and climatic factor‐induced fluctuations and maintain only contributions by the topographic characteristics on phase coherence. Thus, a similar approach to only preserve the surface change component of phase coherence induced by the eolian erosion was employed in this study. Hence, the demand for complicated coherence modeling to decompose the surface change and other contributions could be avoided. The first component of the PCA analysis of phase coherence—called the first PCA hereafter—is proposed to represent the transformed signatures corresponding to eolian surface erosion because it is more consistent than the other components canceled into high-order PCA components (see Supplementary Table S1). The effects of such approaches were assessed in Discussions. Furthermore, external information was employed to rule out the low phase coherence area, which was not clearly involved with eolian surface erosion, for instance, the topographic slope for excluding high sloped surface creep, the snow cover over high altitude terrain, and the enhanced vegetation index (EVI) for screening out high vegetation areas that clearly do not allow for eolian erosion but result in phase decorrelations. The EVI data set was constructed from MODIS annual mean observations. We used the ALOS Panchromatic Remote-sensing Instrument for Stereo Mapping (PRISM) and Shuttle Radar Topography Mission (SRTM) 30 m DEM. Since we used two DEMs for validation purposes, their accuracies are of prime concern. Among the many accuracy tests of those DEMs, Santillan and Makinano-Santillan (2016) and Zhang et al. (2019)’s works must be noted as they demonstrated the vertical accuracies of two DEMs to be within the submeter range on a flat surface and that other errors mainly originated from the above-surface structures. Therefore, the application of DEMs using the height residual in this study can be justified. The detailed processing flow and the characteristics of the employed data sets are presented in Supplementary Figure S1.
The first PCA map is presented in Figure 1, and the refined version including only the eolian erosion component is presented in Figure 2A. In fact, the processing load to create more than 300 full Sentinel-1 pairs was not tolerable. Thus, we used the processed COMET LICS InSAR phase coherence products (Wright et al., 2016) to compose the time series data. The first PCA maps were mosaicked and controlled to remove the offsets between coverages using the overlapped portions. Following the construction of the first PCA maps over the entire target area, normalization to the 0.0–1.0 range was performed. Thus, the strong first PCA values were mapped to unchanged topography such as robust bedrock or artificial structures. In contrast, the surfaces where the scatterers were consistently changing such as in the vicinity of water bodies and snow had the minimum first PCA values. Meanwhile, the dense vegetation, surface creep in high slope areas, and more importantly, heavy eolian surface erosion in the dune field was close to the minimum value range according to the strength of changes. From the established map, the first things we observed were the thin sand dune elements along with geological lineaments, the highly vegetated areas in UM and UV, and some mountain flank regions where surface creeps and snow covers are populated as shown in Figure 1. To mask off the high vegetation canopy, surface creep in sloped terrain and snow cover, the threshold values of EVI (0.1), and slope masks (40°) were determined to decompose the interrelationships between the phase coherence first PCA and EVI/slope. The final products, which represent the eolian surface erosion approximately with 100 m spatial resolution, are shown in Figure 2A.
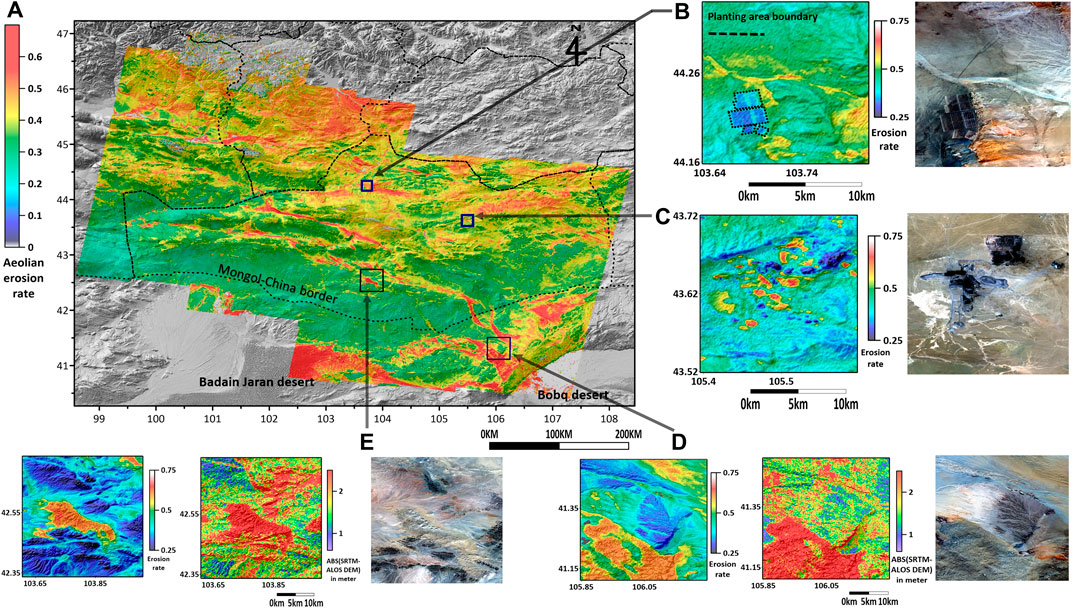
FIGURE 2. (A) The surface erosion map from the first PCA PC and further data interpretation. The landmark areas over planted area (B) and the Tavan Tolgoi coal mine (C) proved the reliability of the constructed map. The validations using the DEM residuals are shown in (D,E). The correlation values of those cases are 0.501 and 0.404, respectively.
Various data sources were employed to assess the accuracy and reliability of the constructed eolian erosion map. First of all, the height differences between two global DEMs, namely, the Shuttle Radar Topography Mission (SRTM) DEM and ALOS PRISM DEM, were employed. The height differences between the SRTM DEM, which was constructed based on topography in the 2000s via the C/X band InSAR mission, and the ALOS PRISM DEM, which was extracted from stereo analyses on optical imaging mission data during 2006–2011, naturally imply the surface erosion rate in theory. However, the mismatch of base plane control in the DEMs and the artifacts of data compilations do not allow for the tracing of the entire surface change by means of DEM residuals. Only partial terrain change was occasionally observed, but the morphologies of the height residuals in comparison to the first PCA gave the confidences on the detected eolian erosion as shown in Figures 2D,E. Regarding the relatively low correlation value between the first PCA component and height residual (0.501 in area D and 0.404 in area E), it should be noted that the DEM height residual represents the overall topographic change in the period between 1998 and 2006–2011 but the phase coherence only measured the erosion rate during 2017. This implies that erosion occurs consistently but periodical change owing to climatic factors exist. On the other hand, the landmarks areas where we knew clear topographic changes existed or preservation areas were employed. The Tavan Tolgoi coal mine, which is the world’s biggest surface coal mine, began to exhibit considerable surface changes from coal production beginning in mid-2010, and these areas were clearly distinguished in the first PCA as shown in Figure 2C. The planted areas (44.23 N, 103.69 E) intended as a countermeasure for the undergoing desertification have been subjected to rigorous soil erosion control measures by means of spring cooler irrigation and manned maintenance. The first PCA components over these planted areas were clearly distinguished as high values and prove these features’ robustness against surface erosion as demonstrated in Figure 2B. Thus, all validations over landmarks demonstrated that the constructed first PCA map had high reliability in terms of being representative of the surface changes induced mainly by eolian erosion.
On the basis of the eolian erosion map constructed from the InSAR phase coherence time series analysis, which demonstrated unprecedented details, an important observation was that the eolian surface erosion in southern Mongolia coincides with the transportation trails of sedimentary materials through geological structures running NW to SE. The southern Mongolian Gobi consists of stone/pebble covered plains rather than sandy deserts, which is not a conducive environment to intensive dust generation and eolian erosion. The extent of the sand and erodible topsoil areas are limited to only around the sand dunes concentrated on geological lineaments, the floors of dried seasonal fluvial channels, and the sedimentary deposits within shallow basins and playa, which are connected to the erosion lineaments. After overlying the extracted outlines of intensified surface erosion on the involved contexts such as hill shaded topography, tectonic faults, and European Center for Medium-Range Weather Forecasts (ECMWF) wind direction/velocities as shown in Figure 3, we clearly observed that the flows of eolian sediment transportation from the sedimentary deposits run through the corridors in geological structures and are connected to northern Chinese deserts such as the Hobq and Badain Jaran deserts. The presence of active dune fields in the Hobq and Badain Jaran deserts as described in Wang et al. (2009) suggest the important roles of such eolian transportation routes. Thus, we concluded that the coincided wind directions and geological lineaments shown in Figures 3A,C are the dominating control factors of the population of eolian surface erosions compared with the effects by hydrological context or vegetation (Figures 3B,D). The strengths of surface erosion in the transportation corridors should be incomparable to the background terrains where steep slopes and weakly vegetated stone/pebble areas are present. Thus, the conventional observations employing AOD, in which the majority of southern Mongolia has been assigned as a mineral dust source, need to be reconsidered. The unequally distributed dust generation frequency, which is more obvious in parts of UM and DU (Ginoux et al., 2012), supports our analyses. At the moment, it is proposed that the biggest scientific achievement in this study is the discovery of the potential coupling between the southern Mongolian Gobi and northern Chinese sandy deserts and the roles of geological structures in the transportation mechanism of eolian sediments.
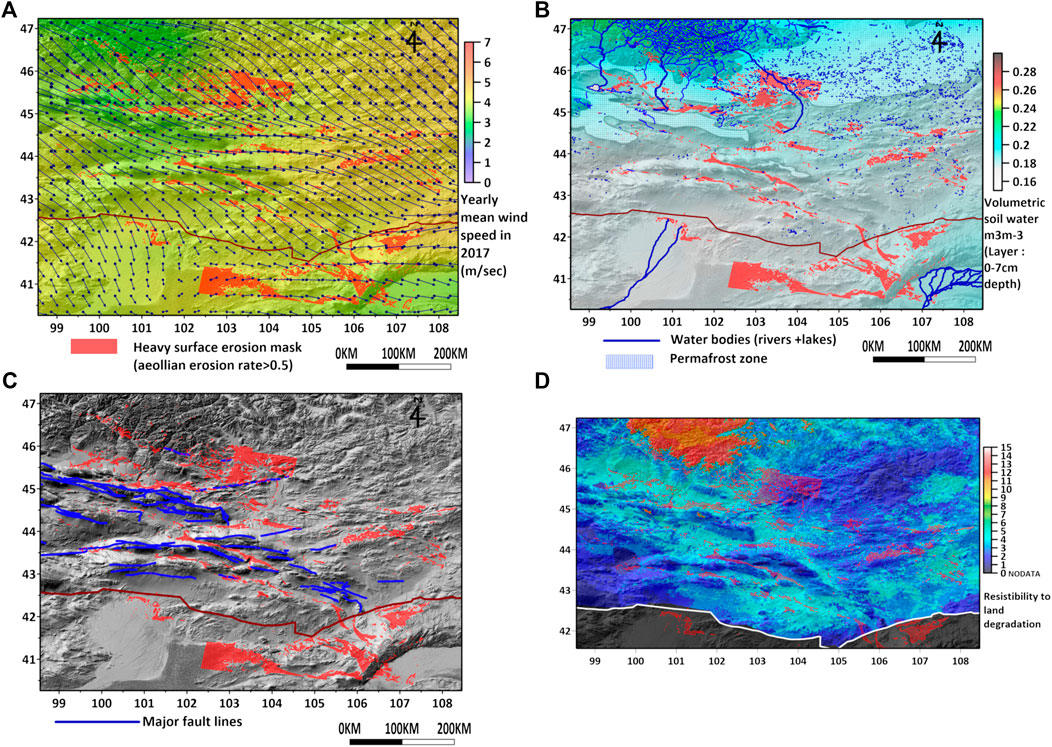
FIGURE 3. (A) The extent of heavy surface erosion (eolian erosion rate > 0.5) along with the yearly mean ECMWF wind information in 2017, also with (B) the hydrological contexts, (C) the geological structures (Bayasgalan et al., 2020), and (E) the land degradation rate by the empirical analysis with vegetation indexes. The details of comparison data sets were given in the Supplementary Material.
In addition to validation using landmark areas and the inter-comparison with potential driving parameters, we introduced further quantitative analyses as shown in Figure 4. First, 150 more major dune fields and dried channels together with playas in southern Mongolia were manually digitized (refer to Supplementary Figure S3). On the different landcover types consisting of dune fields, dried channels, rocky surfaces which have minor vegetation cover, water surfaces and vegetated areas (EVI > 0.1) the phase coherences and their PCA components acted as illustrated in Figure 4A. The strength of eolian surface migrations can be assumed in the order of the dune, dried channels, and rocky surfaces. The phase coherences in Figure 4A decrease with the temporal base line represented by Eq. 3 depending on their landcover types. However, the discrimination between landcover types by phase coherence is made difficult by the mixed signals, as is the assignment of erosion strength. Immediately after taking the first PCA component, the erosion rate according to landcover type can be measured in a single liner relationship. This proved that the feasibility of erosion rate measurement employing the PCA of the phase coherence stack. Second, the spatial correlations between fault structures, low first PCA lineaments, and dune and dried channels have to be verified. All fault lines, dune fields, and dried channels were transferred to linear approximations along major axes. Their polar coordinate representations from central points of every linear approximations are shown in Figure 4B. These presentations clearly prove 1) directional populations of low coherence lineaments along with Gobi-Altai (NWW-SEE) and Tian-Shan (NEE-SWW) fault structures which are two major fault directions of southern Mongolia (Lamb et al., 1999); 2) the dune lines are distributed along with the Gobi-Altai structure but the dried channels has dependence on the Tian-Shan structure. However, some spatial disparity between the dune lines and the Gobi-Altai faults were observed because the dune field cannot be located on the fault line but on the basins and graben between faults; 3) the polar coordinate representations of low phase coherence lines are approximated as combinations of dunes and dried channels. In addition, the fact that the morphology of southern Mongolian dune fields which are identified in satellite images are usually oriented along with the direction of Gobi Altai faults, supports our orientation analyses. Therefore, the dependence of the transportation corridor of eolian sediment along with geological strictures has been proven along with the effectiveness of a phase coherence PCA approach. Other validation checks are shown in the Supplementary Material.
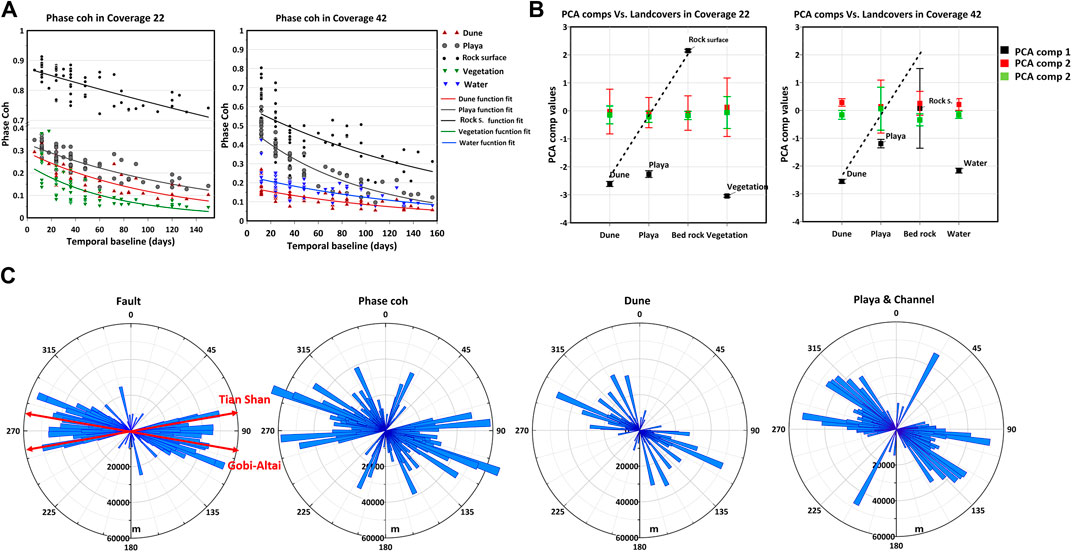
FIGURE 4. (A) The responses of phase coherences according to temporal baselines and the first PCA components on the different land cover types. Note, the signals are well aligned in a single linear relation (dotted line) on the first PCA and their dispersions (error bars in (B)) of the first PCA are very small compared to the second and third PCA components. See Supplementary Figure S2 to identify the populations employed in landcover parts. (B) Polar coordinate representations of low phase coherences, faults, dune, and dried channels. The polar representation of low phase coherence lines was observed to correspond to the sum of dune and dried channel directions.
Together with the discovery of regional erosion patterns over southern Mongolia, we have proven the reliability of InSAR phase coherence approaches in the reconstruction of eolian surface erosion. By combining the time series analyses and interpretations with external auxiliary data sources, we successfully defined eolian surface erosion at an unprecedented resolution. As a major scientific outcome, the presence of connecting corridors throughout geological structures as transportation routes of eolian sedimentary materials was identified between the Southern Mongolian basin and the northern Chinese Hobq/Badain Jaran deserts. The overall methodology in this study has the potential to be used as a comprehensive scheme for extensive dust source mapping, which has been an important goal for combating desertification as well as scientific research over arid dry lands. It is still unclear how the strength of the extracted eolian erosion data in this study can be converted into quantized surface erosion metrics. Since the potential applications of this approach are not limited to relatively vegetation‐free topography like southern Mongolia, the influence of vegetation canopy and the climate parameters such as soil moisture and wind which interfere with the precise measurement of eolian erosion must be addressed. We will tackle these issues in future studies employing a combination of InSAR phase angle analyses techniques and/or in-situ measurements such as laser scanning or drone stereo imaging perhaps together with prior suppression of vegetation effects using phase coherence modeling.
All datasets generated for this study are included in the manuscript/Supplementary Material.
JK conducted the data processing and writing. MD was in charge of collections and the processing of validation and involved in writing. GP and YC contributed to the management of the project and writing.
This work was supported by the Basic Study and Interdisciplinary R&D Foundation Fund of the University of Seoul (2019) and the 2019 Green Tech. Research Fund of the Seoul City government.
The authors declare that the research was conducted in the absence of any commercial or financial relationships that could be construed as a potential conflict of interest.
InSAR PC data sets were provided by LiCSAR which contains modified Copernicus Sentinel data analyzed by the Center for the Observation and Modeling of Earthquakes, Volcanoes, and Tectonics (COMET). The field work was supported by the Asian Green wall project foundation. The geological fault data were kindly provided by A. Bayasgalan
The Supplementary Material for this article can be found online at: https://www.frontiersin.org/articles/10.3389/feart.2020.531104/full#supplementary-material
Bayasgalan, A., Jackson, J., Ritz, J.-F., and Carretier, S. (1999). Field examples of strike-slip fault terminations in Mongolia and their tectonic significance. Tectonics 18, 394–411. doi:10.1029/1999TC900007. CrossRef Full Text
Bayasgalan, A., Odonbaatar, Ch., and Baasanbat, Ts. (2020). Termination of gobi-tian Shan fault, southern Mongolia. Hokudan 2020 Symposium abstract.
Berardino, P., Fornaro, G., Lanari, R., and Sansosti, E. (2002). A new algorithm for surface deformation monitoring based on small baseline differential SAR interferograms. IEEE Trans. Geosci. Rem. Sens. 40, 2375–2383. doi:10.1109/TGRS.2002.803792. CrossRef Full Text
Eckert, S., Hüsler, F., Liniger, H., and Hodel, E. (2015). Trend analysis of MODIS NDVI time series for detecting land degradation and regeneration in Mongolia. J. Arid Environ. 113, 16–28. doi:10.1016/j.jaridenv.2014.09.001. CrossRef Full Text
Gómez, D., Salvador, P., Sanz, J., Casanova, C., and Casanova, J. (2018). Detecting areas vulnerable to sand encroachment using remote sensing and GIS techniques in nouakchott, Mauritania. Rem. Sens. 10, 1541. doi:10.3390/rs10101541. CrossRef Full Text
Gaber, A., Abdelkareem, M., Abdelsadek, I., Koch, M., and El-Baz, F. (2018). Using InSAR coherence for investigating the interplay of fluvial and aeolian features in arid lands: implications for groundwater potential in Egypt. Rem. Sens. 10(6), 832. doi:10.3390/rs10060832. CrossRef Full Text
Gabriel, A. K., Goldstein, R. M., and Zebker, H. A. (1989). Mapping small elevation changes over large areas: differential radar interferometry. J. Geophys. Res. 94, 9183–9191. doi:10.1029/JB094iB07p09183. CrossRef Full Text
Ginoux, P., Prospero, J. M., Gill, T. E., Hsu, N. C., and Zhao, M. (2012). Global-scale attribution of anthropogenic and natural dust sources and their emission rates based on MODIS Deep Blue aerosol products. Rev. Geophys. 50, RG000388. doi:10.1029/2012RG000388. CrossRef Full Text
Gomba, G., Parizzi, A., De Zan, F., Eineder, M., and Bamler, R. (2015). Toward operational compensation of ionospheric effects in SAR interferograms: the split-spectrum method. IEEE Trans. Geosci. Rem. Sens. 54, 1446–1461.
Havivi, S., Amir, D., Schvartzman, I., August, Y., Maman, S., Rotman, S. R., et al. (2018). Mapping dune dynamics by InSAR coherence. Earth Surf. Process. Landforms 43, 1229–1240. doi:10.1002/esp.4309. CrossRef Full Text
Hoen, E. W., and Zebker, H. A. (2000). Penetration depths inferred from interferometric volume decorrelation observed over the Greenland ice sheet. IEEE Trans. Geosci. Rem. Sens. 38(6), 2571–2583. doi:10.1109/36.885204
Jiang, M., Ding, X., Li, Z., Tian, X., Wang, C., and Zhu, W. (2014). InSAR coherence estimation for small data sets and its impact on temporal decorrelation extraction. IEEE Trans. Geosci. Rem. Sens. 52(10), 6584–6596. doi:10.1109/TGRS.2014.229840810.1109/tgrs.2013.2261996. CrossRef Full Text
Jiang, M., and Guarnieri, A. M. (2020). Distributed scatterer interferometry with the refinement of spatiotemporal coherence. IEEE Trans. Geosci. Rem. Sens. 58 (6), 3977–3987. doi:10.1109/TGRS.2019.2960007. CrossRef Full Text
Kim, J. R., Yun, H., Van Gasselt, S., and Choi, Y. (2018). Error-regulated multi-pass DInSAR analysis for landslide risk assessment. Photogramm Eng Remote Sensing 84, 189–202. doi:10.14358/pers.84.4.189. CrossRef Full Text
Lamb, M. A., Hanson, A. D., Graham, S. A., Badarch, G., and Webb, L. E. (1999). Left-lateral sense offset of upper Proterozoic to Paleozoic features across the Gobi Onon, Tost, and Zuunbayan faults in southern Mongolia and implications for other Central Asian faults. Earth Planet Sci. Lett. 173 (3), 183–194. doi:10.1016/s0012-821x(99)00227-7. CrossRef Full Text
Lee, C.-W., Lu, Z., and Jung, H.-S. (2012). Simulation of time-series surface deformation to validate a multi-interferogram InSAR processing technique. Int. J. Rem. Sens. 33, 7075–7087. doi:10.1080/01431161.2012.700137. CrossRef Full Text
Lee, H., and Liu, J. G. (2001). Analysis of topographic decorrelation in SAR interferometry using ratio coherence imagery. IEEE Trans. Geosci. Rem. Sens. 39(2), 223–232. doi:10.1109/36.905230
Li, Z., Muller, J. P., Cross, P., and Fielding, E. J. (2005). Interferometric synthetic aperture radar (InSAR) atmospheric correction: GPS, Moderate Resolution Imaging Spectroradiometer (MODIS), and InSAR integration. J. Geophys. Res. 110, B03410. doi:10.1029/2004JB003446. CrossRef Full Text
Liu, J. G., Black, A., Lee, H., Hanaizumi, H., and Moore, J. M. (2001). Land surface change detection in a desert area in Algeria using multi-temporal ERS SAR coherence images. Int. J. Rem. Sens. 22, 2463–2477. doi:10.1080/01431160119991. CrossRef Full Text
Monti-Guarnieri, A., Manzoni, M., Giudici, D., Recchia, A., and Tebaldini, S. (2020). Vegetated target decorrelation in SAR and interferometry: models, simulation, and performance evaluation. Rem. Sens. 12(16), 2545. doi:10.3390/rs12162545. CrossRef Full Text
Owen, L. A., Windley, B. F., Cunningham, W. D., Badamgarav, J., and Dorjnamjaa, D. (1997). Quaternary alluvial fans in the Gobi of southern Mongolia: evidence for neotectonics and climate change. J. Quat. Sci. 12, 239–252. doi:10.1002/(sici)1099-1417(199705/06)12:3<239::aid-jqs293>3.0.co;2-p. CrossRef Full Text
Santillan, J. R., and Makinano-Santillan, M. (2016). Vertical accuracy assessment of 30-M resolution alos, aster, and srtm global dems over northeastern mindanao, Philippines, Int. Arch. Photogram. Rem. Sens. Spatial Inf. Sci. XLI-B4, 149–156. doi:10.5194/isprs-archives-XLI-B4-149-2016. CrossRef Full Text
Santoro, M., Askne, J. I. H., Wegmuller, U., and Werner, C. L. (2007). Observations, modeling, and applications of ERS-ENVISAT coherence over land surfaces. IEEE Trans. Geosci. Rem. Sens. 45(8), 2600–2611. doi:10.1109/TGRS.2007.897420. CrossRef Full Text
Santoro, M., Wegmuller, U., and Askne, J. I. H. (2010). Signatures of ERS-envisat interferometric SAR coherence and phase of short vegetation: an analysis in the case of maize fields. IEEE Trans. Geosci. Rem. Sens. 48(4), 1702–1713. doi:10.1109/TGRS.2009.2034257. CrossRef Full Text
Ullmann, T., Sauerbrey, J., Hoffmeister, D., May, S. M., Baumhauer, R., and Bubenzer, O. (2019). Assessing spatiotemporal variations of sentinel-1 InSAR coherence at different time scales over the atacama desert (Chile) between 2015 and 2018. Rem. Sens. 11(24), 2960. doi:10.3390/rs11242960. CrossRef Full Text
Wang, T., Liao, M., and Perissin, D. (2010). InSAR coherence-decomposition analysis. Geosci. Rem. Sens. Lett. IEEE 7(1), 156–160. doi:10.1109/LGRS.2009.2029126. CrossRef Full Text
Wang, X., Yang, Y., Dong, Z., and Zhang, C. (2009). Responses of dune activity and desertification in China to global warming in the twenty-first century. Global Planet. Change 67(3-4), 167–185. doi:10.1016/j.gloplacha.2009.02.004. CrossRef Full Text
Wegmuller, U., Strozzi, T., Farr, T., and Werner, C. L. (2000). Arid land surface characterization with repeat-pass SAR interferometry. IEEE Trans. Geosci. Rem. Sens. 38(2), 776–781. doi:10.1109/36.842006. CrossRef Full Text
Wright, T. J., Gonzalez, P. J., Walters, R. J., Hatton, E. L., Spaans, K., et al. (2016). LiCSAR: Tools for automated generation of Sentinel‐1 frame interferograms., In Proceedings of the AGU Fall Meeting. San Francisco, CA, USA December 12–16, 2016.
Wu, J., Kurosaki, Y., Shinoda, M., and Kai, K. (2016). Regional characteristics of recent dust occurrence and its controlling factors in East Asia. SOLA 12, 187–191. doi:10.2151/sola.2016-038. CrossRef Full Text
Yagüe-Martínez, N., Prats-Iraola, P., Rodriguez Gonzalez, F., Brcic, R., Shau, R., Geudtner, D., et al. (2016). Interferometric processing of Sentinel-1 TOPS data. IEEE Trans. Geosci. Rem. Sens. 54, 2220–2234. doi:10.1109/TGRS.2015.2497902. CrossRef Full Text
Yun, H.-W., Kim, J.-R., Choi, Y.-S., and Lin, S.-Y. (2019). Analyses of time series InSAR signatures for land cover classification: case studies over dense forestry areas with L-band SAR images. Sensors 19(12), 2830. doi:10.3390/s19122830. CrossRef Full Text
Zhang, B., Tsunekawa, A., and Tsubo, M. (2015). Identification of dust hot spots from multi-resolution remotely sensed data in eastern China and Mongolia. Water Air Soil Pollut. 226, 117. doi:10.1007/s11270-015-2300-2. CrossRef Full Text
Zhang, K., Gann, D., Ross, M., Robertson, Q., Sarmiento, J., Santana, S., et al. (2019). Accuracy assessment of ASTER, SRTM, ALOS, and TDX DEMs for Hispaniola and implications for mapping vulnerability to coastal flooding. Rem. Sens. Environ. 225, 290–306. doi:10.1016/j.rse.2019.02.028. CrossRef Full Text
Keywords: land degradation, aeolian erosion, interferometric synthetic-aperture radar, phase coherence, time series analysis
Citation: Kim J, Dorjsuren M, Choi Y and Purevjav G (2020) Reconstructed Aeolian Surface Erosion in Southern Mongolia by Multi-Temporal InSAR Phase Coherence Analyses. Front. Earth Sci. 8:531104. doi: 10.3389/feart.2020.531104
Received: 31 January 2020; Accepted: 17 September 2020;
Published: 11 November 2020.
Edited by:
Atsushi Tsunekawa, Tottori University, JapanCopyright © 2020 Kim, Dorjsuren, Choi and Purevjav. This is an open-access article distributed under the terms of the Creative Commons Attribution License (CC BY). The use, distribution or reproduction in other forums is permitted, provided the original author(s) and the copyright owner(s) are credited and that the original publication in this journal is cited, in accordance with accepted academic practice. No use, distribution or reproduction is permitted which does not comply with these terms.
*Correspondence: YunSoo Choi, Y2hvaXlzQHVvcy5hYy5rcg==
Disclaimer: All claims expressed in this article are solely those of the authors and do not necessarily represent those of their affiliated organizations, or those of the publisher, the editors and the reviewers. Any product that may be evaluated in this article or claim that may be made by its manufacturer is not guaranteed or endorsed by the publisher.
Research integrity at Frontiers
Learn more about the work of our research integrity team to safeguard the quality of each article we publish.