- 1Department of Atmospheric and Oceanic Science, University of Maryland, College Park, College Park, MD, United States
- 2National Snow and Ice Data Center, University of Colorado Boulder, Boulder, CO, United States
- 3Department of Glaciology and Climate, Geological Survey of Denmark and Greenland, Copenhagen, Denmark
Supraglacial lakes over the Greenland Ice Sheet can demonstrate multi-model drainage states. Lakes can demonstrate incomplete drainage, where residual melt can become buried under ice and snow and survive throughout the winter. We evaluate atmospheric factors that influence the propensity for the formation of buried lakes over the ice sheet. We examine the spatial and temporal occurrence and behavior of buried lakes over the Jakobshavn Isbrae and Zachariae Isstrøm outlet basins and assess the magnitude of insolation necessary to preserve melt water using a numerical lake model from 2009 to 2012. Buried lakes tend to occur at higher elevations within the ablation zone and those present at elevations > 1000 m tend to reoccur over several seasons. Lakes without buried water are relatively small (∼1 km2), whereas lakes with buried water are larger (∼6–10 km2). Lake area is correlated with the number of seasons sub-surface water persists. Buried lakes are relatively deep and associated with complex supraglacial channel networks. Winter stored water could be a precursor to the formation of supraglacial channels. Simulations of the insulation potential of accumulated snow and ice on the surface of lakes indicate substantial regional differences and inter-annual variability. With the possibility of inland migration of supraglacial lakes, buried lakes could be important in the evolution of ablation/percolation zone hydrology.
Introduction
Motivation and Prior Work
Mass loss and thinning of the Greenland ice sheet has been associated with 2°C warming over the last two decades in southern coastal regions (Rignot et al., 2008; Enderlin et al., 2014). Greenland experienced mass loss of ∼137 and 286 Gt/yr from 2002–2003 and 2007–2009, respectively (Velicogna, 2009; Shepherd et al., 2012). Melt water generated at the surface of the western coast of the Greenland ice sheet during the summer flows in supraglacial streams, and collects in topographical lows creating supraglacial lakes (Bryzgis and Box, 2005; McMillan et al., 2007; Sneed and Hamilton, 2007; Das et al., 2008; Sundal et al., 2009; Lampkin, 2011; Selmes et al., 2011; Tedesco and Steiner, 2011; Howat et al., 2013; Yang and Smith, 2013; Koenig et al., 2015; Palmer et al., 2015). These lakes have been monitored by satellites for lake evolution and lake depth (Box and Ski, 2007; Sneed and Hamilton, 2007; Pope et al., 2016). Supraglacial lakes deliver surface melt water to the ice-bed interface via hydrofracture, moulins, and crevasse drainage, resulting in local and regional acceleration (Alley et al., 2005; Das et al., 2008; Krawczynski et al., 2009; Colgan et al., 2011; Sole et al., 2011; Smith et al., 2015; Stevens et al., 2015). The impact of infiltrating surface melt water on basal friction, inducing an ice dynamic response has been well documented (Iken and Bindschadler, 1986; Zwally et al., 2002; Meierbachtol et al., 2013; Doyle et al., 2014; Willis et al., 2015; Chu et al., 2016). Infiltrated melt induced ice acceleration is mediated by the configuration and evolution of the subglacial hydrologic system, regulated by basal conditions as well as seasonal, annual, and long term melt input rates (Schoof, 2010; Tsai and Rice, 2010; Dow et al., 2015; Lindbäck et al., 2015; Stevens et al., 2015). Under contemporary warming scenarios, supraglacial hydrologic systems are predicted to expand inland and impact ice flow (Parizek and Alley, 2004; Lüthje et al., 2006; van de Wal et al., 2008; Fitzpatrick et al., 2013; Howat et al., 2013) at elevations less than ∼1600 meters above sea-level (m a.s.l.) due where surface strains rates allows for the formation of crevasses and moulins (Poinar et al., 2015). Sole et al. (2013) observe that infiltrated surface melt water induce acceleration in ice velocities during the summer with a slowdown in the winter as a function of an efficient subglacial hydrologic system. Doyle et al. (2014) show that higher elevations demonstrate sustained acceleration throughout the summer and winter and attribute this to an inefficient subglacial hydrology at higher elevations. These results indicate that the impact of inland expansion of melt water on ice flow will likely be heterogeneous over the ice sheet.
Supraglacial lakes can demonstrate multi-modal drainage behavior. Lakes can evacuate water rapidly resulting in complete drainage. Das et al. (2008) document drainage of a supraglacial lake over < 24 h. Doyle et al. (2013) observed a drainage event from a large lake over a 2 h interval. Rapid drainage events account for ∼13% of drainage modes (Selmes et al., 2011). Supraglacial lakes are known to partially drain over relatively longer intervals of time. Selmes et al. (2011) indicate that a third of lakes survey drained slowly with most at higher elevations maintaining water throughout the season and freezing. Koenig et al. (2015) have shown that supraglacial lakes can maintain water through the winter as stored sub-surface mass beneath an ice and snow lid. Recently, Miles et al. (2017) used Sentinel-1 C-band synthetic aperture radar (SAR) to detect sub-surface lakes and monitor the onset and evolution of lake freezing throughout the winter. They determined that sub-surface lakes freeze over early in the winter and are generally found at relatively higher elevation than surface lakes and reach a maximum elevation up to ∼1,900 m above sea level (a.s.l.). C-band radar is limited in its capacity to detect the presence of buried water through thick snow and ice layers and results in the potential for under estimating the number of lakes that harbor water (Miles et al., 2017).
Surface melt water lakes that become buried and maintain persistent water through the winter expands the field of supraglacial hydrodynamics. The lakes could have important implications for the evolution of ice sheet melt sensitivity and ice dynamics. Lake water can initiate cracks or fractures, deliver melt water and heat into the ice sheet resulting in softening of the ice (Koenig et al., 2015). Storage of melt water in supraglacial lake basins throughout the winter is extensive along the margin of the ice sheet, especially below 2000 m (Koenig et al., 2015). While the distribution of buried lakes has been quantified by Koenig et al. (2015), the control on the spatial and temporal occurrence of over-winter stored lake water is not well understood.
Several factors can influence the onset and persistence of stored water within supraglacial lake basins and drive the formation of persistent water in supraglacial lake basins. These factors can be categorized as endogenic or exogenic. Incomplete drainage due to hydrofracture and/or channelized drainage are endogenic processes that determine the initial conditions for a buried lake. Exogenic atmospheric forcing can influence the survival of residual water in a basin. Atmospheric forcing controls the timing, rate, and magnitude of lake surface ice formation during the late summer to early winter and determines the degree of thermal insulation necessary to preserve melt water that has not fully drained from a given basin. In this analysis, we focus only on exogenic factors conducive for melt water persistence throughout the winter in lake basins.
Objectives
In this work, we seek to establish constraints on the conditions facilitating the perseveration and over-winter storage of supraglacial melt water in surface basins. We seek to evaluate buried lake characteristics derived from surface penetrating radar (Koenig et al., 2015). We also use optical satellite imagery acquired over two major Greenland ice sheet outlet basins in 4 years (2009–2012) to map supraglacial lakes and channels under different meteorological and glaciological conditions. We implement a numerical, one-dimensional hydrodynamic lake model to understand first-order conditions across the ice sheet conducive for the formation of buried lakes.
Study Area
Prognostic investigations of supraglacial lakes predict an inland expansion and increase in area of up to 53% across the GrIS with warming temperatures (Leeson et al., 2015). In particular, the south-western ice sheet has shown over the last 40 years an expansion in the distribution of supraglacial lakes beyond an elevation of 1900 m (Howat et al., 2013). Considering that every closed surface depression represents potential storage of surface melt water as a supraglacial lake, a substantial proportion of surface depressions are found in the south-western (23% or total) and north-eastern (18% of total) sectors. This constrains the possibilities for future expansion of lakes as these sectors have the highest potential for water capture relative to other catchments across the ice sheet (Ignéczi et al., 2016). The north-east sector is projected to undergo the largest expansion over the next century, conservatively by ∼191% (Ignéczi et al., 2016). Given this, we focus this analysis on the Jakobshavn Isbrae and Zachariae Isstrøm catchments in the south-western and north-eastern sectors, respectively (Figure 1).
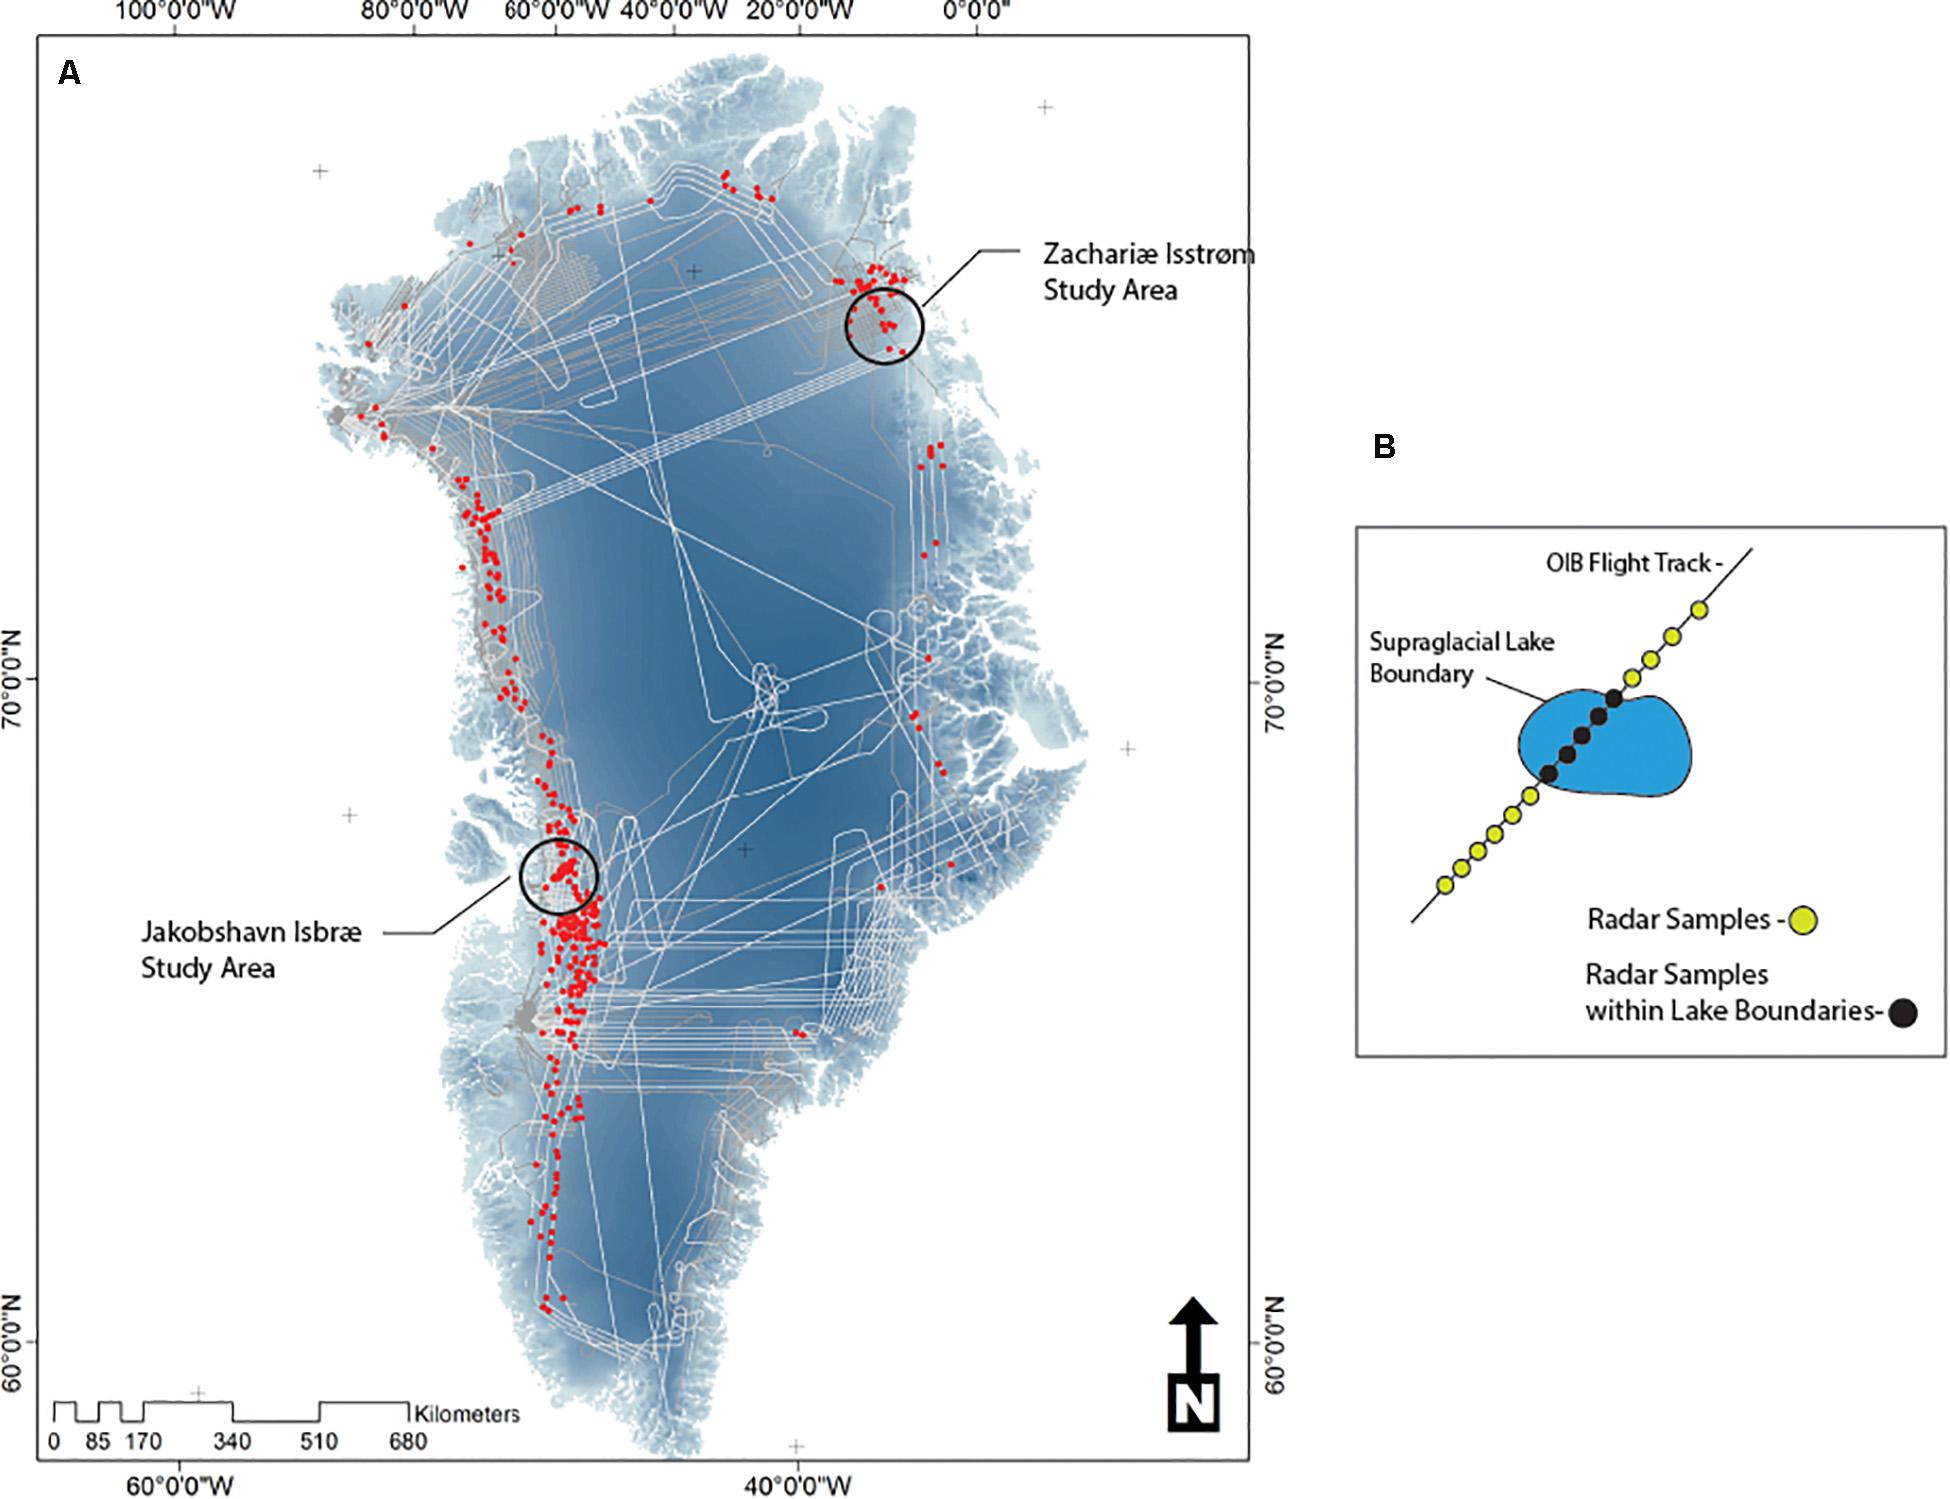
Figure 1. (A) Study Areas examined in this analysis (black circles) which includes the ablation zones of the Jakobshavn Isbrae outlet basin in central-west Greenland ice sheet and Zachariae Isstrøm in the north-east. Superimposed over a shaded relief map of the Greenland ice sheet are the locations of detected sub-surface lakes (red) and operational ice bridge (OIB) flight tracks (gray). (B) Intersection of an idealized OIB flight track over a supraglacial lake depicting radar samples from which the presence and depth of buried water was determined (from Koenig et al., 2016).
Data
Supraglacial Lake and Channel Data
The contrast in surface reflectance between ice and water in the visible parts of the electromagnetic spectrum allow for the identification of lakes and channels on an ice sheet surface. Satellite observations of supraglacial lakes and channels were used in this analysis. Supraglacial lake boundaries and the planar trace of supraglacial channels within the Jakobshavn Isbrae study region were manually delineated from high-resolution, cloud-free Landsat-7 enhance thematic mapper (ETM)+ scan line corrector (SLC)-off panchromatic data centered at path (009), row (011) from the United States Geological Survey Land Processes Distributed Active Archive Center (USGS LPDAAC1) with a nominal spatial resolution of 15 m (Lampkin and VanderBerg, 2011, 2013). Lakes filled with surface melt water were visually delineated based on several criteria. First, only lakes with reasonably discernible boundaries were delineated. Small lakes less than the width of missing scan lines, which can range from 30 m near the scene center to as large as ∼490 m near the edge, were not included in the inventory and therefore not analyzed. Additionally, rectilinear features, indicative of a stream or stream−like structures, were not mapped. The boundaries of a water−filled lake were delineated through identification of spatially closed features with low digital number (DN) values, indicative of increased surface absorption due to the presence of water across ETM+ panchromatic bands. The hydrologic state for each lake during the 16-day interval between Landsat image dates was determined. We regard the hydrologic lake state in this analysis as ‘filled’ or ‘fully drained’ lakes. Drained lakes were determined by removing lakes that were filled in a previous image and not present in a subsequent image, which indicates complete drainage. Partial drainage of lakes is not evaluated in this analysis. Supraglacial channel networks were classified into three main hydrologic configurations: Tributary, Connector, and Terminal. Tributary channels are those that terminate into another channel. Connector channels are those that link supraglacial lakes. Terminal channels are those that terminate into lakes, crevasse fields or moulins (Lampkin and VanderBerg, 2013). Procedures used to map lakes and channels over Jakobshavn Isbrae were used to delineate features within the Zachariae Isstrøm study region in this effort. The presence of missing data in Landsat scenes due to a scan line corrector failure (SLC-off data) can have an impact on the ability to map lake and channel features. We implemented a set of consistent guidelines in mapping features given the missing data. Only lakes features whose boundaries were not substantially eclipsed by missing lines were delineated. Smaller lakes feature that were less than the width of missing lines were not mapped. For additional information on data processing and feature delineation procedures, see Lampkin (2011) and Lampkin and VanderBerg (2013). Temporal distribution and list of Landsat scenes used in this analysis are presented in Supplementary Appendix A1 (Supplementary Appendix S1) and Supplementary Appendix Tables A1.1, A1.2 over both study regions.
Ice Penetrating Radar
Detection and mapping of subsurface water, snow, and ice thickness layers was derived from the Center for Remote Sensing of Ice Sheets’ (CReSIS) ultra-wideband Snow Radar. The CReSIS radar system was flown during NASA’s operational ice bridge (OIB) campaigns from 2009 through 2012 (Leuschen, 2014; Koenig et al., 2015). The snow radar operates from ∼2 to 6.5 GHz and uses a frequency-modulated continuous wave (FMCW) configuration to a depth of tens of meters at ∼ 4 cm vertical resolution through snow and firn (Panzer et al., 2013; Rodriguez-Morales et al., 2014).
Meteorological Data
Surface energy balance data from the Modèle Atmosphérique Régional (MAR), a polar regional climate model (RCM) coupled to a snow energy balance model (Fettweis et al., 2013) were used to force the hydrodynamic lake model (model description in section “Model Description” and Supplementary Appendix A2). Forcing variables are summarized in Supplementary Appendix Table A1.1. Daily MAR data version 3.5.2 grids sampled at 10 km were extracted over the ice sheet. Energy balance products derived from this version of MAR were forced with the European Centre for Medium-Range Weather Forecasts (ECMWF) ERA-Interim reanalysis data (Dee et al., 2011).
Elevation Data
Surface elevation data was extracted from a digital elevation model (DEM). DEM surface elevation grids over the study area were acquired from the Greenland Mapping Project (GIMP) DEM product (Howat et al., 2015). Estimates of elevation were constructed from a combination of ASTER and SPOT-5 for the ice sheet margins with a spatial resolution of 30 m. Estimates of surface elevation have a relative root-mean-square error (as compared to ICESat altimetry data) of ± 10 m a.s.l. over the whole ice sheet with a minimum of ± 1 m a.s.l. in low relief areas and ± 30 m a.s.l. in high relief regions (Howat et al., 2015).
Lake Depth Data
Spatially distributed estimates of supraglacial lake depths are estimated from cloud-free top of atmosphere reflectance data derived from Landsat-8 Operational Land Imager (OLI) imagery at 30 m spatial resolution using a multi-band, spectral-based retrieval algorithm by Pope et al. (2016). Landsat-8 was launched in 2013. Data from OLI during the summer of 2014 were used in this analysis (dates of scenes are listed in Supplementary Appendix Table A1.3). A physical-based retrieval of water depth was implemented based on the attenuation of light through the water column using measured near surface reflectance (Philpot, 1989; Sneed and Hamilton, 2007; Banwell et al., 2014). This approach assumes lake bottoms maintain low slopes and uniform albedo. Pope et al. (2016) used a ratio of OLI blue (0.452–0.512 μm) and red (0.636–0.673 μm) bands to delineate supraglacial lake extent. Within these extents, lake depth estimates were computed using red and panchromatic band (0.503–0.676 μm) reflectance as input to the physical-based model. Maximum depths for each lake [Ldepth(max)] only over the Jakobshavn Isbrae study area are analyzed during the 2014 melt season. Unarchived data were provided by Pope et al.(2016, personal communication).
Materials and Methods
Detection of Sub-Surface Water, Ice, and Snow Interfaces
We evaluate the spatial distribution of the presence and depth to the buried water surface only for lake features where OIB flight tracks intersect the areal boundaries of supraglacial lakes mapped from Landsat imagery (Figure 1B) over both the Jakobshavn Isbrae and Zachariae Isstrøm study areas. Where present, snow/lake-ice interface and lake-ice/water interfaces were manually digitized from Snow Radar echograms to determine the depth from the snow surface to the water surface of buried lakes. The depths to these interfaces were assessed with an average uncertainty of ∼9% (Koenig et al., 2015). In the analysis, only the depth from the surface to the lake-ice/water interface and snow/lake-ice interface were considered. We do not distinguish between fully lakes with and without ice/snow caps in this analysis. Both are treated as lakes without buried water.
Derivation of Supraglacial Lake Morphology
Here, we introduce a metric for quantifying lake-boundary shape and explore if it is influential for the onset and duration of accumulated snow and ice as well as partitioning of water to channelized runoff. Lake morphology could be related to lake depth such that the distribution of heat throughout the water column could influence heat fluxes. We quantify the degree to which a lake basins boundary deviates from a circle, which effectively represent the minimum circumscribed circle relative to an irregularly shape lake boundary. We define a geometric metric (γlake), given by
where Alake is the area of lakes delineated from satellite imagery and A∘ is the minimum area of a circle that encapsulates the irregular boundary of a lake delineated from imagery. Given this, 0 < γlake < 1 where γlake = 1 indicates a lake with a boundary that is equivalent to a circle and γlake = 0 an eccentric boundary that deviates from perfect circularity.
Modeling Lake Surface Ice and Snow Accumulation
Model Description
We modify the one-dimensional, Multi-Year Simulation Model for Lake Thermo- and Phytoplankton Dynamics (MyLake; Saloranta and Andersen, 2007) to model the seasonal evolution of snow and ice accumulation on supraglacial lakes. MyLake simulates variations in the vertical distribution of lake state variables: temperature and density versus depth, evolution of surface ice and snow. We leverage MyLake hydro/thermodynamic (Ford and Stefan, 1980; Riley and Stefan, 1988) and snow/ice simulation (Leppãranta, 1991; Saloranta, 2000) schemes by introducing a custom ice-basin substrate within the model domain (Figure 2), hereafter we refer to this modified version as MyICELake. Ice evolution schemes are based on Leppãranta (1991) and Saloranta (2000). We do not utilize Mylake schemes related to mass inflow/outflow, sedimentation, or biochemical dynamics. The model is suitable for lake dynamics specific to colder climates (Saloranta and Andersen, 2007). In particular, Mylake has been used to assess the evolution of lake ice under a range of conditions. Dibike et al. (2012) examine lake ice onset and duration over cold-region conditions in North America between 40and 75° latitude.
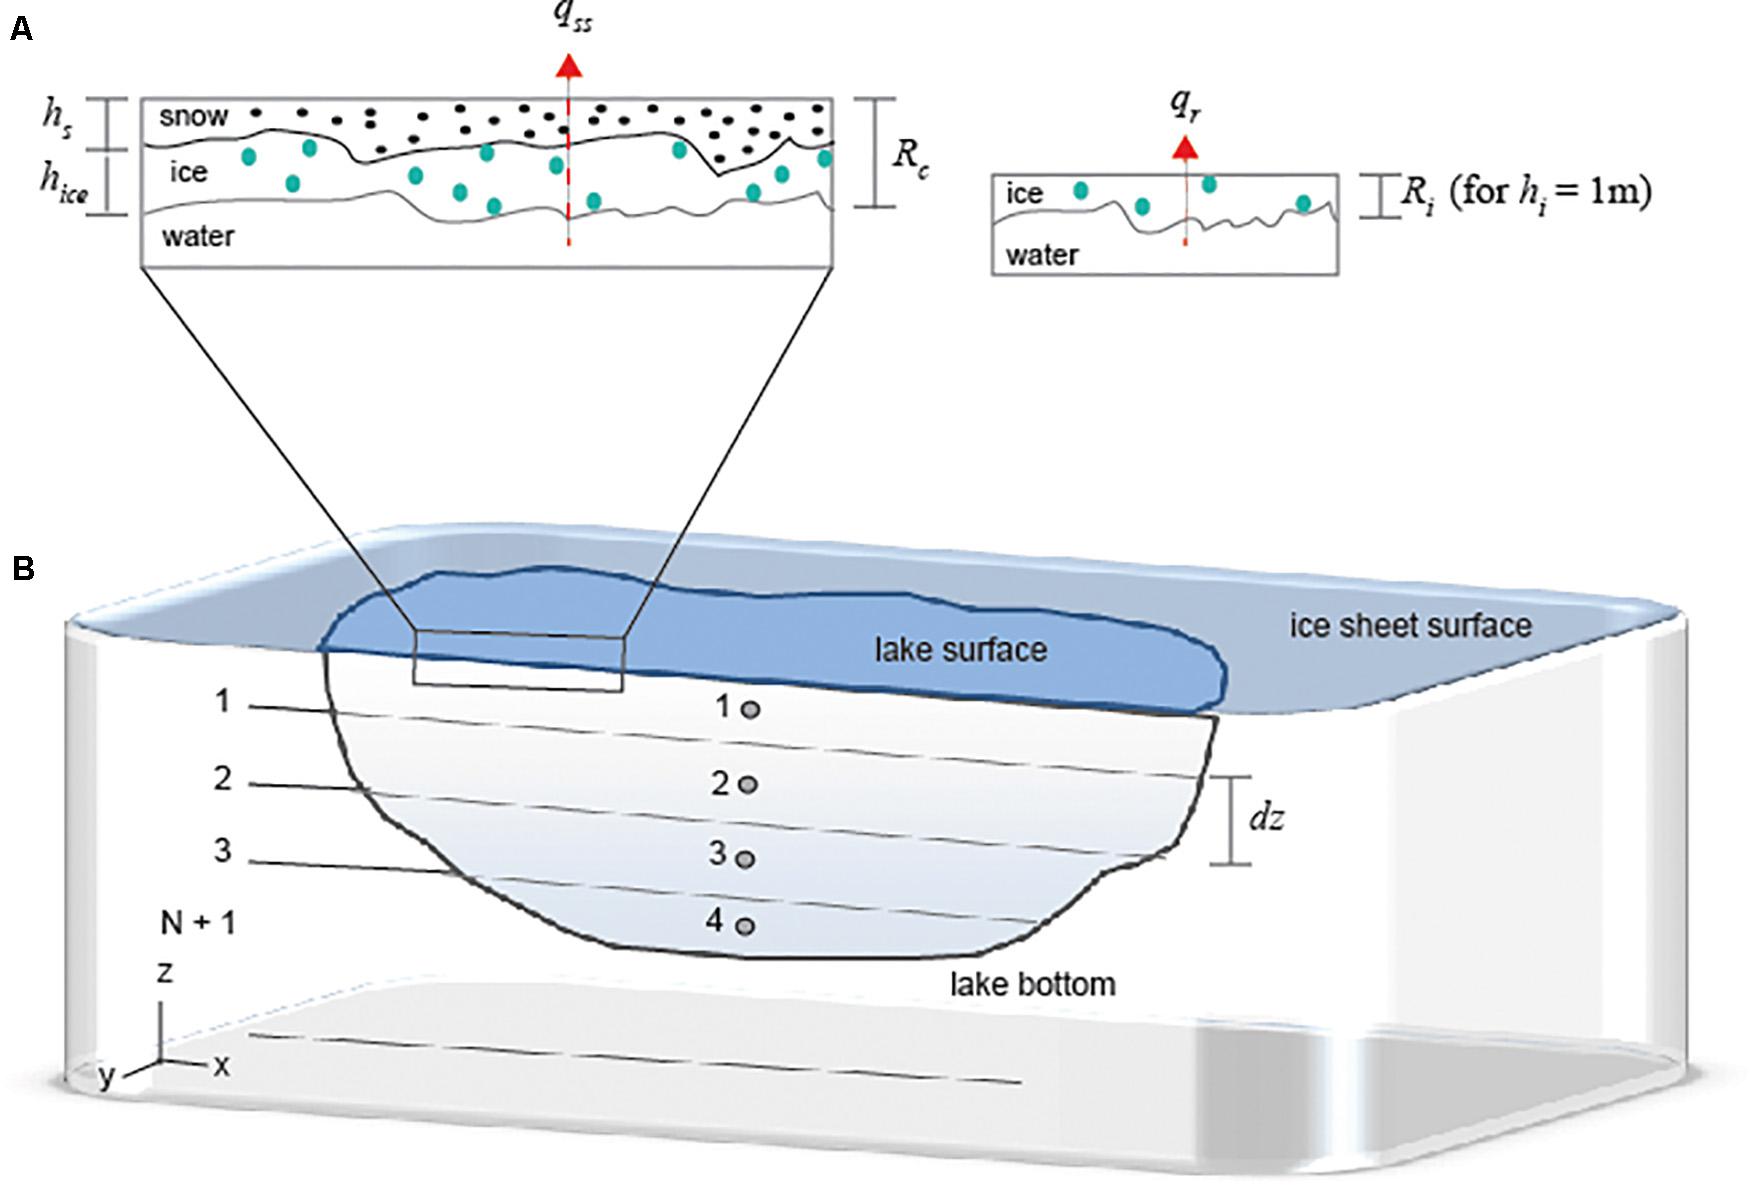
Figure 2. Supraglacial lake one-dimensional evolution model (MyICELake) schematic showing (A) vertical model domain profile highlighting horizontal layers (of thickness dz) over which state variables are assumed to be uniform for N + 1 layers, (B) showing modeled accumulated snow (black dots) and ice (blue dots) layers (of thickness hs and hice, respectively) over the lake surface over which estimates of insulation capacity (qss) are assessed relative to the insulation capacity of a 1 m reference layer of ice (qr).
The model domain is partitioned into n horizontal layers at depths z1, …., zn+1, where the surface z1 = 0 and volume of each zone i is such that z1 ≤ z < zn+1 (Figure 2). MyICELake is capable of simulating the evolution of ice accumulation and melt at the lake surface and snow accumulation on top of the lake ice. For additional details about the model see Supplementary Appendix A2.
Model Experiments
The model is configured to represent an idealized lake with an inverted, symmetric half-sphere with 10 layers (Figure 2A; see Supplementary Appendix Tables A1.1, A1.2 for model parameters and forcing details). Simulations in this analysis are diagnostic and are configured to implement only essential processes relevant to the formation of lake ice and accumulated snow. This effort is not a comprehensive treatment of all processes known to be active in lake dynamics. Model time step is set to 1 day and the simulation period for each season runs from January 1 to November 1 from 2009 to 2012. For each season, the period from January 1 to May 1 is considered a spin-up period resulting in the effective analysis period spanning from May 1 to November 1. The simulation interval includes periods preceding and following the melt season as this allows for the evaluation of the onset of accumulation and melting of lake surface snow and ice. Model lake surface meteorological parameters are provided from MAR output. At each time step MyICELake estimates accumulated snow and ice thickness on the lake surface. We evaluate the spatial distribution of snow and ice thickness over the GrIS during the analysis period at elevations between the ice sheet edge and 2000 m. We assess the mean annual snow (< hs >) and ice thickness (< hice >), onset date of snow (φs) and ice accumulation (φice), and the mean rate of change in snow (< Δhs >) and ice (< Δhice >) accumulation for each season. We evaluate model performance to estimate snow and ice thickness relatives to measured thickness derived from airborne OIB snow radar data (see Supplementary Appendix S2 and Supplementary Appendix A3).
Thermal Insulation of Supraglacial Lakes by Snow and Ice
We are particularly concerned with the ability of accumulated snow and ice to insulate and preserve residual lake water throughout the winter. Once meltwater persists in a supraglacial basin beyond the summer, insulation is enhanced by the magnitude of ice and snow formation on the water surface. Ice formation is the result of radiative and turbulent heat losses from the relatively warm lake surface to the cooler atmospheric boundary layer. When lake water temperature (T) exceed the maximum density temperature (∼3.98°C for fresh water; Tm), heat loss from the lake surface can induce convection within the water column driven by density differences resulting in removing heat from depth (Kirillin et al., 2012). As heat loss continues, convection can continue at T < Tm and the cooling rate accelerates until T→0°C inducing ice formation. After the initiation of ice formation, it can continue to thicken as long as the released latent heat can conduct through the ice layer into the atmosphere (Leppäranta, 2009). Given this, we derive idealized estimates on the degree to which snow and ice insulate supraglacial lake water and evaluate the ice sheet wide variability in these insulation conditions.
Treating ice (snow) as a solid, uniform boundary between the surface water layer and the atmosphere (Figure 2B), we can quantify the minimum depth at which the ice (snow) needs to be to behave as a thermal semi-infinite solid to a transient perturbation imposed at the ice (snow) surface. The diffusion of heat due to conduction through a solid is given by:
where T is temperature, α thermal diffusivity expressed as k/cρ and t time. For a one-dimensional (flow in x-direction only) steady-state case, with no internal heat generation we can have:
where k is the thermal conductivity of the body. Therefore, the heat flux (qx) through a body is expressed by Fourier’s Law:
where A is the area of the body perpendicular to the direction of heat flow. We can quantify the degree of insulation by recognizing that Equation (4) can be used to define thermal resistance (Rt) as the ratio of driving thermal potential to the corresponding transfer rate where:
such that ∂T is the overall temperature difference across the body, and L is the thickness of the ice and snow layers. For a multi-component system, we can derive an estimate of composite thermal resistance (Rc; Figure 2B), based on the combined impact of individual thermal resistance from snow (Rs) and ice (Ri) such that Rc = Rs + Ri. We determine Rc over the GrIS using mean accumulated snow and ice thickness over the Fall season from MyICELake based mean surface temperatures from MAR (< Ta >; computed from September to November) for each analysis year. Rearranging Equation (A2.6), we estimate the steady-state heat flux through the accumulated snow and ice layers (qss) and a reference flux (qr) which is derived with the same ∂Tas qss for a fixed 1 m thick ice layer.
Results
Wintertime Sub-Surface Lakes Over Jakobshavn Study Area
Annual changes in the duration of occurrence and properties of detected buried lakes in the Jakobshavn Isbrae study area are assessed for lakes that intersect 2009 to 2012 OIB flight lines (Figure 3). From a total of 67 mapped lakes, 42 (∼63%) did not contain water and 25 (∼37%) maintained buried water. Most lakes with buried water, 23 (92%) are beyond the southern margins of the Jakobshavn Isbrae. There are very few, 2 (8%) that extend beyond the northern margin. Even within the southern margin region, about half (∼47%) of all lakes examined (42 total) do not have buried water. Those supraglacial basins where over-winter buried water was detected south of the ice stream at lower elevations (< 1000 m a.s.l.) tend to maintain buried water for only one season in four between 2009 and 2012, while those at higher elevations can have over-winter buried water more frequently. Though the sample is limited, there is no spatial pattern for the presence of buried lakes that persist over multiple seasons unlike those that appear for a single season.
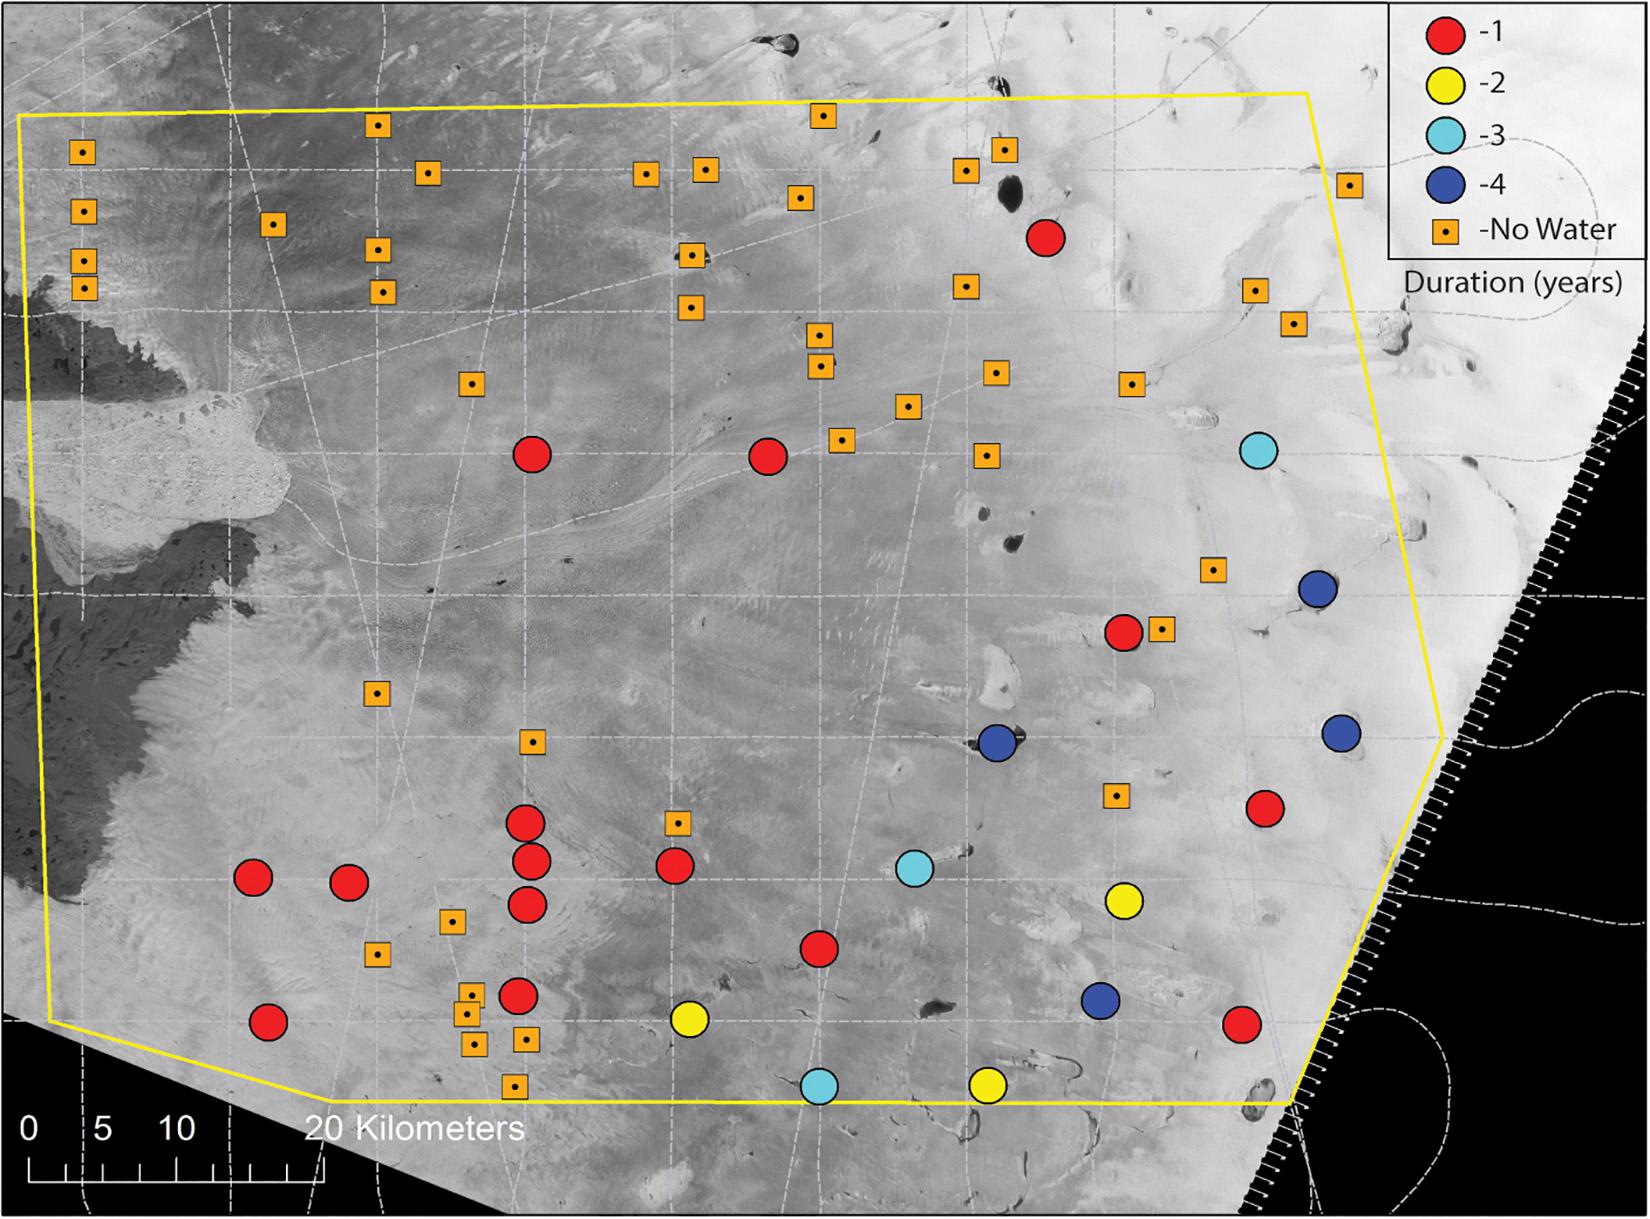
Figure 3. Spatial distribution of supraglacial lakes without buried winter-time stored water (yellow squares with black dot) and those with sub-surface water (colored circles) over the Jakobshavn Isbrae study area (yellow boundary). operational ice bridge (OIB) flight tracks are superimposed over a Landsat panchromatic gray-scale image. Color of circles indicates the number of seasons over the study period that a given lake contained sub-surface water throughout the winter.
The magnitude in mean area of lakes with and without buried water can be as large as ∼5 km2 with a range of ∼9 km2 (Figure 4). Lakes without buried water are relatively small (∼1 km2). Larger lakes tend to maintain buried water for more seasons, where the largest lakes (∼6–10 km2) recur for all four seasons in the study (Figure 4). The range in lake area can be large for both lakes with and without buried water (∼ 6 km2) with the exception of buried lakes that reoccur for two seasons (∼1 km2). The distribution in area of drained lakes exceeds 1 σ relative to the distribution for lakes with buried water which reoccur for ≥ 2 seasons (Figure 4).
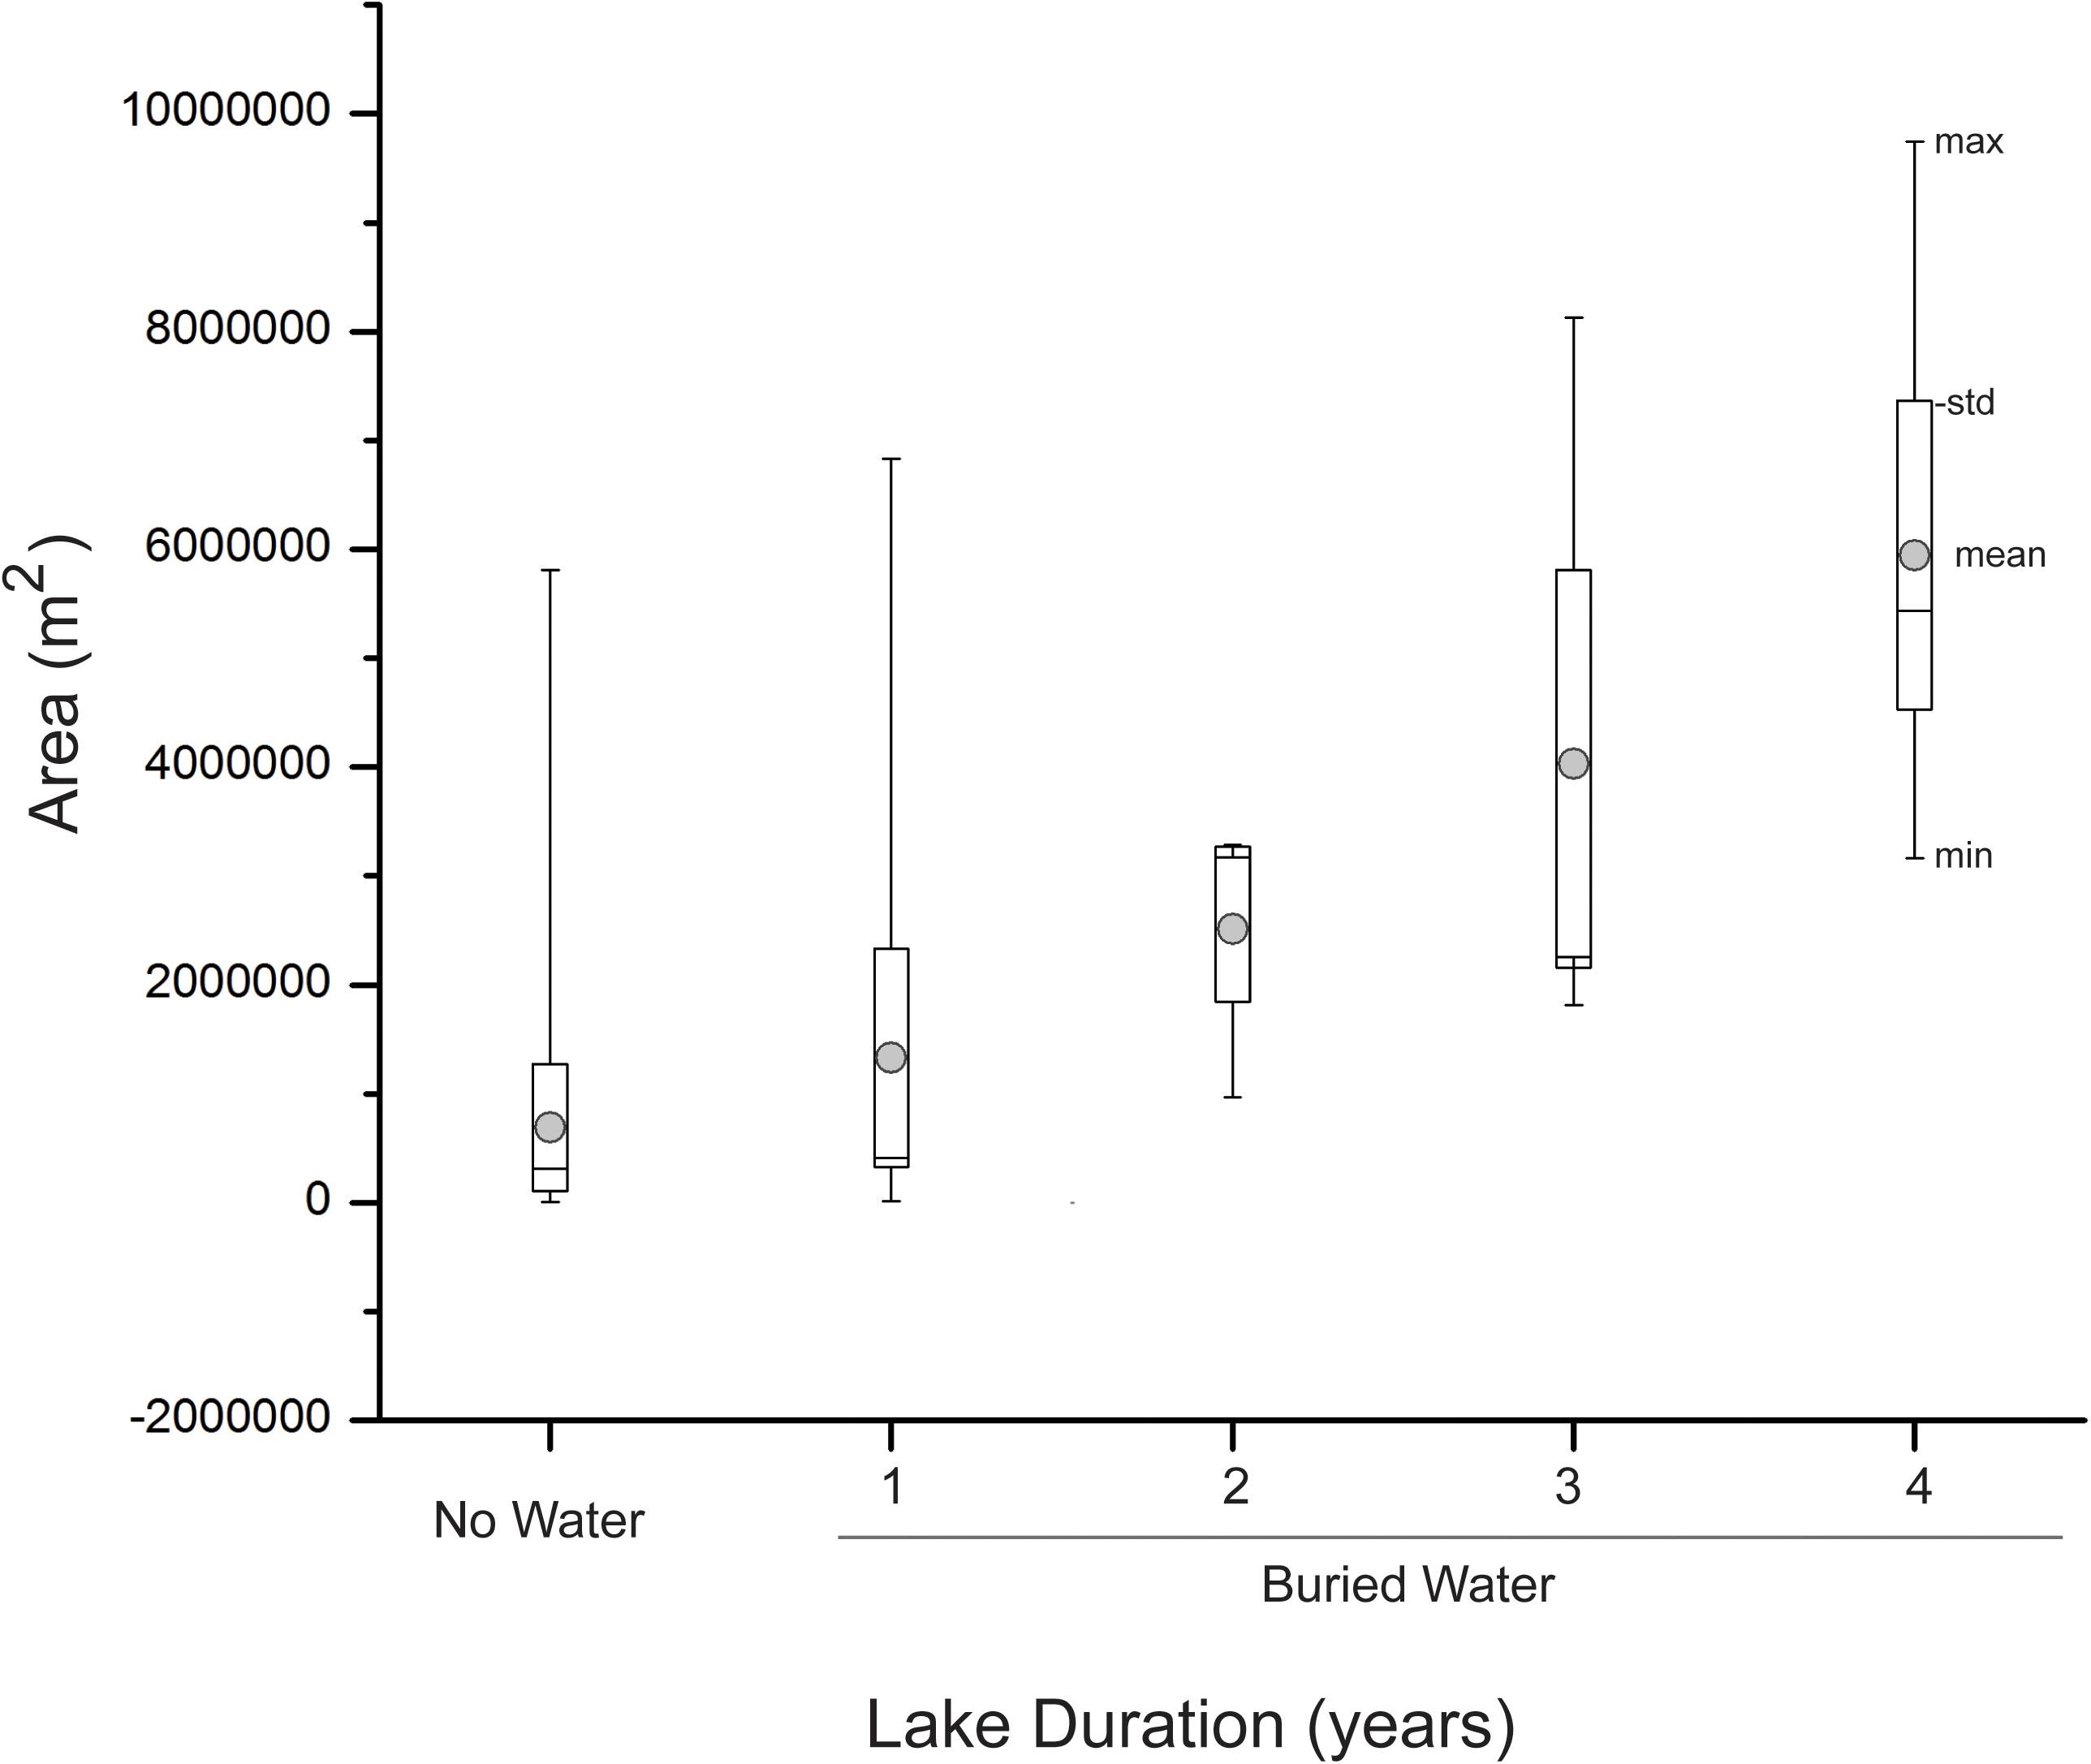
Figure 4. Box-plots showing the areal distribution of lakes with and without sub-surface water over the Jakobshavn Isbrae study area. Depicted are the mean, standard deviation, minimum and maximum of lake area and further decomposition of lakes with sub-surface water as a function of duration from 2009 to 2012.
While a sample of 4 years is short and thus increases the probability of misinterpretation, we examine the temporal variability in occurrence of buried water versus elevation from 2009 to 2012 (Figure 5). There is little variation in mean elevation for drained lakes over this analysis period. Changes in mean elevation for buried lakes vary from ∼1400 to 1100 m (a.s.l.). Buried lakes tend to occupy relatively high elevations (∼1300–1500 m a.s.l.) during the 2009 season and decrease to a mean elevation of ∼ 1100 m a.s.l. in 2010 with an increase in elevational dispersion. The 2011 and 2012 seasons show a return of buried lakes to mean elevations comparable to the 2009 season with similar magnitudes in dispersion. Temporal changes in elevation are evaluated concurrent with changes in the mean elevation of the snow line (blue line, Figure 5). The annual snow line shows the largest change in elevation between the 2009–2010 and 2011–2012 seasons of ∼150 m (a.s.l.). The change in the snow line elevation between 2010 and 2011 is < 50 m a.s.l. (Figure 5).
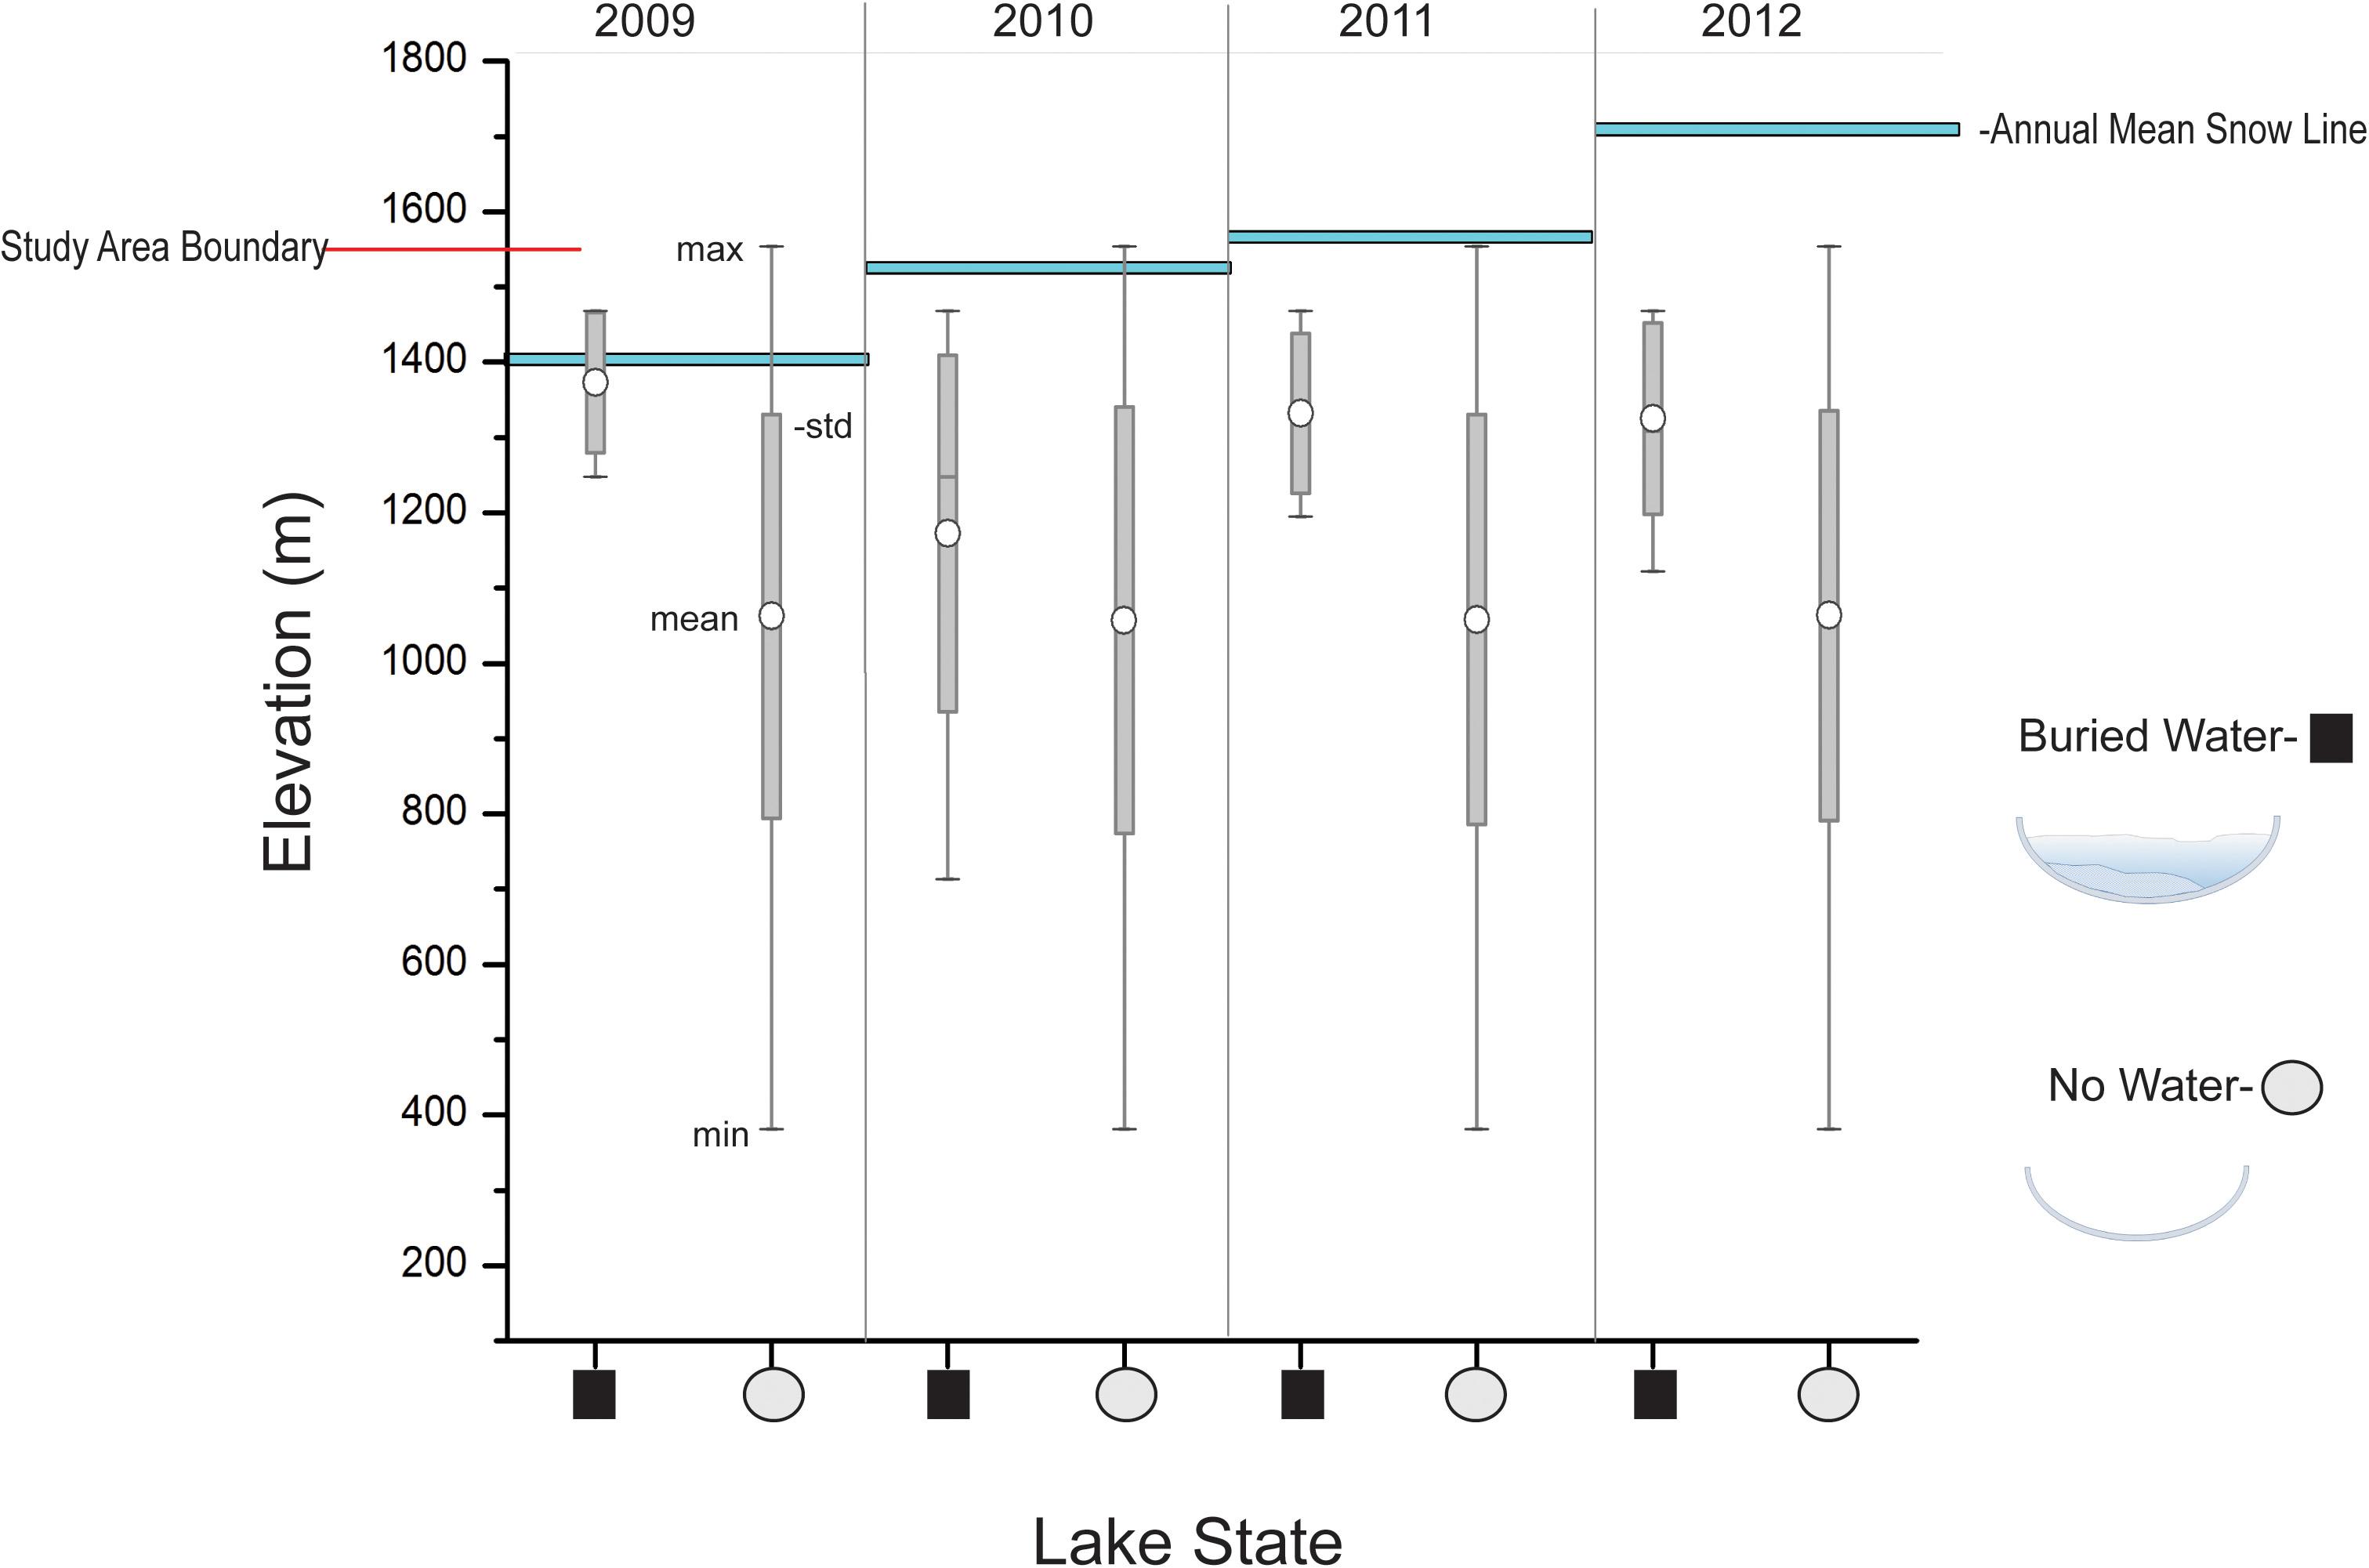
Figure 5. Box-plot of the elevational distribution of lakes over the Jakobshavn Isbrae study area with (black square) and without (gray circle) sub-surface water (m a.s.l.). Depicted are the mean, standard deviation, minimum and maximum in elevation in m a.s.l. over these hydrologic states from 2009 to 2012. The elevation of the study area boundary (red line) and the annual mean snow line elevation (blue bars) for each season are shown.
Maximum depths for each lake estimates over Jakobshavn Isbrae (Figure 6) can be as high as 2000 mm (2 m) for lakes without buried water and 1500 mm (1.5 m) for lakes with sub-surface water at ∼1550 mm (1.5 m). Mean of Ldepth(max) calculated over the study area are 500 mm (0.5 m) for lakes without buried water while those with sub-surface are ∼ 1000 mm (1 m; Figure 6). Mean of Ldepth(max) between lakes with and without sub-surface water are within 1 σ of each other. Lakes with and without buried water tend to have γLake < 0.5, indicating a geometry that substantially deviates from circularity. The difference in mean γLakebetween lakes with and without sub-surface water is small (< 0.1) with comparable σ and range values (Figure 6).
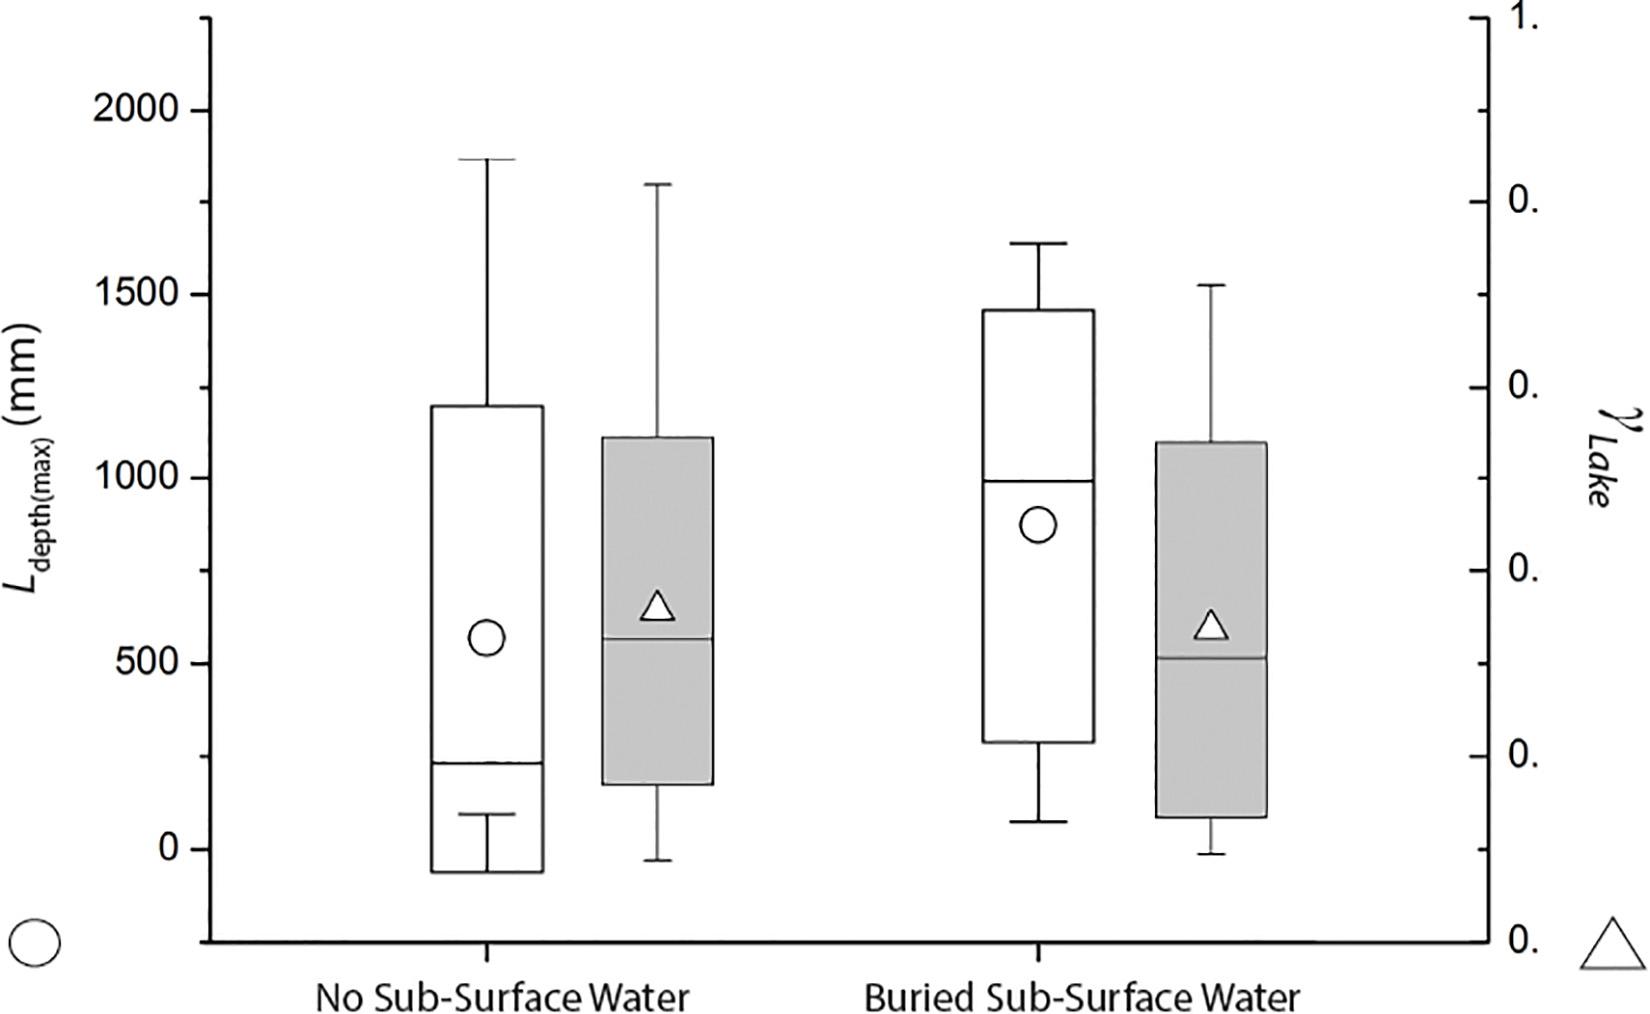
Figure 6. Box-plot showing mean, standard deviation, minimum and maximum of within basin maximum lake depth (left y-axis, white box) and lake morphology (right y-axis, shaded box) for lakes with and without buried water. White Circles: mean maximum lake depth (for lakes with and without buried water). White Triangles: mean of lake morphology metric (for lakes with and without buried water).
Winter-Time Sub-Surface Lakes Over Zachariae Isstrøm Study Area
Over Zachariae Isstrøm, flight tracks intersect 140 lakes (Figure 7). Most Zachariae Isstrøm lakes are not buried. Only 19 (∼14%) contained water through winter. Given Zachariae Isstrøm flight tracks are not repeatedly flown each season, we are unable to assess lake duration (Figure 7). Buried lakes are broadly distributed spatially with some moderate clustering upstream of the terminus of Zachariae Isstrøm along the main ice stream at elevations between ∼600 and 900 m a.s.l. and south of the main ice stream elevations between ∼300 and 600 m. Figure 8 shows the areal extent and elevation distribution of lakes with and without sub-surface water. Lakes without water have a mean area of ∼1 km2 while lakes with water are larger at ∼3.5 km2. The spread of lake sizes tends to smaller for lakes without water. The means of the two lake states are within 1 σ of each other with comparable maximum area of ∼9 km2. Outliers in both distributions favor large magnitudes in area. There is little difference between the mean elevation of lakes with and without sub-surface water (< 200 m a.s.l.; Figure 8). Lakes without sub-surface water tend to be distributed at slightly lower elevations with a large standard deviation. The elevation distribution of lakes without buried water tends to be symmetric, while lakes with sub-surface water are asymmetric indicating outliers at lower elevations (Figure 8).
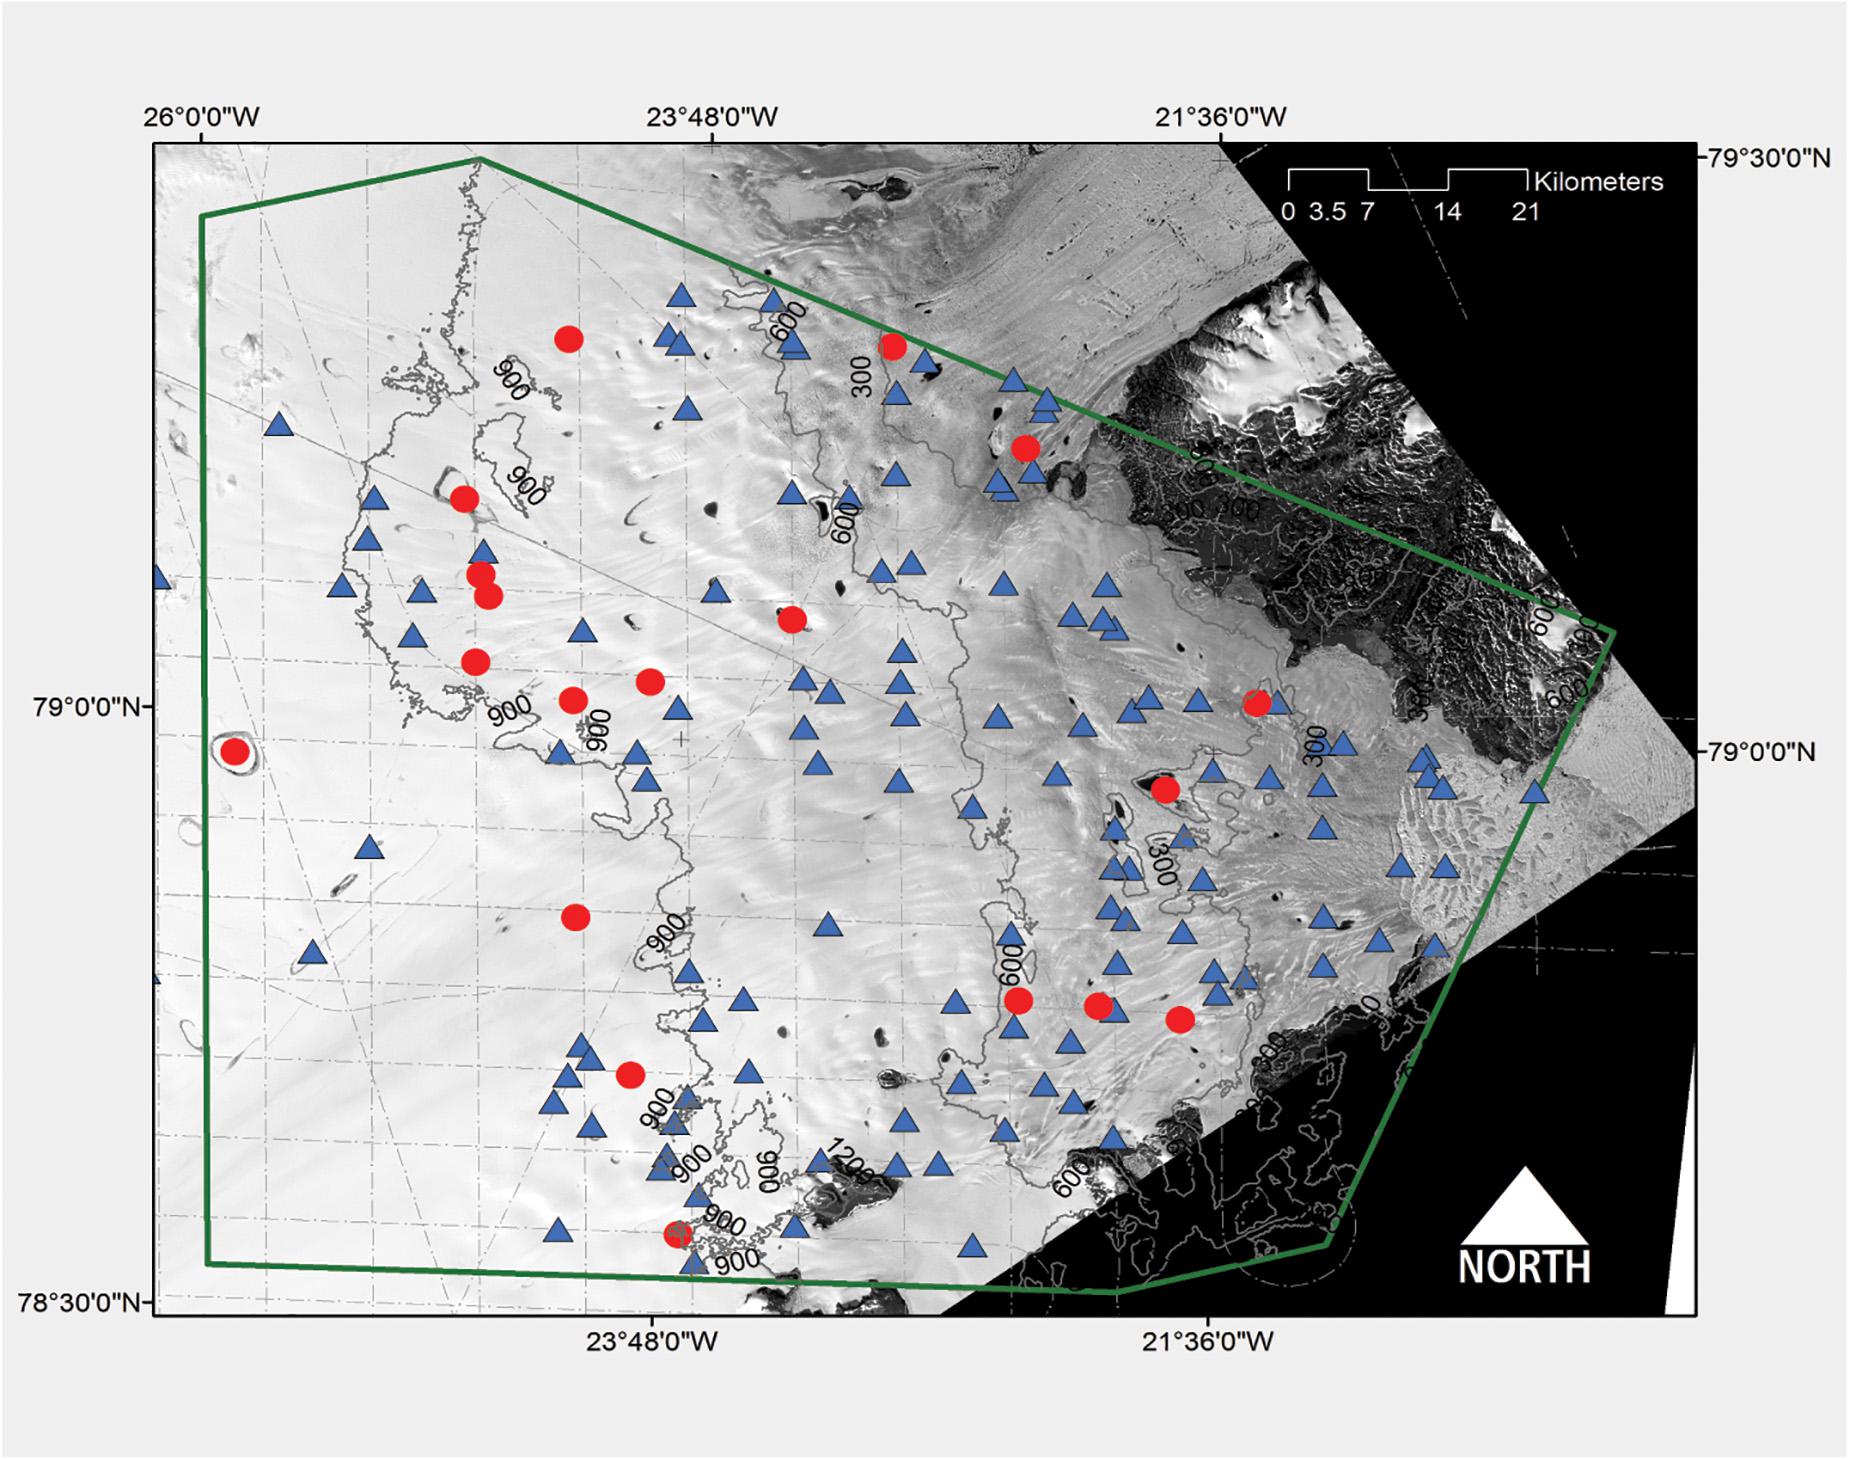
Figure 7. Spatial distribution of supraglacial lakes without buried winter-time stored water (blue triangles) and those with sub-surface water (red circles) Zachariae Isström study area (green boundary). operational ice bridge (OIB) flight tracks are superimposed over a Landsat panchromatic gray-scale image.
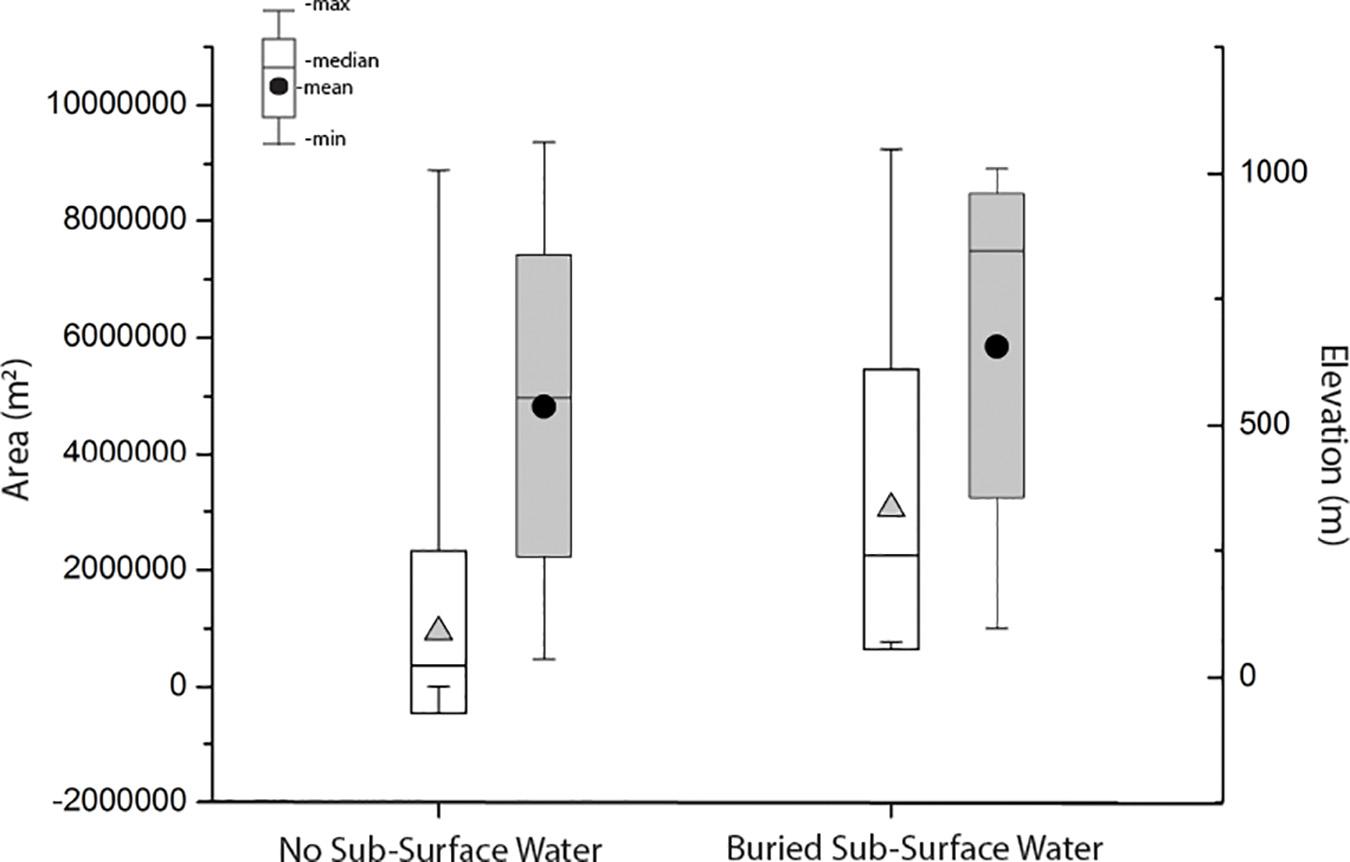
Figure 8. Box-plots showing the mean, standard deviation, minimum and maximum distribution of lake area (left y-axis, gray triangles) and elevation (right y-axis, black circles; m a.s.l.) with and without sub-surface water over the Zachariae Isstrøm study area from 2009 to 2012.
Buried Lakes and Supraglacial Channels
The presence of sub-surface water stored throughout the winter within a lake basin has implications for the evolution of the supraglacial hydrologic environment. Koenig et al. (2015) assert that winter sub-surface water can initiate supraglacial channelization. We examine this premise in this analysis over the Jakobshavn Isbrae study area. During the mid-summer for a given lake, a fraction of the total water storage capacity of the lake basin (Vbasin) would fill with melt water of some magnitude given by its volume (Vlake) such that Vlake < Vbasin (Figure 9). If the lake partially drains resulting in residual water left late into the fall season (September–November) and conditions are sufficient to rapidly accumulate snow and ice on the surface of the remaining water, then a buried lake will be formed. This buried water would remain liquid through the winter. As the following summer generates new melt and runoff, the mass budget of the lake basins results in Vlake > > Vbasin, which causing the basin storage capacity to be exceed and the surplus mass is partitioned into surface runoff as channelized flow (Figure 9). Though this is not an exhaust treatment of this process, we wanted to establish first-order relationships between large supraglacial channel network structure and buried lakes. Lakes are associated with all three types of channel network configurations (Connector, Tributary, and Terminal) with Connector and Tributary classes comprising the largest occurrences (Figure 10). Generally, buried lakes demonstrate associations with Connector and Tributary systems only. The more seasons lakes store sub-surface water the more they are exclusively associated with Connector systems (Figure 10). This becomes most apparent for lakes supporting sub-surface water greater than two seasons and suggests that buried water may indeed aid in the development of supraglacial channels.
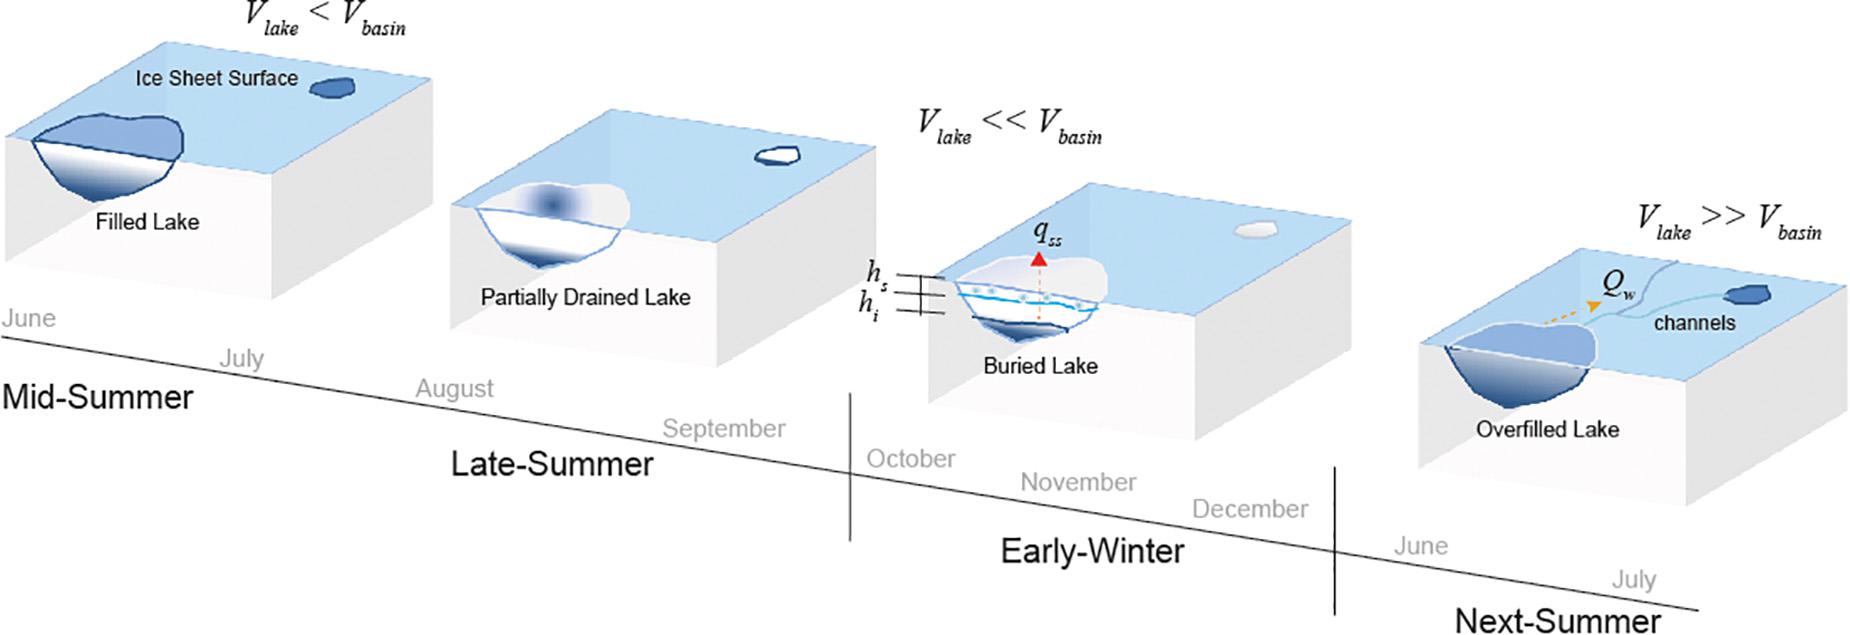
Figure 9. Idealized graphic depicting relationship between buried lakes and channelization. This is an idealized sequence to show how buried water could contribute to surface channelization and starts with a depiction of partially filled lake basins which may not be the case for any given lake in any particular season. During the mid-summer period the volume of melt water (Vlake) is less than the total basin storage capacity (Vbasin). Through late-summer lakes that do not drain completely maintain buried water and start accumulating ice and snow of thickness (hi) and (hs), respectively throughout the early-winter period. The additional stored sub-surface water remains insulated throughout the winter and provides a positive mass balance within the late basin at the outset of the following summer. As next-summer melt infiltrates the basin, the water holding capacity of the basin is exceeded (Vlake > > Vbasin), resulting in overflow and partitioning of runoff into supraglacial channels.
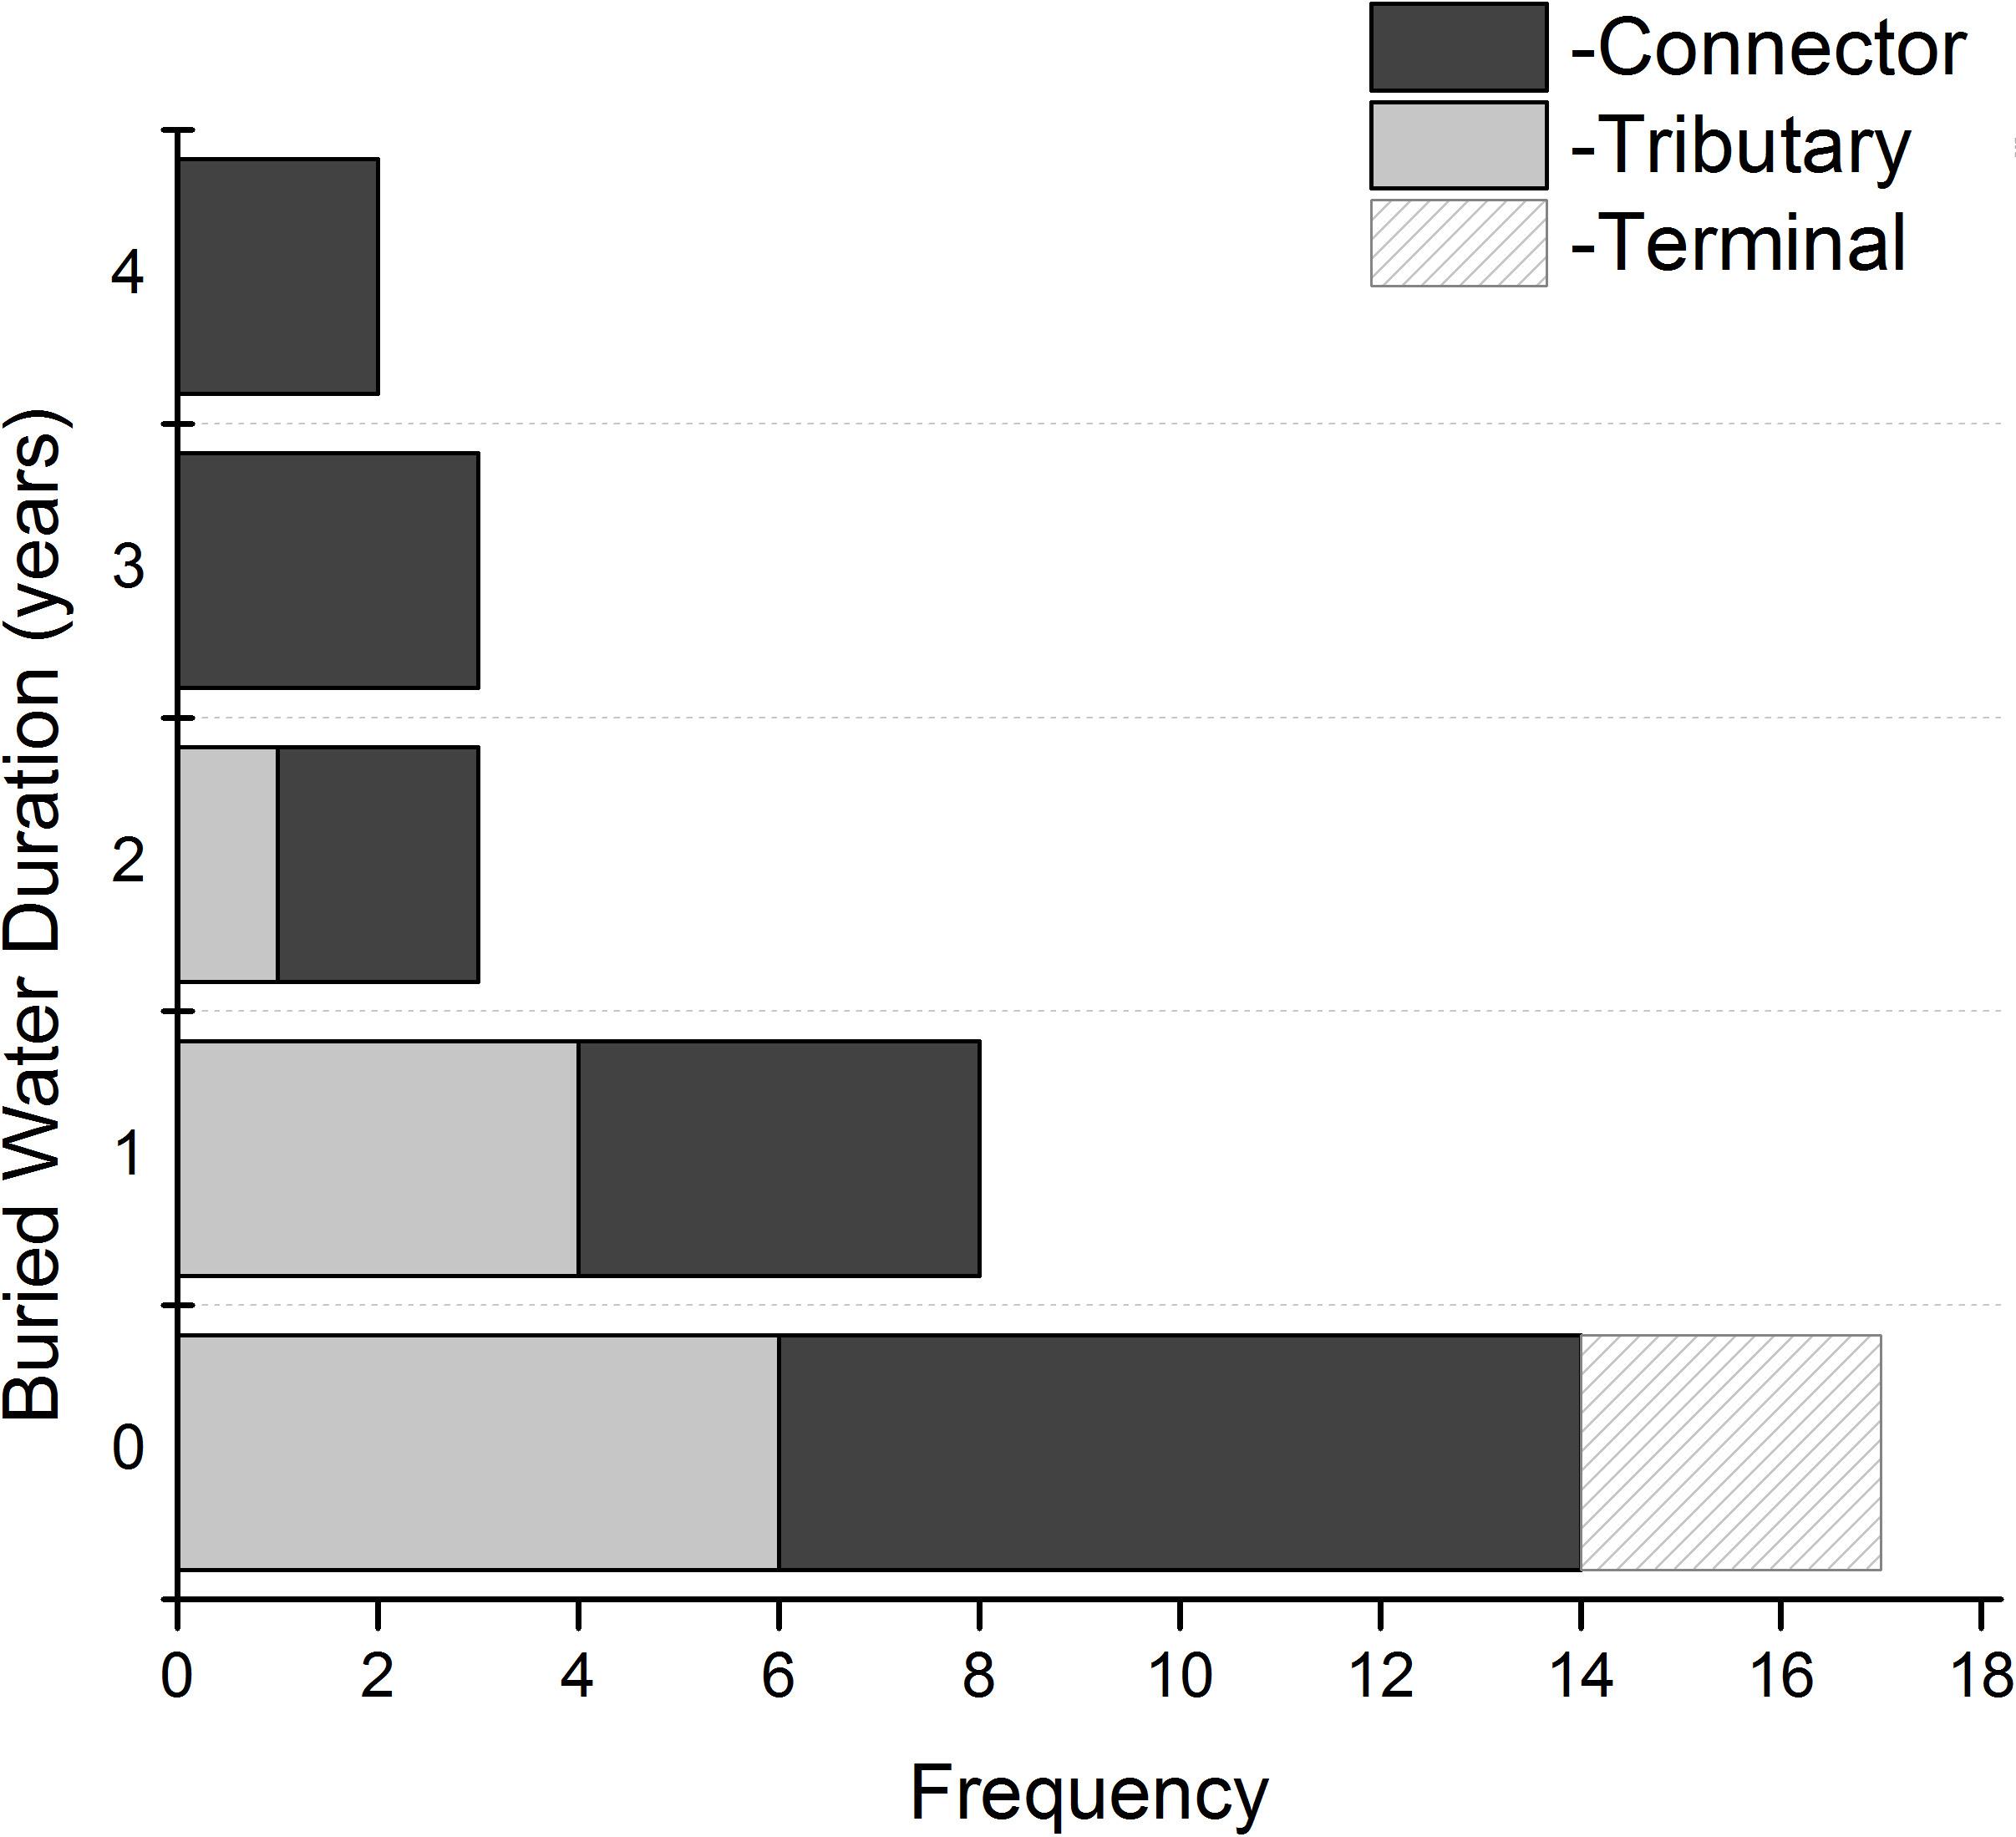
Figure 10. Histogram of the occurrence of lakes with and without buried water associated with supraglacial channels with Connector, Tributary, and Terminal channel network configurations. Channel networks were derived from features mapped from panchromatic Landsat Imagery such that Tributary channels are those that terminate into another channel or supraglacial lake. Connector channels are those that ‘connect’ supraglacial lakes. Terminal channels are those that terminate into lakes, crevasse fields, or moulins (Lampkin and VanderBerg, 2013).
Modeled Lake Snow and Ice Thickness Over the Greenland Ice Sheet
We evaluate the conditions necessary to support the preservation of sub-surface water throughout the winter using a numerical lake model. Our interest is to constrain the spatial and temporal conditions that insulate residual melt water through the winter. We employ MyICELake to model the potential accumulation of snow and ice on the surface of an idealized lake forced with meteorological data over the Greenland ice sheet. Afterward, we compute the amount of insulation possible given the degree of modeled snow and ice accumulation from the MyICELake model.
Spatial and Temporal Distribution in Insulation Potential
Using Equations (4) and (5) We derive a normalized flux (qss/qr) to quantify the magnitude and spatial distribution of insulation potential from 2009 to 2012 over the ice sheet (Figure 11A). This metric provides a quantitative means of evaluating the combined impact of both accumulated snow and ice thickness on insulating sub-surface water within supraglacial lake basins. The smaller qss the more modeled snow and ice over the idealized lake at a given location will insulate the lake water relative to a reference 1 m thick ice slab. Therefore, large values on (qss/qr) indicate less insulation potential due to thinner snow/ice lids. We compute a mean normalized insulation potential from 2009 to 2012 (Figure 11A). Generally, an idealized lake along the coast will tend to have less accumulated snow and ice resulting in less insulating capacity. Regional differences show central-west Greenland as having a comparable level of potential heat flux (∼20%) from an idealized lake as that of the reference and hence less insulation potential than south-eastern Greenland (∼2%). The south-eastern part of the ice sheet is spatially limited but maintains high insulation magnitude. The north-western regions of the ice sheet show moderate gradients in normalized heat flux unlike the central-west, with a ∼12% change over about 240 km. A large proportion of this region is dominated by high insulation potentials (< 3%). The north-east has areas with low insulation potential, where normalized heat fluxes can be as high as 30%, though substantial regions are spatially dominated by high potentials from the interior to the coast.
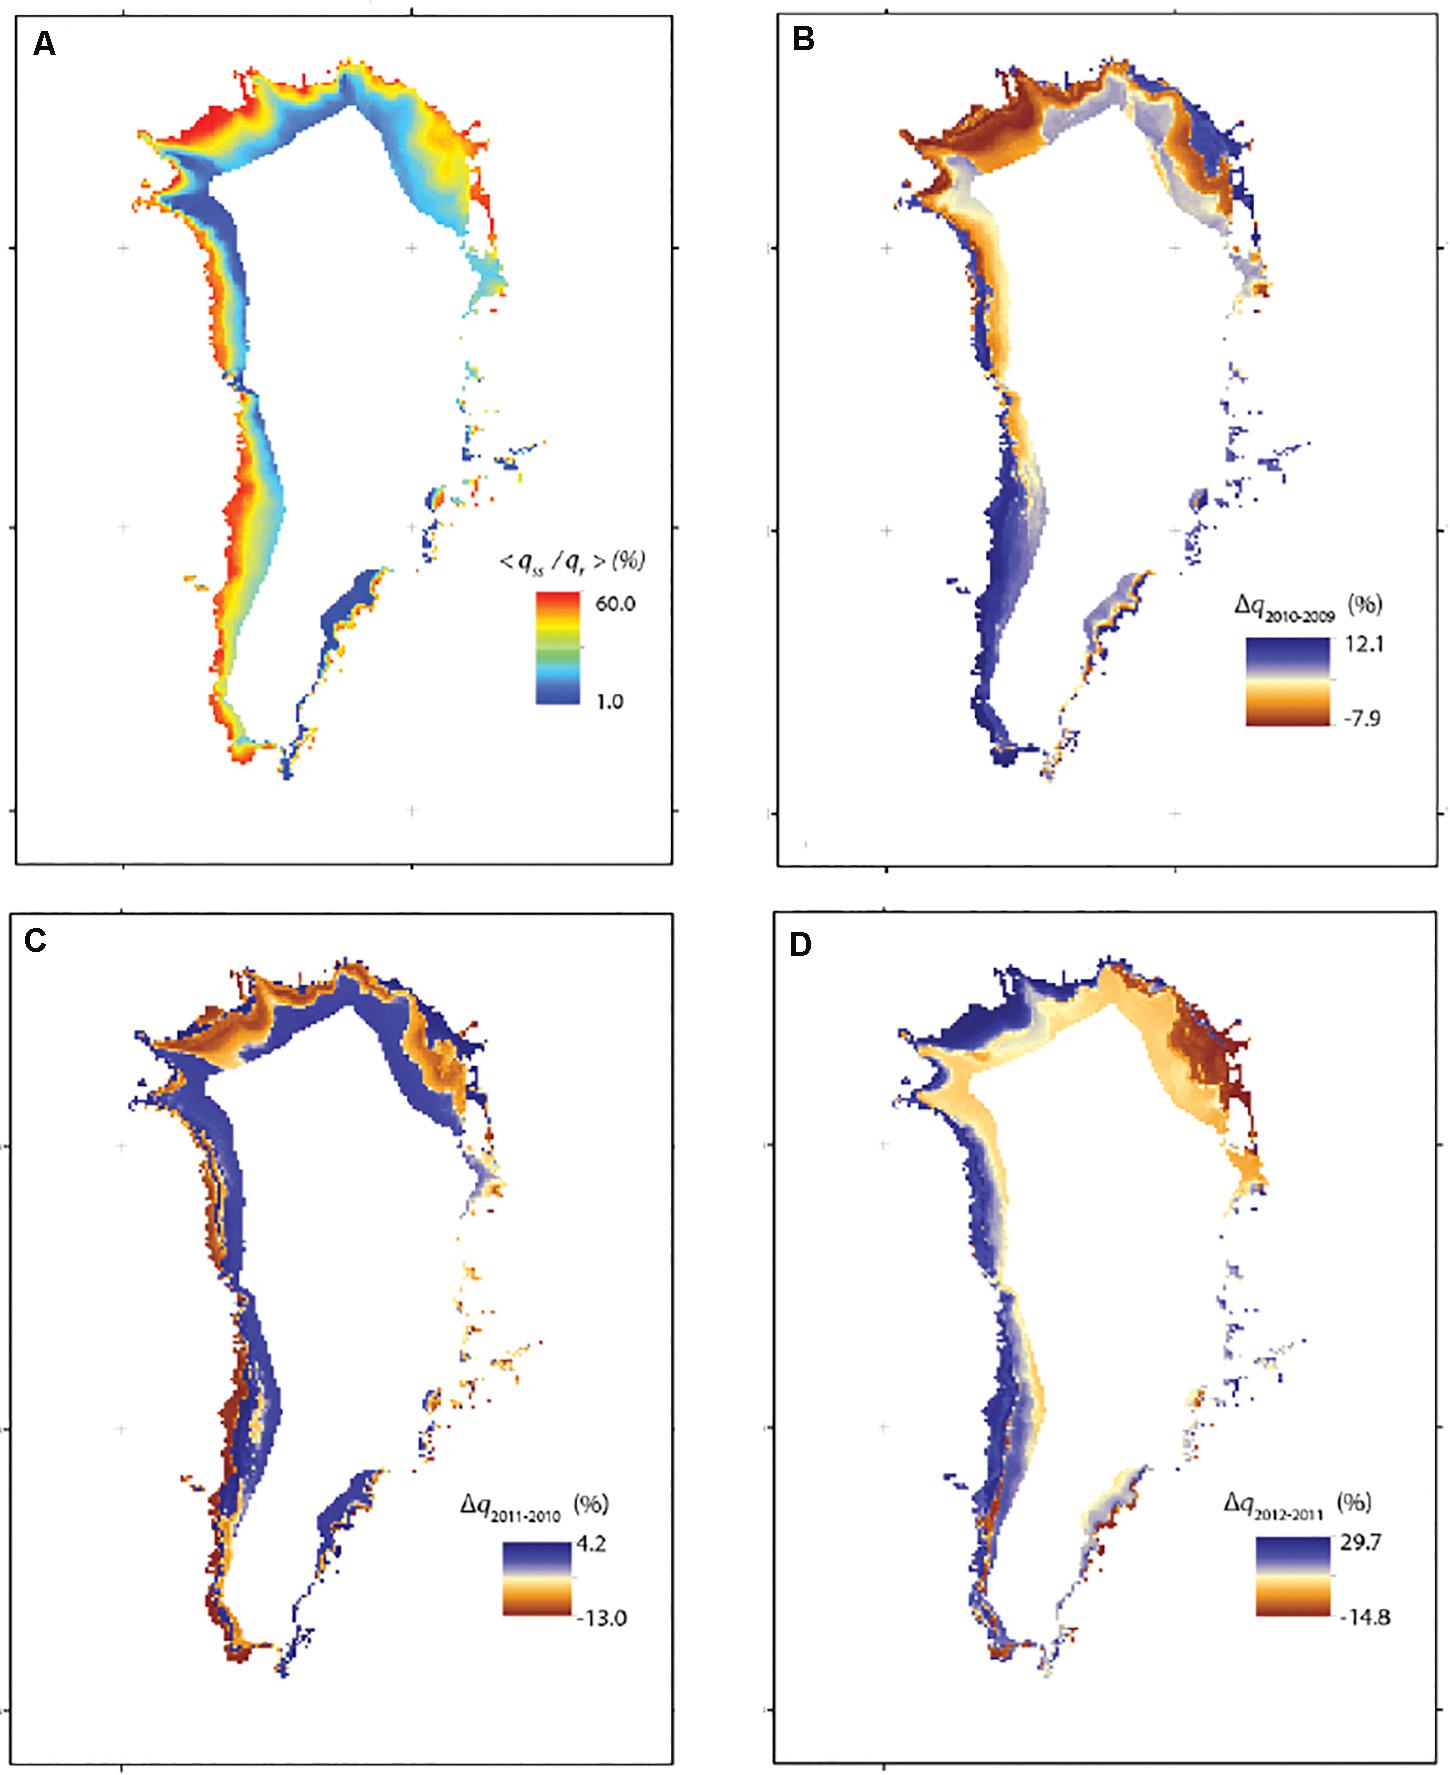
Figure 11. Spatial distribution in normalized insulation potential (qss/qr) over the Greenland ice sheet due to combined impact of modeled accumulated snow and ice on an idealized lake surface. Small values of (qss/qr) indicate greater degree of insulation potential. (A) Mean of normalized insulation potential estimated from 2009 to 2012. (B) Difference in normalized insulation potential between 2009 and 2010. (C) Difference in normalized insulation potential between 2010 and 2011. (D) Difference in normalized insulation potential between 2011 and 2012.
We evaluate the temporal changes in annual mean normalized heat fluxes between years () over the analysis period (Figures 11B–D). Generally, shows a positive difference at low elevation and negative at high elevations along the west coast of the ice sheet. The north-west, north-east and south-east regions are spatially dominated by negative differences (Figure 11B). These results indicate that in the west there is a transitional zone where low elevations are less suitable for insulating sub-surface melt water in 2010 than in 2009 and visa-versa at higher elevations. For the other regions 2009 was less suitable for insulating water than in 2010. These regional patterns for are generally similar to those between 2010 and 2009 except in the south-western part of Greenland where insulation potential are strongly negative at low elevations. This suggests that conditions in south-western Greenland are more suitable for the format of buried lakes during the 2011–2010 season relative to the 2010–2009 season. For , the relative magnitude is greater than the preceding seasonal differences. Additionally, in western Greenland are now largely positive except at the highest elevations, while the north-west demonstrates an elevation dependent transition zone (positive at low elevation and negative at high). North and south-eastern Greenland are dominated by negative differences.
Accumulation Onset of Ice and Snow Thickness
Evaluating φs and φice provide an assessment of the initiation of snow and ice thickness accumulation. The earlier the onset of accumulation the longer the duration of the accumulation season than the greater the insulation potentially achieved throughout the winter. The onset of snow accumulation before ice is not likely to directly contribute to the initiation of insulating the lake surface, but it can provide important information about the initiation of slush (snow ice) which enhances the ice thickening process (Ohata et al., 2017). For each season, we determine the mean, maximum, minimum, and standard deviation of φs and φice within 500 m a.s.l. elevation bands starting from 500 to 2000 m a.s.l. over Greenland (Figures 12A–D). During the 2009 season, mean φs decreases with elevation from ∼days 280 to 250 while changes in φice as a function of elevation is less pronounced with a difference of < 5 days (Figure 12A). For both snow and ice the distribution across elevation are within 1 σ. This is generally true for 2010 through 2012 (Figures 12B–D). Over most years, the 1000–1500 m elevation range tends to have the largest spread in onset dates than the other elevation bands. The earliest accumulation onset date across all years is ∼day 180 (late June) for snow and ∼day 210 (ice) within the 1000–1500 m a.s.l. elevation band. The 2010 season also demonstrates comparable early onset of snow accumulation but at a higher elevation range (1500–2000 m a.s.l.; Figure 12B). Though, mean φice across elevation bands is relatively stable over the 4 years, there is some variation in standard deviation and range mostly constrained between ∼days 250 and 280. The magnitude of ice onset is generally less than for snow over all 4 years.
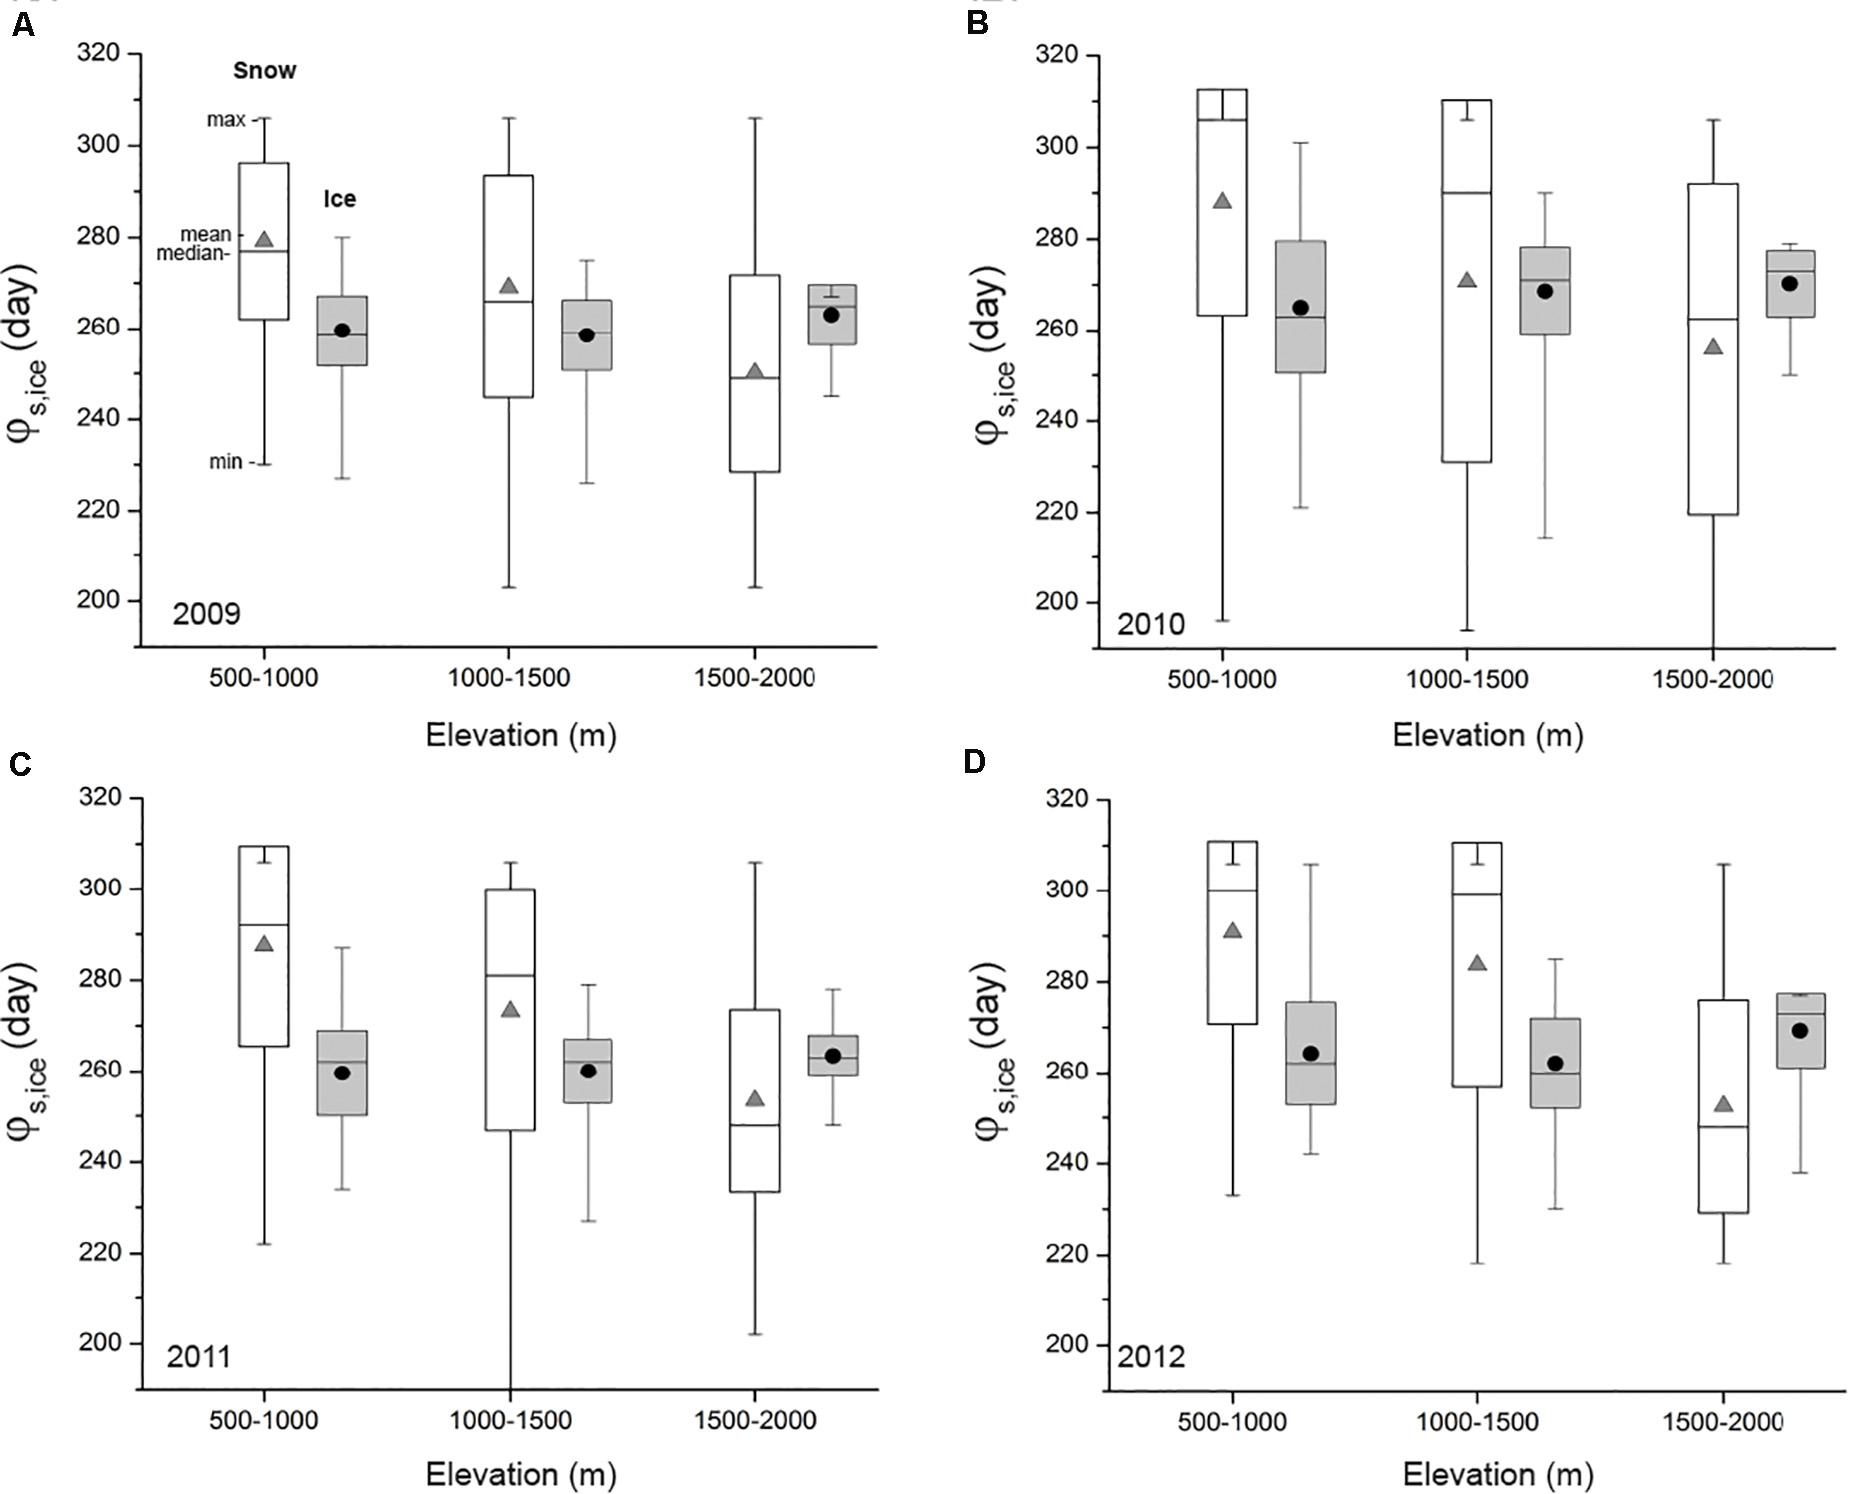
Figure 12. Box-plots showing the distribution in onset date of modeled snow (φs; white box) and ice accumulation (φice; gray box) within 500 m elevation band increments from 500 to 2000 m elevation range. Mean (gray triangles for snow and black circles for ice), median (horizontal line within box), and minimum and maximum (box whiskers), standard deviation (box edges) in accumulation onset dates for (A) 2009, (B) 2010, (C) 2011, and (D) 2012.
Annual Ice and Snow Thickness Rate of Accumulation
We derive an estimate of the rate of accumulation by computing the difference between successive daily snow and ice thickness () from the onset date to the end of the calendar year (Day 365) and compute the mean of these successive differences over this period (< Δhs,ice >). We assess the temporal and spatial distribution in rate of accumulation as a function of 500 m elevation bands for each season (Figure 13). Mean < Δhs,ice > for each season demonstrate comparable levels across elevation for each season (< 0.002 mm/day) with ice maintaining slightly higher values than snow (Figures 13A–D). There are differences in the distribution of rates both as a function of elevation and year. The 2009 year has a smaller standard deviation than other years within the 1500–2000 m elevation range for both snow and ice (Figure 13A). Within a given year, standard deviation varies between snow and ice as a function of elevation. < Δhs > across each season tends to have greater standard deviations at the 1000–1500 m a.s.l. elevation band, while deviations on < Δhice > are generally larger for between 500 and 1500 m a.s.l. elevation range. Overall, mean snow and ice accumulation rates are within 1 σ of each other though there are both elevational and seasonal variability in dispersion and outliers.
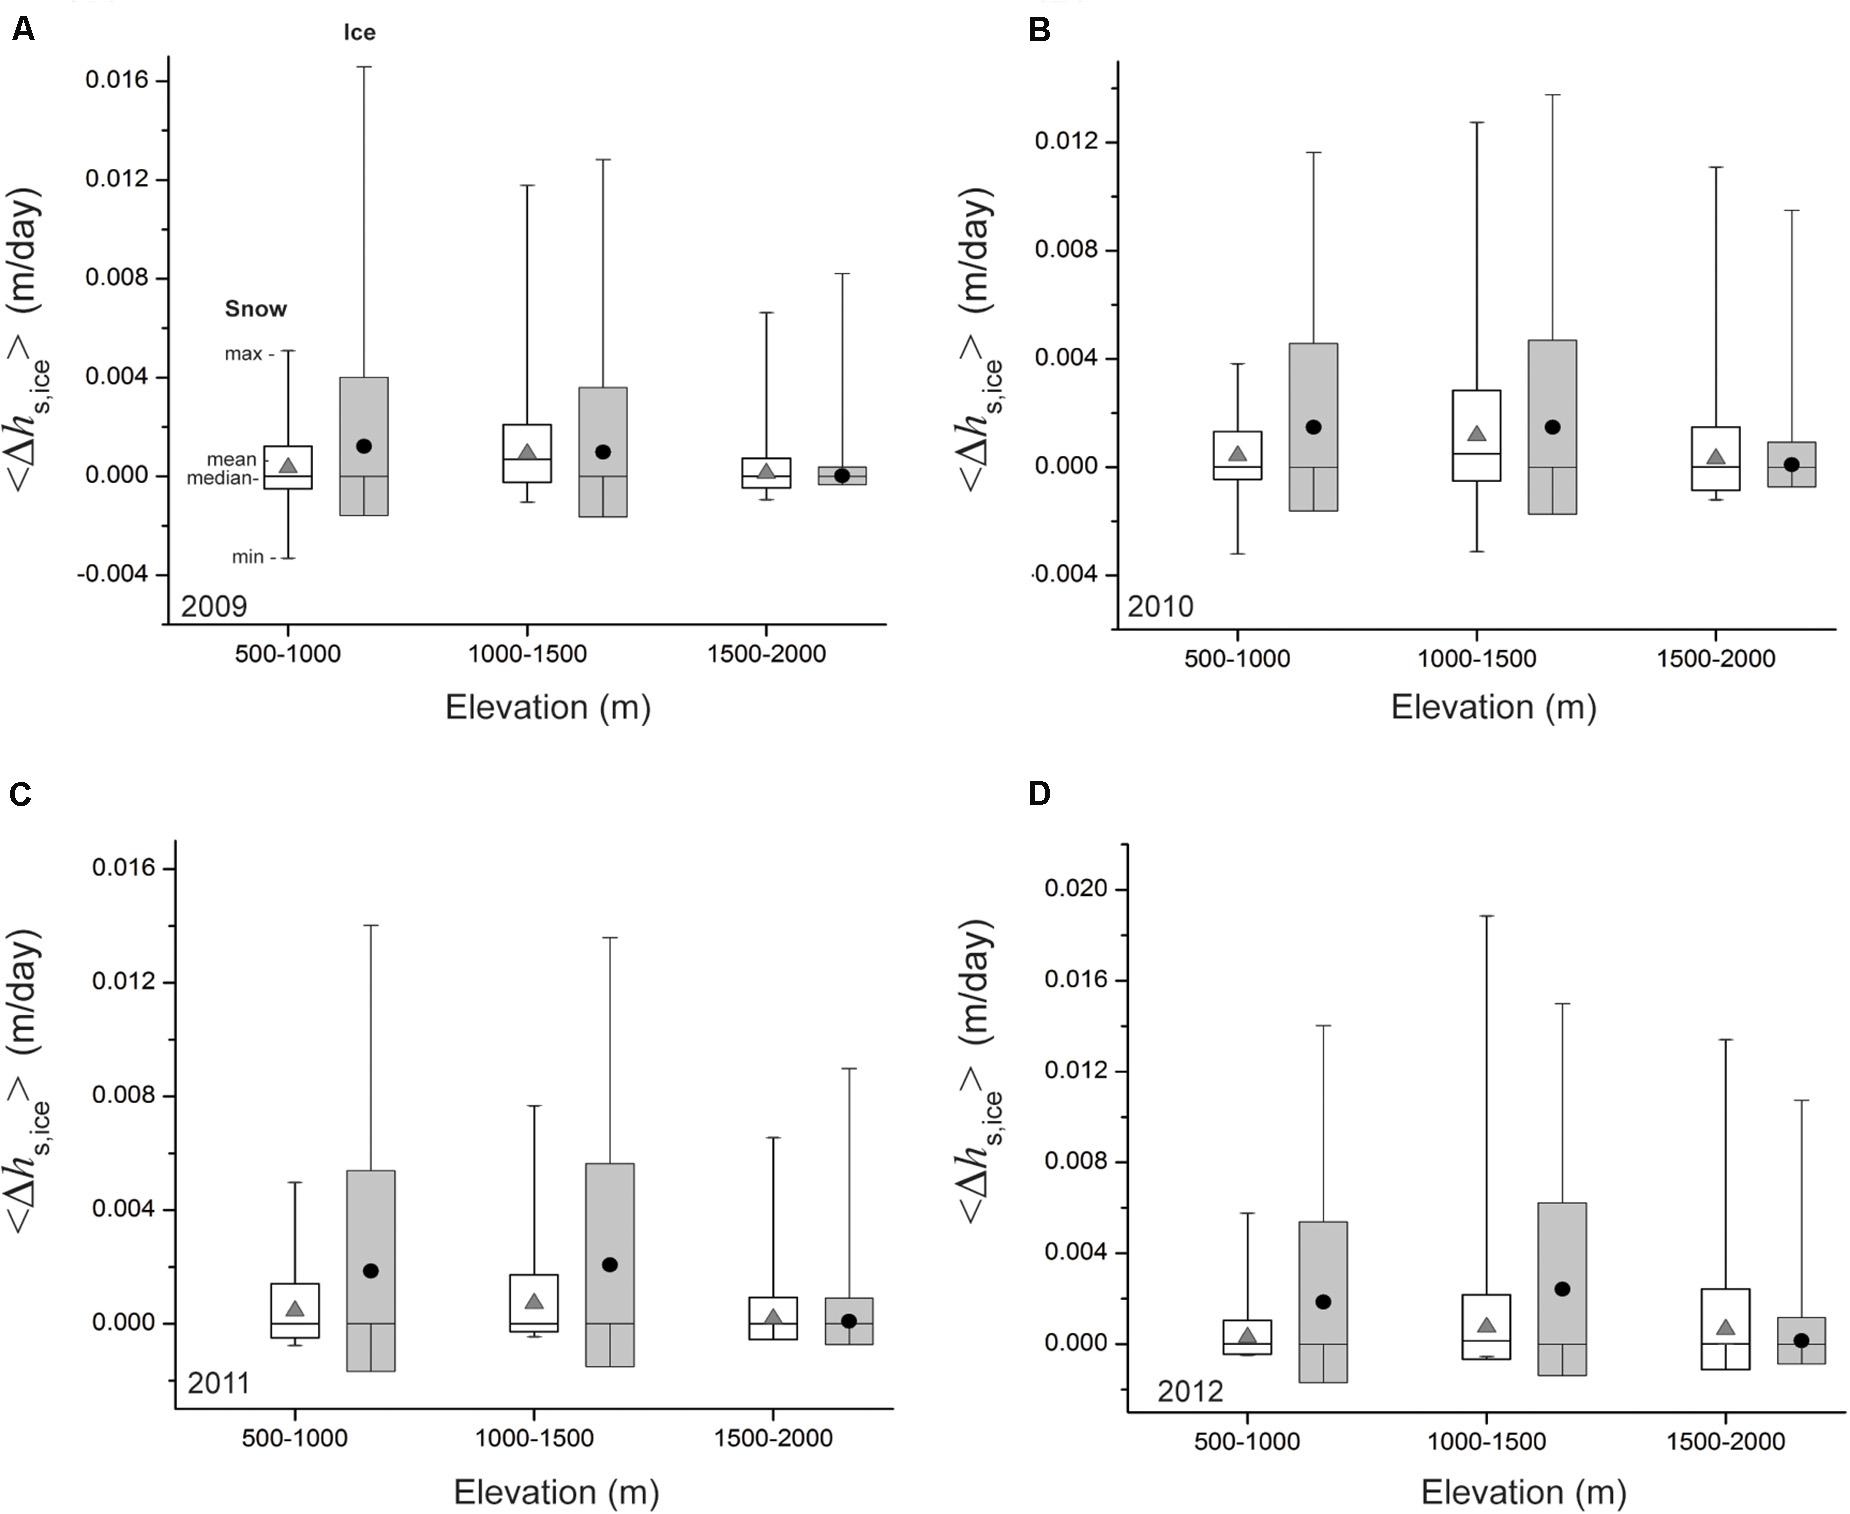
Figure 13. Box-plots showing the distribution in mean rate of change in snow (< Δhs >; white box) and ice (< Δhice >; gray box) accumulation within 500 m elevation band increments from 500 to 2000 m (a.s.l.) elevation range. Mean (gray triangles for snow and black circles for ice), median (horizontal line within box), and minimum and maximum (box whiskers), standard deviation (box edges) in mean rate of change in snow and ice accumulation for (A) 2009, (B) 2010, (C) 2011, and (D) 2012.
Discussion
Drainage and Buried Lakes
In this analysis, we do not explicitly focus on a priori factors that result in residual water present in lake basins at the end of summer. The likely condition conducive for the development of buried lakes is a result of slow draining lakes, which results in incomplete drainage throughout the summer (Selmes et al., 2013; Koenig et al., 2015; Miles et al., 2017). The proliferations of slow draining lakes are known to account for the majority of drainage type (Fitzpatrick et al., 2013; Selmes et al., 2013). Selmes et al. (2013) speculate that variability in fracture dynamics could be responsible for explaining the observation of lakes rapidly draining in one season and draining partially in a subsequent season. At higher elevations, the relative magnitude in fracture toughness required to drive a fracture to depth is likely less than the ice overburden pressure which closes fractures and limits the depth of propagation over thicker ice. The occurrence of buried lakes observed in this analysis is consistent with these conditions resulting in the prevalent distribution of sub-surface lakes at higher elevations. This corroborated by the assessment of Miles et al. (2017) who also observe the propensity for buried lakes to occur at higher elevations. Additional work is required to examine the degree to which fracture dynamics impact the formation of buried lakes.
Processes Driving Insulation of Sub-Surface Lake Water
Atmospheric conditions and lake morphometry (shape and bathymetry) can be important factors in controlling the rate and depth of lake ice formation. Ice can form rapidly on small, shallow lakes when wind speeds are low as opposed to large, deeper lakes (Bengtsson, 2012). Thermal inertia is greater for larger, deeper lakes which would result in the lack of complete freezing of the water column. In this analysis, lake size and depth are generally associated with seasonal occurrence of sub-surface water. Larger lakes tend to be slightly deeper resulting in the presence of buried water and greater occurrence of persistent sub-surface lakes over multiple seasons. Lake area and depth is an important factor in initiation and growth of ice necessary for preserving residual basin water.
Atmospheric conditions such as temperature, precipitation, and wind drive the rate of ice and snow accumulation and insulation magnitude. If snow accumulates rapidly after the onset of a thin layer of ice, the weight of the overlying ice can exceed buoyant forces resulting in the snow becoming partially saturated and refreeze. This refrozen slush can form superimposed ice (Kirillin et al., 2012). The presence of accumulated snow or superimposed ice can drastically reduce heat loss from the lake to the atmosphere due to their thermal conductivity and insulate the water at depth to further heat loss. These conditions are likely driving the formation of buried lakes in regions where gradients in elevation are large and the magnitude in insulation potential is substantial. Selmes et al. (2013) have assumed that freeze-through of slow draining lakes occurs when the temperature drops below a specific threshold which could be monitored from measurements of surface temperatures from satellites. Miles et al. (2017) argue that the use of temperature alone could result in erroneous estimates of freezing and demonstrate that the lapse rate is not the only factor controlling the onset of freezing of high elevation lakes.
Ice cover stability is greater for small lakes where ice is relatively static, whereas medium sized lakes are susceptible to wind-driven stress fracturing due to displacements (Kirillin et al., 2012). The distribution of supraglacial lake sizes in this analysis relative to terrestrial lakes can be considered small to medium size (< 10 km diameter; Leppäranta, 2015) and therefore are able to maintain stable ice covers. Our analysis demonstrates that relatively large lakes tend to sustain buried water for multiple years, but are spatially coincident with lakes that do not have buried water. Both lake types likely experience comparable conditions in wind stress, therefore it is probably not a driving factor in the stability of lake ice cover.
Once ice cover is established, solar insolation can penetrate the thin ice cover before it becomes optically thick to warm the upper water column near the ice bottom/water surface interface. This additional heating can drive vertical convection near the surface. If the lake is weakly stratified convective mixing can propagate to depth depending on the ice transmissivity and intensity of solar irradiance (Mironov et al., 2002; Kirillin et al., 2012). For supraglacial lakes with depths on the order of 2 m and less, the enhanced convention can both disrupt ice formation near the surface (Kirillin et al., 2012) and entrain heat deeper into water column. For example, the rate of mixed layer deepening for typical lake depths in this analysis of ∼1 m and solar forcing at the water surface through a column of ice of 10 W/m2 is ∼0.2 m/day (see Supplementary Appendix B for details). Given this, over 5 days the water column could be well mixed given the magnitude of solar input. If an accumulated ice remains optically thin over some extended period of time during the early winter and cloud-cover is minimal, than solar induced convection could be substantial. This is possible for all lakes surveyed in this analysis, which tend to have depths < 1.5 m.
Lastly, Thermodynamic conditions within the lake basin can be augmented by the impact of mass influx via channelized flow. Ice thickness can be affected by inflow as well as internal stratification. For small lakes, geostrophic currents could be induced by inflow promoting thinner ice cover due to frictional heat at the water/ice interface (Bengtsson, 1996; Leppäranta, 2015) resulting in less insulation of buried water. Additional work is required to explore sensitivity of ice formation due to mass influx, but it is likely not a significant factor as the magnitude of channelized discharge subsides as melt production and runoff decreases into the winter.
Sub-Surface Lake Water and Evolution of Supraglacial Hydrologic System
We posit that buried lakes could represent the pre-conditions for supraglacial channelization. It may not be a necessary condition if the size of the local catchment area over which runoff is routed to a particular lake is large relative to the basin storage capacity. In this regard, buried lakes would amplify the magnitude of discharge associated with lakes under these circumstances. It is possible that the increased channel network complexity associated with buried lakes in this analysis represents hydrologic systems that are configured to accommodate greater throughput due to basin overfilling. More importantly, buried lakes could activate channelization of lakes that would normally have sufficient storage capacity to accommodate all runoff associated with their local basin. This scenario would result in the conversion of stored water into channelized flow, which enhances the number of lakes involved in the transfer of supraglacial water into the ice sheet. Currently, ∼18% of the total volume of water captured by supraglacial lakes across the GrIS lies in the north-east and ∼23% in the south-west with projected expansion in these regions up to 35 and 17%, respectively by the end of the century with the north-east sector having the most rapid growth (Ignéczi et al., 2016). This is consistent with Leeson et al. (2015) assessment that supraglacial lakes have migrated inland by ∼ 60 km over the last 40 years in response to increased surface melting due to a 2.2°C temperature increase. This trend is expected to continue with projected inland expansion to extent near the ice divide by the end of the century (Leeson et al., 2015). Our results show considerable inter-annual variability in insulating potential enough to sustain sub-surface water through the winter, but generally the south-west and northern regions of the GrIS currently maintain the largest insulation potential. Under the Intergovernmental Panel on Climate Change Representative Concentration Pathways (R) 4.5 and 8.5, global mean temperature will increase by 1.8 and 3.7°C by 2100 (Moss et al., 2008). Warmer temperatures coupled with regional differences in available surface depressions would allow for additional capture of surface runoff in those regions with more depressions (north-east; Ignéczi et al., 2016). If current trends in insulating potential during the early winter continue than the formation of buried lakes in these regions could be an important phase in transitioning infiltration in the supraglacial hydrology from basin-dominated (hydrofracture) to channelized-dominated infiltration.
Limitations and Directions for Future Work
Our treatment of morphometric properties of lakes was rudimentary in this analysis. We did not account explicitly for the impact of lake bathymetry on horizontal heterogeneity in lake surface ice formation and thermodynamics. Cooling of water is faster in the near-shore zones where the lake is shallow, T > Tm. This process results in the production of near-shore cold, dense water, which starts to sink toward the lake bottom inducing horizontal currents where central basin water closes the loop delaying the onset of freeze-up in the central part of the basin (Leppäranta, 2015). For supraglacial lakes surveyed in this analysis, we did not assess the bathymetry but speculate that basins whose area is dominated by shallow regions will experience more spatially uniform freeze-up relative to basins dominated by deeper zones. Presuming that asymmetry in the planar dimensions of lakes is related to bathymetric geometry, we found that lake shape was not a factor in the presence of sub-surface water or seasonal duration.
Additionally, our model assumes there are no horizontal gradients in water temperatures within each layer. This assumption is not realistic given field measurements of temperatures from a lake (Lake Disco) in west-central Greenland (Supplementary Appendix S3 and Supplementary Appendix A). Mean temperatures range from ∼−0.2°C near the lake edge to ∼0.5°C in the center (over a 9 m change in depth). This 0.3°C difference across the lake is sufficient to impact the spatial distribution in the onset and thickness of lake ice accumulation and insulation. Horizontal temperature gradients would result in heterogeneous ice thickness across the lake surface and would impact the infiltration of heat into the water column. Shallow water near the edges tend be warmer and would likely maintain thinner ice. This would allow for more infiltration of solar radiation and heat from the atmosphere through the ice cover and drive horizontal transport of heat within the lake basin. Our model is currently incapable of representing this level of complexity. This currently prevents assessing the dynamics of lake ice formation and decay within basins dominated by shallow water. These basins likely may not stay well insulated throughout the winter and experience early onset of ice melting and disintegration in the summer.
The lack of sufficient high temporal or spatial sampling resolution of lakes over both study areas is a limitation in this effort. Our analysis was limited to lakes over which OIB flights intersected. Inconsistencies in temporal sampling has resulted in limitations in the analysis to appropriately observe temporal occurrence over Zachariae Isstrøm and spatial constraints on the distance between flight tracks over Jakobshavn Isbrae impact the number of lakes that can be surveyed. The overall samples are likely too few to adequately assess the probability of sub-surface water states over lakes that did not have OIB flight track intersection. This is in contrast to the more extensive sample derived by Miles et al. (2017). Though they have assessed the presence of buried water from a larger sample of lakes, the frequency of the Sentinel-1 dataset prevents detection of buried water covered with relatively thicker layers of snow and ice to those assessed in this study. Our estimates are likely more accurate but less extensive. There is a need for a technique that leverages the capabilities of the OIB radar system to detect the presence of buried water over a broader sample of lakes across the ablation zone of Greenland.
Additional work is required to fully understand the relationship between supraglacial basin storage capacity and partitioning of water to channelization. This effort would require an assessment of the potential total basin storage capacity based on an assessment of all supraglacial surface depressions over several seasons. We only assess basin depths for a single season in this analysis and did not capture the variability in potential storage over time. Access to a basin depression data set would allow for evaluating basin bathymetry, which may be a critical boundary condition in regulating lake thermodynamics and how those dynamics impact propensity for winter-time storage. With the emergence of inland migration of lakes, future work should focus on the prevalence of buried lakes within the ablation–percolation transition zone throughout the Greenland ice sheet. Lastly, a comprehensive assessment of the temporal evolution in supraglacial channel configuration associated with lakes that have demonstrated buried water would be important.
Summary
We have evaluated the spatial and temporal variability in buried lakes based on shallow radar data. Our focus was on the occurrence, persistence, and variability of buried lakes within two study sites that represent different meteorological and glaciological conditions. We evaluated the relationship between the occurrence of buried lakes, elevation, area, and supraglacial channel networks. We find that most buried lakes tend to occur at higher elevations through the ablation zone and can persist for several seasons. These lakes also are large in area relative to refrozen lakes. On average, lake area is correlated with the number of seasons sub-surface water persists Buried lakes tend to be associated with increasingly connected supraglacial channel networks. These findings have led us to propose a novel hypothesis that the pre-summer positive mass balance in buried lakes enhances the possibility for channelized flow from these lakes in the following summer. We consider this an important a priori (but not exclusively) condition for the formation of large supraglacial outflow channels.
We also apply a numerical lake evolution model to provide a first-order assessment of the amount of accumulated snow and ice over an idealized lake across the Greenland ice sheet. This provides insights into potential modes supraglacial hydrologic systems may occupy. Using modeled snow and ice thickness information, we derive an estimate of the insulation potential due to combined effects of lake surface snow and ice across the ice sheet. Model results indicate regional differences in insulation potential as well as substantial inter-annual variability. Over the analysis period, west Greenland generally maintains the lowest insulation potential relative to other regions though our Jakobshavn Basin study area shows the largest percentage of buried lakes. With the possibility of inland migration of supraglacial lakes, buried lakes could drive the evolution of upper ablation/percolation zone hydrologic systems, particularly in the north-east, south-east, and wet snow/percolation zone of west-central/southern. Our results show these regions have sufficient insulation capacity through the winter to convert stored water into infiltration via channelized flow. This kind of hydrologic system would efficiently transfer melt water in lakes to crevasses/fractures and drive the formation of moulins farther inland. This could substantially enhance the delivery of surface melt water to the bed in regions of where the subglacial hydrologic system could be readily pressurized driving enhanced ice dynamic response.
Data Availability Statement
Publicly available datasets were analyzed in this study. This data can be found here: http://edcsns17.cr.usgs.gov/EarthExplorer/.
Author Contributions
All authors contributed to the article and approved the submitted version.
Funding
This work was supported under National Aeronautics and Space Administration grants NNX14AO68G (DL and CJ) and NNX15AC62G (LK).
Conflict of Interest
The authors declare that the research was conducted in the absence of any commercial or financial relationships that could be construed as a potential conflict of interest.
The reviewer SB declared a past co-authorship with one of the authors JB to the handling editor.
Supplementary Material
The Supplementary Material for this article can be found online at: https://www.frontiersin.org/articles/10.3389/feart.2020.00370/full#supplementary-material
APPENDIX S1 | Monthly histograms showing the total number of Landsat scenes used in analysis over Jakobshavn Isbrae and Zachariae Isstrøom study areas for each year.
APPENDIX S2 | Box-plots comparing modeled snow and ice thickness using MyICELake and measured snow and ice thickness derived from NASA operational ice bridge (OIB) shallow radar over the Jakobshavn Study Area from 2009 to 2012. Box show mean (black circle), median (line), standard deviation (box edges), minimum and maximum (whiskers) in radar derived snow and ice thickness for all lakes where OIB flights intersected lakes across the Jakobshavn Isbrae study area. These statistics are shown for the minimum, maximum, and mean of OIB radar retrieved snow and ice thickness.
APPENDIX S3 | (A) Lake Disco shown in Landsat ETM+, panchromatic image, and superimposed transect location (A–A’) over which (B) mean temperature through water column and lake depth were acquired during a 2007 field campaign.
Footnotes
References
Alley, R. B., Dupont, T. K., Parizek, B. R., and Anandakrishnan, S. (2005). Access of surface melt water to bed of subfreezing glaciers: preliminary insights. Ann. Glaciol. 40, 8–14. doi: 10.3189/172756405781813483
Banwell, A. F., Caballero, M., Arnold, N. S., Glasser, N. F., Cathles, L. M., and MacAyeal, D. R. (2014). Supraglacial lakes on the Larsen B ice shelf, Antarctica, and at Paakitsoq, West Greenland: a comparative study. Ann. Glaciol. 55, 1–8. doi: 10.3189/2014AoG66A049
Bengtsson, L. (1996). Mixing in ice-covered lakes. Hydrobiologia 322, 91–97. doi: 10.1007/BF00031811
Bengtsson, L. (2012). “Ice covered lakes,” in Encyclopedia of Lakes and Reservoirs, eds L. Bengtsson, R. W. Herschy, and R. W. Fairbridge (Cham: Springer), 357–360.
Box, J. E., and Ski, K. (2007). Remote sounding of Greenland supraglacial melt lakes: implications for subglacial hydraulics. J. Glaciol. 53, 257–265. doi: 10.3189/172756507782202883
Bryzgis, G., and Box, J. E. (2005). West Greenland Ice Sheet Melt Lake Observations and Modeling, Eos Trans. Washington, DC: AGU.
Chu, W., Creyts, T. T., and Bell, R. E. (2016). Rerouting of subglacial water flow between neighboring glaciers in West Greenland. J. Geophys. Res. 121, 925–938. doi: 10.1002/2015JF003705
Colgan, W., Steffen, K., McLamb, W. S., Abdalati, W., Rajaram, H., Motyka, R., et al. (2011). An increase in crevasse extent, West Greenland: hydrologic implications. Geophys. Res. Lett. 38:L18502. doi: 10.1029/2011GL048491
Das, S. B., Joughin, I., Behn, M. D., Howat, I. M., King, M. A., Lizarralde, D., et al. (2008). Fracture propagation to the base of the Greenland Ice Sheet during supraglacial lake drainage. Science 320, 778–781. doi: 10.1126/science.1153360
Dee, D. P., Uppala, S. M., Simmons, A. J., Berrisford, P., Poli, P., Kobayashi, S., et al. (2011). The ERA interim reanalysis: configuration and performance of the data assimilation system. Q. J. R. Meteorol. Soc. 137, 553–597. doi: 10.1002/qj.828
Dibike, Y., Prowse, T., Bonsal, B., Rham, L. D., and Saloranta, T. (2012). Simulation of north american lake-ice cover characteristics under contemporary and future climate conditions. Int. J. Climatol. 32, 695–709. doi: 10.1002/joc.2300
Dow, C. F., Kulesa, B., Rutt, I. C., Tsai, V. C., Pimentel, S., Doyle, S. H., et al. (2015). Modeling of subglacial hydrological development following rapid supraglacial lake drainage. J. Geophys. Res. 120, 1127–1147. doi: 10.1002/2014JF003333
Doyle, S. H., Hubbard, A., Fitzpatrick, A. A. W., van As, D., Mikkelsen, A. B., Pettersson, R., et al. (2014). Persistent flow acceleration within the interior of the Greenland ice sheet. Geophys. Res. Lett. 41, 899–905. doi: 10.1002/2013GL058933
Doyle, S. H., Hubbard, A. L., Dow, C. F., Jones, G. A., Fitzpatrick, A., Gusmeroli, A., et al. (2013). Ice tectonic deformation during the rapid in situ drainage of a supraglacial lake on the Greenland ice sheet. Cryosphere 7, 129–140. doi: 10.5194/tc-7-129-2013
Enderlin, E. M., Howat, I. M., Jeong, S., Noh, M. J., van Angelen, J. H., and van den Broeke, M. R. (2014). An improved mass budget for the Greenland ice sheet. Geophys. Res. Lett. 41, 866–872. doi: 10.1002/2013GL059010
Fettweis, X., Franco, B., Tedesco, M., Van Angelen, J. H., Lenaerts, J. T. M., Van Den Broeke, M. R., et al. (2013). Estimating the Greenland Ice Sheet surface mass balance contribution to future sea level rise using the regional atmospheric climate model MAR. Cryosphere 7, 469–489. doi: 10.5194/tc-7-469-2013
Fitzpatrick, A., Hubbard, A. L., Joughin, I., Quincey, D., van As, D., Mikkelsen, A., et al. (2013). Ice flow dynamics and surface meltwater flux at a land terminating sector of the Greenland Ice Sheet. J. Glaciol. 59, 687–696. doi: 10.3189/2013JoG12J143
Ford, D. E., and Stefan, H. G. (1980). Thermal predictions using integral energy model. J. Hydraulic Division 106, 39–55.
Howat, I. M., de la Peña, S., van Angelen, J. H., Lenaerts, J. T. M., and van den Broeke, M. R. (2013). Expansion of meltwater lakes on the Greenland Ice Sheet. Cryosphere 7, 201–204. doi: 10.5194/tc-7-201-2013
Howat, I. M., Negrete, A., and Smith, B. E. (2015). MEaSUREs Greenland Ice Sheet Mapping Project (GIMP) Digital Elevation Model. Boulder: NASA National Snow and Ice Data Center Distributed Active Archive Center.
Ignéczi, A., Sole, A. J., Livingstone, S. J., Leeson, A. A., Fettweis, X., Selmes, N., et al. (2016). Northeast sector if the Greenland Ice Sheet to undergo the greatest inland expansion of supraglacial lakes during the 21st century. Geophys. Res. Lett. 43, 9729–9738. doi: 10.1002/2016GL070338
Iken, A., and Bindschadler, R. (1986). Combined measurements of subglacial water pressure and surface velocity of Findelengletscher, Switzerland: conclusions about drainage system and sliding mechanism. J. Glaciol. 32, 101–119. doi: 10.3189/s0022143000006936
Kirillin, G., Leppäranta, M., Terzhevik, A., Granin, N., Bernhardt, J., and Engelhardt, C. (2012). Physics of seasonally ice-covered lakes: a review. Aquatic. Sci. 74, 659–682. doi: 10.1007/s00027-012-0279-y
Koenig, L. S., Ivanoff, A., Alexander, P. M., MacGregor, J. A., Fettweis, X., Panzer, B., et al. (2016). Annual Greenland accumulation rates (2009–2012) from airborne snow radar. The Cryosphere 10, 1739–1752. doi: 10.5194/tc-10-1739-2016
Koenig, L. S., Lampkin, D. L., Montgomery, L. N., Hamilton, S. L., Turrin, J. B., Joseph, C. A., et al. (2015). Wintertime storage of water in buried supraglacial lakes across the Greenland Ice Sheet. Cryosphere 9, 1333–1342. doi: 10.5194/tc-9-1333-2015
Krawczynski, M. J., Behn, M. D., Das, S. B., and Joughin, I. (2009). Constraints on the lake volume required for hydro-fracture through ice sheets. Geophys. Res. Lett. 36:L10501. doi: 10.1029/2008GL036765
Lampkin, D. J., and VanderBerg, J. (2011). A preliminary investigation of the influence of basal and surface topography on supraglacial lake distribution near Jakobshavn Isbrae, Western Greenland. Hydrol. Process. 21, 3347–3355. doi: 10.1002/hyp.8170
Lampkin, D. J., and VanderBerg, J. (2013). Supraglacial melt channel networks in the Jakobshavn Isbræ region during the 2007 melt season. Hydrol. Process. 28, 6038–6053. doi: 10.1002/hyp.10085
Lampkin, D. L. (2011). Supraglacial lake spatial structure in western Greenland during the 2007 ablation season. J. Geophys. Res. 116:F04001. doi: 10.1029/2010JF001725
Leeson, A. A., Shepherd, A., Briggs, K., Howat, I., Fettweis, X., Morlighem, M., et al. (2015). Supraglacial lakes on the Greenland Ice Sheet advance inland under warming climate. Nat. Clim. Change 5, 51–55. doi: 10.1038/nclimate2463
Leppãranta, M. (1991). A review of analytical models of sea-ice growth. Atmos. Ocean 31, 123–138. doi: 10.1080/07055900.1993.9649465
Leppäranta, M. (2009). “Modelling of formation and decay of lake ice,” in Climate Change Impact on European Lakes ed. G. George (Netherlands: Springer), 63–83.
Leppäranta, M. (2015). Freezing of Lakes and the Evolution of Their Ice Cover, 1st Edn. Praxis, Cichester: Springer, 301.
Leuschen, C. (2014). IceBridge Snow Radar L1B Geolocated Radar Echo Strength Profiles, Version 1. Boulder: NASA National Snow and Ice Data Center Distributed Active Archive Center.
Lindbäck, K., Pettersson, R., Hubbard, A. L., Doyle, S. H., van As, D., Mikkelsen, A. B., et al. (2015). Subglacial water drainage, storage, and piracy beneath the Greenland ice sheet. Geophys. Res. Lett. 42, 7606–7614. doi: 10.1002/2015gl065393
Lüthje, M., Pedersen, L. T., Reeh, N., and Greuell, W. (2006). Modeling the evolution of supra-glacial lakes on the West Greenland ice-sheet margin. J. Glaciol. 52, 608–618. doi: 10.3189/172756506781828386
McMillan, M., Nienow, P., Shepherd, A., Benham, T., and Sole, A. (2007). Seasonal evolution of supra-glacial lakes on the Greenland ice sheet. Earth Planet. Sci. Lett. 262, 484–492. doi: 10.1016/j.epsl.2007.08.002
Meierbachtol, T., Harper, J., and Humphrey, N. (2013). Basal drainage system response to increasing surface melt on the Greenland ice sheet. Science 341, 777–779. doi: 10.1126/science.1235905
Miles, K. E., Willis, I. C., Benedek, C. L., Williamson, A. G., and Tedesco, M. (2017). Toward monitoring surface and subsurface lakes on the greenland ice sheet using sentinel-1 SAR and landsat-8 OLI imagery. Front. Earth Sci. 5:58. doi: 10.3389/feart.2017.00058
Mironov, D., Tezhevik, A., Kirillin, G., Jonas, T., Malm, J., and Farmer, D. (2002). Radiatively driven convection in ice-covered lakes: observations, scaling and a mixed layer model. J. Geophys. Res. 107, 7–10. doi: 10.1029/2001JC000892
Moss, R., Babiker, M., Brinkman, S., Calvo, E., Carter, T., Edmonds, J., et al. (2008). Towards New Scenarios for Analysis of Emissions, Climate Change, Impacts and Response Strategies. Geneva: Intergovernmental Panel on Climate Change.
Ohata, Y., Toyota, T., and Fraser, A. D. (2017). The role of snow in the thickening process of lake ice at lake Abashiri, Hokkaido, Japan. Tellus A 69:1391655. doi: 10.1080/16000870.2017.1391655
Palmer, S., McMillan, M., and Morlighem, M. (2015). Subglacial lake drainage detected beneath the Greenland ice sheet. Nat. Commun. 6:8408. doi: 10.1038/ncomms9408
Panzer, B., Gomez-Garcia, D., Leuschen, C., Paden, J., Rodriguez-Morale, F., Patel, A., et al. (2013). An ultra-wideband, microwave radar for measuring snow thickness on sea ice and mapping near-surface internal layers in polar firn. J. Glaciol. 59, 244–254. doi: 10.3189/2013jog12j128
Parizek, B., and Alley, R. B. (2004). Implications of increased Greenland surface melt under global-warming scenarios: ice-sheet simulations. Quat. Sci. Rev. 23, 1013–1027. doi: 10.1016/j.quascirev.2003.12.024
Perovich, D. (1998). “The optical properties of sea ice,” in Physics of Ice-Covered Seas, ed. M. Leppäranta (Helsinki: Helsinki University Printing House), 195–230.
Philpot, W. D. (1989). Bathymetric mapping with passive multispectral imagery. Appl. Opt. 28, 1569–1578. doi: 10.1364/ao.28.001569
Poinar, K., Joughin, I., Das, S. B., Behn, M. D., Lenaerts, J. T. M., and van den Broeke, M. R. (2015). Limits to future expansion of surface-melt-enhanced ice flow into the interior of western Greenland. Geophys. Res. Lett. 42, 1800–1807. doi: 10.1002/2015GL063192
Pope, A., Scambos, T. A., Moussavi, M., Tedesco, M., Willis, M., Shean, D., et al. (2016). Estimating supraglacial lake depth in West Greenland using Landsat 8 and comparison with other multispectral methods. Cryosphere 10, 15–27. doi: 10.5194/tc-10-15-2016
Rignot, E., Box, J. E., Burgess, E., and Hanna, E. (2008). Mass balance of the Greenland ice sheet from 1958 to 2007. Geophys. Res. Lett. 35:L20502. doi: 10.1029/2008GL035417
Riley, M. J., and Stefan, H. G. (1988). MINLAKE: a dynamic lake water quality simulation model. Ecol. Model. 43, 155–182. doi: 10.1016/0304-3800(88)90002-6
Rodriguez-Morales, F., Gogineni, S., Leuschen, C. J., Paden, J. D., Li, J., Lewis, C. C., et al. (2014). Advanced multifrequency radar instrumentation for polar research. IEEE Trans. Geosci. Remote Sens. 52, 2824–2842. doi: 10.1109/tgrs.2013.2266415
Saloranta, T. (2000). Modeling the evolution of snow, snow ice and ice in the Baltic Sea. Tellus 52A, 93–108. doi: 10.3402/tellusa.v52i1.12255
Saloranta, T. M., and Andersen, T. (2007). MyLake - a multi-year lake simulation model code suitable for uncertainty and sensitivity analysis simulations. Ecol. Model. 207, 45–60. doi: 10.1016/j.ecolmodel.2007.03.018
Selmes, N., Murray, T., and James, T. D. (2011). Fast draining lakes on the Greenland Ice Sheet. Geophys. Res. Lett. 38, 1–15. doi: 10.1029/2011GL047872
Selmes, N., Murray, T., and James, T. D. (2013). Characterizing supraglacial lake drainage and freezing on the Greenland Ice Sheet. Cryosph. Discuss. 7, 475–505. doi: 10.5194/tcd-7-475-2013
Shepherd, A., Ivins, E. R., Valentina, R. B., Bentley, M. J., Bettadpur, S., Briggs, K. H., et al. (2012). A reconciled estimate of ice-sheet mass balance. Science 338, 1183–1189.
Smith, L. C., Chu, V. W., Yang, K., Gleason, C. J., Pitcher, L. H., Rennermalm, A. K., et al. (2015). Efficient meltwater drainage through supraglacial streams and rivers on the southwest Greenland Ice Sheet. Proc.Natl. Acad. Sci. U.S.A. 112, 1001–1006. doi: 10.1073/pnas.1413024112
Sneed, W. A., and Hamilton, G. S. (2007). Evolution of melt pond volume on the surface of the Greenland Ice Sheet. Geophys. Res. Lett. 34:L03501.
Sole, A., Nienow, P., Bartholomew, I., Mair, D., Cowton, T., Tedstone, A., et al. (2013). Winter motion mediates dynamic response of the Greenland ice sheet to warmer summers. Geophys. Res. Lett. 40, 3940–3944. doi: 10.1002/grl.507764
Sole, A. J., Mair, D. W. F., Nienow, P. W., Bartholomew, I. D., King, M. A., Burke, M. J., et al. (2011). Seasonal speedup of a Greenland marine-terminating outlet glacier forced by surface melt–induced changes in subglacial hydrology. J. Geophys. Res. 116:F03014. doi: 10.1029/2010JF001948
Stevens, L. A., Behn, M. D., McGuire, J. J., Das, S. B., Joughin, I., Herring, T., et al. (2015). Greenland supraglacial lake drainages triggered by hydrologically induced basal slip. Nature 522, 73–76. doi: 10.1038/nature14480
Sundal, A. V., Shepherd, A., Nienow, P., Hanna, E., Palmer, S., and Huybrechts, P. (2009). Evolution of supra-glacial lakes across the Greenland Ice Sheet. Remote Sens. Environ. 113, 2164–2171. doi: 10.1016/j.rse.2009.05.018
Tedesco, M., and Steiner, N. (2011). In-situ multispectral and bathymetric measurements over a supraglacial lake in western Greenland using a remotely controlled watercraft. Cryosphere 5, 445–452. doi: 10.5194/tc-5-445-2011
Tsai, V. V., and Rice, J. R. (2010). A model for turbulent hydraulic fracture and application to crack propagation at glacier beds. J. Geophys. Res. 115:F03007. doi: 10.1029/2009JF001474
van de Wal, R. S. W., Boot, W., van den Broeke, M. R., Smeets, C. J. P. P., Reijmer, C. H., Donker, J. J. A., et al. (2008). Large and rapid melt-induced velocity changes in the ablation zone of the Greenland ice sheet. Science 321, 111–113. doi: 10.1126/science.1159455
Velicogna, I. (2009). Increasing rates of ice mass loss from the Greenland and Antarctic ice sheets revealed by GRACE. Geophys. Res. Lett. 36:L19503. doi: 10.1029/2009GL040222
Willis, M. J., Herried, B. G., Bevis, M. G., and Bell, R. E. (2015). Recharge of a subglacial lake by surface meltwater in northeast Greenland. Nature 518, 223–227. doi: 10.1038/nature14116
Yang, K., and Smith, L. C. (2013). Supraglacial streams on the Greenland Ice Sheet delineated from combined spectral-shape information in high-resolution satellite imagery. IEEE Geosci. Remote Sens. Lett. 10, 801–805. doi: 10.1109/lgrs.2012.2224316
Yen, Y.-C. (1981). Review If Thermal Properties of Snow, Ice and Sea Ice. U.S. Army Cold Regions Research and Engineering Laboratory (CRREL), Report 81-10. Hanover, NH: CRREL.
Keywords: supraglacial lakes, lake processes, modeling, remote sensing, Greenland ice sheet
Citation: Lampkin DJ, Koenig L, Joseph C and Box JE (2020) Investigating Controls on the Formation and Distribution of Wintertime Storage of Water in Supraglacial Lakes. Front. Earth Sci. 8:370. doi: 10.3389/feart.2020.00370
Received: 23 January 2019; Accepted: 10 August 2020;
Published: 27 November 2020.
Edited by:
Alun Hubbard, UiT The Arctic University of Norway, NorwayReviewed by:
Rachel Joanne Carr, Newcastle University, United KingdomStephen Brough, University of Liverpool, United Kingdom
Copyright © 2020 Lampkin, Koenig, Joseph and Box. This is an open-access article distributed under the terms of the Creative Commons Attribution License (CC BY). The use, distribution or reproduction in other forums is permitted, provided the original author(s) and the copyright owner(s) are credited and that the original publication in this journal is cited, in accordance with accepted academic practice. No use, distribution or reproduction is permitted which does not comply with these terms.
*Correspondence: Derrick Julius Lampkin, ZGxhbXBraW5AdW1kLmVkdQ==
 Derrick Julius Lampkin
 Lora Koenig2
 Jason Eric Box