 Xiumei Li
 Yong Zhang
 Mingda Wang
 Junhui Yan1
 Yue He
 Juzhi Hou
95% of researchers rate our articles as excellent or good
Learn more about the work of our research integrity team to safeguard the quality of each article we publish.
Find out more
ORIGINAL RESEARCH article
Front. Earth Sci. , 03 September 2020
Sec. Quaternary Science, Geomorphology and Paleoenvironment
Volume 8 - 2020 | https://doi.org/10.3389/feart.2020.00360
Quantitative palaeotemperature reconstruction is crucial for understanding the evolution of Earth’s climate and reducing uncertainty in future climate predictions. Clarifying the temperature change over the Tibetan Plateau (TP) during the Common Era is critical because it plays a vital role in the prediction of cryosphere changes in such regions under a future warming climate. In this paper, we report a comprehensive synthesis of currently available quantitative temperature records to refine the temperature history of the TP during the Common Era. To date, Common Era quantitative temperature reconstructions are sparse and mainly concentrated in the northeastern TP. Considering seasonal bias of the available quantitative temperature reconstructions, three different composite temperature records for TP were derived, namely the “Standardization” composite, the “Mean annual air temperature anomaly” composite, and the “Mean summer temperature anomaly” composite individually. All the integrated temperature series reveal the Medieval Climate Anomaly and the Little Ice Age, but the start and end timings of these multi-centennial-scale periods and their temperature amplitudes differ. There is strong seasonality in temperature variations on this high plateau, and the 20th century warming was characterized by rapid winter temperature increases, while summer temperatures displayed weak variations. Spatial analysis suggests a relatively consistent signal marking a warm TP during 600–1400 CE and a cold plateau during 1400–1900 CE. Large-scale trends in temperature history for the TP resemble those for China and the Northern Hemisphere. Many factors, such as seasonality of temperature proxies, might lead to uncertainty in the reconstructed series. The results highlight that it is of crucial importance to develop more seasonal temperature reconstructions to improve the reliability of quantitative paleoclimatic reconstructions based on geological records across the TP.
Quantitative temperature reconstructions can help improve the accuracy of climate simulations by providing tests and evaluations of climate models (Snyder, 2010; Braconnot et al., 2012). In addition, such reconstructions can help understand and quantify the influence of external forcings and intrinsic dynamics of the global climate system and reveal natural climate variability in future climate scenarios (Snyder, 2010; Pages 2k Consortium, 2013; Wu et al., 2019). It is important to quantify climatic change during the Common Era, which is vital for understanding how the climate system evolved from the one controlled by natural forcings to the one influenced by both natural and anthropogenic factors (Yang et al., 2003; IPCC, 2013; Pages 2k Consortium, 2013, 2019).
The Tibetan Plateau (TP), covering 2.5 million km2 with an average elevation of >4500 m above sea level, is one of the most imposing topographic features on Earth’s surface. The sensible and latent heat fluxes released over the TP drive intense monsoon circulation and strongly influence global circulation patterns (Thompson et al., 1997). Consequently, this region has become a hotspot in climate change research because of its sensitive response to and strong effect on global environmental changes (Yao et al., 2012; Hou et al., 2013, 2015). In the context of global warming, temperature has gradually become one of the meteorological parameters of great concern (Liu et al., 2017). It is particularly important to investigate the temperature change on the TP, as this high plateau hosts a wide array of mountain glaciers that provide freshwater resources to more than one-third of the world’s population (Immerzeel, 2008; Immerzeel et al., 2010). The “warming” glaciers and permafrost will exert significant impacts on the hydrology, ecology, and stability of engineering in surrounding regions (Ding et al., 2019). Meteorological observations on the TP over the past few decades have shown signs of more pronounced regional warming than the global average (Liu and Chen, 2000; Liu X. et al., 2009). Recent analyses of observational temperature data from meteorological stations on the TP show that the TP has experienced statistically significant warming, particularly during the periods of 1971–2004 and 1981–2014 (Cai et al., 2017). There is a strong upward trend on the central, eastern and northwestern TP, while on the southwestern TP, there is only a weak warming trend (Liu and Chen, 2000). In addition, almost all stations above 2000 m a.s.l. reveal upward trends for annual average temperature and more marked warming trends for winter but show weak trends for summer (Liu and Chen, 2000). However, questions arise regarding the temperature change on the TP during the Common Era, which has important implications for understanding the trends in temperature during the Anthropocene.
In recent decades, many palaeotemperature records have been reconstructed based on ice cores (Yao et al., 1996; Thompson et al., 2003, 2006; Yang et al., 2004), tree rings (Liu Y. et al., 2009; Zhang et al., 2014; Chen et al., 2016) and lake sediments (Liu et al., 2006, Liu X. et al., 2014; He et al., 2013b; Aichner et al., 2015; Li et al., 2015, 2019; Feng et al., 2019), covering the last two millennia across the TP (Figure 1), which make it possible to describe and understand the full range of natural climate system behavior over the TP area. Based on these temperature records, integrated research on historical temperature changes on the TP has been performed by several scholars (Yang et al., 2003; Yao et al., 2007; Hou et al., 2013). These comprehensive studies can help provide a better understanding of the overall and regional features of temperature changes on the TP during the Common Era. However, some differences still exist among the previous integrated temperature series. For instance, although all the integrated temperature series have identified the existence of the Medieval Climate Anomaly (MCA), the Little Ice Age (LIA), and the warming 20th century on the TP, the timing and amplitude of these periods differ. In addition, there are some inconsistencies in temperature variation during the first 1000 years of the Common Era. The inconsistencies in the above temperature variations during the Common Era could partly be explained by the following reasons: (1) The majority of the temperature records only extend back approximately 1000 year in previous studies, which may lead to large uncertainties in the temperature reconstructions during the first millennium. (2) Most temperature records in previous integrated studies are qualitative; thus, they might not be comparable to each other (Hou et al., 2013). (3) There are seasonal biases in temperature variability (Patterson et al., 2010; Wu et al., 2019) based on different proxies. Many temperature proxies are controlled by seasonal processes and reflect the climate of the growing season (Chu et al., 2011). Without considering the seasonality of temperature proxies, temperature reconstruction may produce biased results. This bias may be particularly important for the arid/high-elevation TP region (Wu et al., 2013), where the average temperature difference between January and July can reach 40°C (Chen et al., 2011). Therefore, it is of critical importance to reconstruct quantitative, continuous, high-resolution, and seasonal temperature records of the past 2000 years to understand the large-scale pre-industrial temperature variability on the TP.
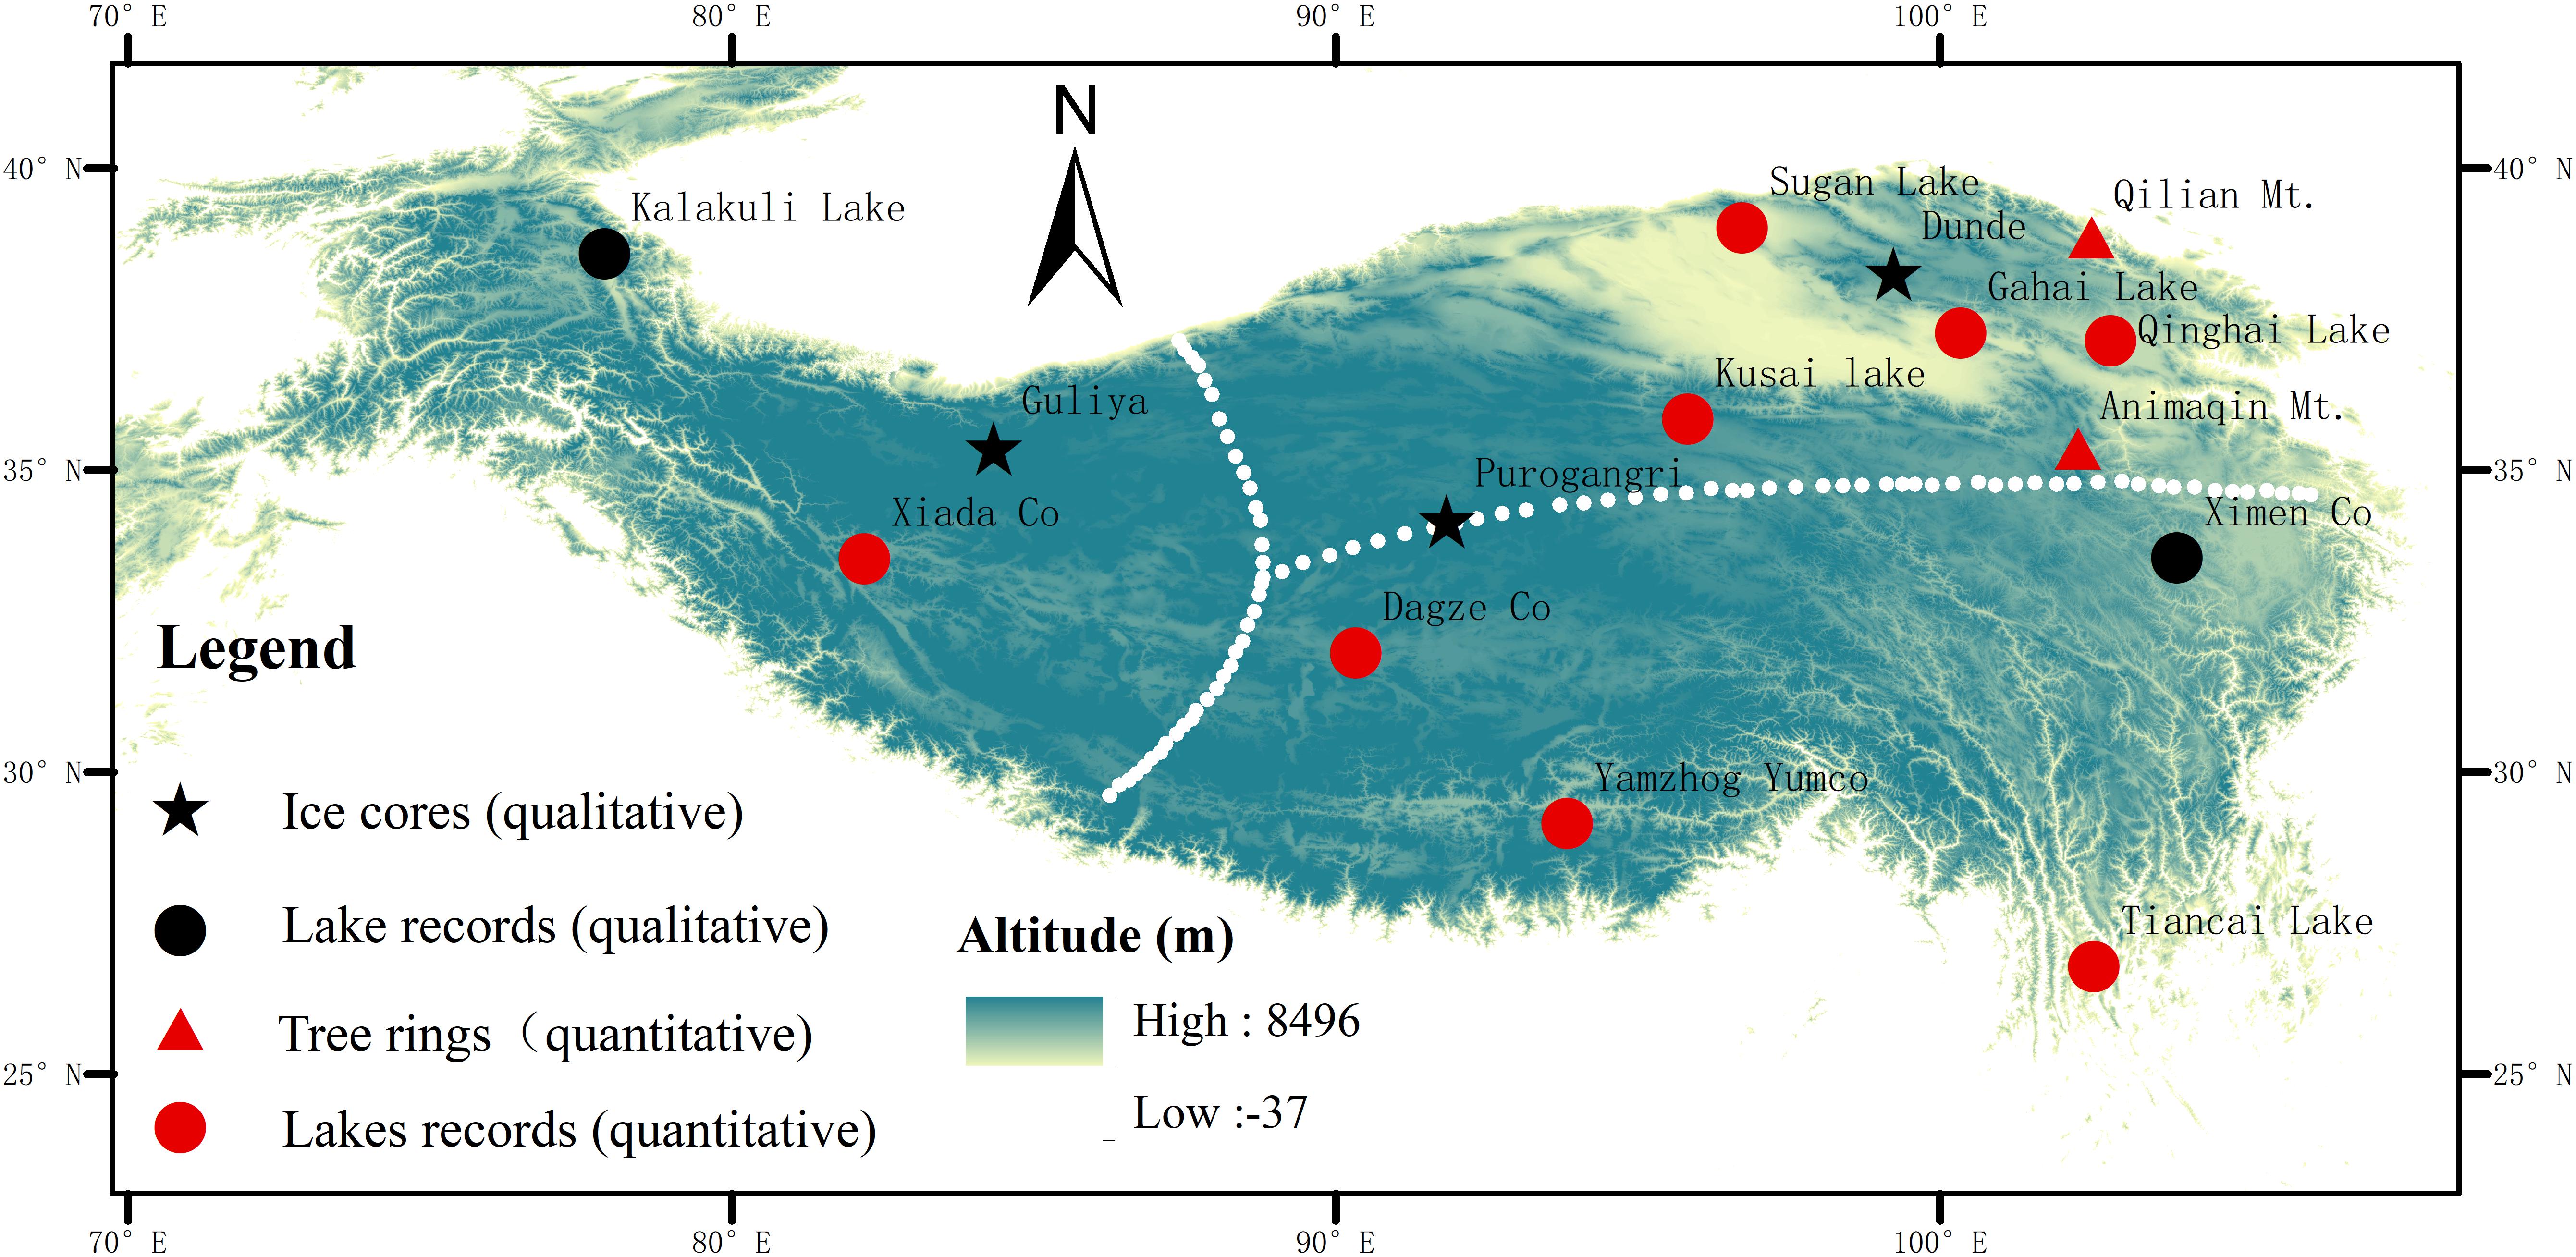
Figure 1. Distribution and types of proxy records mentioned in this study. See Table 1 for details on these proxy records. Red symbols represent quantitative temperature records and black symbols represent qualitative temperature records. Dashed lines represent the boundary of three subregions of the Tibetan Plateau in Yang et al. (2003).
In this study, we first collected the most up-to-date quantitative, continuous, and high-resolution temperature records covering the past 2000 years over the TP. Subsequently, data integration and spatial analysis were performed on these temperature records to explore the spatial, temporal and seasonal characteristics of temperature changes on the TP. We also compared our results with temperature series constructed previously for the TP, China, and the Northern Hemisphere. In addition, the reliability and uncertainty of temperature reconstructions, and the possible mechanisms of temperature change over the past two millennia on the TP are also discussed. The overall aim of this study was to gain a complete and an updated understanding of centennial-scale temperature changes during the Common Era on the TP. Moreover, we hope to reveal the seasonal bias in the temperature reconstructions on the TP to highlight the importance of quantitative and seasonal temperature reconstructions in this region.
We employed six criteria to collect quantitative temperature records during the past 2000 years over the TP. First, the sampling sites had to be in areas of the TP (Figure 1). Second, the proxies should clearly reflect temperature changes. Third, the records should have a resolution better than 40 year. Fourth, the dominant factor driving variations in the proxy records should be climate rather than human activity. Fifth, the records should span the past 2000 years without sedimentary hiatuses. Sixth, the records should be quantitative.
Based on the above criteria, 10 quantitative temperature records over the past 2000 years were collected from different areas of the TP (Table 1 and Figure 2), including three mean annual air temperature (MAAT) series, five summer temperature series, an April–June maximum temperature (Tmax 4–6) series and a January–August minimum temperature (Tmin 1–8) series (Figure 2). Specifically, MAAT variations during the Common Era on the TP were reconstructed by temperature proxies from Xiada Co (Li et al., 2019), Tiancai Lake (Feng et al., 2019), and Qinghai Lake (Liu et al., 2006). Summer temperatures were reconstructed by temperature proxies from Kusai Lake (Wu et al., 2013), Dagze Co (Li et al., 2015), Yamzhog Yumco Lake (Guo et al., 2018), Gahai and Sugan Lake (He et al., 2013b). In addition, April–June maximum temperature (Tmax 4–6) and January–August minimum temperature (Tmin 1–8) anomaly were reconstructed based on tree-ring chronology on the northeastern TP (Zhang et al., 2014; Chen et al., 2016). Among these records, although the tree-ring based temperature record form the Qilian Mountains covers only the past 1343 years, it was selected as the temperature sequence for the northeastern area of the TP because of its clear climatic indications, significance and high resolution. We also realized that the resolution of the temperature records at Xiada Co, Yamzhog Yumco, and Qinghai Lake were much coarser in the first 1000 years. However, we retained these three sets of records, given their high resolution over the past 1000 years and given the scarcity of quantitative temperature records on the TP during the Common Era. The basic characteristics of the main proxy records used in this paper are shown in Table 1. The details for each of the ten quantitative temperature series are presented in the Supplementary Materials.
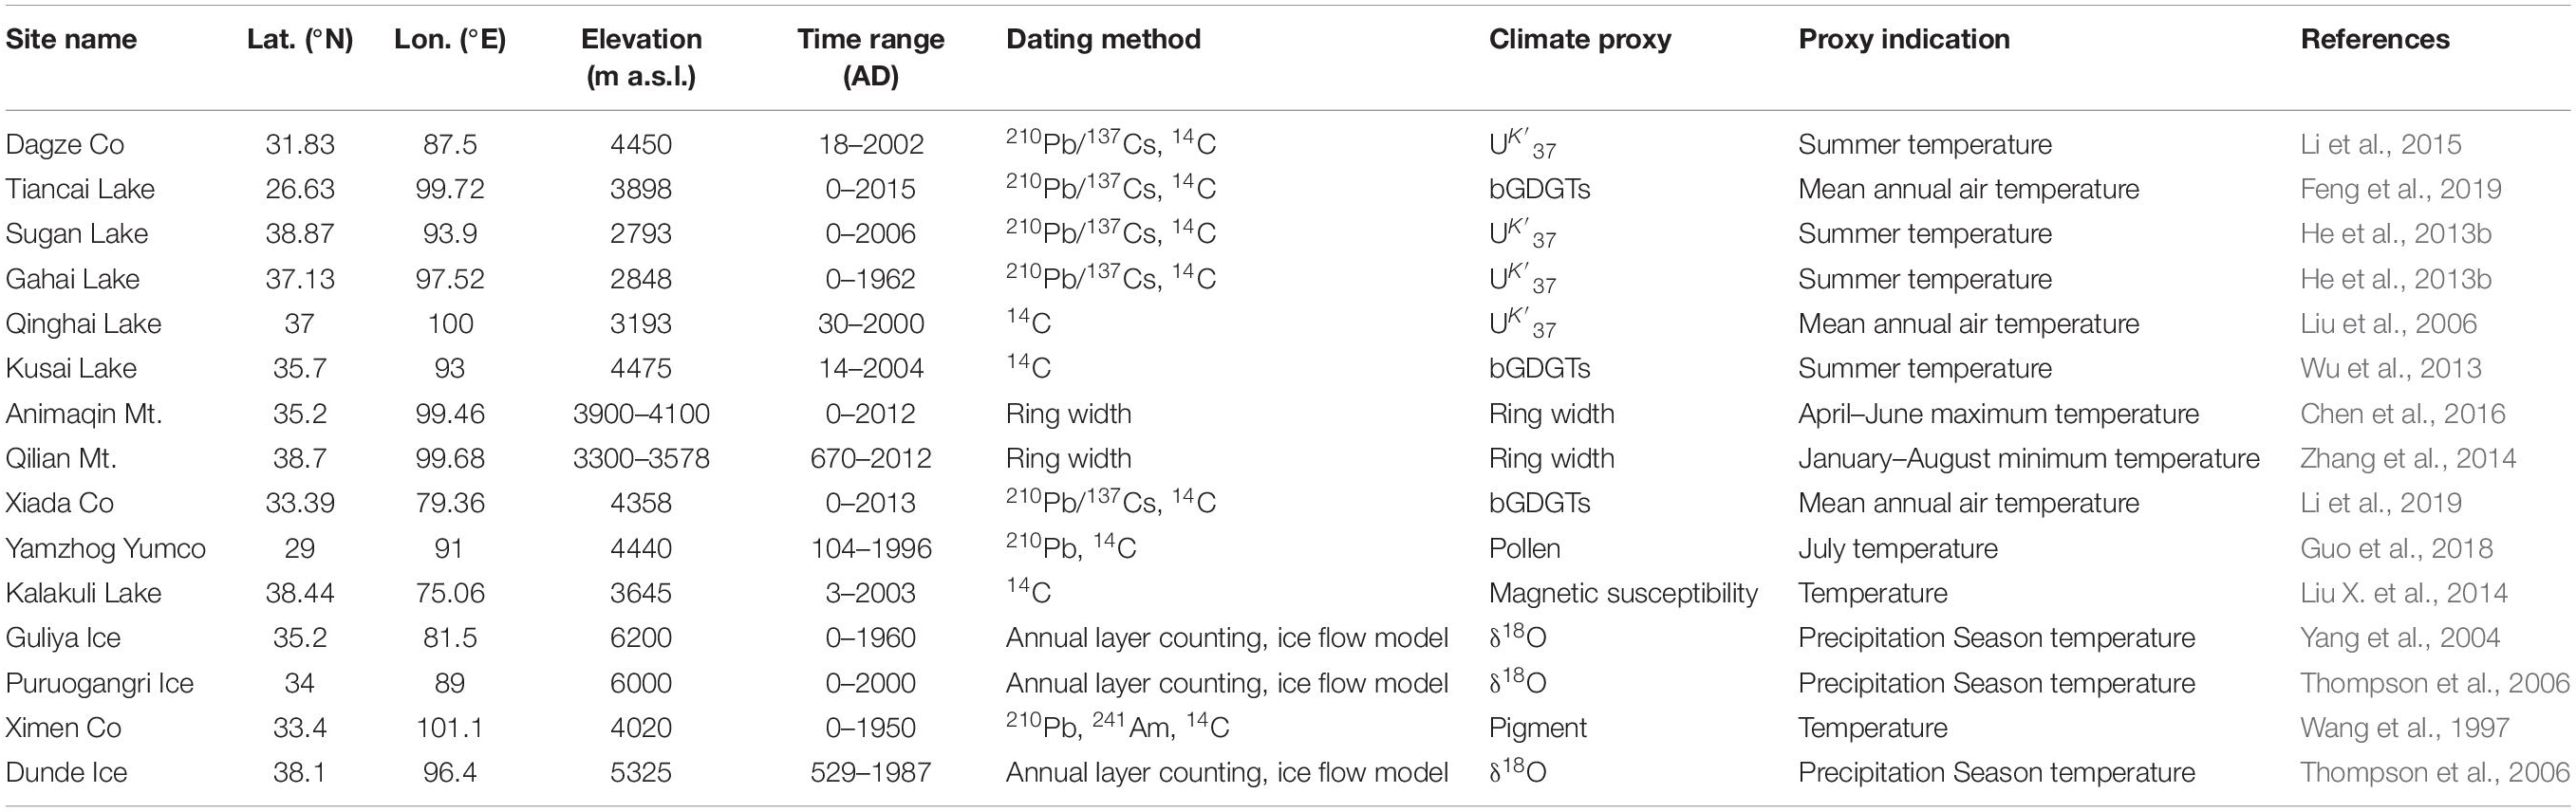
Table 1. Data sources for the temperature proxy mentioned in this study.
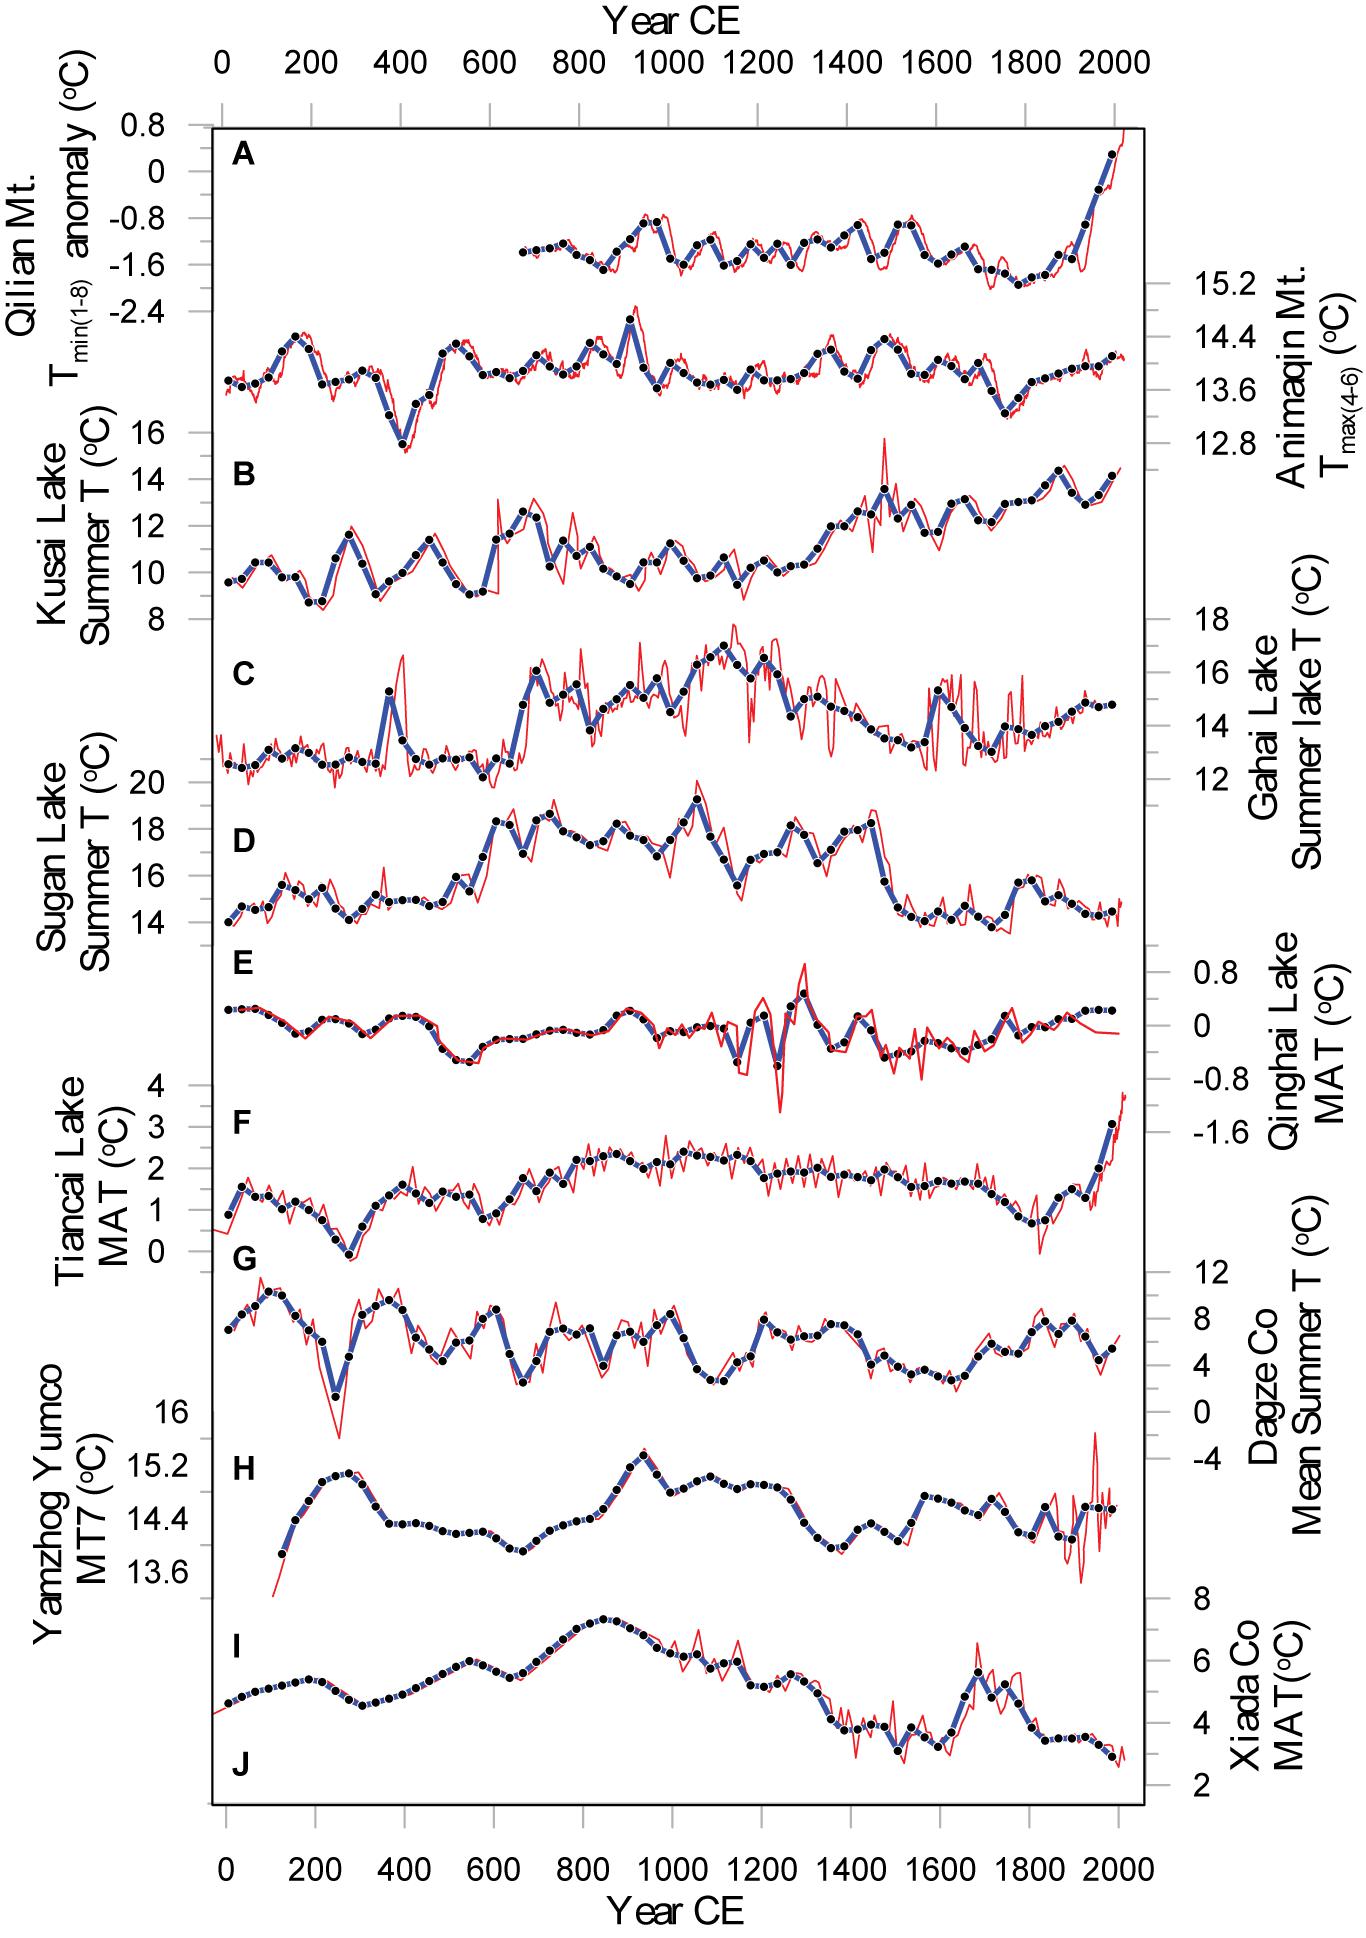
Figure 2. The 10 quantitative temperature proxy records during the past 2000 years over the TP (the red line is the original series, and the blue dashed line is the 30-year-smoothed series). (A) Tree-ring-based temperature series for Qilian Mt. on the northeastern TP (Zhang et al., 2014). (B) Tree-ring-based temperature series for the Animaqin Mountains in the northeastern TP (Chen et al., 2016). (C) bGDGTs-based temperature record for Kusai Lake (Wu et al., 2013). (D) –based temperature record for Gahai Lake (He et al., 2013b). (E) –based temperature record for Sugan Lake (He et al., 2013b). (F) –based temperature record for Qinghai Lake (Liu et al., 2006). (G) bGDGTs-based temperature record for Tiancai Lake (Feng et al., 2019). (H) –based temperature record for Dagze Co (Li et al., 2015). (I) Fossil pollen based temperature record for Yamzhog Yumco Lake (Guo et al., 2018). (J) bGDGTs-based temperature record for Xiada Co (Li et al., 2019).
There are two common basic methods to reconstruct regional paleo-temperature series under the constraint of lacking sufficient data (Yang et al., 2002). One way is to compute the average of all available proxy series in a study area (Jones et al., 1998; Crowley and Lowery, 2000), and the other is to merge proxy records of several subregions by a specific area weight (Wang and Gong, 2000; Yang et al., 2002). It is important to notice that before averaging, each series should be standardized or calculated using the anomalies to homogenize the original variability of all series (Yang et al., 2002). The above methods have been applied widely for local- to global-scale reconstructions of temperature variables (Yang et al., 2002, 2003; Mann et al., 2008; Jones et al., 2009; Ljungqvist, 2010; Pages 2k Consortium, 2019), and are therefore suitable for use in the Late Holocene quantitative temperature fluctuations on the TP. In this study, the subregional division of the TP and the respective area weights of these subregions followed those of Yang et al. (2003). Based on the results of rotated empirical orthogonal function analysis of annual air temperature data from 48 meteorological stations (1961–1998) on the TP, Yang et al. (2003) divided the TP into three subregions: the western, southern and northeastern TP (Figure 1). Their area weights were 0.26, 0.40, and 0.34, respectively, which corresponded to the relative sizes of the subregions (Yang et al., 2003). The composite temperature reconstructions of the TP in this paper were derived by merging the respective individual proxy records based on area weight. Considering seasonal bias, three different composite temperature records were derived for the TP (Figure 3). The “Standardization” composite is a composite temperature reconstruction for the whole TP based on all selected quantitative temperature series (Figure 3a). Specifically, three steps were taken. (1) The annual-resolution records were first standardized after 30-year average smoothing. If the resolution of a record was coarser than 1 year, a spline function was applied to interpolate the record to an annual resolution before smoothing to ensure minimal loss of climate information. The formula for standardization is shown as following:
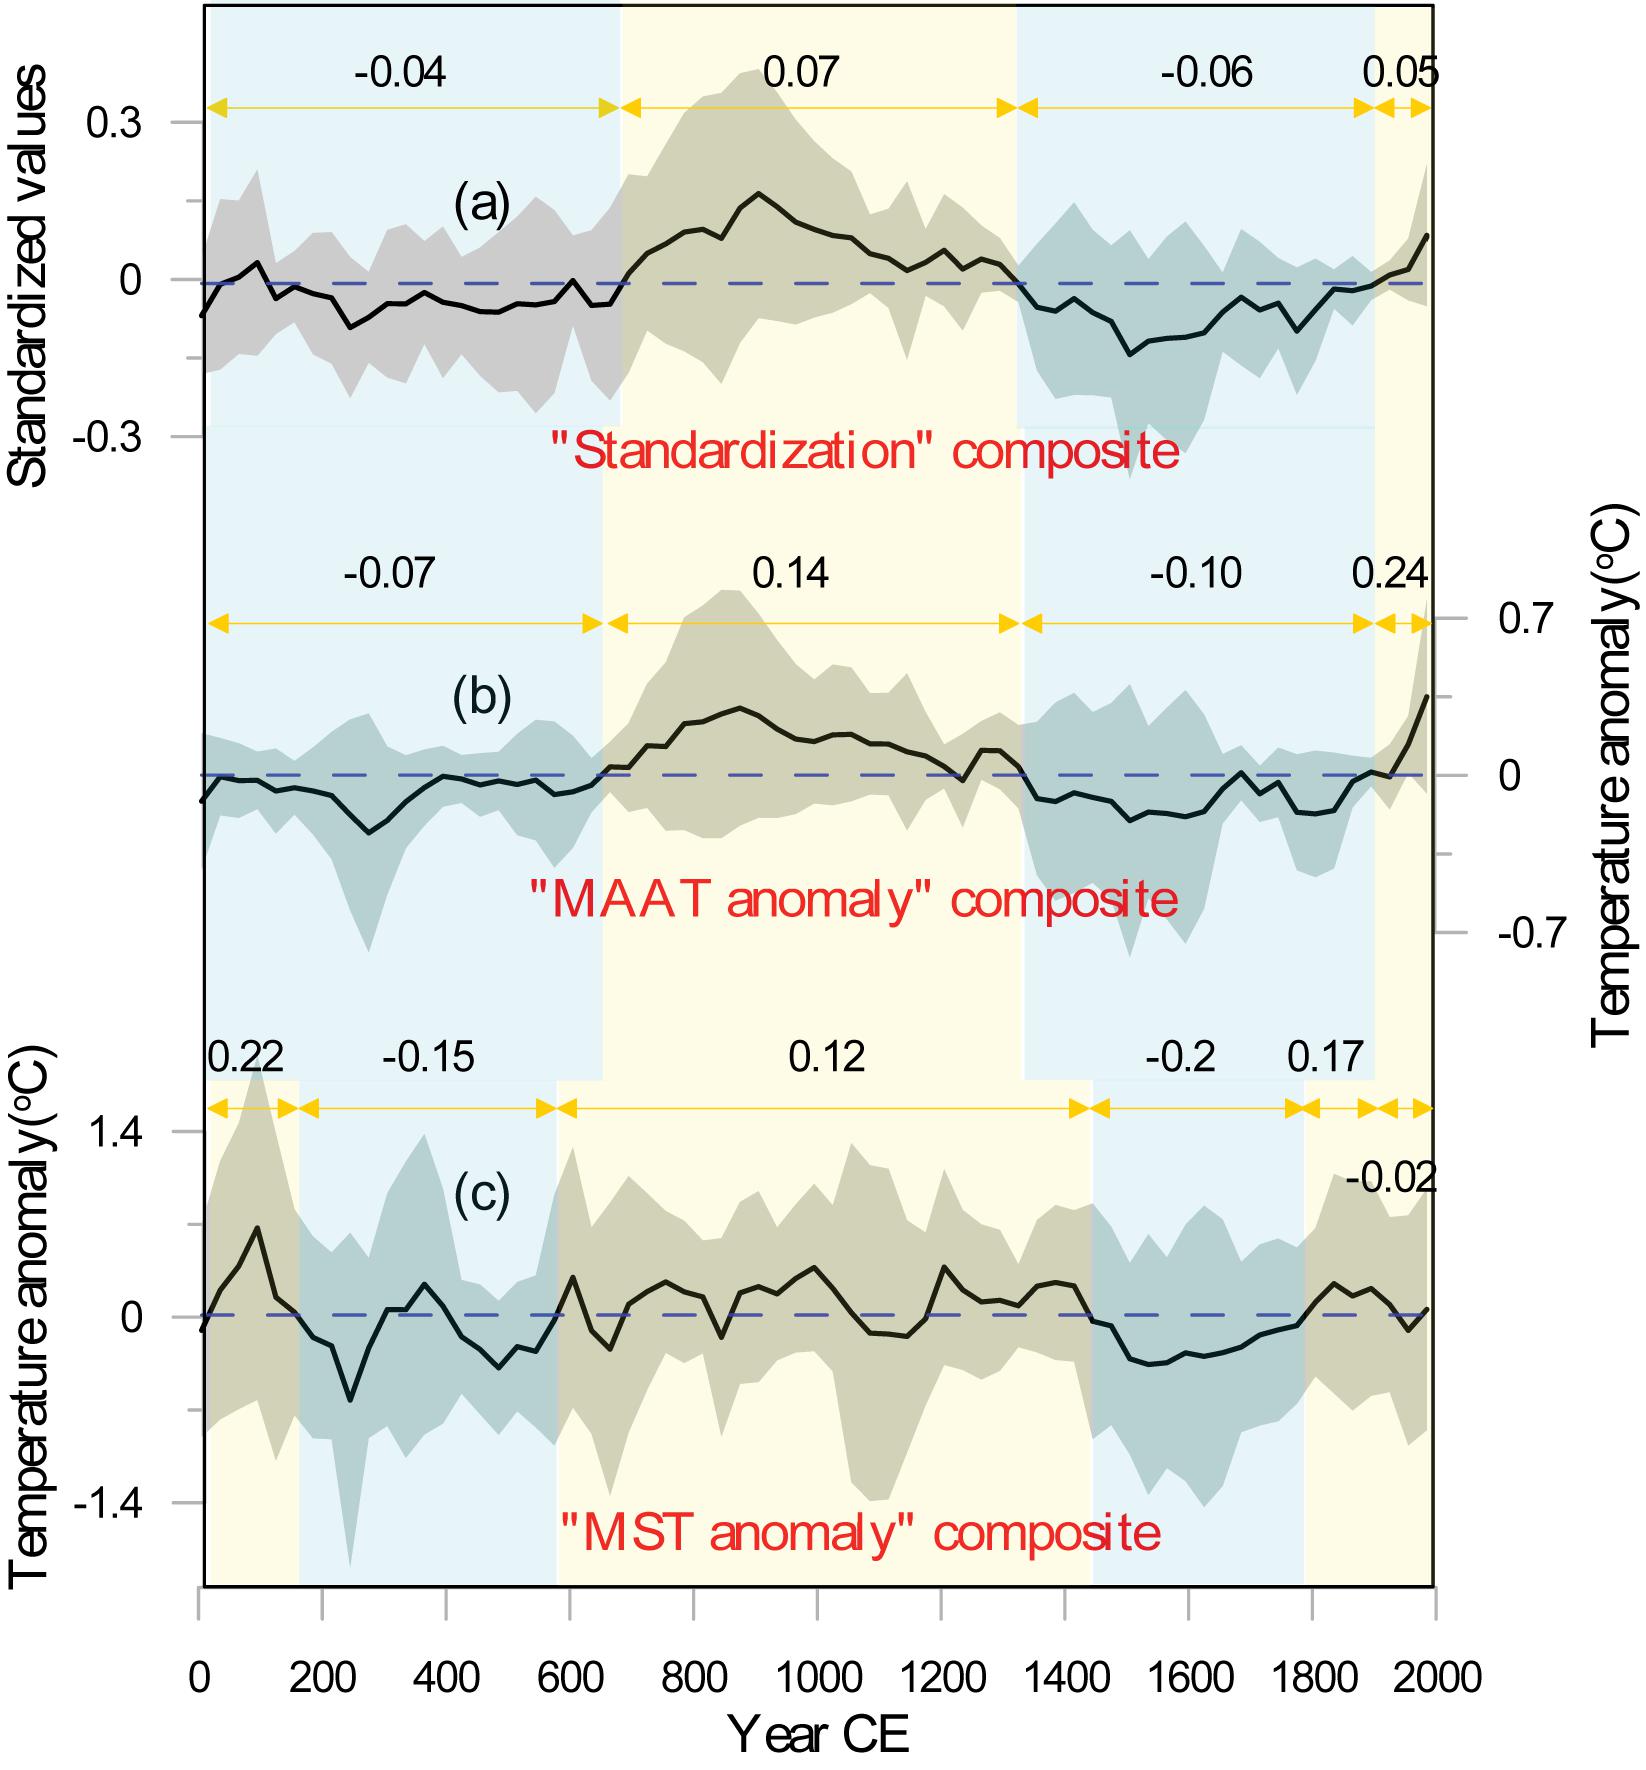
Figure 3. Composite temperature series over the TP. (a) The “Standardization” composite temperature reconstruction for the whole TP based on all 10 selected temperature series. (b) The “MAAT anomaly” composite temperature reconstruction for the TP based on the three MAAT temperature series in Qinghai Lake, Xiada Co, and Tiancai Lake. (c) The “MST anomaly” composite temperature reconstruction for the TP based on the five summer temperature series in Dagze Co, Kusai Lake, Gahai Lake, Yamzhog Yumco Lake, and Sugan Lake. The light gray shading represents the standard deviation of the integrated temperature series.
In this formula, Xij is the new numerical value standardized from record j in the sequence i. xi–min, xi–max represent respectively the minimum value and the maximum value of sequence i.
(2) Three sub-regional (western, southern, and northeastern TP) temperature series were calculated by averaging the standardized proxy data of each subregion. (3) The reconstruction for the whole TP was performed by calculating the weighted average of the three regional series based on the sizes of the regions.
The second composite, named the “MAAT anomaly” composite, is a composite MAAT anomaly reconstruction for the TP based on the three individual MAAT temperature series for Qinghai Lake, Xiada Co, and Tiancai Lake (Figure 3b). This “MAAT anomaly” composite was derived according to the following procedures: (1) the three individual MAAT sequences were interpolated to an annual resolution with the spline function, and they were then smoothed by 30-years averaging; (2) the MAAT anomalies were computed with reference to the mean temperature value of the past 2000 years; (3) the “MAAT anomaly” composite was then derived by the weighted average of the three MAAT anomaly series according to the sizes of the regions.
The third composite, named the “Mean summer temperature (MST) anomaly” composite (Figure 3c), is a composite summer temperature reconstruction for the TP based on the five summer temperature series form Dagze Co, Kusai Lake, Gahai Lake, Yamzhog Yumco, and Sugan Lake. The “MST anomaly” composite was constructed with a procedure similar to that for the “MAAT anomaly” composite.
For warm and cold fluctuations, if the temperature in a period was higher than the average level in the past 2000 years, it was regarded as a relatively warm period, and vice versa (Hou et al., 2013). It is noteworthy that unlike the “MAAT anomaly” and “MST anomaly” composite series, which show the numerical values of temperature anomaly variations, the “Standardization” composite indicates only the relative amplitude of temperature changes because it is based on standardized temperature data.
To better understand the spatial and temporal characteristics of temperature changes on the TP, several typical cold and warm periods on the TP during the past 2000 years were roughly divided according to the characteristics of the composite temperature records. Temperatures during each warm and cold period in individual records were classified into four grades (warm, moderately warm, moderately cold, and cold) according to the following procedures. The high-resolution proxy records were first linearly interpolated to their average resolution to avoid the influence of an uneven distribution of the original data on the data treatment steps. Then, the interpolated values during each of the typical cold and warm periods were compared to the mean value for the entire time series during the last two millennia. If 2/3 of the interpolated values during each period were higher (lower) than the mean value for a given location, the temperature for that location was classified as “warm (cold),” and if more than 1/2 but fewer than 2/3 of the values were higher (lower) than the mean value, the temperature was classified as “moderately warm (moderately cold).”
The combination of temperature records with different proxies and resolutions from different sites will inevitably lead to uncertainties in the final results. The standard deviation was calculated to show the error of each composite curve. Moreover, the reliability and uncertainties of the results of this study will be discussed in detail in the following sections.
Considering the seasonal bias in the temperature reconstructions, three different composite temperature records for the TP were derived (Figure 3). As reflected by the integrated temperature reconstructions on the TP, the “Standardization” composite series exhibits a trend of changes similar to that of the “MAAT anomaly” composite series (Figures 3a,b). However, the variations in the “MST anomaly” composite series (Figure 3c) are quite different from those in the above two composite temperature series, and temperature in this series fluctuates more significantly during the Common Era. For example, the warm period during 0–180 CE reflected by the “MST anomaly” composite series is not shown in the “Standardization” composite series and the “MAAT anomaly” composite series. The 20th century warming in the “Standardization” composite series and the “MAAT anomaly” composite series displays a slight downward trend in the “MST anomaly” reconstruction (Figure 3c).
All three composite temperature records reveal the existence of the MCA and the LIA on the TP. However, the timing of these multi-centennial-scale warming or cooling periods shows differences among the three composite records (Figure 3). For example, compared with that in the “Standardization” (Figure 3a) and the “MAAT anomaly” composite (Figure 3c) reconstructions, the MCA started earlier and ended later in the “MST anomaly” composite reconstruction (Figure 3b). The times of the MCA reconstructed by the “Standardization” (Figure 3a), “MAAT anomaly” (Figure 3b) and “MST anomaly” (Figure 3c) composite series on the TP are 665–1350 CE, 635–1350 CE, and 575–1415 CE, respectively. In addition, LIA is shorter in the “MST anomaly” composite reconstruction than in the other two integrated temperature series. The times of the LIA for the “Standardization,” “MAAT anomaly” (Figure 3b) and “MST anomaly” composite series are 1350–1900 CE, 1350–1900 CE, and 1415–1775 CE, respectively. At the end of the LIA, a significant warming trend over the TP is detected in both the “Standardization” composite (Figure 3a) and the “MAAT anomaly” composite (Figure 3b) series. However, the warming of the “MST anomaly” composite reconstruction on the TP occurred early. It increased abruptly in 1775 CE, and this warming lasted for nearly 150 years. After 1925 CE, the “MST anomaly” composite reconstruction showed a slight downward trend (Figure 3c).
Different temperature amplitudes of century-scale warm and cold fluctuation periods also exist in the above composite temperature records. The “MST anomaly” composite record (Figure 3c) reveals three warm periods during 0–185 CE, 575–1415 CE, and 1775–1925 CE. The temperatures of these three warm periods were 0.22, 0.12, and 0.17°C higher than the average value in the past 2000 years, respectively (Figure 3c). The cold periods occurred between 185 and 575 CE, between 1415 and 1775 CE, and during the past century; during these three periods, the temperatures were 0.15, 0.20, and 0.02°C lower than the average value in the past 2000 years, respectively. The “MST anomaly” composite record indicates that the period during 0–185 CE was the warmest period, while the period between 1415 and 1775 CE (LIA) was the coldest period.
The “MAAT anomaly” composite record (Figure 3b) reflects that the LIA, with an average temperature 0.10°C lower than the average value in the past 2000 years, was the coldest interval during the past 2000 years. The past century, with an average temperature 0.24°C higher than the average in the past 2000 years, was the warmest interval during the Common Era. The average temperature of the MCA was 0.14°C above the 2000-year average value (Figure 3b). For the “Standardization” composite reconstruction (Figure 3a), the LIA was the coldest period, and the MCA was the warmest interval during the Common Era (Figure 3a). The recent warming century was not unprecedented and was slightly colder than the MCA.
In this study, the “Standardization” composite series, which is based on all the collected temperature records, exhibits a trend of changes similar to that in the “MAAT anomaly” composite series but quite different from the variations in the “MST anomaly” composite series. The coefficients of determination are 0.81 for the comparison of “Standardization” with “MAAT anomaly” (p < 0.0001), 0.34 for the comparison of “Standardization” with “MST anomaly” (p < 0.0001), and 0.12 for the comparison of “MAAT anomaly” with “MST anomaly” (p = 0.0042), indicating the strong seasonality of temperature variations on the TP (Figure 4). Since temperature proxies are mainly controlled by climatic conditions during the growing season, paleoclimatic reconstructions may reflect seasonal conditions rather than the mean annual climate state (Liu Z. et al., 2014; Wu et al., 2019). For instance, biomarkers (such as alkenones) in lake sediments are mainly controlled by climatic conditions during the growing season (Chu et al., 2011), ice cores mostly indicate the temperature during rainy seasons, and some tree-ring records display pre-growth winter temperatures, while others are able to illustrate pre-growth summer temperatures (Hou et al., 2013; George, 2014). Each proxy has its inherent response to temperature, which means that the reconstructed temperature records capture different seasonalities (Ojala et al., 2008; Patterson et al., 2010). As the world’s highest plateau, the TP has a climate that exhibits strong seasonality, which may lead to inconsistencies in the reconstructed temperature records based on different proxies controlled by different seasonalities. Note that the MAAT on the TP is heavily biased toward winter temperatures since monthly average temperatures at or below 0°C in this high region last for over 6 months. This feature may indicate that the average temperature variations on the TP may be more reflective of the signal of winter temperature change but different from that in summer.

Figure 4. Relationships between the three composited temperature series on the TP. (A) Relationship between the “Standardization” and “MAAT anomaly” composite series. (B) Relationship between the “Standardization” and “MST anomaly” composite series. (C) Relationship between the “MAAT anomaly” and “MST anomaly” composite series.
We also observed spatial differences in temperature variations in different parts of the TP during the last two millennia. For example, the abrupt warming period in Tiancai Lake (Figure 2G) and Qilian Mt. (Figure 2A) during the past century was the warmest interval of the past two millennia. However, such an unprecedented warming century is not reflected in the other temperature records (Figures 2B,D–F,H,I). To better understand the spatial and temporal characteristics of temperature changes on the TP, four cold and warm epochs (0–600 CE, 600–1400 CE, 1400–1900 CE and the past century) were roughly divided to examine the spatial characteristics of temperature variation on the TP. Temperature grades (warm, moderately warm, moderately cold, and cold) at each site during the four typical warm and cold epochs are illustrated in Figure 5.
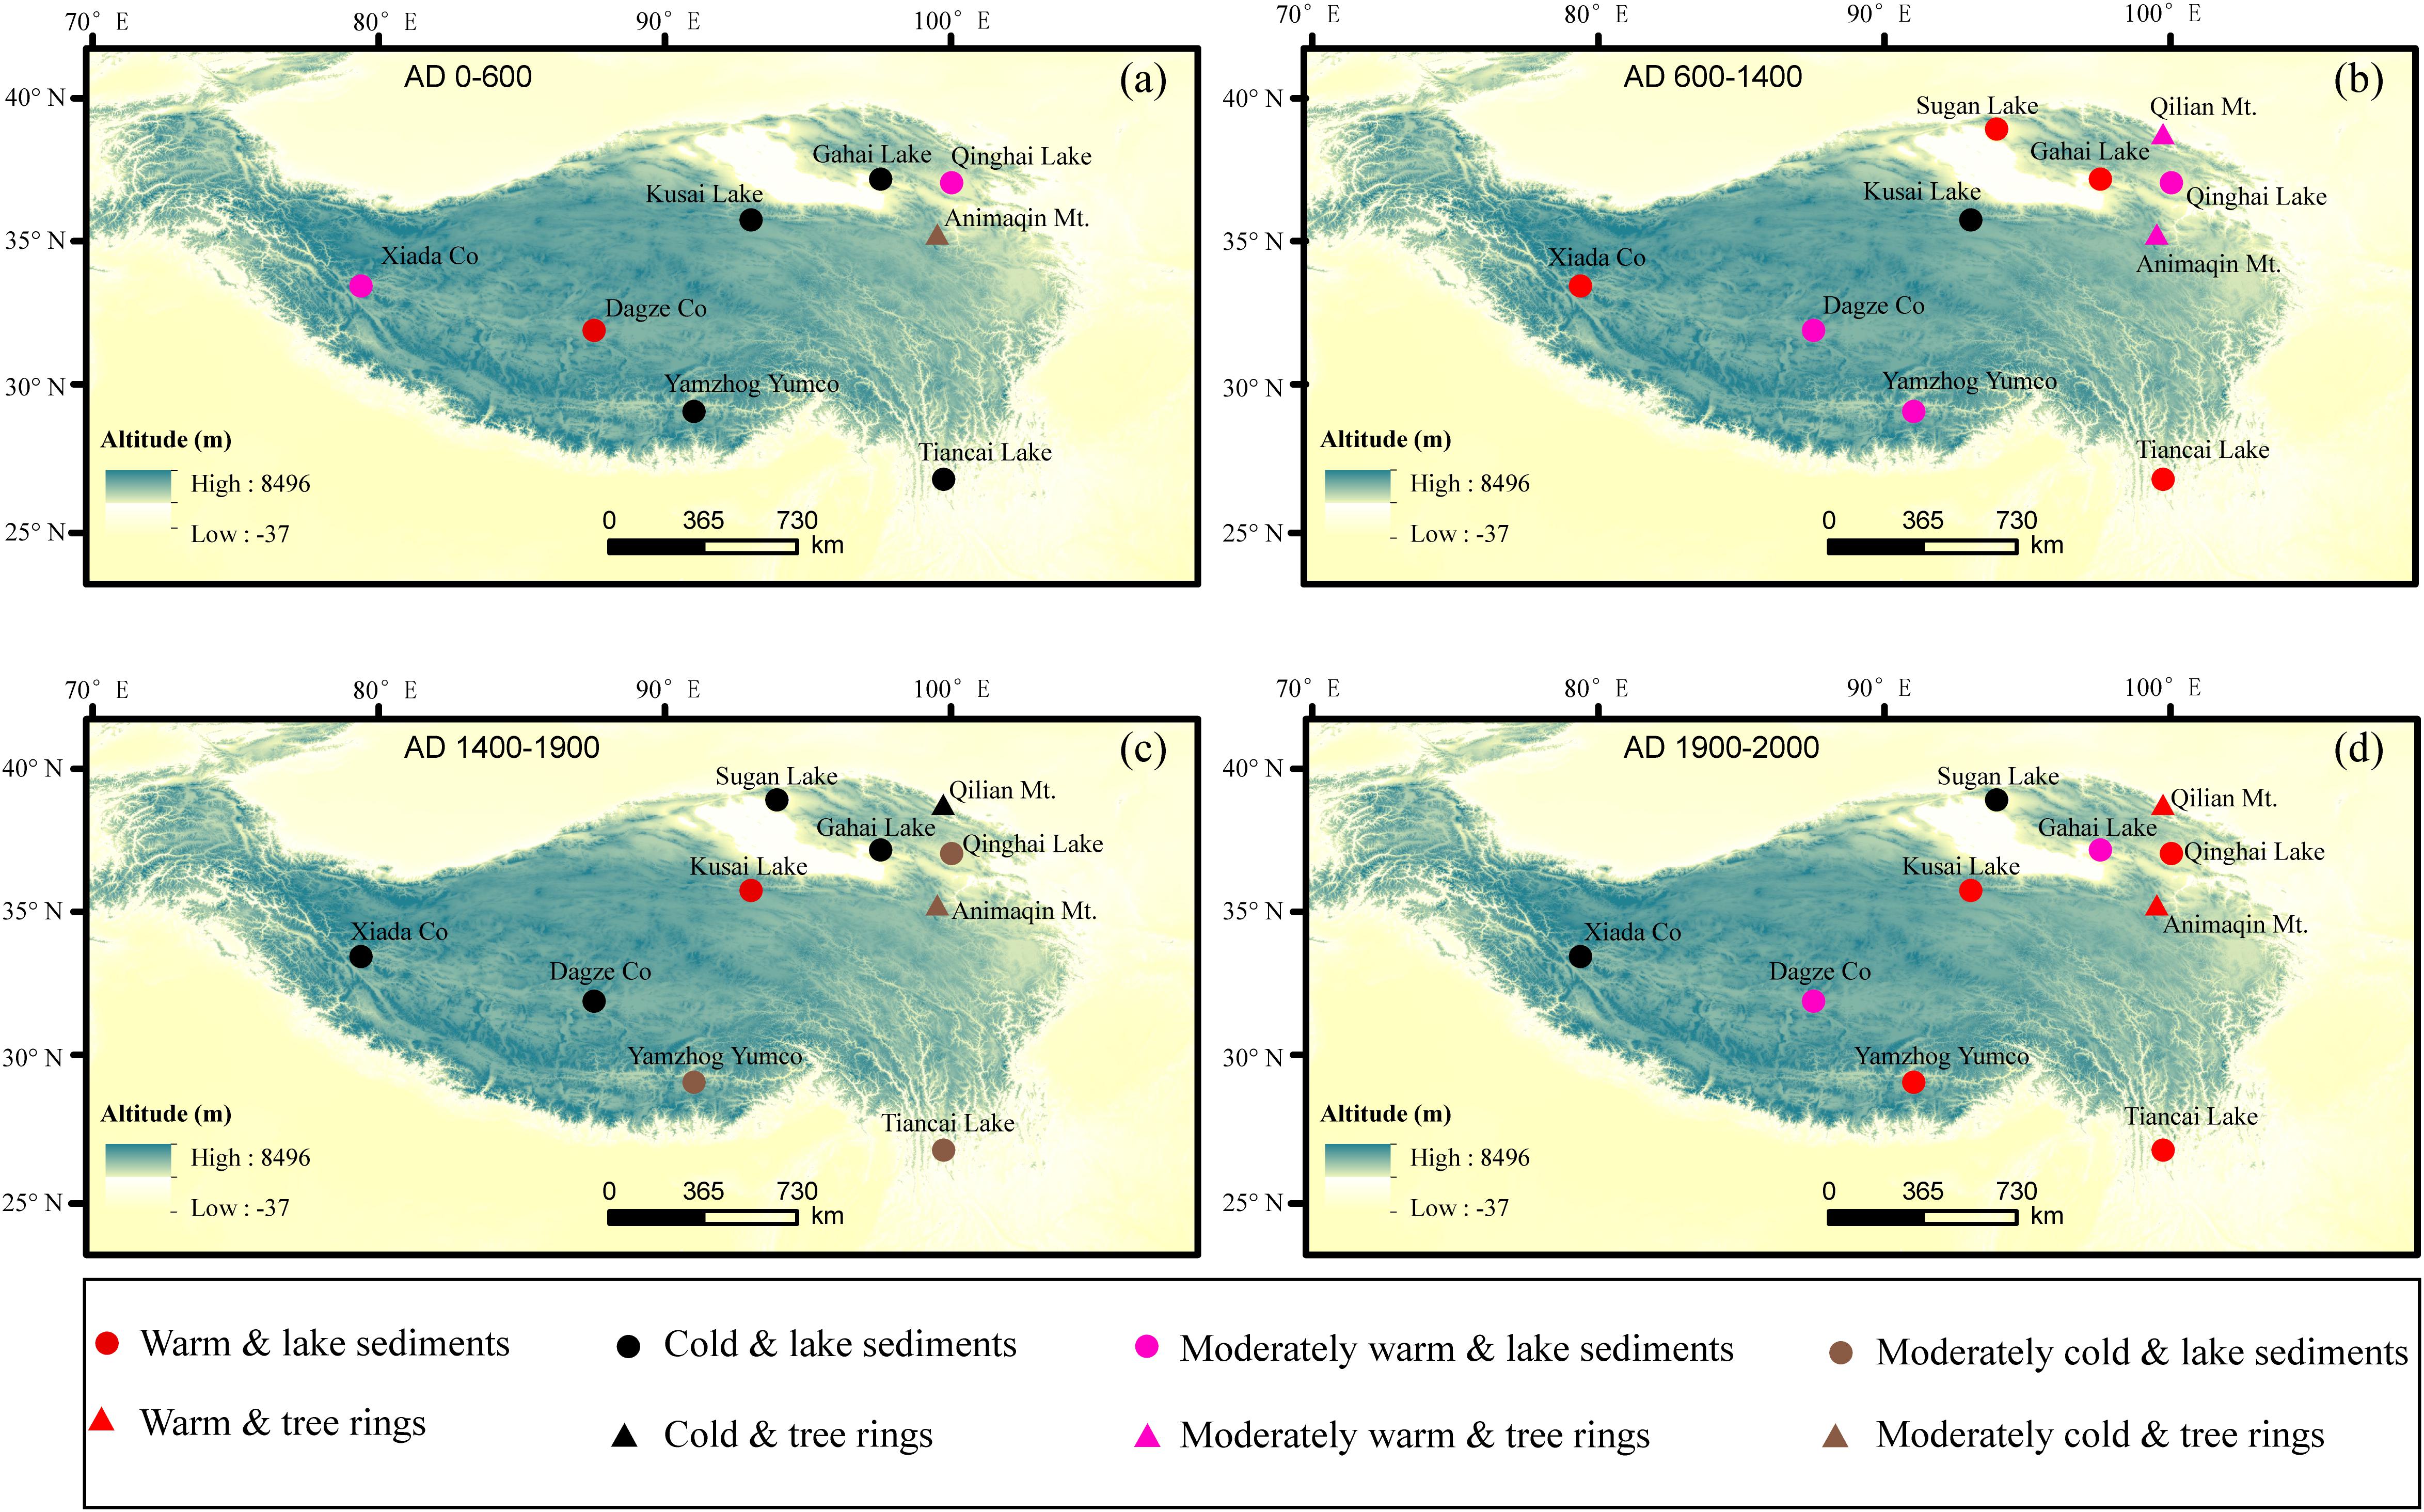
Figure 5. Temperature map based on the 10 quantitative temperature proxy records during 0–600 CE (a), 600–1400 CE (b), 1400–1900 CE (c), and the past century (d). Temperature was classified as warm, cold, moderately warm, and moderately cold.
Figure 5a provides the spatial distribution of temperature anomalies during 0–600 CE across the TP. The pattern indicates that during 0–600 CE, most sites in the northeastern and southern TP displayed a relatively cold (cold or moderately cold) environment. However, Xiada Co on the western TP (Li et al., 2019), Dagze Co on the central TP (Li et al., 2015), and Qinghai Lake on the northeastern TP (Liu et al., 2006) display relatively warm climates during this period. We realized that the resolution of the temperature records at Xiada Co and Qinghai Lake during this period is much coarser, which might have reduced the reliability of the reconstruction results. In addition, the lowest temperature over the past 2000 years in Dagze Co occurred at ∼ 250 CE, and relatively cool intervals were witnessed at 400–550 CE. Thus, the period during 0–600 CE can be generally regarded as a cold period on the majority of the TP.
The spatial patterns of the temperature anomalies during 600–1400 CE are presented in Figure 5b. During this interval, all study sites on the TP show a relatively warm climate (warm or moderately warm), except for the record of Kusai Lake on the northeastern TP (Figure 5b). Thus, the period of 600–1400 CE can be referred to as the warm MCA on the TP. Most sites on the TP also displayed a relatively cold climate (cold or moderately cold) during 1400–1900 CE (LIA) (Figure 5c). It should be noted that the well-known MCA and LIA are not represented consistently in the temperature series from Kusai Lake. This may be due to the lack of regional calibration between branched glycerol dialkyl glycerol tetraethers (bGDGTs) proxies and temperature for the TP (Wu et al., 2013). The temperature record of Kusai Lake is reconstructed using bGDGTs proxies based on a global transfer calibration (Sun et al., 2011), and the relatively low precision of the transfer calibration (RMSE = 0.54°C) may possibly account for the uncertainty in temperature fluctuations in Kusai Lake (Wu et al., 2013). In the future, it will be important to reconstruct more high-quality quantitative palaeotemperature series, which have site-specific proxy-temperature calibrations.
Figure 5d shows the spatial patterns of the temperature anomalies during the 20th century. Most of the study sites (Kusai Lake, Gahai Lake, Dagze Co, Animaqin Mt., Qilian Mt., Qinghai Lake, Yamzhog Yumco and Tiancai Lake) display warm climates during this interval (Figure 5d). However, instead of an obvious warming trend, the alkenone-based summer temperature series in Dagze Co (Li et al., 2015), Gahai and Sugan Lake (He et al., 2013b) display relatively weak warm and even cold climates. It seems that the TP has undergone recent warming, especially in winter but not in summer, which is consistent with meteorological observations on the TP (Liu and Chen, 2000). In addition, the cool environment during the past several 100 years in Xiada Co is unique and similar to those over the southwestern TP, e.g., the western Himalayas (Yadav et al., 2004; Ganjoo, 2009). Such a unique cooling temperature trend is possibly linked to the widespread snow cover and glaciers over the southwestern TP because the melting of the ice and snow absorbs heat and dampens the increasing regional temperature trend (Xu et al., 2012, 2014; Li et al., 2019).
Both geographical location and the type of archives might lead to the potential discrepancies in the temperature variation. As illustrated in Figure 5, there is no big difference between the characteristics of temperature changes recorded by the tree rings and its surrounding lakes, especially during the last 1400 years. Moreover, most quantitative temperature records on the TP during the Common Era are based on lake sediments, which indicate that archive typies may have little impact on regional climate difference in this study.
We compare our composite temperature reconstruction with temperature series constructed previously for the TP (Yang et al., 2003; Hou et al., 2013), China (Yang et al., 2002; Ge et al., 2013), and the Northern Hemisphere (Ljungqvist, 2010). Note that all of the above composite regional temperature series are integrations without seasonal distinction; hence, we choose the “Standardization” composite reconstruction for the comparison. We first compare our composite reconstruction with the previously integrated series for the TP (Yang et al., 2003; Hou et al., 2013). Overall, the three integrated series exhibit similar trends of change (Figures 6D–F). For instance, all temperature series reveal multi-centennial-scale periods, such as the warming MCA, the cooling LIA, and the warming 20th century. However, there are some differences among these temperature series. For example, unlike our integrated temperature series, which shows that temperatures during the MCA were comparable to those in the twentieth century, the reconstructions in Hou et al. (2013) and Yang et al. (2003) suggest that the overall temperature during the MCA was cooler than that in the twentieth century. Moreover, the distinct warm period occurring before 200 CE in the reconstructions of Hou et al. (2013) and Yang et al. (2003) is not obvious in our reconstruction. Further, the MCA started earlier and lasted longer in our reconstruction than in the other two integrated TP series from Hou et al. (2013) and Yang et al. (2003). In addition, the LIA in the 15th–19th centuries presented in both our reconstruction and in that of Hou et al. (2013) was interrupted by a centennial cold interval in the reconstruction of Yang et al. (2003) in the 18th century.
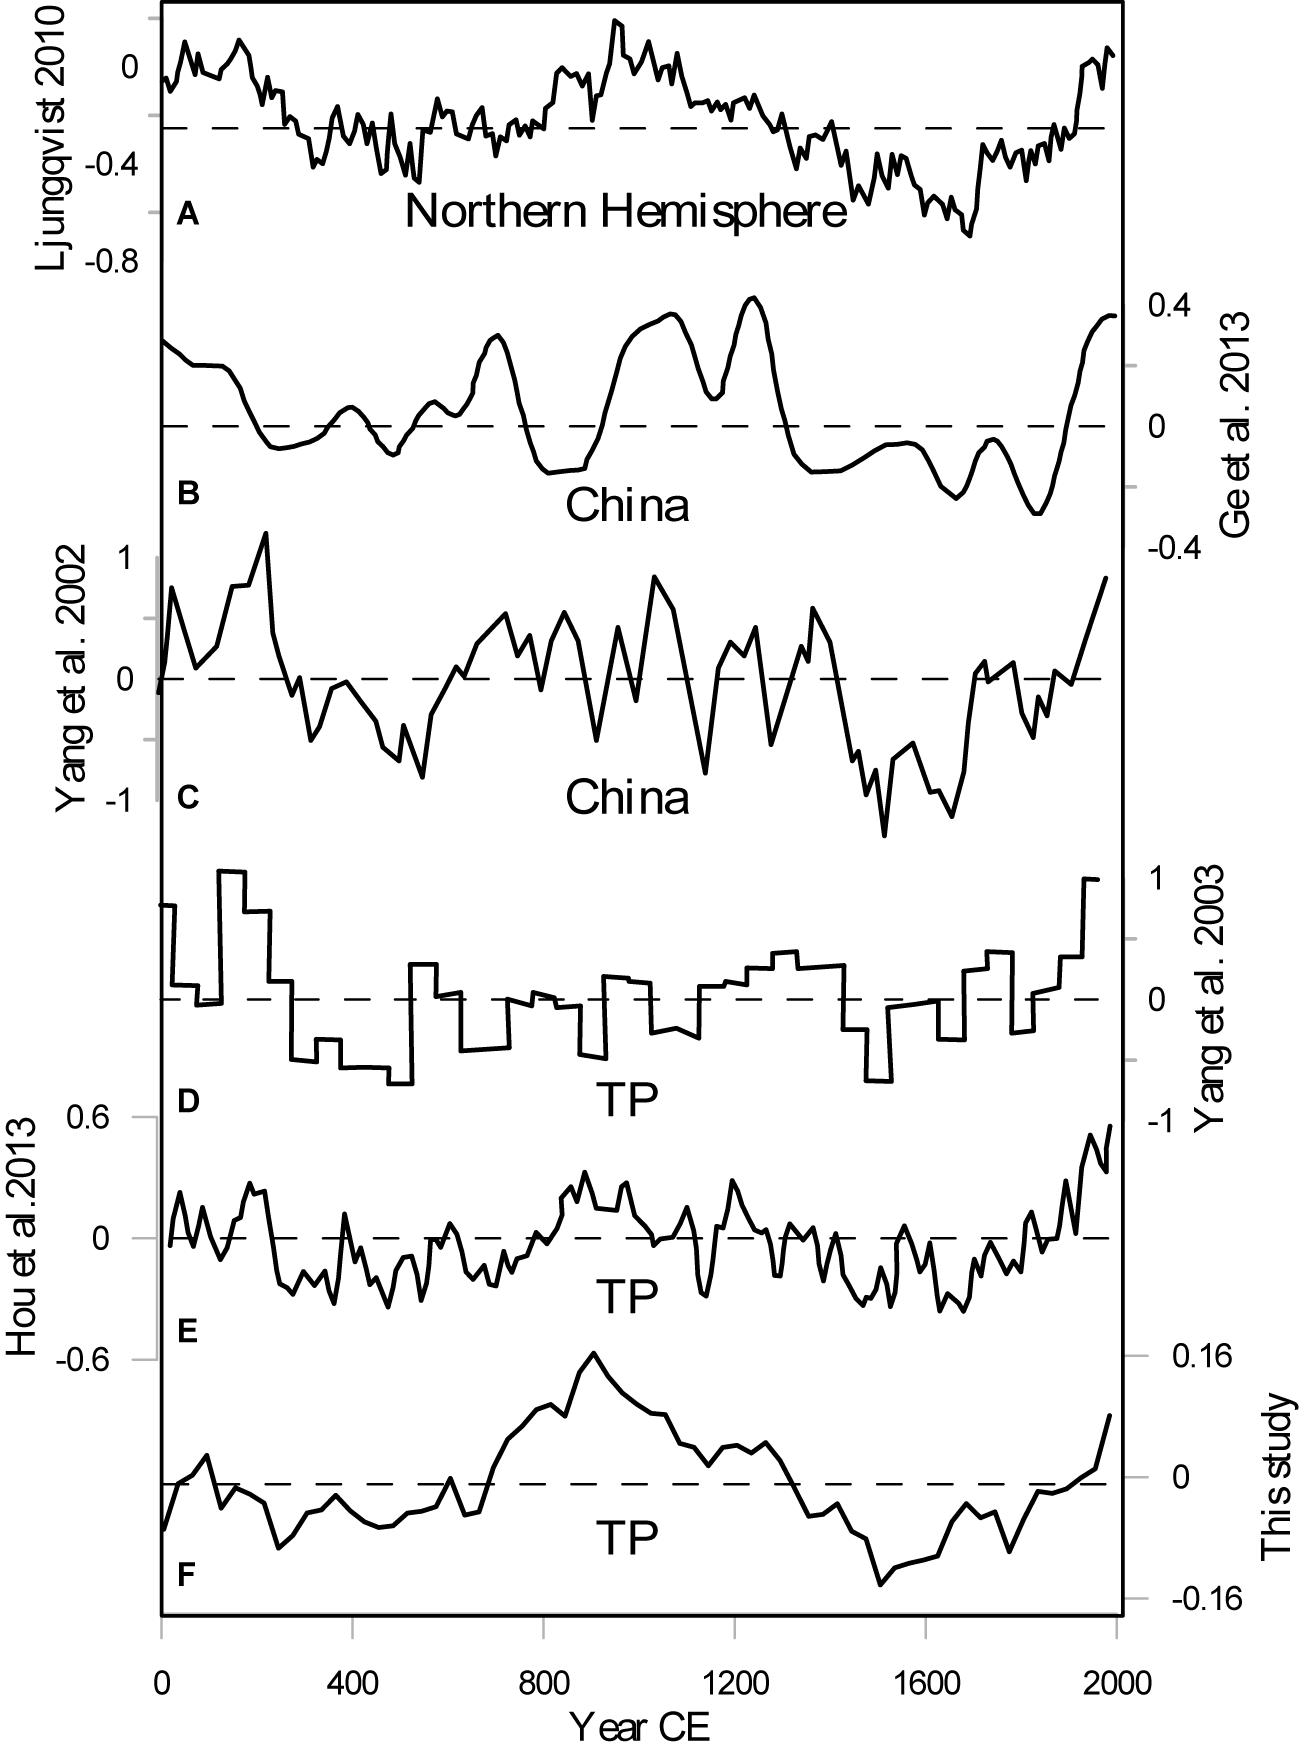
Figure 6. Comparison of the composite temperature record of the TP with other regional composite temperature series. (A) The composite temperature record of the Northern Hemisphere from Ljungqvist (2010). (B) The composite temperature record of China from Ge et al. (2013). (C) The composite temperature record of China from Yang et al. (2002). (D) The composite temperature record of the TP from Yang et al. (2003). (E) The composite temperature record of the TP from Hou et al. (2013). (F) The “Standardization” composite temperature reconstruction for the whole TP in this study.
Although our integrated series and the series in Yang et al. (2003) and Hou et al. (2013) are all related to the temperature variations on the TP during the Common Era, our study has made progress in the criteria of sample selection, such as long time-scales, continuity and quantification. For instance, among the 24 collected temperature series in Hou et al. (2013), only six series cover the first millennium. Many of the climate records in Yang et al. (2003) either have short durations or are discontinuous, which may lead to large uncertainties in the temperature reconstructions during the first millennium. In addition, most temperature records collected in Hou et al. (2013) and Yang et al. (2003) are qualitative rather than quantitative in nature. Notably, our reconstruction covering the most up-to-date quantitative, long and continuous temperature records during the past 2000 years on the TP can provide a more complete picture of the TP temperature history during the Common Era.
We next compare our composite temperature series with those for China (Yang et al., 2002; Ge et al., 2013; Figures 6B,C) and the Northern Hemisphere (Ljungqvist, 2010; Figure 6A). Despite differences in both data coverage and methodology, our record is similar to broader regional temperature reconstructions from China and the Northern Hemisphere. For example, all four temperature series show the MCA, the LIA, and the warming 20th century (Figure 6A–C,F). Another similarity between our reconstruction and the three broader regional temperature reconstructions (Yang et al., 2002; Ljungqvist, 2010; Ge et al., 2013) is that the warming during the 20th century is not unprecedented, as it is comparable to that during the MCA. However, the timing and amplitude of the multi-centennial-scale intervals of relative warming and cooling, such as the MCA and LIA, show differences among various records. Our temperature reconstruction agrees well with the series in Yang et al. (2002) with regard to the timing of warm and cold periods. However, it has some difference from the reconstructions by Ge et al. (2013) and Ljungqvist (2010). For example, the warm MCA at approximately 600–1400 CE present in both our reconstruction and in that of Yang et al. (2002) was interrupted by a centennial cold interval in the reconstruction of Ge et al. (2013) and was shorter in the temperature reconstructions for the Northern Hemisphere (Figure 6A, Ljungqvist, 2010). Moreover, the obvious warming during 0–200 CE in the reconstructions for China and the Northern Hemisphere are not represented in our reconstruction.
It is worth mentioning that our composite temperature record for the whole TP shows that temperatures during the MCA reached or exceeded those of the 20th century. This comparison implies that natural multi-centennial climate variability may be larger than commonly thought and that much of this variability could result from a response to natural changes in radiative forcings (Moberg et al., 2005). However, considering the small number of samples and the fact that the composite series reconstructed in the study extend to only 1985 AD, our result should be interpreted with some caution. Recent studies have reported that the global mean surface temperatures exhibited a slower rate of warming during the first half of the twentieth century than during the second half (Stott et al., 2000; Hegerl et al., 2018; Pages 2k Consortium, 2019). The temperature since the late 1990s is possibly higher than during any previous time in the past two millennia. In addition, the seasonal bias of the temperature reconstructions may partly contribute to the indistinct warming in the 20th century. Nevertheless, our findings highlight the need to improve scenarios for future climate change by also including forced natural variability, which could affect anthropogenic climate change significantly (Moberg et al., 2005).
The temperature series collected from locations in different regions of the TP are based on multiple proxy types, each based on their own principles and procedures and with unique qualities. Thus, the biases inherent to each proxy archive potentially compound the bias in the final composites. Firstly, temperature is very sensitive to elevation. The elevation of the records in this study ranges from 2793 to 4475 m a.s.l (Table 1), which might cause uncertainties in the final reconstruction results. But these uncertainties become less important in this study when investigating the relative magnitude of temperature changes rather than the absolute temperature. Secondly, different records may have different resolutions. In this study, the resolution of temperature series based on tree rings is much higher than that of temperature series based on lake sediments. To facilitate integration, proxy records with resolutions coarser than 1 year must be interpolated to an annual resolution and then smoothed by 30-year averaging. In this way, the ability of these data to accurately record short-term climate responses to large volcanic events may be reduced (Wilson et al., 2016). To evaluate the extent to which different archives carry a common overall signal, composites were calculated for each of the two proxy types (lake sediments and tree-rings) (Figures 7B,C). The composites all show warming trends during the last decades since the end of the LIA. The major difference between the resulting integrated curves is that MCA is not conspicuous in the tree-ring based composite (Figure 7C). This may be because tree-ring data with an annual resolution have difficulty in reliably reproducing centennial-scale temperature variability (Cook and Peters, 1997; Moberg et al., 2005). However, there is no large difference between the composite series based on all ten temperature series (Figure 7A) and the one based on only the eight lake sediment series (Figure 7B). Thus, the two tree-ring records may not bias the final integration very much, considering the small portion of tree-ring records among all the records for the TP. In the future, when more quantitative temperature records with both high and low resolution are available for the TP, advanced methods such as wavelet transform (Moberg et al., 2005) are suggested to integrate the temperature series in order to reduce the influence of different resolutions on the final integration.
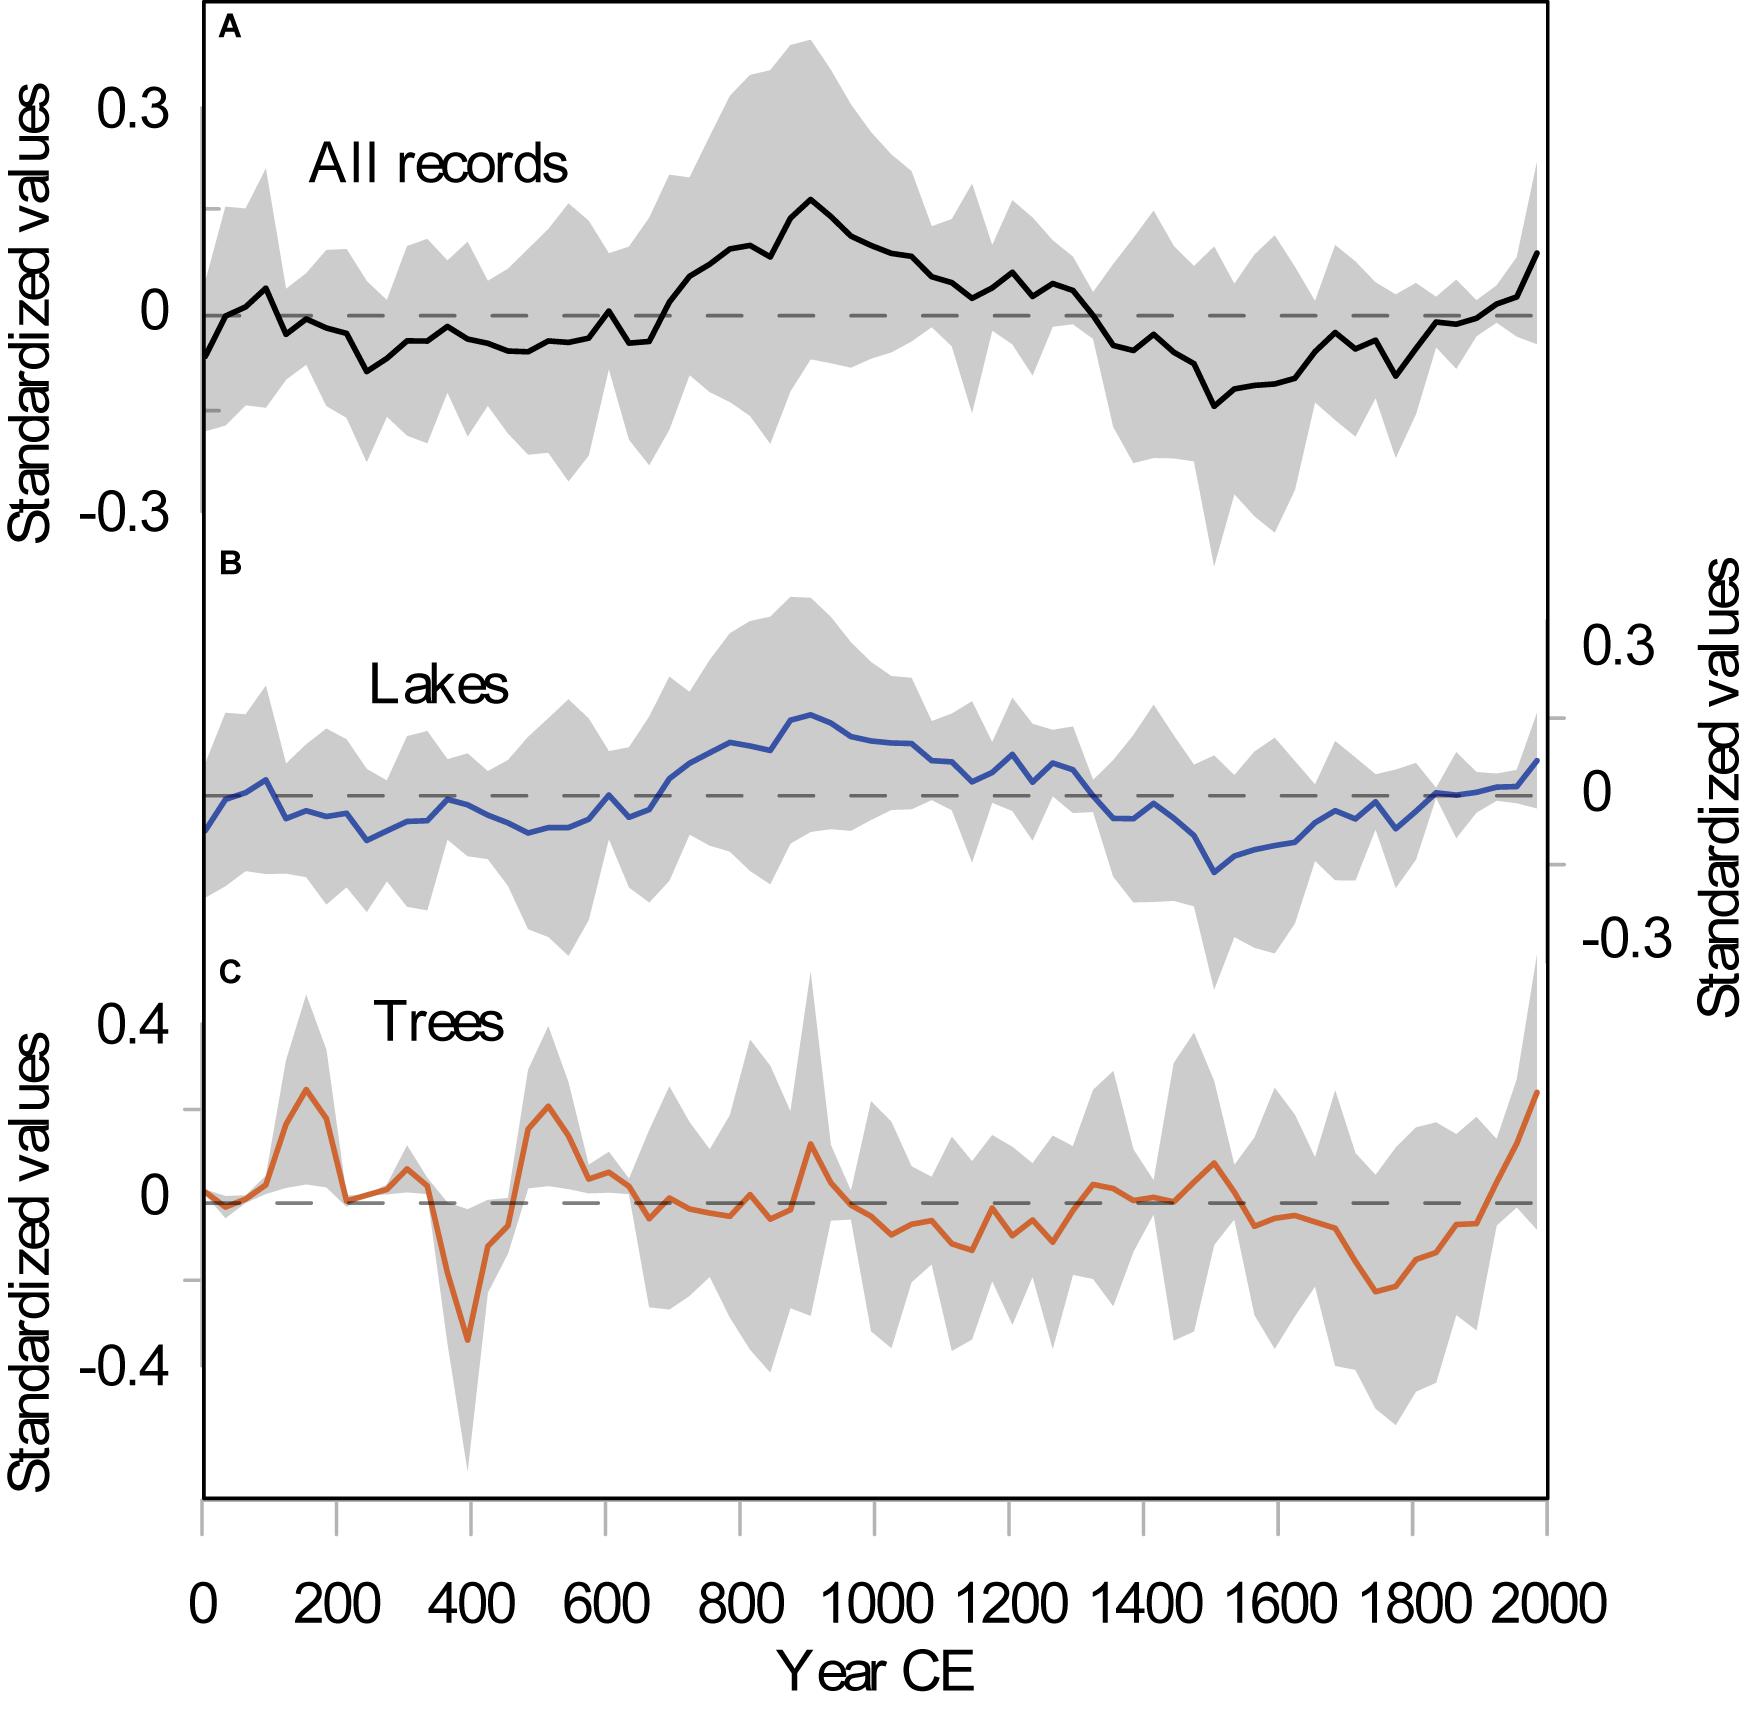
Figure 7. Composite temperature series over the TP based on different archives. (A) The “Standardization” composite temperature reconstruction for the whole TP based on all 10 selected individual temperature series. (B) The composite temperature reconstruction based on the eight lake sediment series on the TP. (C) The composite temperature reconstruction based on two tree-ring series on the TP. The light gray shading represents the standard deviation of the integrated temperature series.
Moreover, the data coverage during the Common Era is sparse and unevenly distributed across the TP (Figures 1, 2). Based on our criteria, only 10 quantitative temperature records are available. Most of the records are concentrated on the northeastern TP, with very few records on the western and southern TP. This may constitute certain uncertainties in the final integration and affect the spatial representation of reconstruction results (Anchukaitis et al., 2017). In view of this, much more effort, however, is needed to confirm our findings that the annual and summer temperature changes in the TP were different in the past. Thus, an important object for further research must be to assess the difference in the annual and summer temperature changes on the TP in the past. An important step toward doing so is to use shorter but more numerous high-quality proxy time series from the same limited area to demonstrate their ability to reproduce centennial variations in summer or annual temperature.
In spite of this, our reconstruction covering the most up-to-date quantitative, long, seasonal, and continuous temperatures over the past 2000 years on the TP can better showcase the latest research and shed light on the more refined processes of climate change. In the future, more high-quality quantitative and seasonal palaeotemperature records will be urgently needed, especially in the western and southern parts of the plateau, to understand the large-scale pre-industrial temperature variability on the TP.
The multi-centennial-scale temperature fluctuations during the late Holocene over the TP are potentially related to centennial-scale variations in solar activity. The total solar irradiance (TSI) records (Figure 8B) derived from cosmic radiation records produced by polar ice cores and global tree rings were used as a proxy of solar activity (Steinhilber et al., 2012). Generally, warmer temperatures on the TP correspond to higher solar irradiance and vice versa. The warm period over the TP during the warm MCA and the twentieth-century appears to correspond to the higher TSI, and the cool LIA coincides with the lower TSI. In particular, potentially corresponding temperature decreases during the LIA period could be identified for the solar minimums of Spörer (AD 1460–1550), Maunder (AD 1645–1715), and Dalton (AD 1795–1823). Therefore, there appears to be a possible link between solar irradiance and temperature variability on the TP during the late Holocene, as reported in previous studies (Shindell et al., 2003; Zhao et al., 2009, 2011; He et al., 2013a; Li et al., 2015).
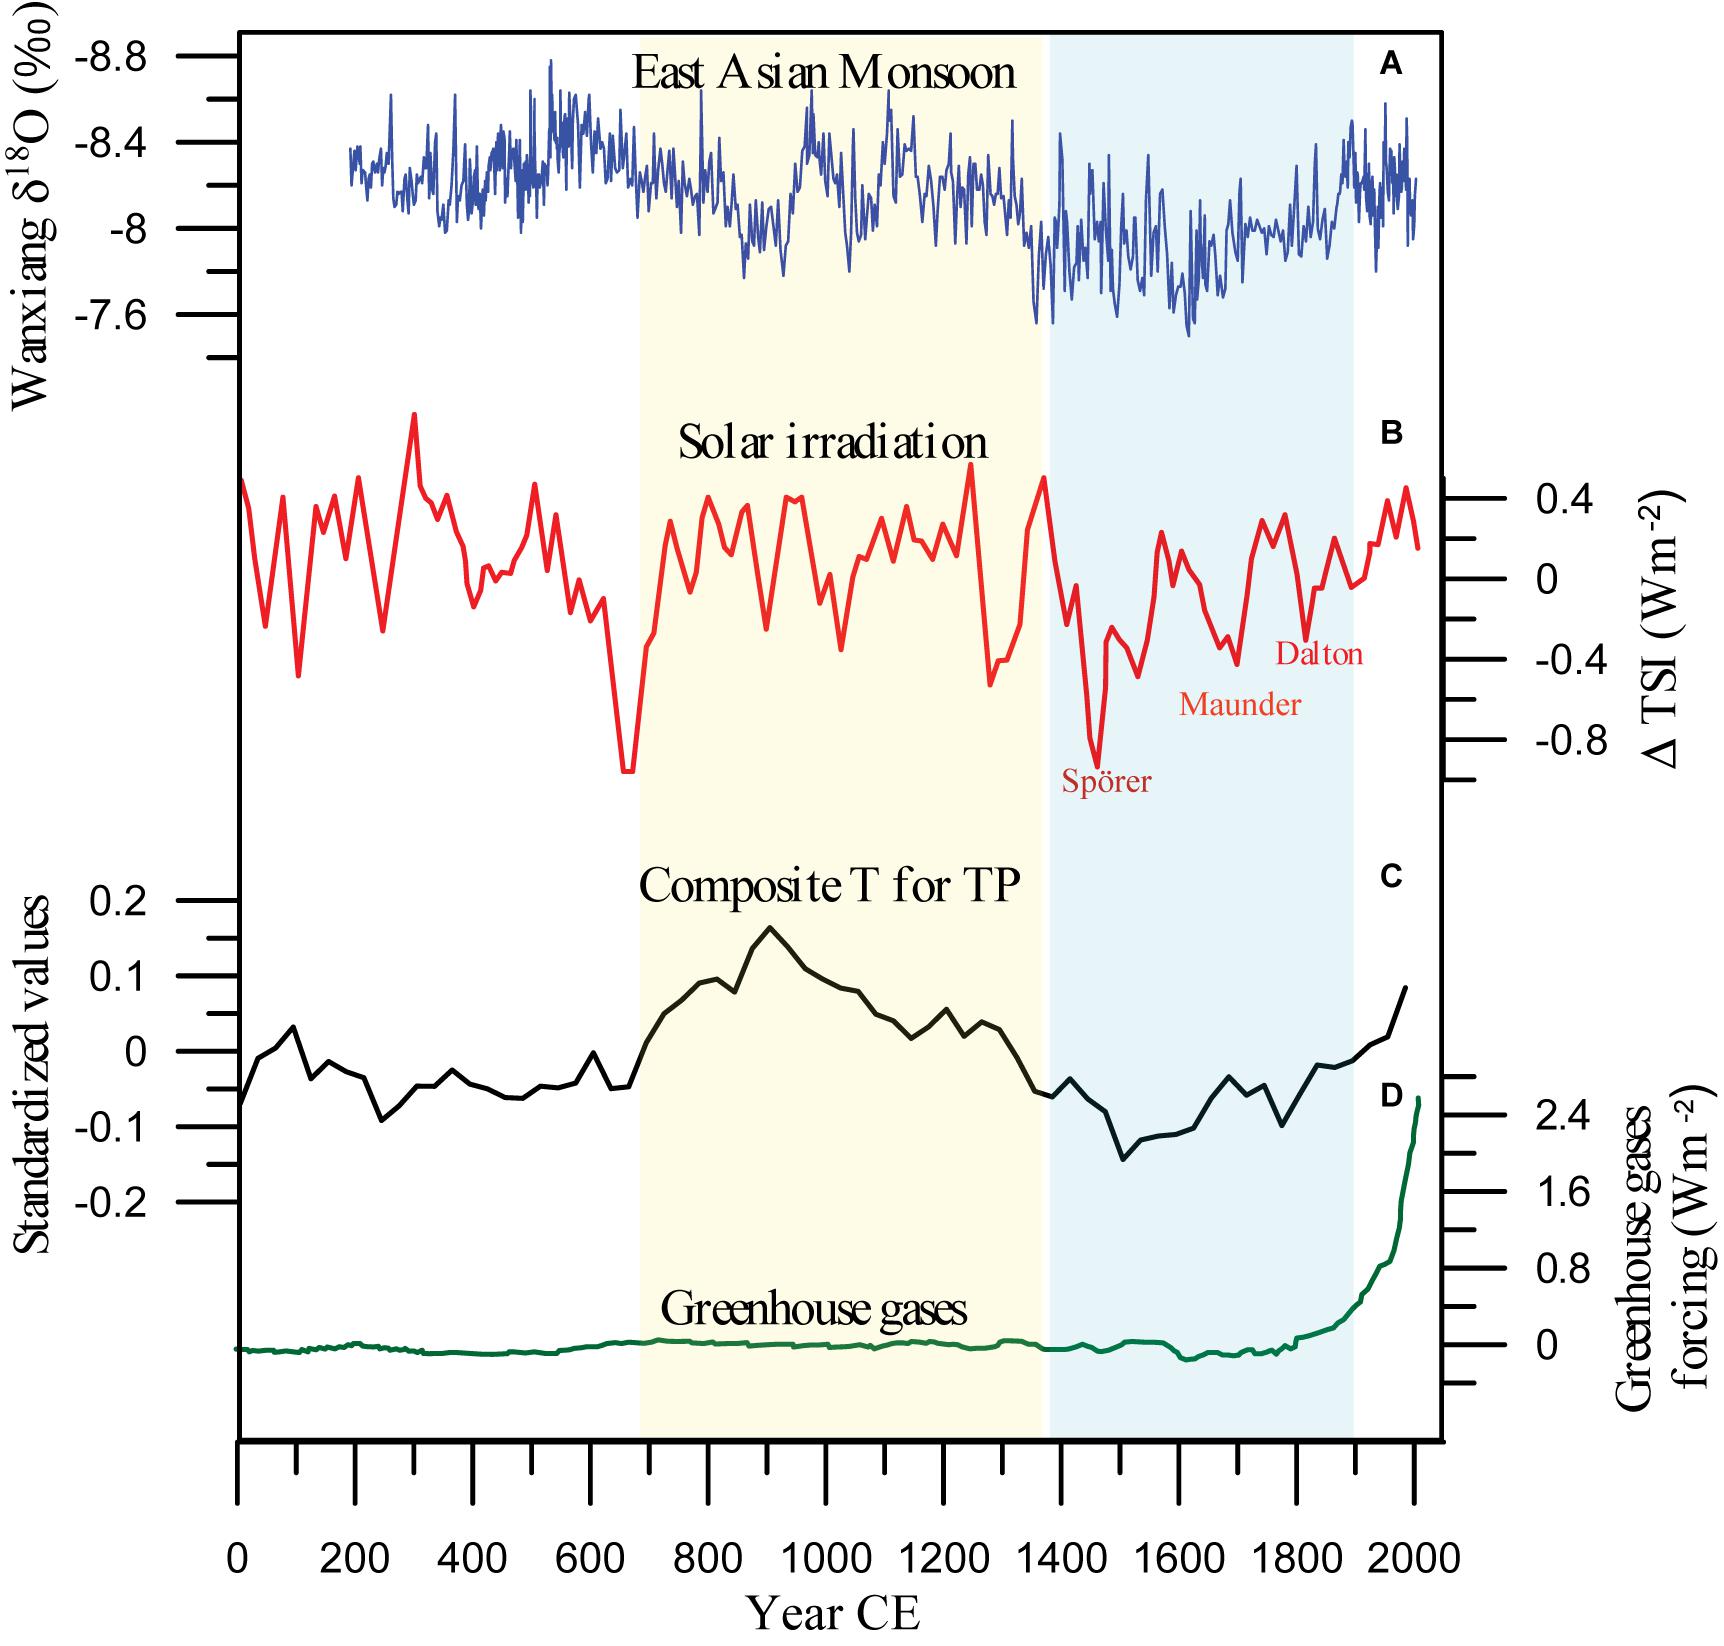
Figure 8. Major climate forcings for climate change on the TP during the past two millennia. (A) East Asian monsoon variation recorded by the δ18O series from Wanxiang Cave (Zhang et al., 2008). (B) Reconstructed total solar irradiance (Steinhilber et al., 2012). (C) The “Standardization” composite temperature reconstruction for the whole TP based on all 10 selected individual temperature series in this study. (D) Greenhouse gas forcing (Crowley, 2000).
In addition, temperature changes during the Common Era on the TP are associated with Asian monsoon activity. Solar variations could directly affect the land-sea contrast that drives the monsoon (Gupta et al., 2003). Higher solar irradiance would intensify the summer monsoon (Zhang et al., 2008), thus providing a warm and wet climate on the TP. The stalagmite δ18O record from Wanxiang Cave (Figure 8A) provides a history of Asian summer monsoon variation, with depleted stalagmite δ18O values indicating strengthened monsoon intensity. During the MCA, the depleted δ18O of stalagmites indicates strengthened monsoon intensity, which is connected to the warm climate on the TP. In contrast, the notably enriched stalagmite δ18O values, which are consistent with the cool LIA on the TP, reflect decreased monsoon intensity.
Volcanic eruptions have been proposed as another primary forcing for climate variations at decadal and centennial scales during the past 2000 years (Crowley, 2000; Pages 2k Consortium, 2013, 2019; Veale and Endfield, 2016; Feng et al., 2019). A reconstruction of global volcanic aerosol forcing suggests that there were more eruptions during the first 600 years and during the LIA, and fewer eruptions during the MCA (Sigl et al., 2015). Moreover, studies showed that 15 of 21 volcanic event years in the past millennium corresponded to cold years in the tree-ring-based minimum temperature reconstruction on Qilian Mt (Zhang et al., 2014), indicating the impact of volcanic eruptions on some of the cold events on the TP.
The “Standardization” composite, which is based on all 10 quantitative temperature series on the TP, suggests that the recent warming century was not unprecedented and was slightly colder than the MCA. This implies that natural multi-centennial climate variability may be larger than commonly thought, and the recent warming century may be connected to natural changes in increased solar irradiation as well as late 19th-century monsoon strengthening (Zhang et al., 2008). However, as mentioned before, the post-1990 warming in the instrumental record seems to be outside the range of natural late-Holocene temperature variability, which may correspond to the unprecedented increase in greenhouse gases (Figure 8D).
The spatio-temporal characteristics of temperature variations on the TP during the past two millennia have been analyzed based on currently available quantitative and continuous temperature records. The main conclusions can be summarized as follows:
(1) Currently, quantitative temperature records on the TP during the late Holocene are scarce. Most of the records are concentrated on the northeastern TP, with very few records on the western and southern TP. Reconstructing more high-quality quantitative palaeotemperature records is urgent, especially in the western and southern parts of the plateau.
(2) Three different composite temperature records for the TP during the past 2000 years were established, namely, the “Standardization” composite, the “MAAT anomaly” composite, and the “MST anomaly” composite. The “Standardization” composite series, which is based on all the collected quantitative temperature records, exhibits a trend of changes very similar to that of the “MAAT anomaly” composite series but quite different from the variations in the “MST anomaly” composite series, which might indicate strong seasonality of temperature variations on the TP. Although all three composite temperature records reveal the existence of the MCA and the LIA, the times of these multi-centennial-scale periods of relative warmth and cooling and their temperature amplitudes differ. Our findings suggest that the 20th century warming on the TP may have been characterized by a rapid winter temperature increase, while summer temperature at this time displayed a weak variation trend.
(3) Spatial analysis suggests that compared to the relatively consistent signal marking a warm TP during the MCA (600–1400 CE) and a cold TP during the LIA (1400–1900 CE), spatial differences in temperature variations on the TP during 0–600 CE and during the 20th century exist. Seasonal bias in the temperature proxies and other local factors, such as ice and snow melting, might partly explain the above spatial difference in temperature variations.
(4) Our “Standardization” composite series is basically the same as the temperature series for the TP, China and Northern Hemisphere previously constructed by other scholars. All temperature series indicate the MCA, the LIA, and the warming 20th century, although the exact timing and amplitude of these multi-centennial-scale periods of relative warming and cooling are different.
(5) Many factors, such as the number of climate records collected and seasonal biases in temperature proxies, might cause uncertainty in the reconstructed series. We highlight the crucial importance of developing more high-quality quantitative palaeotemperature series on the TP, which have clear seasonality, site-specific proxy-temperature calibrations, and high resolutions. Moreover, to assess the difference in the annual and summer temperature changes on the TP in the past, shorter but more numerous proxy time series from the same limited area should be first used to demonstrate their ability to reproduce centennial variations in summer or annual temperature.
The datasets generated for this study are available on request to the corresponding author.
XL and JH designed the research. XL drafted the manuscript and prepared the Figures 2, 6. XL and YZ collected and processed the temperature data. YZ, MW, JY, WX, and YH contributed to the interpretation of the results. BF prepared the Figures 1, 3–5. All authors contributed to the article and approved the submitted version.
This work was supported by the Strategic Priority Research Program of the Chinese Academy of Sciences (Grant No. XDA 20090000), the National Natural Science Foundation of China (Grant Nos. 41901105, 41630529, 41903069), and the Nanhu Scholars Program for Young Scholars of Xinyang Normal University.
The authors declare that the research was conducted in the absence of any commercial or financial relationships that could be construed as a potential conflict of interest.
We thank the two reviewers for providing insightful comments which improved the manuscript.
The Supplementary Material for this article can be found online at: https://www.frontiersin.org/articles/10.3389/feart.2020.00360/full#supplementary-material
Aichner, B., Feakins, S. J., Lee, J. E., Herzschuh, U., and Liu, X. (2015). High-resolution leaf wax carbon and hydrogen isotopic record of the late Holocene paleoclimate in arid Central Asia. Clim. Past 11, 619–633. doi: 10.5194/cp-11-619-2015
Anchukaitis, K. J., Wilson, R., Briffa, K. R., Büntgen, U., Cook, E. R., D’Arrigo, R., et al. (2017). Last millennium northern hemisphere summer temperatures from tree rings: Part II, spatially resolved reconstructions. Quat. Sci. Rev. 163, 1–22. doi: 10.1016/j.quascirev.2017.02.020
Braconnot, P., Harrison, S. P., Kageyama, M., Bartlein, P. J., Masson-Delmotte, V., Abe-Ouchi, A., et al. (2012). Evaluation of climate models using palaeoclimatic data. Nat. Clim. Change 2, 417–424. doi: 10.1038/nclimate1456
Cai, D., You, Q., Fraedrich, K., and Guan, Y. (2017). Spatiotemporal temperature variability over the Tibetan Plateau: altitudinal dependence associated with the global warming hiatus. J. Clim. 30, 969–984. doi: 10.1175/jcli-d-16-0343.1
Chen, F., Zhang, Y., Shao, X., Li, M., and Yin, Z.-Y. (2016). A 2000-year temperature reconstruction in the animaqin mountains of the tibet plateau. China. Holocene 26, 1904–1913. doi: 10.1177/0959683616646187
Chen, Y., Yang, K., He, J., Qin, J., Shi, J., Du, J., et al. (2011). Improving land surface temperature modeling for dry land of China. J. Geophys. Res. Atmos. 116, 999–1010.
Chu, G., Sun, Q., Wang, X., Liu, M., Lin, Y., Xie, M., et al. (2011). Seasonal temperature variability during the past 1600 years recorded in historical documents and varved lake sediment profiles from northeastern China. Holocene 22, 785–792. doi: 10.1177/0959683611430413
Cook, E. R., and Peters, K. (1997). Calculating unbiased tree-ring indices for the study of climatic and environmental change. Holocene 7, 361–370. doi: 10.1177/095968369700700314
Crowley, T. J. (2000). Causes of climate change over the past 1000 Years. Science Adv. 289, 270–277. doi: 10.1126/science.289.5477.270
Crowley, T. J., and Lowery, T. S. (2000). How warm was the medieval warm period? Ambio 29, 51–54. doi: 10.1579/0044-7447-29.1.51
Ding, Y., Zhang, S., Zhao, L., Li, Z., and Kang, S. (2019). Global warming weakening the inherent stability of glaciers and permafrost. Sci. Bull. 64, 245–253. doi: 10.1016/j.scib.2018.12.028
Feng, X., Zhao, C., D’andrea, W. J., Liang, J., Zhou, A., and Shen, J. (2019). Temperature fluctuations during the common Era in subtropical southwestern China inferred from brGDGTs in a remote alpine lake. Earth Planet. Scie. Lett. 510, 26–36. doi: 10.1016/j.epsl.2018.12.028
Ganjoo, R. K. (2009). Do Himalayan Glaciers Defy Global Warming? Case Studies From NW Himalaya, India. American Geophysical Union. Fall Meeting, Abstract #GC13A-0726.
Ge, Q., Zheng, J. Y., Hao, Z. X., and Liu, H. L. (2013). General characteristics of climate changes during the past 2000 years in China. Sci. China Earth Sci. 56, 321–329. doi: 10.1007/s11430-012-4370-y
George, S. S. (2014). An overview of tree-ring width records across the Northern Hemisphere. Quat. Sci. Rev. 95, 132–150. doi: 10.1016/j.quascirev.2014.04.029
Guo, C., Ma, Y., Meng, H., Hu, C., Li, D., Liu, J., et al. (2018). Changes in vegetation and environment in Yamzhog Yumco Lake on the southern Tibetan Plateau over past 2000 years. Palaeogeogr. Palaeoclimatol. Palaeoecol. 501, 30–44. doi: 10.1016/j.palaeo.2018.04.005
Gupta, A. K., Anderson, D. M., and Overpeck, J. T. (2003). Abrupt changes in the Asian southwest monsoon during the Holocene and their links to the North Atlantic Ocean. Nature 421, 354–357. doi: 10.1038/nature01340
He, Y., Liu, W., Zhao, C., Wang, Z., Wang, H., Liu, Y., et al. (2013a). Solar influenced late holocene temperature changes on the northern Tibetan Plateau. Chin. Scie. Bull. 58, 1053–1059. doi: 10.1007/s11434-012-5619-8
He, Y., Zhao, C., Wang, Z., Wang, H., Song, M., Liu, W., et al. (2013b). Late Holocene coupled moisture and temperature changes on the northern Tibetan Plateau. Quat. Sci. Rev. 80, 47–57. doi: 10.1016/j.quascirev.2013.08.017
Hegerl, G. C., Brönnimann, S., Schurer, A., and Cowan, T. (2018). The early 20th century warming: anomalies, causes, and consequences. Wiley Interdiscip. Rev. Clim. Change 9:e522. doi: 10.1002/wcc.522
Hou, G., Chongyi, E., Liu, X., Zeng, F. J. T., and Climatology, A. (2013). Reconstruction of integrated temperature series of the past 2,000 years on the Tibetan Plateau with 10-year intervals. Theor. Appl. Climatol. 113, 259–269. doi: 10.1007/s00704-012-0783-y
Hou, J., Huang, Y., Zhao, J., Liu, Z., Colman, S., and An, Z. (2015). Large Holocene summer temperature oscillations and impact on the peopling of the northeastern Tibetan Plateau. Geophys. Res. Lett. 43, 1323–1330. doi: 10.1002/2015gl067317
Immerzeel, W. (2008). Historical trends and future predictions of climate variability in the Brahmaputra basin. Int. J. Climatol. 28, 243–254. doi: 10.1002/joc.1528
Immerzeel, W. W., Van Beek, L. P. H., and Bierkens, M. F. P. (2010). Climate change will affect the Asian water towers. Science 328, 1382–1385. doi: 10.1126/science.1183188
IPCC (2013). IPCC, 2013: climate change 2013: the physical science basis. contribution of working group i to the fifth assessment report of the intergovernmental panel on climate change. Computat. Geometry 18, 95–123.
Jones, P. D., Briffa, K. R., Barnett, T. P., and Tett, S. F. B. (1998). High-resolution palaeoclimatic records for the last millennium: interpretation, integration and comparison with general circulation model control-run temperatures. Holocene 8, 455–471. doi: 10.1191/095968398667194956
Jones, P. D., Briffa, K. R., Osborn, T. J., Lough, J. M., Van Ommen, T. D., Vinther, B. M., et al. (2009). High-resolution palaeoclimatology of the last millennium: a review of current status and future prospects. Holocene 19, 3–49. doi: 10.1177/0959683608098952
Li, X., Liang, J., Hou, J., and Zhang, W. (2015). Centennial-scale climate variability during the past 2000 years on the central Tibetan Plateau. Holocene 25, 892–899. doi: 10.1177/0959683615572852
Li, X., Wang, M., and Hou, J. (2019). Centennial-scale climate variability during the past 2000 years derived from lacustrine sediment on the western Tibetan Plateau. Q. Int. 510, 65–75. doi: 10.1016/j.quaint.2018.12.018
Liu, X., Cheng, Z., Yan, L., and Yin, Z. Y. (2009). Elevation dependency of recent and future minimum surface air temperature trends in the Tibetan Plateau and its surroundings. Global Planet. Change 68, 164–174. doi: 10.1016/j.gloplacha.2009.03.017
Liu, Y., An, Z. S., Linderholm, H. W., Chen, D. L., Song, H. M., Cai, Q. F., et al. (2009). Annual temperatures during the last 2485 years in the mid-eastern Tibetan Plateau inferred from tree rings. Sci. China 52, 348–359. doi: 10.1007/s11430-009-0025-z
Liu, X., Herzschuh, U., Wang, Y., Kuhn, G., and Yu, Z. (2014). Glacier fluctuations of Muztagh Ata and temperature changes during the late Holocene in westernmost Tibetan Plateau, based on glaciolacustrine sediment records. Geophys. Res. Lett. 41, 6265–6273. doi: 10.1002/2014gl060444
Liu, X. D., and Chen, B. D. (2000). Climatic warming in the Tibetan plateau during recent decades. Int. J. Climatol. 20, 1729–1742. doi: 10.1002/1097-0088(20001130)20:14<1729::aid-joc556>3.0.co;2-y
Liu, Z., Henderson, A. C. G., and Huang, Y. (2006). Alkenone-based reconstruction of late-Holocene surface temperature and salinity changes in Lake Qinghai, China. Geophys. Res. Lett. 33:L09707.
Liu, Z., Meixue, Y., Guoning, W., and Xuejia, W. (2017). The Spatial and Temporal Variation of Temperature in the Qinghai-Xizang (Tibetan) Plateau during 1971–2015. Atmosphere 8:214. doi: 10.3390/atmos8110214
Liu, Z., Zhu, J., Rosenthal, Y., Zhang, X., Otto-Bliesner, B. L., Timmermann, A., et al. (2014). The Holocene temperature conundrum. Proc. Natl. Acad. Sci. U.S.A. 111, E3501–E3505.
Ljungqvist, F. C. (2010). A new reconstruction of temperature variability in the extra-tropical Northern Hemisphere during the last two millennia. Geogr. Ann. 92, 339–351. doi: 10.1111/j.1468-0459.2010.00399.x
Mann, M. E., Zhang, Z., Hughes, M. K., Bradley, R. S., Miller, S. K., Rutherford, S., et al. (2008). Proxy-based reconstructions of hemispheric and global surface temperature variations over the past two millennia. Proc. Natl. Acad. Sci. U.S.A. 105, 13252–13257. doi: 10.1073/pnas.0805721105
Moberg, A., Dmitry, M. S., Holmgren, K., Nina, M. D., Karlénw, W., and Stein-Erik, L. (2005). Highly variable northern hemisphere temperatures reconstructed from low- and high-resolution proxy data. Nature 433, 613–617. doi: 10.1038/nature03265
Ojala, A. E. K., Alenius, T., Seppa, H., and Giesecke, T. J. H. (2008). Integrated varve and pollen-based temperature reconstruction from Finland: evidence for Holocene seasonal temperature patterns at high latitudes. Holocene 18, 529–538. doi: 10.1177/0959683608089207
Pages 2k Consortium (2013). Continental-scale temperature variability during the past two millennia. Nat. Geosci. 6, 339–346. doi: 10.1038/ngeo1797
Pages 2k Consortium (2019). Consistent multidecadal variability in global temperature reconstructions and simulations over the Common Era. Nat. Geosci. 12, 643–649. doi: 10.1038/s41561-019-0400-0
Patterson, W. P., Dietrich, K. A., Holmden, C., and Andrews, J. T. (2010). Two millennia of North Atlantic Seasonality and implications for Norse colonies. Proc. Natl. Acad. Sci. U.S.A. 107, 5306–5310. doi: 10.1073/pnas.0902522107
Shindell, D. T., Schmidt, G. A., Miller, R. L., and Mann, M. E. (2003). Volcanic and solar forcing of climate change during the preindustrial Era. J. Clim. 16, 4094–4107. doi: 10.1175/1520-0442(2003)016<4094:vasfoc>2.0.co;2
Sigl, M., Winstrup, M., Mcconnell, J. R., Welten, K. C., Plunkett, G., Ludlow, F., et al. (2015). Timing and climate forcing of volcanic eruptions for the past 2,500 years. Nature 523, 543–549.
Snyder, C. W. (2010). The value of paleoclimate research in our changing climate. Clim. Change 100, 407–418. doi: 10.1007/s10584-010-9842-5
Steinhilber, F., Jose, A. A., Beer, J., Brunner, I., Christl, M., Fischer, H., et al. (2012). 9,400 years of cosmic radiation and solar activity from ice cores and tree rings. Proc. Natl. Acad. Sci. U.S.A. 109, 5967–5971. doi: 10.1073/pnas.1118965109
Stott, P. A., Tett, S. F. B., Jones, G. S., Allen, M. R., Mitchell, J. F. B., and Jenkins, G. J. (2000). External Control of 20th century temperature by natural and anthropogenic Forcings. Sci. Adv. 290, 2133–2137. doi: 10.1126/science.290.5499.2133
Sun, Q., Chu, G., Liu, M., Xie, M., Li, S., Ling, Y., et al. (2011). Distributions and temperature dependence of branched glycerol dialkyl glycerol tetraethers in recent lacustrine sediments from China and Nepal. J. Geophys. Res. 116:G01008.
Thompson, L. G., Mosley-Thompson, E., Davis, M. E., Lin, P.-N., Henderson, K., and Mashiotta, T. A. (2003). “Tropical glacier and ice core evidence of climate change on annual to millennial time scales,” in Climate Variability and Change in High Elevation Regions: Past, Present & Future, ed. H. F. Diaz (Berlin: Springer), 137–155. doi: 10.1007/978-94-015-1252-7_8
Thompson, L. G., Yao, T., Davis, M., Henderson, K., Mosley-Thompson, E., Lin, P.-N., et al. (1997). Tropical climate instability: the last glacial cycle from a Qinghai-Tibetan ice core. Science 276, 1821–1825. doi: 10.1126/science.276.5320.1821
Thompson, L. G., Yao, T., Davis, M. E., Mosley-Thompson, E., Mashiotta, T. A., Lin, P.-N., et al. (2006). Holocene climate variability archived in the Puruogangri ice cap on the central Tibetan Plateau. Ann. Glaciol. 43, 61–69. doi: 10.3189/172756406781812357
Veale, L., and Endfield, G. (2016). Situating 1816, the ‘year without summer’, in the UK. Geograph. J. 182, 318–330. doi: 10.1111/geoj.12191
Wang, S., and Gong, D. (2000). Enhancement of the warming trend in China. Geophys. Res. Lett. 27, 2581–2584. doi: 10.1029/1999gl010825
Wang, S., Xue, B., and Xia, W. L. (1997). Lake record of climatic change in the past 2000 years of Ximen Cuo (Lake). Quat. Sci. 1, 62–69 (in Chinese).
Wilson, R., Anchukaitis, K., Briffa, K. R., Büntgen, U., and Zorita, E. (2016). Last millennium northern hemisphere summer temperatures from tree rings: Part I: The long term context. Quat. Sci. Rev. 134, 1–18. doi: 10.1016/j.quascirev.2015.12.005
Wu, H., Li, Q., Yu, Y., Sun, A., Lin, Y., Jiang, W., et al. (2019). Quantitative climatic reconstruction of the last glacial maximum in China. Sci. China Earth Sci. 62, 1269–1278. doi: 10.1007/s11430-018-9338-3
Wu, X., Dong, H., Zhang, C. L., Liu, X., Hou, W., Zhang, J., et al. (2013). Evaluation of glycerol dialkyl glycerol tetraether proxies for reconstruction of the paleo-environment on the qinghai-Tibetan Plateau. Organic Geochem. 61, 45–56.
Xu, H., Hong, Y., and Hong, B. (2012). Decreasing Asian summer monsoon intensity after 1860 AD in the global warming epoch. Clim. Dyn. 39, 2079–2088. doi: 10.1007/s00382-012-1378-0
Xu, H., Sheng, E., Lan, J., Liu, B., Yu, K., and Che, S. (2014). Decadal/multi-decadal temperature discrepancies along the eastern margin of the Tibetan Plateau. Quat. Sci. Rev. 89, 85–93. doi: 10.1016/j.quascirev.2014.02.011
Yadav, R. R., Park, W. K., Singh, J., and Dubey, B. (2004). Do the western Himalayas defy global warming? Geophys. Res. Lett. 31, L17201_1–L17201_5. doi: 10.1029/2004GL020201
Yang, B., Achim, B., Shi, Y., and Chen, F. (2004). Evidence for a late Holocene warm and humid climate period and environmental characteristics in the arid zones of northwest China during 2.2 ∼ 1.8 kyr B.P. J. Geophys. Res. 109: D02105.
Yang, B., Braeuning, A., Johnson, K. R., and Yafeng, S. (2002). General characteristics of temperature variation in China during the last two millennia. Geophys. Res. Lett. 29:1324.
Yang, B., Bra̋Uning, A., and Shi, Y. (2003). Late holocene temperature fluctuations on the Tibetan Plateau. Quat. Sci. Rev. 22, 2335–2344.
Yao, T., Duan, K., Thompson, L. G., Wang, N., Tian, L., Xu, B., et al. (2007). Temperature variations over the past millennium on the Tibetan Plateau revealed by four ice cores. Ann. Glaciol. 46, 362–366.
Yao, T., Thompson, L. G., Mosbrugger, V., Fan, Z., Ma, Y., Luo, T., et al. (2012). Third pole environment (TPE). Environ. Dev. 3, 52–64.
Yao, T., Thompson, L. G., Qin, D., Tian, L., Jiao, K., Yang, Z., et al. (1996). Variations in temperature and precipitation in the past 2000 a on the Xizang (Tibet) Plateau——Guliya ice core record. Sci. China Ser. D 39, 425–433.
Zhang, P., Cheng, H., Edwards, R. L., Chen, F., Wang, Y., Yang, X., et al. (2008). A test of climate, sun, and culture relationships from an 1810-year Chinese cave record. Science 322, 940–942.
Zhang, Y., Shao, X. M., Yin, Z. Y., and Wang, Y. (2014). Millennial minimum temperature variations in the qilian mountains. china: evidence from tree rings. Clim. Past Discuss. 10, 1763–1778.
Zhao, C., Yu, Z., Zhao, Y., and Ito, E. (2009). Possible orographic and solar controls of Late Holocene centennial-scale moisture oscillations in the northeastern Tibetan Plateau. Geophys. Res. Lett. 36, 272–277.
Keywords: temperature reconstruction, Common Era, Tibetan Plateau, Medieval Climate Anomaly, Little Ice Age
Citation: Li X, Zhang Y, Wang M, Yan J, Fan B, Xing W, He Y and Hou J (2020) Centennial-Scale Temperature Change During the Common Era Revealed by Quantitative Temperature Reconstructions on the Tibetan Plateau. Front. Earth Sci. 8:360. doi: 10.3389/feart.2020.00360
Received: 30 May 2020; Accepted: 04 August 2020;
Published: 03 September 2020.
Edited by:
Davide Tiranti, Agenzia Regionale per la Protezione Ambientale (ARPA), ItalyReviewed by:
Olga Nikolaevna Solomina, Institute of Geography (RAS), RussiaCopyright © 2020 Li, Zhang, Wang, Yan, Fan, Xing, He and Hou. This is an open-access article distributed under the terms of the Creative Commons Attribution License (CC BY). The use, distribution or reproduction in other forums is permitted, provided the original author(s) and the copyright owner(s) are credited and that the original publication in this journal is cited, in accordance with accepted academic practice. No use, distribution or reproduction is permitted which does not comply with these terms.
*Correspondence: Xiumei Li, bGl4bUB4eW51LmVkdS5jbg==; Juzhi Hou, aG91anpAaXRwY2FzLmFjLmNu
Disclaimer: All claims expressed in this article are solely those of the authors and do not necessarily represent those of their affiliated organizations, or those of the publisher, the editors and the reviewers. Any product that may be evaluated in this article or claim that may be made by its manufacturer is not guaranteed or endorsed by the publisher.
Research integrity at Frontiers
Learn more about the work of our research integrity team to safeguard the quality of each article we publish.