 Livia Colo’1
 Maurizio Ripepe
 Andrew J. L. Harris
- 1Dipartimento di Scienze della Terra, Università degli Studi di Firenze, Florence, Italy
- 2Laboratoire Magmas et Volcans, Université Clermont Auvergne - CNRS - IRD, OPGC, Clermont-Ferrand, France
Fragmentation dynamics can be described by the size distribution of the fragments generated during an explosion. We approach the problem of magma fragmentation during a Strombolian explosion using the grain size distribution (GSD) of a ballistically emplaced lapilli-and-bomb deposit. We present a novel method of collecting juvenile fragments landing in a well-defined near-vent zone (around 50 m from the source). The method uses four plastic sheets (tarpaulins or tarps) deployed below the SW crater rim of Stromboli volcano (Aeolian Islands, Italy). Due to the vicinity of the collection site to the vent, the fragments were still hot when they landed and created a map of melt holes on the sheets. This map was processed to calculate cumulative fragment size distributions (FSD) and grain size distributions (GSD). The cumulative FSD (number based) and GSD (mass-based) are best described by unique power laws with fractal dimensions of 1.40 and 2.03, respectively, testifying to the fractal nature of fragmentation. The fractal dimension is consistent with low energy fragmentation of a brittle material. This method represents a new way of measuring fragmentation dynamics and classifying volcanic eruptions according to their fragmentation energy.
Introduction
Fragmentation is a physical process that occurs commonly in everyday life. It also applies to many processes in science and technology. Examples include breaking of glass or china at home and breaking of ore in industrial mineral processing (Turcotte, 1986), as well as building collapse and concrete break-up (Carpinteri et al., 2009). In all situations, an object breaks into many smaller fragments because of external or internal momentum forces. Rocks fragmented by an artificial explosion show a power law relationship between the size of the fragments and their frequency distribution, where the conditions of fragmentation can be quantified by measuring the fractal dimension Df following (Mandelbrot, 1982):
Here, N(r > R) is the total number of fragments with a linear dimension r greater than a given size R, and C is a proportionality constant (Turcotte, 1986). As a result, the fractal dimension of fragmentation becomes a measure of the particle population generated by the fragmentation process.
Most studies on fragmentation or failure dynamics focus on the behavior of the bulk system in one, two or three dimensions under impact loading or explosive forces (Meibom and Balslev, 1996). Results show that the size distribution of the fragments produced follows a universal power law (Wittel et al., 2006). In fact, one remarkable statistical feature observed as a result of the fragmentation process is the power law of the fragments in terms of size and mass distribution (e.g., Gilvarry and Bergstrom, 1961; Oddershede et al., 1993; Astrom et al., 2004; Haug et al., 2013). As a result, the fragmentation process has been viewed as scale invariant (Bak et al., 1987). Fragmentation mechanisms for closed, thin, shells comprising various materials subject to an excess load applied from the inside of the system toward the surface also reveal a power law for the size (diameter) and mass distributions of the fragments (Wittel et al., 2006). Likewise, Oddershede et al. (1993) studied the fragmentation properties of a variety of materials including gypsum, soap, and potatoes, finding that the power law distribution was insensitive to the type of material studied. Instead, it always depended on the shape, or the effective dimension, of the fragmented object. The reason for the scale invariance of fragmentation for a brittle material is rooted in the mechanism driving the merging and the propagation of cracks forming in the fragmenting system (Astrom et al., 2004).
Given that volcanic explosions are the result of a fragmenting system, the analysis of size and mass distributions of the resulting fragments is thus of great importance in physical volcanology. Hence, Kueppers et al. (2006) found that for fragmentation in volcanic systems, which involves breaking the rock into increasingly small pieces, the size distribution of fragments follows a power law. As a result, the distribution of particles generated by a volcanic explosion is fractal so that the fractal dimension Df can be used to quantify the size distribution (Kueppers et al., 2006). Hartmann (1969) found that rocks subject to a single fragmentation event break with relatively low Df values, but the action of multiple fragmentation events serves to increase the Df value. As a result, Kaminski and Jaupart (1998), in analyzing pyroclastic fall and flow deposits, suggested that high values of Df could not be attributed to a single fragmentation event but, instead, were due to several fragmentation processes. Likewise, Rust and Cashman (2011), in comparing the total grain size distributions (TGSDs) and the bubble size distributions (BSDs) of two magma end-members (silicic and mafic) showed that, when the magma was silicic, both distributions were comparable and could be described by two power law relationships with a high Df values. This supported a direct relation between the kinetics of vesiculation, which controls BSDs, the multiple conditions that control fragmentation, and the resulting TGSDs. Instead for mafic magmas, TGSDs were described by power laws with lower Df values where fragmentation was most likely caused by a single process resulting from instabilities within the accelerating fluid (Mangan and Cashman, 1996). These mechanisms were also demonstrated in laboratory experiments (Zimanowski et al., 1997; Kaminski and Jaupart, 1998). However, studies which use such approaches to infer fragmentation processes require TGSD data for explosive events. Unfortunately, measuring size and mass distributions of fragments produced during a volcanic explosion is a great challenge (Pioli and Harris, 2019); even for the weakest, but most common, style of explosive activity: i.e., Strombolian (Pyle, 1998).
Sampling a single strombolian event to calculate particle size distribution is exceeding difficult because it requires close approach to the vent. This means that the collector is in danger from impact, and it is always difficult to sample a single event deposit because the deposit is always being complicated by arrival of new fragments (Gurioli et al., 2013). To date, attempts to derive particle size distributions at strombolian systems have tended to rely on remote sensing image analysis (e.g., Chouet et al., 1974; Ripepe et al., 1993; Harris et al., 2012; Gaudin et al., 2014; Bombrun et al., 2015; Pioli and Harris, 2019) and thus the range is limited by the pixel-size resolution of cameras which is currently from centimeters to meters. We here present a unique methodology for sampling the deposits of such small explosions, and discuss the resulting fragment size distribution in terms of the explosive process, where the approach is tested at the most famous strombolian system: Stromboli (Aeolian Islands, Italy). We use these new, and rare data, to answer three questions: (i) what is the fragmentation mechanism for this common type of volcanic explosion, (ii) how does the energy compare with other volcanic, and non-volcanic, fragmentation events, and (iii) can the fractal dimension be used as a means for enhanced classification of explosive eruptions?
Normal Explosive Activity and Deposits at Stromboli
Normal activity at Stromboli consists of explosive events lasting few seconds to a few tens of seconds that occur around 13 times an hour (Ripepe et al., 2008). Classically, they eject gas, lapilli and bombs to heights of typically 100–200 m (Barberi et al., 1993; Patrick et al., 2007; Ripepe et al., 2008). The fallout of the coarsest ejecta is limited to an area with a radius of around a 100 m around the source vents (Barberi et al., 1993; Harris et al., 2013). More rarely major explosions and paroxysms send plumes up to 1.5 and 10 km, respectively (Barberi et al., 1993). Only these latter events fall within the Strombolian field of Walker’s (1973) and Newhall and Self’s (1982) classic classification systems, leading to a classification problem for the normal events (Gurioli et al., 2013; Houghton et al., 2013).
Typically, the deposits of Stromboli’s normal explosive activity comprise discontinuous areas of bomb and lapilli fall (Gurioli et al., 2013), with individual eruptions involving typically 103 kg of material (Harris et al., 2013). The finest (ash) particles usually remain coupled with the gas phase forming a convecting ash plume (Patrick et al., 2007). Typical launch velocities are around 30 m s–1, but lapilli have been observed traveling at extremely high velocities (>200–400 m s–1) through coupling with the initial gas jet (Delle Donne and Ripepe, 2012; Harris et al., 2012; Taddeucci et al., 2012; Genco et al., 2014). While the majority of bombs fall back into the vent, or remain in the crater (Patrick et al., 2007), erupted fragments emplaced on the ground are often separated by metric-distances (Gurioli et al., 2013; Harris et al., 2013). As a result, with subsequent explosions, the total deposit quickly becomes a complicated mixture of fragments produced by explosions of differing energies (Gurioli et al., 2013). Hence, identification and quantification of a deposit emplaced during a single explosive event is, at Stromboli or in a strombolian deposit, extremely difficult as the deposit associated with an individual explosion is complicated by the repeated nature of the activity. This means that bombs from subsequent events will land in the same area during collection, to make the sampling dangerous. As a result, quantification of the grain size distribution for an individual event (or series of identical, self-similar events) has not yet been fully defined in the field. Consequently, a granulometric classification of these well-known, globally most frequent, and often-cited strombolian products has to be yet completed.
Methodology, Data Processing, and Results
In June 2008, we deployed an experiment with the aim of sampling the landing distribution of fragments emitted during a normal explosion at Stromboli at a location that was as close to the vent as possible. Samples were collected using four large (3 × 2 m) plastic sheets. These were general purpose tarpaulins (tarps for short), 5–6 mm thick and manufactured from low density polyethylene. The tarps were deployed 25 m from the SW Crater rim at a distance of < 50 m from the vent (Figures 1a,b) and were retrieved 48 h later. Based on our monitoring data (Ripepe et al., 2008), between 15:00 GMT on June 3 and 15:00 GMT on June 5 (the period that the tarps were left on-site), around 600 normal explosions occurred. Analysis of thermal video taken from a point 500 m to the NE indicates that around three of these explosions emitted bombs that escaped the crater to the SW so as to land on our tarps during the early hours of June 4.
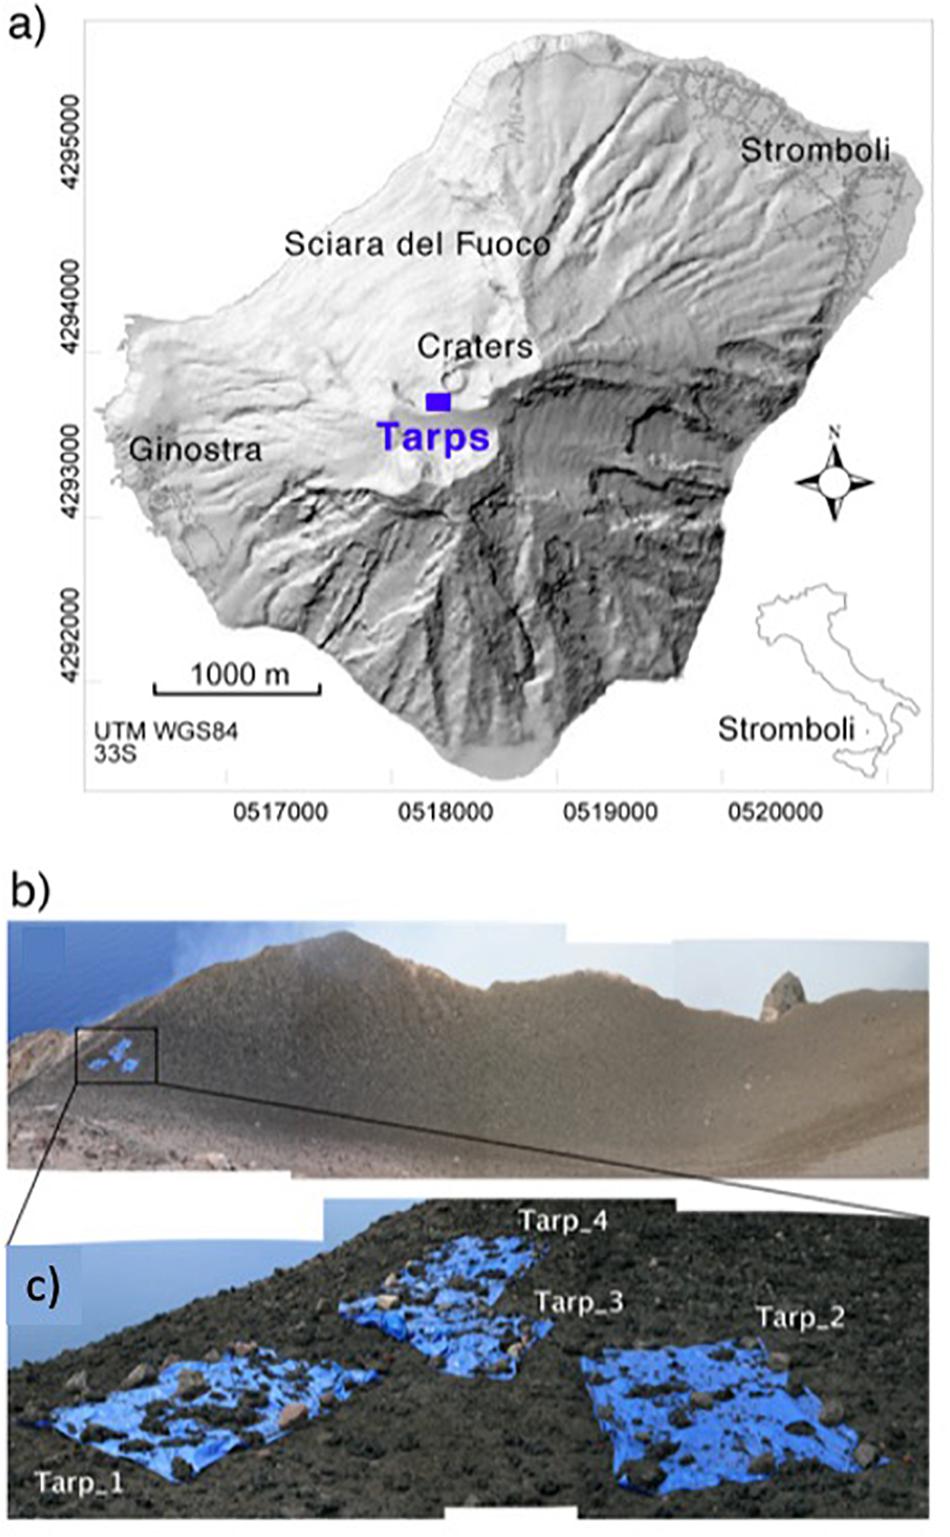
Figure 1. (a) Stromboli (DEM in shaded relief) with the position of collecting area (blue square). (b) View on the crater area showing the sample site, and (c) the plastic sheets covered by fragments.
The tarps were placed as close to the crater rim as was safe and on the flattest ground we could find (see Figure 1c), with the ground being pre-prepared, i.e., cleared of small-scale topographic irregularities (bombs) and smoothed. Upon retrieval, the tarps were also checked for evidence of bomb rolling; and there was none. Finally, each tarp was pinned to the ground to prevent them from blowing away. Hot volcanic fragments (bombs and lapilli) landing on the tarps burned through the plastic making holes. Around 50 clasts of sizes varying between 1 and 32 mm were collected from their associated holes, and used to create a relation between hole size and particle size. The size of the melt hole will be larger than that of the related particle, but the size of hole should increase systematically with the size of the particle. Considering that the plastic material will be consumed by the heat provided by the hot clasts, larger clasts will require longer time to cool down and so will transfer heat to the tarp for longer time. Thus we defined the relation between clast size and hole size by taking clasts over a range of sizes and relating them to their hole size through an empirical analysis. The pattern of the holes thus provided a map from which fragment size distribution could be reconstructed. Digital photos were thus taken of the tarps, with a Canon EOS Digital Rebel XTi (image size 3888 × 2592 pixels), at different magnifications (×1, ×2, ×4, and ×5), to cover the complete size distribution (Figure 2). At a distance of 3 m (the vertical distance between the tarp center and the camera), for the focal plane array dimension of 22.2 mm and focal length of 28 mm, the pixel size will be 0.33 mm. Thus, the minimum particle size we can detect will be four times greater than this, i.e., around 1.35 mm for no magnification and 0.27 mm at full magnification. All particles smaller than 0.27 mm are thus not represented in our data set. Cooler clasts and clasts smaller than 0.27 mm (i.e., small lapilli and ash) not capable of burning holes or being resolved will thus not be represented in our data set.
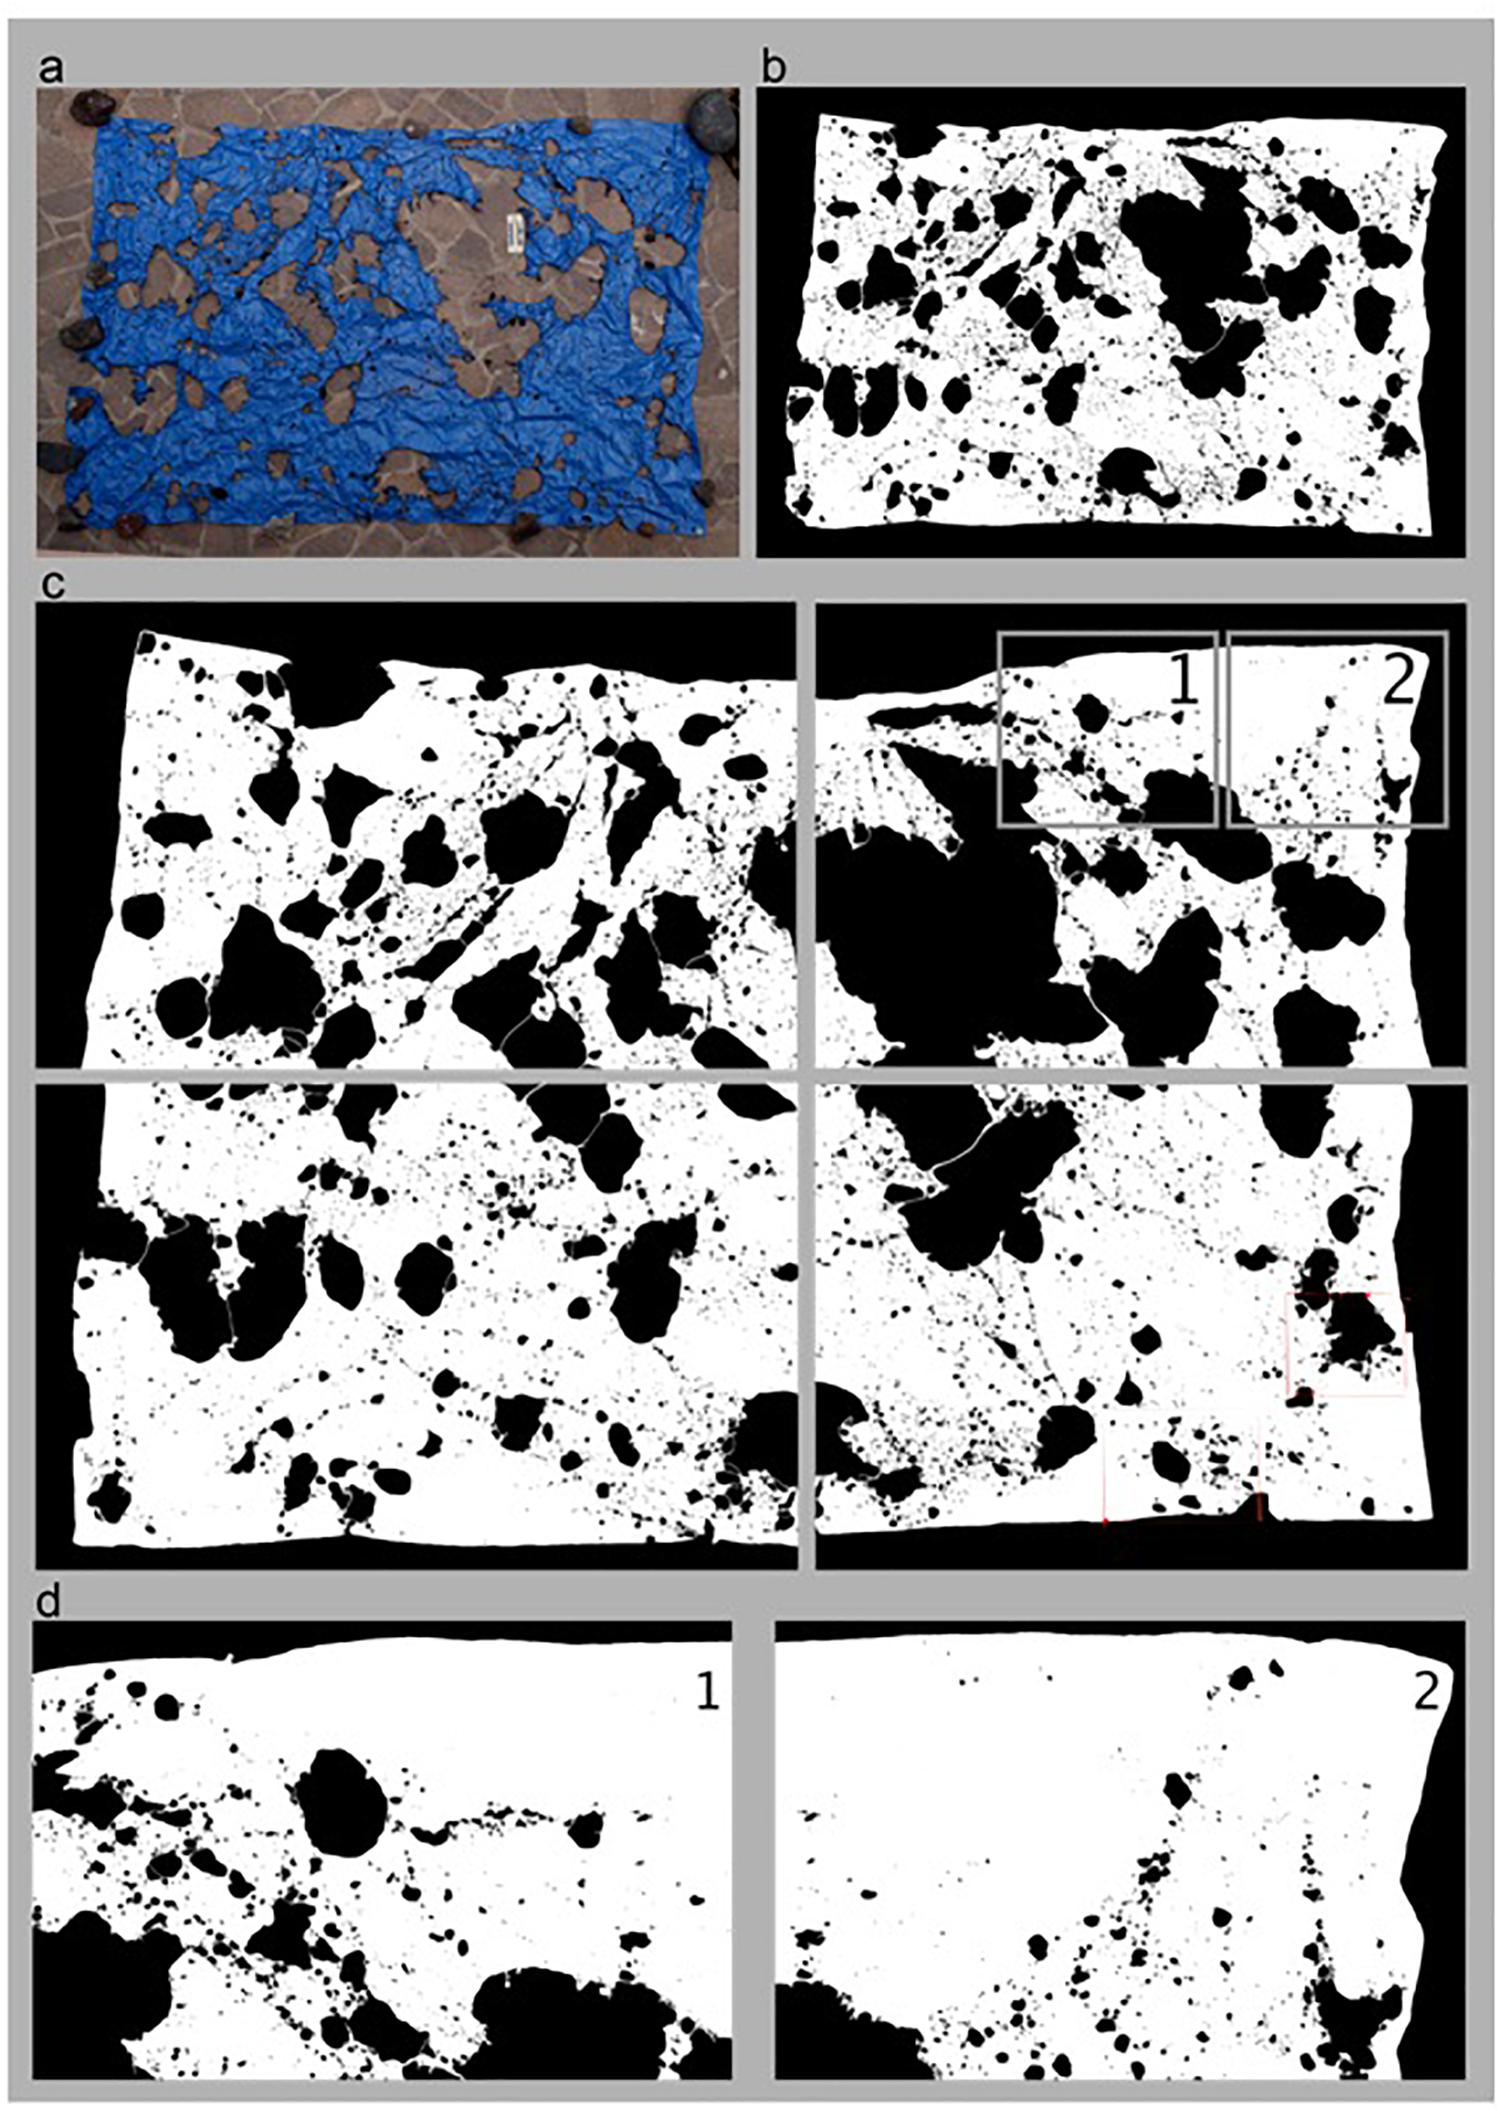
Figure 2. (a) Photo of tarp 1. For scale 10 cm GSA scale bar is included and tarp is 3 × 2 m. Dimensions are the same for all the figures. (b) Image of tarp 1 after image processing (holes = black, plastic = white). (c) Processing of images with increasing magnification, where areas marked by gray boxes marked “1” and “2” are magnified in (d).
For safety reasons, we could only make a few, rapid, qualitative observations of the fragments in situ. The deposit was characterized by fresh, glassy, black, scoriaceous fragments and a few gray, rough-edged, small (cm-sized) lithic clasts. Bomb morphologies ranged from decimetric-size elongated or flattened fragments, to centimetric-sized rounded scoriae. While larger scoria had flattened shapes typical of hot material that impact the ground and flow under the effect of gravity, smaller products mostly had sub-spherical to spherical shapes. Altered (and non-glassy) material (ash) blown onto the tarps by the wind was disregarded.
Only three tarps (Tarp 1, Tarp 2, Tarp 4) were used. The third tarp (Tarp 3) was almost totally burnt by a large central aggregate of bombs grouped in a cluster and therefore could not be used for the image analysis. It was thus not possible to recreate the distribution of the aggregate for image processing (Figures 2a,b), and this aggregate cluster was not used in our analysis. In addition, there was no evidence of particles landing in already burned holes. Images of Tarps 1, 2, and 4 (Figure 2c) were processed by treating the holes as if they were “bubbles” in textural image analysis software (FOAMS: Shea et al., 2010). To do this, missing boundaries were drawn (in Photoshop) and the images were reduced into converted into binary black (holes) and white (plastic) images. Image processing on each photo (Colò, 2012) was used to obtain the cumulative fragment size distributions based on hole diameters and, from this, the total fragment size distribution (FSD) was derived.
Fragment Size Distribution (FSD)
Areas of the holes were measured and converted into equivalent diameter R (see Jennings and Parslow, 1988 for definition). The cumulative fragment size distributions for each magnification and each tarp were calculated as function of log10N(r > R), in which N is the number of fragments with a linear dimension r greater than R (Figure 3A). As expected, different magnifications cover different tephra sizes, with the lower magnification sampling larger sizes and higher magnifications covering the smaller dimensions (Figure 3A). Each fragment size distribution was then normalized for the area covered by the image magnification (Figure 3B), and each magnification was used to describe the population size range in each tarp (Figure 3C). In this way, cumulative fragment distributions for each plastic sheet were obtained and plotted as a function of the equivalent diameter log(R) (Figure 3D). All the distributions showed a linear trend with the form log10N(r > R) = -Df log10(R) + C, perfectly matching a power law with a fractal dimension (Df) ranging between 1.44 and 1.30 (Figure 3D). The final size distribution of the scoria sampled by the three surviving tarps was obtained by merging, using size overlap, the three populations calculated for each tarp (Figure 4A). This total size distribution followed a power law with a fractal dimension of 1.40 (Figure 4A).
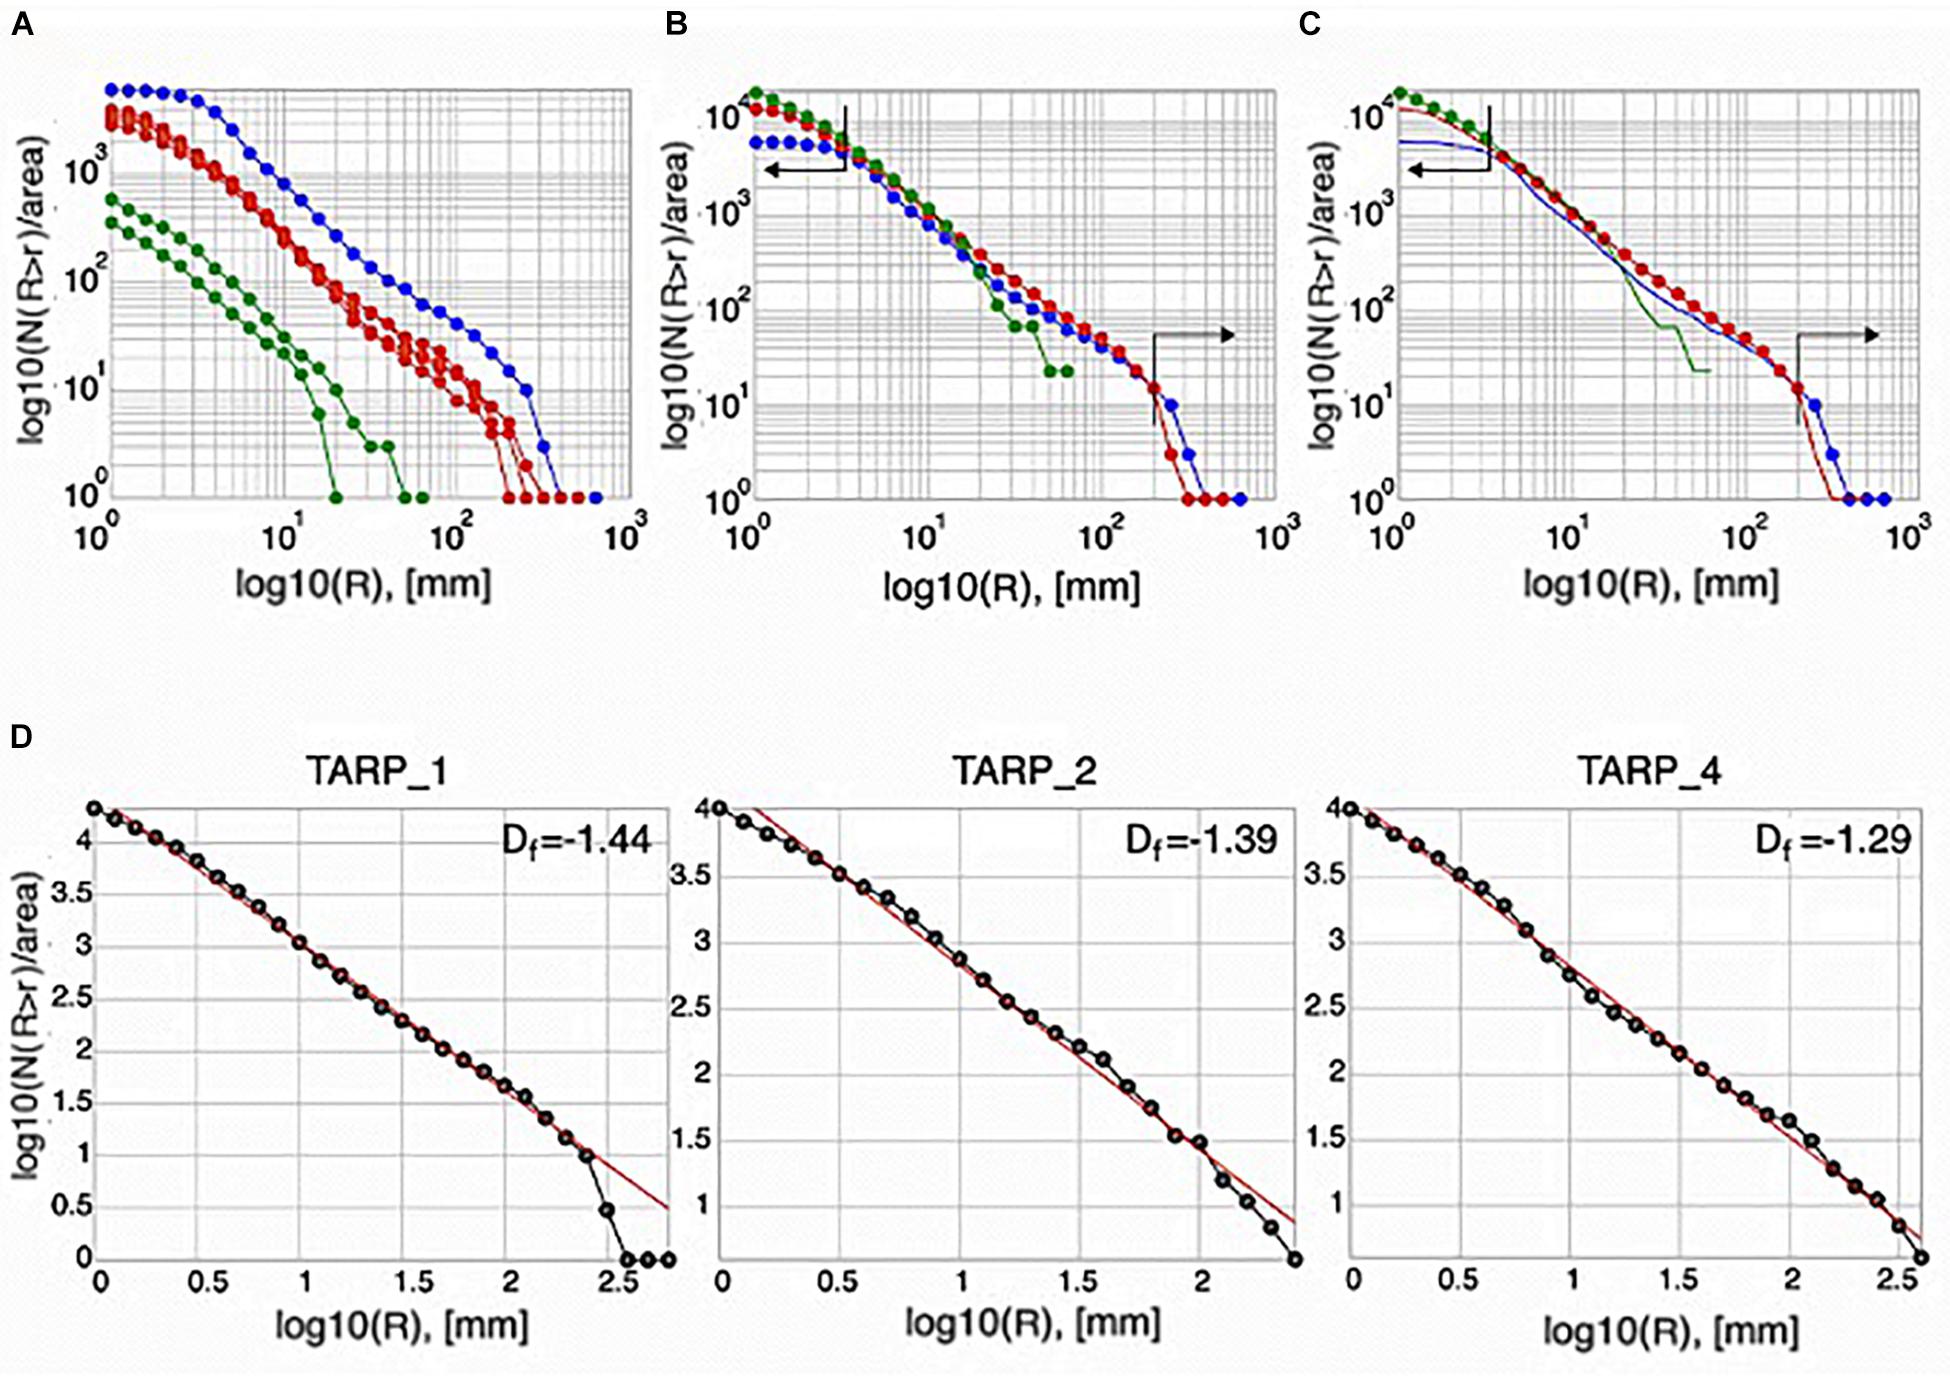
Figure 3. (A) Cumulative fragment distributions for tarps 1, 2, and 4 for each magnification: the blue curve represents the lowest magnification used (×1), and the red curve relates to the intermediate magnification (×2), and the two green curves relate to the highest magnifications (×4 and ×5). (B) Distributions derived plotted as a single curve. The black arrows indicate the segment of the curves that have been considered for calculation of the final distribution. (C) The cumulative fragment distribution. (D) Fragment size distributions of each tarp and the associated fractal dimension (Df).
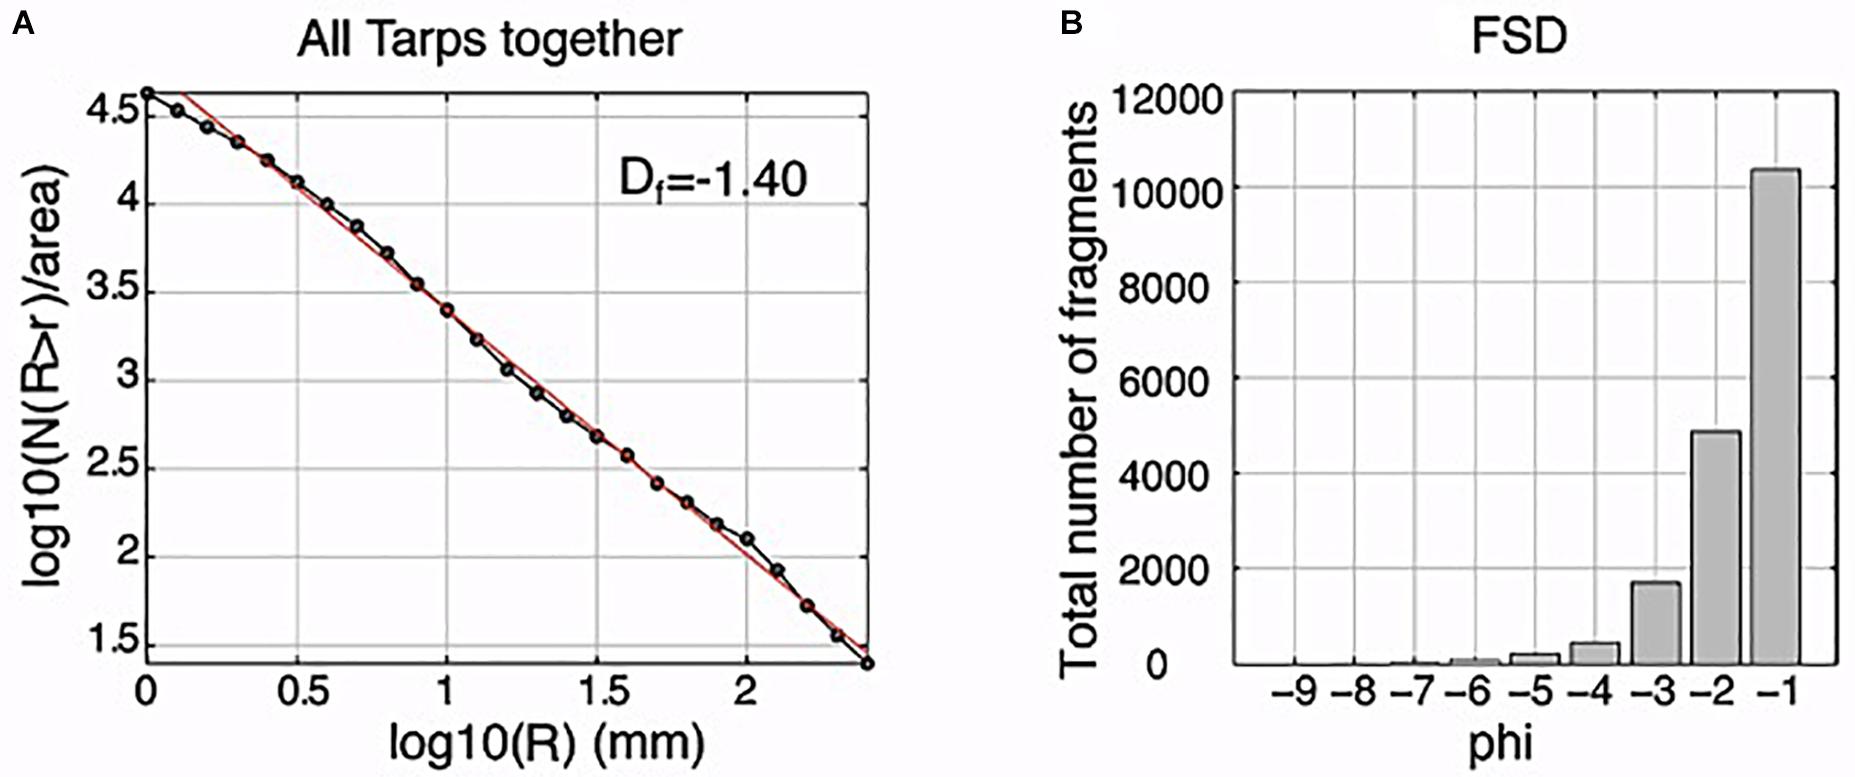
Figure 4. (A) Fragment distributions and (B) total fragment size distribution for all three tarps (see Supplement for full data set including those for the bins whose values are too low to be seen on this style of plot).
Measured equivalent diameters were then converted into phi units (φ = -log2 R) from which the total number of fragments relative to each tarp, and the total fragment size distribution (FSD; Figure 4B), were obtained.
Grain Size Distribution (GSD)
Once the plastic sheets were removed, fragments that remained attached to the tarps (and hence could be associated with the hole that they created) were measured and weighed. The scoria major and minor axes were measured, and samples were weighed with a precision balance. For small intervals, the area of the holes (A in m2) left on the tarps and the mass (M in kg) of the associated scoria can be approximated by a linear relationship M = 6.67 A (Figure 5A).
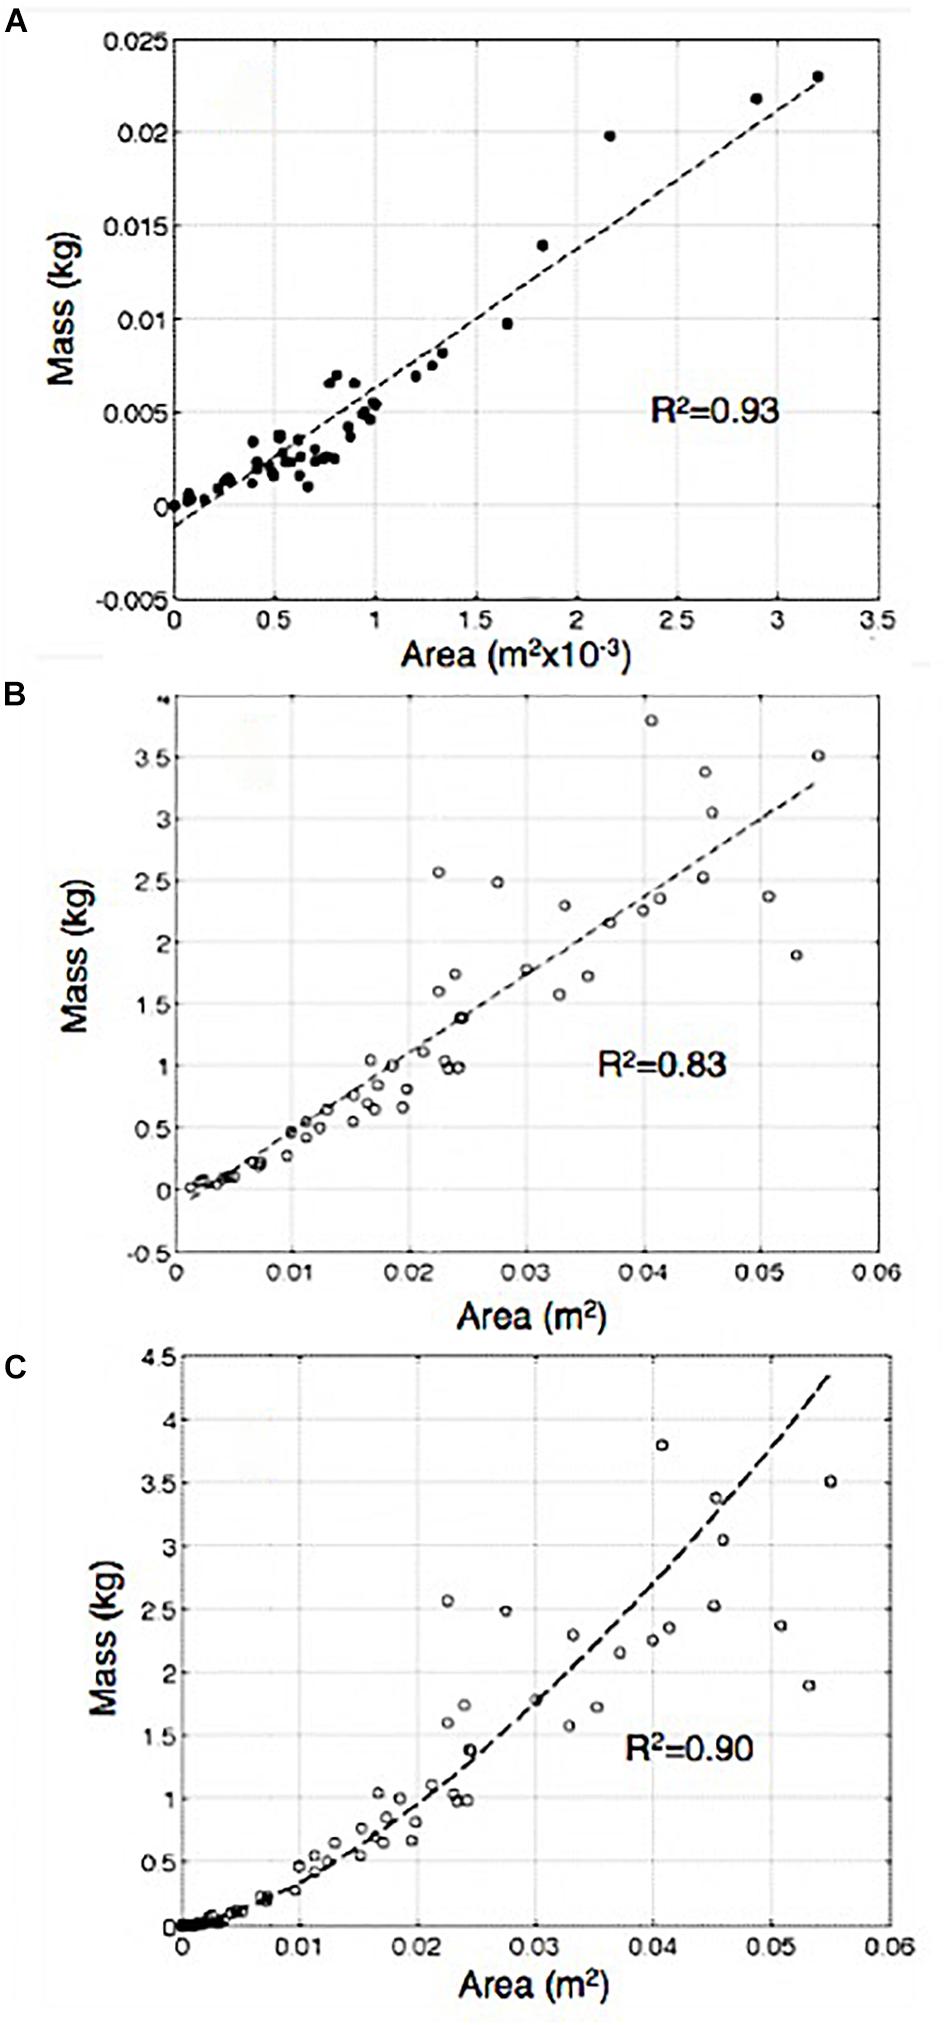
Figure 5. (A) Area of the fragments as function of mass measured for clasts remaining stuck to the tarps. (B) Area and mass relation for bombs sampled and measured after a major explosion at Stromboli. (C) Mass vs. area for both data sets.
For the interval 1.0–3.5 mm this relationship has a correlation coefficient of 0.93 (Figure 5A). This linear relationship is valid only for very small fragments, having an area no larger than 3.2 × 10⁻³ m2, which corresponds to an equivalent diameter of 64 mm and a mass of 23 g. This allows reconstruction of the grain size distribution from the holes in the tarps for areas <3.2 × 10⁻³ m2. To extend our range beyond the size limit of 3.2 × 10⁻³ m2, 46 bombs belonging to a major explosion that occurred at Stromboli on 21 January 2010 (Gurioli et al., 2013) were analyzed. We found that the distribution for fragments >10–3 m2 can be represented by a second linear trend (M = 60A) with a correlation coefficient of 0.83 (Figure 5B). Note that Figure 5C shows a very good (0.90) continuity between the two data sets which is not linear but follows the expected relationship M between mass and area for spherical objects. Given this continuity, we can use the trend in Figure 5C to calculate clast mass from area, allowing us to obtain the total mass of the deposit and the grain size distribution (Figure 6A). The GSD (grain size distribution) is defined across the φ = −9 to −1 interval (corresponding to equivalent diameters of 512–2 mm, i.e., down to the lower limit of our spatial resolution) and is characterized by a mode at −7 φ (128 mm). The GSD represented as log10N(M < m), N being the number of fragments with mass M smaller than m, follows a power law with a fractal dimension Dm of 2.03 (Figure 6B).
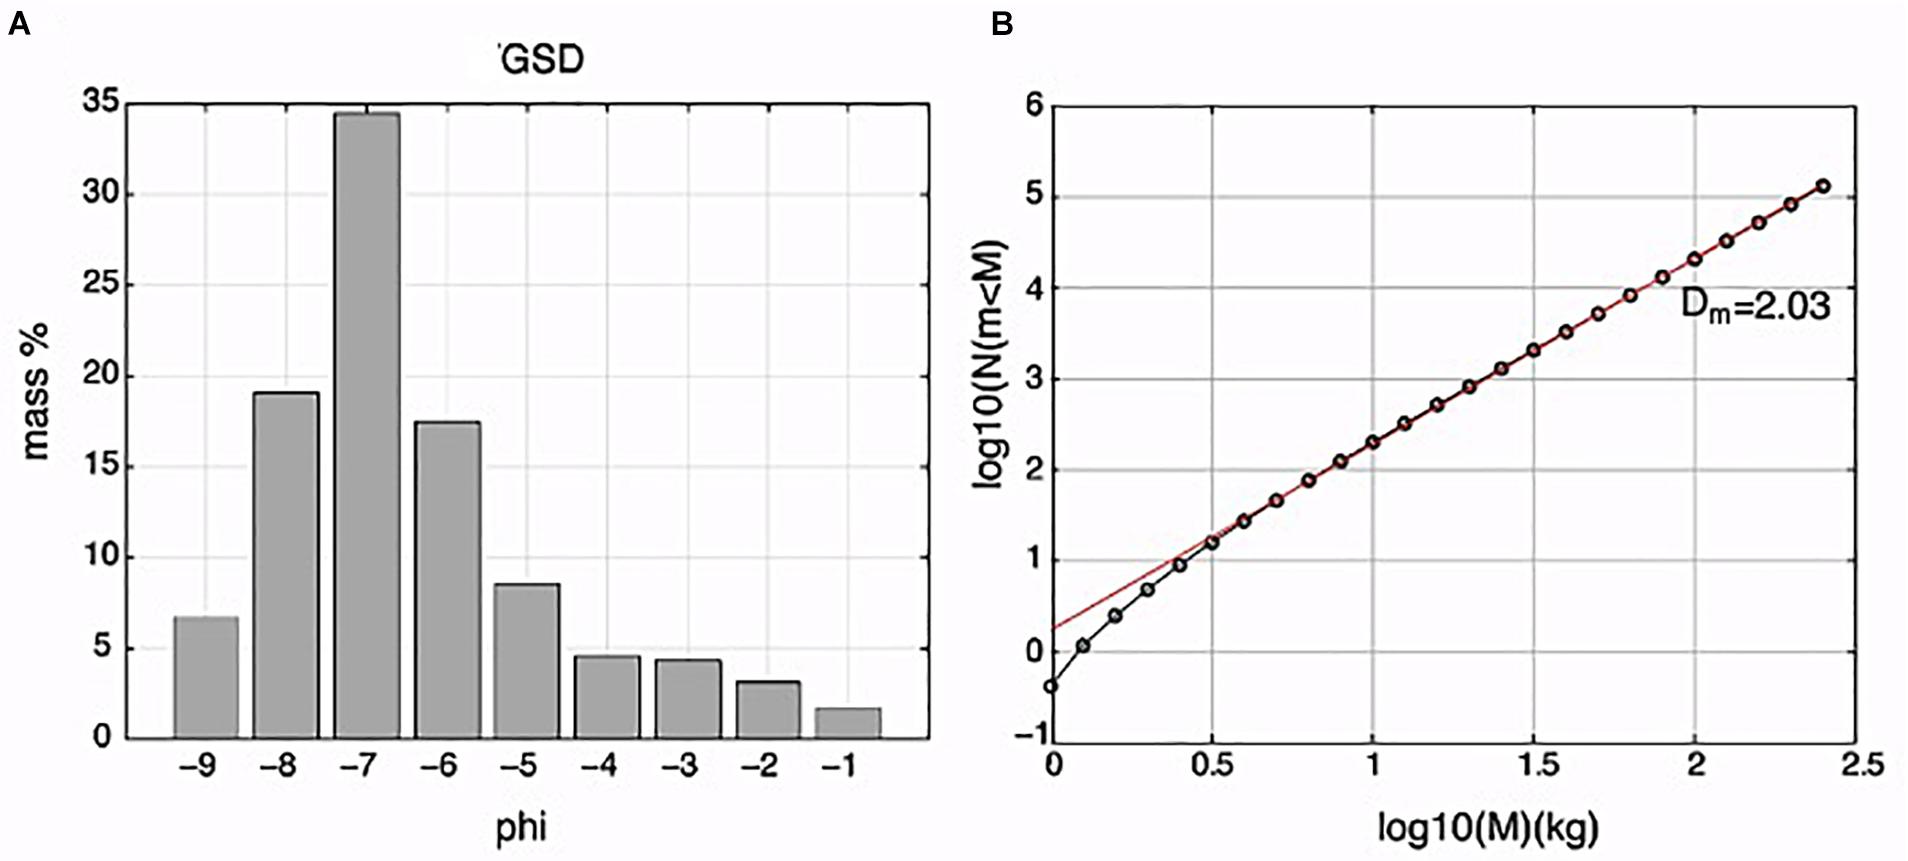
Figure 6. (A) Grain size distribution (mass-based) of the sampled deposit. (B) Log-log representation of the GSD.
Calculating Mass From the Area
Eq. (1) can be use to derive the mass of each fragment from their linear dimension R. If diameter R coincides with the sieve dimensions, the number of particles per sieve size can be calculated by dividing the total mass MT used within each sieve dimension by the density of each particle. From this assumption, a relationship relating mass M and sieve diameter R can be derived as (Turcotte, 1986, 1992; Tyler and Wheatcraft, 1992):
where M(r < R) is the cumulative mass of particles with size r smaller than a comparative sieve size R, and Dm is the fractal dimension. Equation (2), in the logarithmic form, is a power law and represents a scale-invariant linear relationship of the grain size distribution GSD. Taking the first derivatives of Eqs. (1, 2) with respect to size R we obtain:
It is now possible to derive a direct relationship between the scaling exponent Dm of the mass and the fractal dimension of the equivalent diameter Df.
The volume of a particle with diameter R is proportional (R3∝M) to its mass M and hence it follows that (Turcotte, 1992):
By substituting Eqs. (3, 4) into Eq. (5) we now obtain:
from which it follows that
In general, such a mass-based approach is directly applicable to data obtained from analyses of fragmental deposits, where typically mass fractions, rather than number fractions, are measured (cf. Zi-Long et al., 2006; Crosta et al., 2007; Ruiz-Carulla et al., 2017). Therefore, the exponent Dm of the mass-distribution can be calculated from the fractal dimension of fragmentation, Df. Hence, using Eq. (7), the fractal dimension describing the mass distribution should be Dm = 1.60, which is less than that calculated directly from the GSD (2.03). This discrepancy could be due to the assumption of the constant shape of the fragments in our deposit and/or to a change of the density with the increasing fragment diameter (cf. Bombrun et al., 2015).
Discussion and Implications
Our sampling method is thus able to characterize a proximal ballistic deposit, without having to carry back a large and heavy sample set. The sampling strategy employed allowed us to retrieve a unique dataset that brings relevant information on the process of fragmentation that would be otherwise very difficult to obtain.
The cumulative size distributions calculated on each tarp have power laws with similar fractal dimensions (Figure 3D), suggesting a similar fragmentation process. The similar fractal dimensions in all the distributions can be explained as being due to a unique single explosive event, or to several explosions sharing the same fragmentation process, plus breaking of bombs during impact with the ground. This is supported by the small variability in grain size distributions across all the three of the tarps (Figure 6A), which are characterized by a main peak at −8 φ or −7 φ (R = 256–128 mm). These GSDs are in agreement with other proximal deposits (Carey and Houghton, 2010; Gaudin et al., 2014; Bombrun et al., 2015; Pioli and Harris, 2019), which show a GSD of juvenile samples associated with such low energy explosions to be in the −1 to −7 φ range. In this regard, all particles, in terms of sizes, tend to be well-represented at all sampling distances where the largest and smallest particles can be found next to each other proximally and distally due to a large range of launch angles and velocities (Gurioli et al., 2013). In addition, all GSDs for Stromboli tend to be similar (cf. Harris et al., 2013; Bombrun et al., 2015; Pioli and Harris, 2019), meaning that a small sampling area can be representative of the wider deposit. Finally, the FSD (Figure 4B), having a mode at −1 φ, testifies that most of the ballistics are lapilli sized (2–64 mm) fragments, a result again consistent with the bomb-field-wide sampling of Gurioli et al. (2013). The FSD fragment distribution is matched by a power law (Figure 4A) indicating the scale invariant nature of fragmentation, with all samples being generated by the same fragmentation process.
We see from Figure 4B that very small lapilli-sized fragments landing on the plastic sheets had temperatures high enough to melt the polyethylene plastic, which has a nominal melting point in the range 120–130°C. However lapilli of 2 mm landing at <50 m from the vent should not be hot enough to melt the tarp (Vanderkluysen et al., 2012; Moitra et al., 2018). Hence, the small holes we found could be due to secondary fragmentation processes, such as the break-up of larger clasts that, upon impacting the sheets, broke into smaller pieces that were still hot and able to melt the plastic. Many of the small holes also follow lines or curves departing from larger ones, or are clustered around larger ones (Figure 2), suggesting that the small lapilli originated from the larger ones at impact or just before it. They could thus result from the in-flight break-up of larger bombs just before impact (see Taddeucci et al., 2017). The smallest lapilli may have thus been hot because they detached from the large bombs on, or just before, impact.
Fractal Dimension of Fragmentation
Experiments have shown that the power law distribution exponent grows as the initial energy used to fragment the object increases (Kadono, 1997; Myagkov and Shumikhin, 2005 and references therein). Irrespective of the energy and materials used, fragmentation processes are always described by a power law, with fractal dimensions changing according to the initial energy (Turcotte, 1986; Meibom and Balslev, 1996; Wittel et al., 2004). The fragmentation of rock thus also follows a power law, so that the distribution of fragments generated by an explosion will be fractal so that the fractal dimension, Df, can be used to quantify the grain size distribution (Kaminski and Jaupart, 1998; Kueppers et al., 2006; Rust and Cashman, 2011). The value of Df obtained here (1.4) appears relatively lower than Df associated with other volcanic fragmentation events, thus suggesting a relatively low energy of the process. Such Df values would suggest energies that are closer to those reported for non-volcanic rock fragmentation of granites under impact loading (Df = 1.2–2.4, Zi-Long et al., 2006) and rock avalanches (Df = 1.3–3.2, Crosta et al., 2007), but higher than those reported for rock falls (Df = 0.51–1.27; Ruiz-Carulla et al., 2017). Analyzing Plinian and sub-Plinian fall and flow deposits, Kaminski and Jaupart (1998) found fractal dimensions always greater than three, with the exponents for pyroclastic flow deposits being smaller than those of fall deposits. Perugini et al. (2011) also showed that the fractal dimension of fragmentation increases as fragmentation efficiency increases. Thus, to better understand the type of eruptive activity associated with each exponent, Kueppers et al. (2006) performed rapid decompression experiments on pyroclasts and porous volcanic rocks, finding a relationship between eruption energy and fragmentation efficiency. Analyzing the fractal dimension Df of the resulting fragment size distributions, Kueppers et al. (2006) showed that the size distribution of pyroclastic fragments followed a fractal law indicating that fragmentation of experimental samples reflected a scale-invariant mechanism. The fractal dimension was in the range 2.095–2.553, with fractal dimension increasing with the energy of the fragmentation process. In general, all studies (Turcotte, 1986; Kaminski and Jaupart, 1998; Kueppers et al., 2006; Rust and Cashman, 2011; Haug et al., 2013; Girault et al., 2014) agree that highly energetic explosions have higher Df than low energy events. Our Df of 1.4 would thus defines a Strombolian explosive event in contrast to Df of 3–4 for Plinian and sub-Plinian eruptions (see Girault et al., 2014 for collation of available data). We thus, here, define the lower end member of a classification scheme that can use Df to rank explosive energy and classify event types.
Our Df could also reflect an element of impact-related fragmentation (for the smallest particles), thus being a classification that can be applied to deposits that have undergone explosive, in-flight and impact-induced fragmentation. In this regard, we note that for Plinian deposits pyroclast fragmentation upon impact with the ground or in-flight (due to collisions with other clasts) has been shown to impart a signature on Df in such cases (cf. Dufek et al., 2012). However, we have no direct evidence that this secondary fragmentation has occurred or has a primary influence on our Df. If our fractal dimension was due to impact and collision, rather than primary fragmentation of magma, there would be no differences in the fractal dimension between deposits associated with explosions of different energies.
Fragmentation Energy at Stromboli
The value of the fractal dimension found here (Df = 1.40, Figure 4A) is less than those found, for example, by Fujiwara et al. (1977), Kaminski and Jaupart (1998), and Kueppers et al. (2006) for plinian and sub-Plinian eruptions, whose fractal dimensions are 3–4 (Girault et al., 2014). This difference shows that the fragmentation process occurring at Stromboli during “normal” activity is of very low energy and involves a less efficient fragmentation event, as also revealed by the large particles which characterize the deposit. This conclusion is also in agreement with laboratory experiments (Kueppers et al., 2006) and field data (Perugini et al., 2011) which demonstrate how Df increases with the potential energy of fragmentation. The exponent Df increases with gas over-pressure (Haug et al., 2013), such that large pressures produce a large number of small fragments. Thus, we here characterize a very low energy explosive event, which appears to result from a single fragmentation event of a brittle material and involving extremely low pressures. Our data, collected during normal explosive activity at Stromboli thus apply to this very-low-energy end member of explosive event. Finally, we can say that our bombs sampled here have not experienced repeated collisions, as these would increase the value of the exponent (Kaminski and Jaupart, 1998), so that bomb collisions although previously reported during such normal activity (Vanderkluysen et al., 2012), are likely relatively rare and do not play a role in modifying the PSDs.
Conclusion
Application of a unique field technique allowed us to map and sample the deposit associated with a normal explosive activity at Stromboli. Plastic tarpaulins were covered by tephra samples during an explosive event (or a series of self-similar events). The relatively flat location of the sheet meant that there was no rolling of fragments on the sheet itself. The hot particles instead melted holes where they landed, effectively burning in a map of tephra distribution in the fall out zone. The fragment size distributions obtained from the tephra distribution maps obey a unique power law classic of break-up of a brittle material subject to impact loading or an explosive force. In our case, the explosive event can be shown to be associated with a low energy fragmentation event in a brittle material. The fractal dimension values are lower in comparison to other studies (Fujiwara et al., 1977; Kaminski and Jaupart, 1998; Kueppers et al., 2006), attesting (following Kadono, 1997) to the extremely low energy of the event, typical of the normal mild explosive activity at Stromboli. Our methodology, even at Stromboli, is not easily repeatable. Such deployments must be implemented with care and have to be based on an intimate knowledge of the volcano and its activity. They also need to be applied only during low-levels of explosive activity and after definition of a security zone. Our data this represents a rather unique way of sampling the size distribution of a fragmentation event in a high temperature medium and then of defining its energy (cf. Perugini and Kueppers, 2012). However, we suggest that the fractal character of the particle size distribution can be used to classify eruption energy (cf. Newhall and Self, 1982) and this potentially could be converted into total eruptive mass (cf. Girault et al., 2014).
Data Availability Statement
The datasets generated for this study are available on request to the corresponding author.
Author Contributions
All authors have equally contributed to collect, process, and writing the manuscript, and agreed to submit this work.
Conflict of Interest
The authors declare that the research was conducted in the absence of any commercial or financial relationships that could be construed as a potential conflict of interest.
References
Astrom, J. A., Ouchterlony, F., Linna, R. P., and Timonen, J. (2004). Universal dynamic fragmentation in D dimensions. Phys. Rev. Lett. 92:245506.
Bak, P., Tang, C., and Wiesenfeld, K. (1987). Self-organized criticality-an explanation of 1/F noise. Phys. Rev. Lett. 59, 381–384. doi: 10.1103/physrevlett.59.381
Barberi, F., Rosi, M., and Sodi, A. (1993). Volcanic hazard assessment at Stromboli based on review of historical data. Acta Vulcanol. 3, 173–187.
Bombrun, M., Harris, A., Gurioli, L., Battaglia, J., and Barra, V. (2015). Anatomy of a Strombolian eruption: inferences from particle data recorded with thermal video. J. Geophys. 120, 2367–2387. doi: 10.1002/2014JB011556
Carey, R. J., and Houghton, B. F. (2010). “Inheritance”: an influence on the particle size of pyroclastic deposits. Geology 38, 347–350. doi: 10.1130/G30573.1
Carpinteri, A., Lacidogna, G., and Niccolini, G. (2009). Fractal analysis of damage detected in concrete structural elements under loading. Chaos Solitons Fractals 42, 2047–2056. doi: 10.1016/j.chaos.2009.03.165
Chouet, B., Hamisevicz, N., and McGetchin, T. R. (1974). Photoballistic of volcanic jet activity at Stromboli, Italy. J. Geophys. Res. 79, 4961–4976. doi: 10.1029/jb079i032p04961
Colò, L. (2012). Study of Vesiculation in Basalt Magma Through Volcanological, Textural and Geophysical Analyses: The Case Study of Stromboli. Ph.D. dissertation, University of Florence, Florence.
Crosta, G. B., Frattini, P., and Fusi, N. (2007). Fragmentation in the Val Pola rock avalanche, Italian Alps. J. Geophys. Res. 112:F01006.
Delle Donne, D., and Ripepe, M. (2012). High-frame rate thermal imagery of Strombolian explosions: implications for explosive and infrasonic source dynamics. J. Geophys. Res. 117:B09206. doi: 10.1029/2011JB008987
Dufek, J., Manga, M., and Patel, A. (2012). Granular disruption during explosive volcanic eruptions. Nat. Geosci. 5, 561–564. doi: 10.1038/ngeo1524
Fujiwara, A., Kamimoto, G., and Tsukamoto, A. (1977). Destruction of basaltic bodies by high-velocity impact. Icarus 31, 277–288. doi: 10.1016/0019-1035(77)90038-0
Gaudin, D., Taddeucci, J., Scarlato, P., Moroni, M., Freda, C., Gaeta, M., et al. (2014). Pyroclast Tracking Velocimetry illuminates bomb ejection and explosion dynamics at Stromboli (Italy) and Yasur (Vanuatu) volcanoes. J. Geophys. Res. Solid Earth 119, 5384–5397. doi: 10.1002/2014jb011096
Genco, R., Ripepe, M., Marchetti, E., Bonadonna, C., and Biass, S. (2014). Acoustic wavefield and mach wave radiation of flashing arcs in strombolian explosion measured by image luminance. Geophys. Res. Lett. 41, 7135–7142. doi: 10.1002/2014GL061597
Gilvarry, J. J., and Bergstrom, B. H. (1961). Fracture of brittle solids. 2. Distribution function for fragment size in single fracture (experimental). J. Appl. Phys. 32, 400–410. doi: 10.1063/1.1736017
Girault, F., Carazzo, G., Tait, S., Ferrucci, F., and Kaminski, E. (2014). The effect of total grain-size distribution on the dynamics of turbolent volcanic plumes. Earth Planet. Sci. Lett. 394, 124–134. doi: 10.1016/j.epsl.2014.03.021
Gurioli, L., Harris, A. J. L., Colò, L., Bernard, J., Favalli, M., Ripepe, M., et al. (2013). Classification, landing distribution, and associated flight parameters for a bomb field emplaced during a single major explosion at Stromboli, Italy. Geology 41, 559–562. doi: 10.1130/G33967.1
Harris, A. J. L., Delle Donne, D., Dehn, J., Ripepe, M., and Worden, A. K. (2013). Volcanic plume and bomb field masses from thermal infrared camera imagery. Earth Planet. Sci. Lett. 365, 77–85.
Harris, A. J. L., Ripepe, M., and Hughes, E. A. (2012). Detailed analysis of particle launch velocities, size distributions and gas densities during normal explosions at Stromboli. J. Volcanol. Geotherm. Res. 231-232, 109–131. doi: 10.1016/j.jvolgeores.2012.02.012
Hartmann, W. K. (1969). Terrestrial, lunar, and interplanetary rock fragmentation. Icarus 10, 201–213. doi: 10.1016/0019-1035(69)90022-0
Haug, O. T., Galland, O., and Gisler, G. R. (2013). Experimental modelling of fragmentation applied to volcanic explosions. Earth Planet. Sci. Lett. 384, 188–197. doi: 10.1016/j.epsl.2013.10.004
Houghton, B. F., Swanson, D. A., Rausch, J., Carey, R. J., and Fagents, S. A. (2013). Pushing the volcanic explosivity index to its limit and beyond: constraints from exceptionally weak explosive eruptions ay Kilauea in 2008. Geology 41, 627–630. doi: 10.1130/g34146.1
Jennings, B. R., and Parslow, K. (1988). Particle size measurement: the equivalent spherical diameter. Proc. R. Soc. Lond. Ser. A 419, 137–149. doi: 10.1098/rspa.1988.0100
Kadono, T. (1997). fragmentation mass distribution of plate like objects. Phys. Rev. Lett. 78, 1444–1447. doi: 10.1103/physrevlett.78.1444
Kaminski, E., and Jaupart, C. (1998). The size distribution of pyroclasts and the fragmentation sequence in explosive volcanic eruptions. J. Geophys. Res. 103, 29759–29779. doi: 10.1029/98jb02795
Kueppers, U., Perugini, D., and Dingwell, D. B. (2006). “Explosive energy” during volcanic eruptions from fractal analysis of pyroclasts. Earth Planet. Sci. Lett. 248, 800–807. doi: 10.1016/j.epsl.2006.06.033
Mangan, M. T., and Cashman, K. V. (1996). The structure of basaltic scoria and reticulite and inferences for vesiculation, foam formation, and fragmentation in lava fountains. J. Volcanol. Geotherm. Res. 73, 1–18.
Meibom, A., and Balslev, I. (1996). Composite power laws in shock fragmentation. Phys. Rev. Lett. 76, 2492–2494. doi: 10.1103/physrevlett.76.2492
Moitra, P., Sonder, I., and Valentine, G. A. (2018). Effects of size and temperature-dependent thermal conductivity on the cooling of Pyroclasts in Air. Geochem. Geophys. Geosyst. 19, 3623–3636. doi: 10.1029/2018gc007510
Myagkov, N. N., and Shumikhin, T. A. (2005). Critical behavior and energy dependance of mass distributions in impact fragmentation. Physica A 358, 423–436. doi: 10.1016/j.physa.2005.04.015
Newhall, C. G., and Self, S. (1982). The volcanic explosivity index (VEI)—an estimate of explosive magnitude for historical volcanism. J. Geophys. Res. 87, 1231–1238. doi: 10.1029/jc087ic02p01231
Oddershede, L., Dimon, P., and Bohr, J. (1993). Self-organized criticality in fragmenting. Phys. Rev. Lett. 71, 3107–3110. doi: 10.1103/physrevlett.71.3107
Patrick, M., Harris, A. J. L., Dehn, J., Ripepe, M., Rothery, D. A., and Calvari, S. (2007). Strombolian explosive styles and source conditions: insights from thermal (FLIR) video. Bull. Volcanol. 69, 769–784. doi: 10.1007/s00445-006-0107-0
Perugini, D., and Kueppers, U. (2012). Fractal analysis of experimentally generated pyroclastics: a tool for volcanic hazard assessment. Acta Geophys. 60, 682–698. doi: 10.2478/s11600-012-0019-7
Perugini, D., Speziali, A., Caricchi, L., and Kueppers, U. (2011). Application of fractal fragmentation theory to natural pyroclastic deposits: insights into volcanic explosivity of the Valentano scoria cone (Italy). J. Volcanol. Geotherm. Res. 202, 200–210. doi: 10.1016/j.jvolgeores.2011.02.008
Pioli, L., and Harris, A. J. L. (2019). Real-time geophysical monitoring of particle size distribution during volcanic explosions at Stromboli volcano (Italy). Front. Earth Sci. 7:52. doi: 10.3389/feart.2019.00052
Pyle, D. M. (1998). Forecasting sizes and response times of future volcanic events. Geology 26, 367–370. doi: 10.1130/0091-7613(1998)026<0367:fsarto>2.3.co;2
Ripepe, M., Delle Donne, D., Harris, A., Marchetti, E., and Ulivieri, G. (2008). Dynamics of Strombolian activity. The Stromboli Volcano: an integrated study of the 2002–2003 eruption. AGU Geophys. Monogr. Ser. 182, 39–48. doi: 10.1029/182gm05
Ripepe, M., Rossi, M., and Saccorotti, G. (1993). Image-processing of explosive activity at Stromboli. J. Volcanol. Geotherm. Res. 54, 335–351. doi: 10.1016/0377-0273(93)90071-x
Ruiz-Carulla, R., Corominas, J., and Mavrouli, O. (2017). A fractal fragmentation model for rockfalls. Landslides 14, 875–889. doi: 10.1007/s10346-016-0773-8
Rust, A. C., and Cashman, K. V. (2011). Permeability of vesicular silicic magma: inertial and histeresis effects. Earth Planet. Sci. Lett. 228, 93–107. doi: 10.1016/j.epsl.2004.09.025
Shea, T., Houghton, B. F., Gurioli, L., Cashman, K. V., Hammer, J. E., and Hobden, B. J. (2010). Textural studies of vesicles in volcanic rocks: an integrated methodology. J. Volcanol. Geotherm. Res. 190, 271–289. doi: 10.1016/j.jvolgeores.2009.12.003
Taddeucci, J., Alatorre- Ibargüengoitia, M. A., Cruz-Vázquez, O., Del Bello, E., Scarlato, P., and Ricci, T. (2017). In-flight dynamics of volcanic ballistic projectiles. Rev. Geophys. 55, 675–718. doi: 10.1002/2017rg000564
Taddeucci, J., Scarlato, P., Capponi, A., Del Bello, E., Cimarelli, C., Palladino, D. M., et al. (2012). High-speed imaging of Strombolian explosion: the ejection velocità of pyroclasts. Geophys. Res. Lett. 39:L02301. doi: 10.1029/2011GL050404
Turcotte, D. L. (1986). Fractals and Fragmentation. J. Geophys. Res. 91, 1921–1926. doi: 10.1029/jb091ib02p01921
Turcotte, D. L. (1992). Fractals and Chaos in Geology and Geophysics. Cambridge: Cambridge Univerisity Press.
Tyler, S. W., and Wheatcraft, S. W. (1992). Fractal scaling of soil particle size distribution: analysis and limitations. Soil Sci. Soc. Am. J. 56, 362–369. doi: 10.2136/sssaj1992.03615995005600020005x
Vanderkluysen, L., Harris, A. J. L., Kelfoun, K., Bonadonna, C., and Ripepe, M. (2012). Bombs behaving badly: unexpected trajectories and cooling of volcanic projectiles. Bull. Volcanol. 74, 1849–1858. doi: 10.1007/s00445-012-0635-8
Walker, G. P. L. (1973). Explosive volcanic eruptions—a new classification scheme. Geol. Rund. 62, 431–446. doi: 10.1007/bf01840108
Wittel, F., Kun, F., Herrmann, H., and Kröplin, B. H. (2004). Fragmentation of Shells. Phys. Rev. Lett. 93:035504.
Wittel, F., Kun, F., Kröplin, B., and Herrmann, H. (2006). Study on the fragmentation of shells. Int. J. Fract. 140, 243–254. doi: 10.1007/978-3-540-27145-1_11
Zi-Long, Z., Xi-bing, L., Yu-jun, Z., and Liang, H. (2006). Fractal characteristics of rock fragmentation at strain rate of 100 – 102 s-1. J. Cent. S. Univ. Technol. 13, 290–294. doi: 10.1007/s11771-006-0126-1
Keywords: fragmentation, fractal dimension, fragmentation energy, impact loading, explosive force, strombolian eruption, tephra, grain size distribution
Citation: Colo’ L, Ripepe M, Gurioli L and Harris AJL (2020) Fragmentation Processes During Strombolian Explosions Revealed Using Particle Size Distribution Mapping. Front. Earth Sci. 8:356. doi: 10.3389/feart.2020.00356
Received: 27 January 2020; Accepted: 31 July 2020;
Published: 25 August 2020.
Edited by:
Roberto Sulpizio, University of Bari Aldo Moro, ItalyReviewed by:
Corrado Cimarelli, Ludwig Maximilian University of Munich, GermanyJacopo Taddeucci, National Institute of Geophysics and Volcanology (INGV), Italy
Copyright © 2020 Colo’, Ripepe, Gurioli and Harris. This is an open-access article distributed under the terms of the Creative Commons Attribution License (CC BY). The use, distribution or reproduction in other forums is permitted, provided the original author(s) and the copyright owner(s) are credited and that the original publication in this journal is cited, in accordance with accepted academic practice. No use, distribution or reproduction is permitted which does not comply with these terms.
*Correspondence: Maurizio Ripepe, maurizio.ripepe@unifi.it