 Mithra-Christin Hajati
 Shane White
 Nils Moosdorf
 Isaac R. Santos2,4
94% of researchers rate our articles as excellent or good
Learn more about the work of our research integrity team to safeguard the quality of each article we publish.
Find out more
ORIGINAL RESEARCH article
Front. Earth Sci. , 20 October 2020
Sec. Soil Processes
Volume 8 - 2020 | https://doi.org/10.3389/feart.2020.00347
Changing land use in subtropical and tropical catchments to farmland can result in higher nitrogen (N) loss to aquatic ecosystems. Here, we developed a lumped water and N balance model to estimate regional N losses to creeks at catchment scale within understudied subtropical catchments in Australia. The conceptual water balance model CoCa-RFSGD was extended by the nitrogen mass balance in top and subsoil by adding nitrogen cycle transformation estimates depending on meteorological, soil, and land-use properties. The model estimates the impact of pristine and agricultural land use on catchment-wide water quality using only low-order creek samples as water quality measurements of nitrate and nitrite (NOx) with increased model performance with increased agricultural coverage. The model revealed that an agricultural proportion of 3% in the study site drove a 3.5-fold increase of N losses to creeks and a 6.7-fold increase of N losses to the atmosphere compared to catchments without agriculture. Agricultural land use lost 92 kg-N ha−1, 85% of which evaded to the atmosphere and 15% was discharged via surface waters. A change from forest to cleared land may increase the total denitrification potential of a catchment. Overall, our lumped model provides a simple but effective tool to upscale local aquatic water quality measurements to the catchment scale, allowing for assessment of changing land use on aquatic N loads in areas with limited data availability.
Humans started to alter the nitrogen (N) cycle centuries ago by cultivating N2-fixating legumes (Smith and Nesbitt, 1995), burning wood and coal (Smil, 1994), and developing industrial fertilizers (Smil, 2004). While the fate of much of this additional N depends on local conditions (Leuzinger et al., 2011; Dieleman et al., 2012), large amounts of this excess anthropogenic N discharged to water bodies or the atmosphere, which can effect human and environmental health (Townsend et al., 2003; WHO, 2003). Excess N in aquatic systems can increase greenhouse gas emissions (IPCC, 2013), change biological communities (Diaz and Rosenberg, 2008; McCrackin et al., 2017), and drive eutrophication (Rabalais, 2002; Howarth and Marino, 2006).
A large portion of the additionally available reactive N originates from fertilization and manure application (mainly as urea and ammonium) on agricultural fields, which microbial soil communities transform by hydrolysis, nitrification and denitrification to ammonium, nitrate and atmospheric N, respectively (Singh et al., 2010). Microbial N processes can drive N losses by either nitrate (NO3) and ammonium (NH4) leaching into groundwater and surface water or atmospheric N losses as dinitrogen (N2) (Mosier et al., 1998; Beaulieu et al., 2011) and nitrous oxide (N2O) (Wang et al., 2018). Local climate and soil conditions can influence microbial processes; for example, temperate climates have a higher rate of fertilizer N discharging into groundwater and surface water bodies, whilst the tropics may experience higher N losses into the atmosphere because denitrification increases with temperature and soil moisture (Talling et al., 1998; Houlton et al., 2006; Lee et al., 2019).
Contrary to most temperate regions in the Northern Hemisphere, many Southern Hemisphere subtropical and tropical regions still have pristine and arable land available, and this land is being rapidly transformed into agriculture (FAO, 2001; Lee et al., 2019). The humid tropics in particular have experienced a transformation of the rainforest (55% intact forest and 28% disturbed forest) into agricultural land (Lambin, 1997; Gibbs et al., 2010). Land use change from forest to agriculture affects the nitrogen cycle in multiple ways: (1) land use changes can drive localized climate extremes, such as increased heat days and breaks of monsoon, affecting soil microbial activities (Paeth et al., 2009); (2) there is an increase in greenhouse gas emissions, such as N2O from increased manure and fertilizer application (Davidson, 2009); (3) there can be lower nitrogen sequestration in agricultural soil than in forest soil (Lee et al., 2019); and (4) there may be additional losses of reactive nitrogen into ground and surface waters as well as losses of N2 to the atmosphere (Shen et al., 2008).
Land use and resulting N cycling changes may affect tropical climates more intensely. Although ~90% of global N fertilizers are applied in Asia, Europe, and North America, the tropics are expected to transmit comparably larger amounts of N into the atmosphere and surface water bodies (Galloway et al., 2004; Hietz et al., 2011; Lee et al., 2019). Tropical regions have an increased source of reactive N through an increased rate of lightning, as well as biological N fixation in rainforests via N-fixing canopy legumes (Vitousek et al., 2002; Cleveland et al., 2013). While temperate regions experienced an intensive land use change in the early 20th century, the soil nitrogen cycle in these regions has begun to stabilize, resulting in higher N sequestration potential (Lee et al., 2019).
Several modeling tools have been developed using transient mass-balances with empirical equations to assess the impact of land use and climate on soil N cycling and microbial N transformations (Lin et al., 2000). It is generally preferred to build models to suit specific study locations. A total of 80% of all distributed models simulating catchment N losses between 1992 and 2010 use one of the five most common models (Wellen et al., 2015). These models often include the soil interaction with lakes and the hydrology of snow at temporal resolutions <1 day as well as complex processes, such as crop growth, the soil carbon cycle, and the energy balance [see models DNDC (Liu et al., 2006), SWAT (Lam et al., 2010), and DAYCENT (Parton et al., 1998)]. Modeling small-scale processes at large scales demands high spatial and temporal input data regarding climate, soil, aquifer, fertilization, and land use. These data are often not available for tropical and subtropical areas that are rapidly changing. Water quality measurements and nitrogen loads are more abundantly available.
Here, we developed a model based on an conceptual understanding of the soil nitrogen cycle to estimate (1) catchment N surplus at data-poor regions using NOx creek water measurements only and to estimate (2) the impact of local land use changes in the subtropics. The model is an extension of the water balance model CoCa-RFSGD (Hajati et al., 2019). It was designed to simulate data-poor catchments in Indonesia because it relays on data sets, which are globally available. The model was applied in subtropical creeks of northern New South Wales (NSW), Australia.
Our model and observations were performed on the east coast of Australia extending from the town of Bellingen in the South (30°27′8.07″S, 152°53′52.67″E) to Yamba in the North (29°25′59.99″S, 153°20′59.99″E). We modeled catchments draining east from the Great Dividing Range (GDR) into the Pacific Ocean (Figure 1A). The study area has 217 sub-catchments with similar climate, stream order and geomorphology but a different percentage of agricultural, cleared land, and forest cover, allowing us to study the influence of land use on catchment-wide N losses.
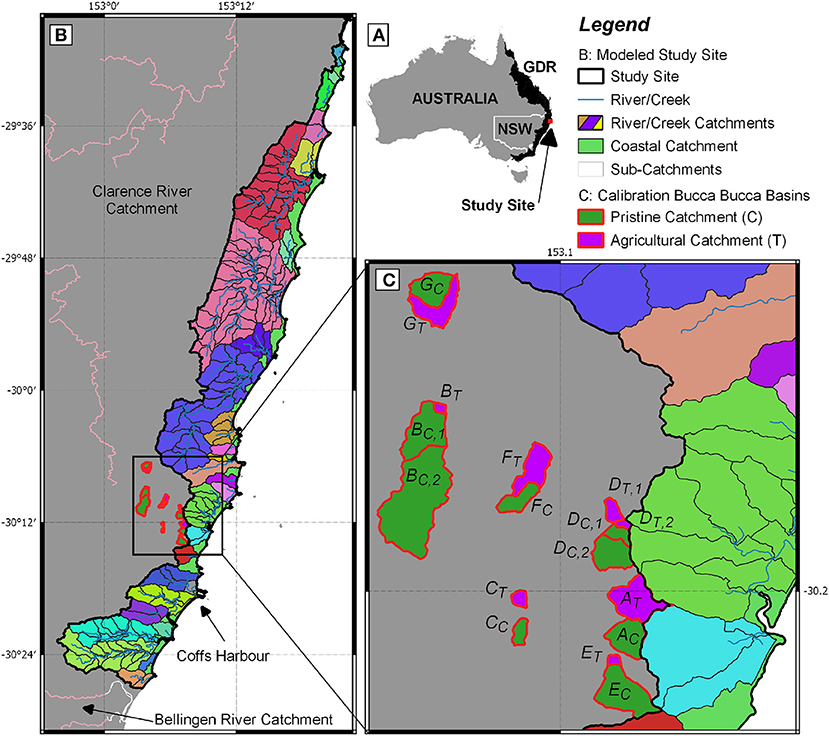
Figure 1. (A) Australia and the Great Dividing Range (GDR) in black with the location of the study site. (B) Study site, comprised of 217 sub-catchments (framed in black), 21 coastal catchments, classified as area between river/creek/coastal lake catchments (indicated in green), and 26 creek, river, and coastal lake catchments (indicated in different colors). The largest city of the study area is Coffs Harbour. (C) A total of 17 sub-catchments within the Bucca Bucca Creek catchment, (framed in red and labeled A–G) where spatial and temporal water quality monitoring, as well as land use and hydrology data was used to calibrate our model. Each agricultural (indicated by T and shown in purple) catchment (blueberry horticulture) was paired with an associated pristine (indicated by C and shown in green) catchment (no horticulture) according to White et al. (2018).
Precipitation within the study area is drained through a network of small rivers and creeks into the ocean (Figure 1B). We covered a narrow area of 900 km2 along the coastline in the humid subtropics. Coffs Harbour, the largest city of the study area, is located in the South (30°18′8.21″S, 153°07′8.03″E) and has an annual rainfall of 1,700 mm with ~60% of precipitation occurring from January to May (BOM, 2019). The average daily temperatures range between 14 and 23°C. Soils are generally strongly acidic with associated aluminum toxicity, high topsoil organic matter, low subsoil permeability, and low fertility (OEH, 2018), which is typical for tropical soils. The aquifer is composed of fractured Palaeozoic rocks or Mesozoic intrusives, forming an aquifer with a local flow system in the South but local and intermediate flow systems in the North (BOM, 2012). Hence, the region has small catchment sizes, and precipitation that recharged the aquifer flows for only short distances before discharging into local creeks.
Land use changes from horticulture dominated in the South, protected forests being found in the North, and some urbanized areas in between. The dominant agricultural land use of the study area has changed from banana plantations to blueberry horticulture since the year 2000 (Conrad et al., 2019). This land use change trend is expected to continue (Bevan, 2006; Government, 2017). The acidic and infertile soil of this area is ideal for blueberry farming (Hanson, 2006). NSW grows >90% of Australia's blueberries, generating annually ~AU$250 million per annum, with most of the industry concentrated within our study region (RDA Northern Rivers, 2017). The steadily growing industry raises increasing concerns for creek water quality (White et al., 2018). Creek waters draining blueberry farms show significantly higher NOx concentrations than forested catchments, with an estimated loss of ~20% of applied N fertilizer (White et al., 2018). The recommended annual fertilizer application on blueberries is 121 kg-N ha−1 and 83 kg-P ha−1 (Doughty et al., 1988; Ireland and Wilk, 2006), though actual application rates are not reported (Conrad et al., 2019).
To quantify the impact of a land use shift from pristine forest to blueberry farming in the subtropics, we combined the catchment water balance model CoCa-RFSGD (Hajati et al., 2019) with N mass balances based on well-established N equilibrium equations and first-order kinetics. This enables us to carefully draw conclusions on atmospheric losses, while the model is only calibrated on aqueous N losses. If the N cycle is closed, N input equals N output without losses to surface water bodies. Catchment N input occurs through biological N fixation (BNF), atmospheric N deposition, fertilizer application and plant litter fall. Catchment N output occurs through harvest, grazing animals, plant uptake and microbiologically through volatilization and denitrification. The N cycle is open when N inputs become larger than soil microbial bacteria can consume and plants can take up; microbial atmospheric losses via volatilization and denitrification will thus increase, and excess N will leach into ground and surface waters. We will further refer to additional reactive N caused by an open N cycle as nitrogen surplus (Nsurpl).
We focus on catchment Nsurpl entering surface waters and atmosphere, since the integrated catchment output of Nsurpl in surface water is related to catchment Nsurpl. This aspect is particularly relevant for regions where fertilizer application rates are not known and where, given governments' fertilization application, guidelines function as recommendations rather than regulations. Because the streams are groundwater-fed and located near the headwaters of the catchment, we assume that nitrogen loads in the low order stream of the study region represent the integrated catchment aqueous N loss. There is no trans-catchment groundwater pumping in the region. The catchment Nsurpl leaching to creeks and emitting to the atmosphere is dependent on natural and anthropogenic N input in the catchment, soil properties (pH, sand, silt, clay content, and bulk density) and meteorological properties (rainfall, evapotranspiration, soil moisture, and soil temperature).
The CoCa-RFSGD model (Hajati et al., 2019) is a water balance model working at catchment scale with a daily temporal resolution calculating topsoil and subsoil water content based on soil water balances. The model uses two unsaturated layers, lumped 30 cm topsoil (root zone), lumped 70 cm subsoil layer, and an aquifer layer with unspecified depth. Water input through precipitation surplus (precipitation minus evapotranspiration) fills the topsoil until the soil is saturated, and additional water is then transported through surface water runoff to surface waters. Leakage from the topsoil to subsoil and from subsoil to aquifer as well as capillary rise from subsoil to topsoil are calculated using unsaturated hydraulic conductivities calculated using the Van Genuchten (1980) approach. The study site is located on fractured rock, which is described to mainly form local flow systems (BOM, 2012); creek water is thus assumed to contain surface runoff and retarded subsoil runoff (interflow) and a groundwater layer is neglected (process 7 and 8 in Figure 2). Radon measurements at the Bucca Bucca creeks and a coastal catchment within our study area also suggest groundwater discharge is a negligible source of N (Conrad et al., 2018; White et al., 2018). We extended this model by mass transport and transformation of urea, NH4, and NOx.
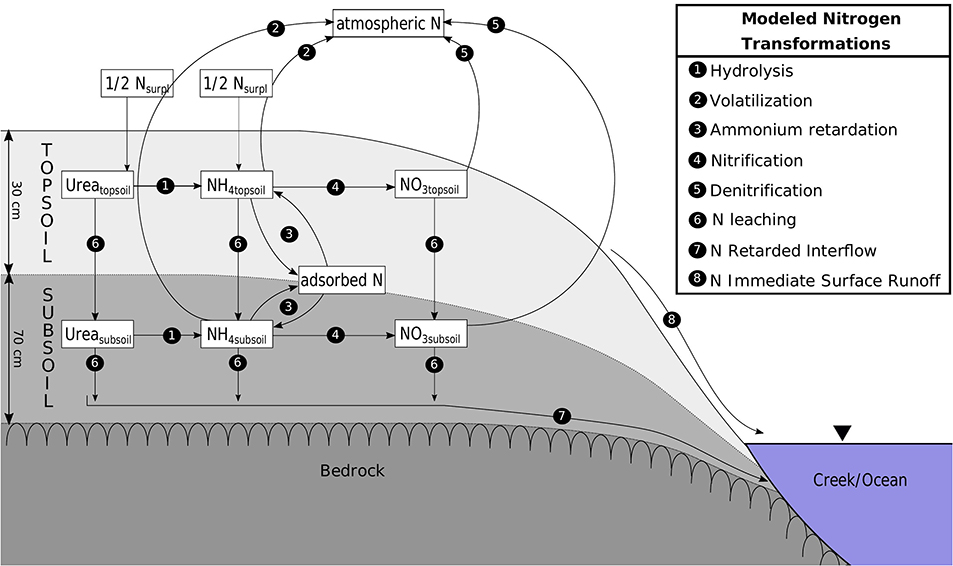
Figure 2. Transformations (processes 1–5) and transport (processes 6–8) of urea, ammonium, and nitrate modeled for top and subsoil.
We calibrated the model using weekly NOx measurements from February to May 2017, while the model period is 9 years from 2009 till 2018. In contrast to temperate systems with distinct annual patterns, our system responds to episodic events. The 4-months observation period is representative for the whole year and covers the hydrological extremes. The observation period allows us to study the effect of meteorological conditions of 2009 till 2018 on N cycling using the calculated Nsurpl of 2017. The calibration process and extrapolation onto the study area are explained in detail in section 3.3.
All data sets and parameters are listed in Table 1. Data were lumped for Bucca Bucca and study site sub-catchments using GRASS GIS (GRASS Development Team, 2017) performing GIS operations. Temporary variable input data was downloaded for 9 years with a daily resolution 2009-01-01 to 2017-12-31. The ASTER GDEM (Tachikawa et al., 2011) with a 30 × 30 m resolution was used to delineate the main eastern flowing river catchments of NSW within the GDR. Within the study area, we used a 5 × 5 m DEM (Geoscience Australia, 2015) to calculate 217 sub-catchments. AWRP precipitation and temperature data have an original resolution of 5 × 5 km, which does not match with the size of the sub-catchments ranging from 0.56 to 8.56 km2. Hence, the resolution was refined to 5 m and smoothed out using the nearest-neighbor interpolation. Local weather anomalies were neglected. Daily minimum and maximum air temperature were used to calculate daily soil temperature in the middle of each soil layer (15 and 65 cm) (Horton and Corkrey, 2011). Evapotranspiration was available from the MODIS product MOD16A2 (Running et al., 2017) in an 8-days resolution. Evaporation was assumed to be constant for 8 days (Hajati et al., 2019). Detailed land use maps are available for the year 2013 (OEH, 2017). All land was classified as (1) horticulture (agricultural and horticultural land use), (2) cleared land (all cleared land types from pasture to fertilized grazing), (3) pristine (all natural areas from nature conservation to rehabilitation), or (4) urban (all urban areas, including infrastructure).
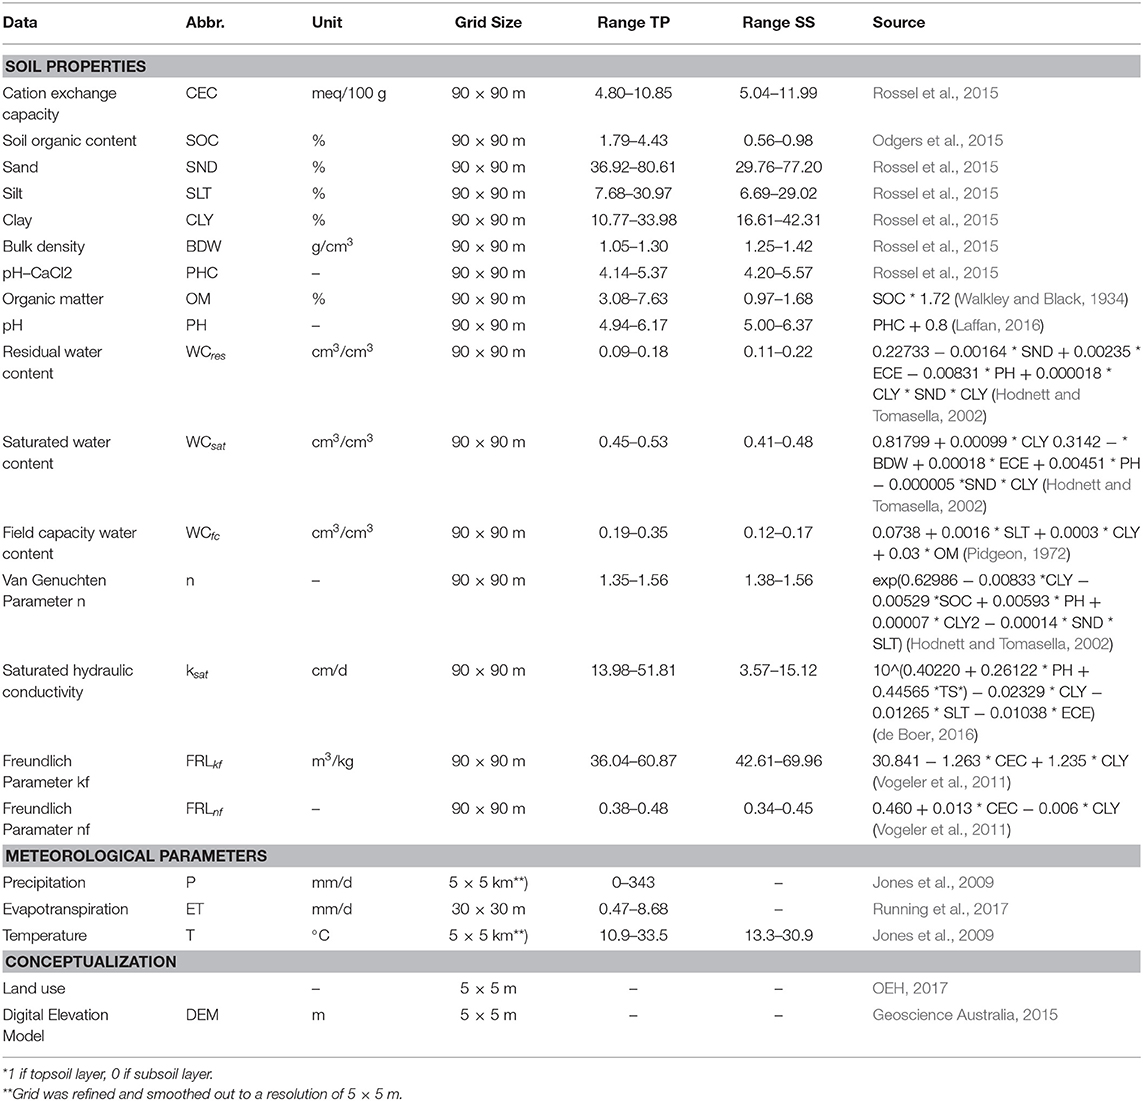
Table 1. Abbreviations (Abbr.), unit, grid size, data ranges from 0.3 m topsoil (TS) and 0.7 m subsoil (SS) and sources from soil, meteorological and conceptualization data used for the model.
Nitrogen fertilization periods and amounts are unknown, though, from what we could determine following conversations with farmers, the most common forms of N fertilizer in our study area are urea and ammonium based. Hence, we assume that N is applied with a ratio of 50% urea and 50% ammonium (White, 2018) at a constant daily rate. Furthermore, we assume top and subsoil are fully mixed. Hence, the changing concentration c (mg L−1) over time t (day) in the top and subsoil layer neglects diffusion, advection, and attenuation. Ad- and desorption (retardation) is considered for ammonium. N transformations are the same for top and subsoil and are introduced in the following modeling order.
(1) Hydrolysis: Urease is the key enzyme responsible for the transformation from urea to ammonium (hydrolysis). Hydrolysis depends on soil temperature, soil water content and available urea concentration. Here, hydrolysis rate, HYDR (1 d−1) was modeled combining the effect of temperature, moisture, and urea application (Lei et al., 2017):
with θ the soil water content (–), UREA the urea concentration (mg L−1 d−1), and T the soil temperature of the middle of the modeled layer (K).
(2) Volatilization: Volatilization reduces N from the aqueous phase by transforming ammonium to ammonia. A function depending on the pKa value for ammonia (pKa = 0.0901821+2729.92/T), which describes the ionic equilibrium between ammonia and ammonium, is used to calculate the volatilization rate VOL (1 d−1). This function depends on soil temperature (K) in the middle of the modeled layer and soil pH (–) (Emerson et al., 1975):
Soil-water-ammonia will equilibrate with air-ammonia. It is assumed that all aqueous ammonia will immediately leave the water phase into the atmosphere, because atmospheric ammonia concentrations are low. Hence, volatilized ammonium is considered a quick loss into the atmosphere.
(3) Ammonium retardation (adsorption and desorption): Retardation is only relevant for ammonium and is driven by adsorption and desorption of ammonium on soil particles. The retardation amount depends on soil pH (–), clay content (–), and organic carbon content (–) (Sheppard et al., 2009). A pedo-transfer function was used to calculate the Freundlich parameters kf (m3 kg−1) and nf (–), which takes the cation exchange capacity (meq/100 g) and the clay content (–) into account (Vogeler et al., 2011). The Freundlich parameters were used to calculate the amount of nitrogen that is adsorbed on soil:
with SORP (mg-N m−2), BD the bulk density of top and subsoil (kg/m3) and Vtot the total volume of the top and subsoil with 300 and 700 mm, respectively. Because of the nature of the Freundlich equation, the equilibrium concentrations change greatly at low ammonium concentrations. To prevent numerical instability, we limited the daily ad- and desorption load, which was initialized by an aqueous ammonium concentration change, to 10%. This limit delays the ad- and desorption process, keeping nitrogen dissolved in water and bound to soil for a longer time.
(4) Nitrification: Nitrification is the transformation from ammonium to nitrate by autotrophic archaeal (AOA) and bacterial ammonia-oxidizers (AOB). Nitrifying bacterial ammonia-oxidizers are most efficient if soil water content equals field capacity with no activity at air-dry soil and a 10% activity at saturation (Riedo et al., 1998). Temperature also has a positive effect on nitrification and follows the Van't Hoff-Arrhenius relationship (Keenan et al., 1979). An increase in ammonium concentration has a linear effect on the increase of nitrification activity. Furthermore, the efficiency of nitrifying bacteria strongly decreases with decreasing soil pH (Meyerhof, 1916; Engel and Alexander, 1958; Wild et al., 1971). Recent research showed that AOA are found in acid soils, which, with an absence of AOB, are the reason for high nitrification rates even in seasonally wet and acid tropical soils (Nicol et al., 2008; Gubry-Rangin et al., 2010; Yao et al., 2011; Prosser and Nicol, 2012; Pajares and Bohannan, 2016). In lights of this evidence by recent research and high NOx creek concentrations, we neglected nitrification reduction by a decreasing pH. Hence, the nitrification rate NITRI (mg-N d−1) is a function of soil water content (fnitri, θ), soil temperature (fnitri, T) and availability of ammonium (NH4 [mg-N]):
(5) Denitrification: Anaerobic bacteria transfer nitrate to molecular N (denitrification) and eliminate N from the aqueous phase. The bacterial activity depends primarily on temperature (fdeni, T), soil pH (fdeni, pH), oxygen (fdeni, θ), carbon (kdeni), and nitrate (NO3 [mg-N]) availability:
Denitrification is a sub-oxic process, and it is assumed to be negligible if the pore space is filled with air (water content is below field capacity). If the water content is within field capacity and saturation, the denitrification rate DENI (mg-N d−1) increases linearly (Riedo et al., 1998). The effect of soil pH on denitrification is described by a bell-shaped function. Maximum denitrification ratio occurs at pH = 7, a reduction of 50% occurs at soil pH >8 or <6 and a very low activity occurs at a soil pH <5 and >9 (Peterjohn, 1991). The denitrification activity increases linearly with increased available nitrate, but it is observed that at very high NO3 concentrations (e.g., 100–500 mg L−1 d−1 Bernot and Dodds, 2005) denitrification saturates and no longer linearly increases. It is recommended to use the Michaelis–Menten form to describe the effect of NO3 availability on denitrification (Heinen, 2006). Our catchments are assumed to be below very high concentrations, even in heavily fertilized horticulture catchments. Our estimations may therefore overestimate denitrification if very high concentrations were reached. The effect of temperature on denitrification is described by the Van't Hoff-Arrhenius relationship (Dawson and Murphy, 1972). The model does not include the carbon cycle. However, the model parameter kdeni accounts for soil carbon content, derived in a calibration process.
To calibrate the model, measured NOx creek water concentrations were fitted with modeled NO3 leakage to creeks. Observation catchments are nine pristine and seven agriculturally-dominated catchments located in the Bucca Bucca region (see Figures 1B,C, showing creeks A–G), which are described in White et al. (2018). These 16 catchments have weekly creek NOx measurements available for 4 months from 2017-02-07 until 2017-05-07, with a wide range of land uses and a similar geomorphology and climate to the study site. Within the 4-months measurement period, the air temperature was on average 23.3°C (standard deviation 3.4°C), which is slightly above the annual average temperature of 21.5°C (standard deviation 4.8°C).
The model generally applied physical and empirical equations calculating N transformations in soils. The only unknown variables are N input and the effect of soil organic carbon (SOC) on denitrification. The calibration finds best values for catchment Nsurpl and kdeni, which are directly related to N input and SOC on denitrification, respectively. Hence, the calibration results in the best Nsurpl and kdeni values for each Bucca Bucca catchment, with which the closest match of measured daily NOx and modeled NO3 creek water concentrations are simulated. The model code was interpreted as validated if fitting the two unknown values Nsurpl and kdeni, i.e., (1) reproduces N leakage events to creeks by the same observed precipitation events and (2) creek NOx concentrations rising and falling at the same order of magnitude. We fitted measured NOx with modeled NO3 creek water concentrations rather than NH4 creek water concentrations. Regional creek water NO3 is assumed to be modified by excess N inputs into the catchment, while NH4 can be a result of internal processes (White et al., 2018; Wadnerkar et al., 2019). The model performance of the calibration was evaluated using the Nash–Sutcliffe model efficiency coefficient (NSE) (Nash and Sutcliffe, 1970):
With n the number of measurements, Mi the modeled value at day t, Oi the measured value at day t and the mean of all measured values. If NSE = 1, the model simulates observation values perfectly, if NSE = 0, the model has the same explanatory power than the mean of all observations and if NSE <0 the model performance is a worse predictor than the observation mean. Hence, the closer NSE is to 1 the better the model performance.
To calibrate the models of the Bucca Bucca catchments, we ran the model 500 times with different random value combination for Nsurpl and kdeni. These random values were chosen within a reasonable data range based on the land use types pristine (all kinds of forests) and non-pristine (horticulture and grazing). Since fertilization practices on cleared land for grazing or on blueberry horticulture is unknown, we assume a constant daily fertilizer application rate for non-pristine land use: kdeni values were chosen to range between 0.001 and 20, a common data range (Heinen, 2006). The random Nsurpl values ranged according to the lumped land use from 2.25 kg-N ha−1 a−1 for entirely pristine to 121 kg-N ha−1 a−1 [recommended fertilization rate for Australian blueberries (Doughty et al., 1988; Ireland and Wilk, 2006)] for entirely agricultural land use. Pristine Bucca Bucca creeks respond to rain events with NOx leakage, implying an open N cycle (White et al., 2018). Hence, we assume a daily input rate of 2.25 kg-N ha−1 a−1 for pristine catchments. Random values of kdeni and Nsurpl within the defined value ranges guarantee no bias in the interpretation.
The difference between modeled NO3 and measured NOx was calculated for all 500 model runs at the measured dates. The model runs resulted in one optimum value of Nsurpl and kdeni for each Bucca Bucca catchment that simulates the closest NOx concentration. The optimum values visualized the effect land use has on the catchments. This correlation of land use with the parameters Nsurpl and kdeni at the 16 Bucca Bucca catchments were up-scaled to the 217 sub-catchments within the study area. The up-scaling is reasonable because the observation and modeled catchments have similar historical land use changes (i.e., heavily-fertilized blueberry horticulture), the same climate, similar stream orders, and the same geomorphology (White et al., 2018; Conrad et al., 2019).
The spatial data reveals that the study site is characterized in the North by forest with less precipitation and higher evapotranspiration than the South. The South has more urban and grazing areas than the North (Figure 3). Annual precipitation ranged during the 9-years modeled period between 1450 and 1955 mm, and evapotranspiration ranged from 525 to 1122 mm. The daily averaged soil temperature at 15 cm increased from South to North from 19.9 to 21.6°C and at 65 cm from 20.3 to 21.8°C, respectively. Topsoil pH ranged from 4.9 to 5.8, and subsoil pH ranged from 5.0 to 6.0. The highest pH values occurred at the southern mountain range and along the coastline, while lowest pH values occurred in the northern forests.
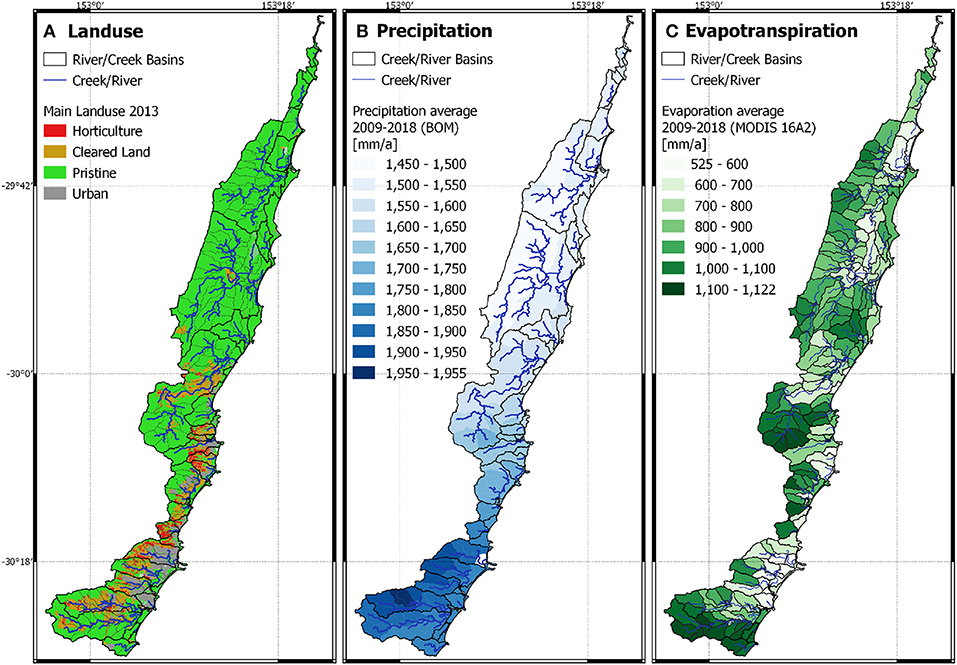
Figure 3. Major model inputs including land use (A), precipitation (B), and evapotranspiration (C).
The study site is covered by 77% forest, 12% cleared land, 3% horticulture, and 8% urban areas. The current change in land use toward intensive horticulture has increased N losses to open waters and the atmosphere. Pristine forests in the North lose 2.25 kg-N ha−1 on average, while horticulture loses 92 kg-N ha−1. If the entire study site remained pristine, the study site would emit annually 42,006 and 120,338 kg-N to waters and atmosphere, respectively. With the current land use the study site emits 147,022 and 805,581 kg-N to water and atmosphere, respectively. Thus, N release to creeks and atmosphere increases 3.5- and 6.7-fold, respectively, originating from 3% horticulture land use.
Of all precipitation events during the observation period, only one exceeded >100 mm. This major event increased nitrate loads and concentrations in all 16 Bucca Bucca creeks. This precipitation NO3 response was reproduced in the model for pristine and agricultural catchments (Figure 4). The modeled creek NO3 concentration followed the trend of observations in all 16 Bucca Bucca catchments, even though the tail of decreasing concentration was slower in the model than observed. The mean NSE for eight agricultural and nine pristine catchments is 0.18, while the mean for agricultural and pristine catchments is 0.55 (standard deviation = 0.31) and −0.15 (standard deviation = 0.61), respectively. The model performance increases with agricultural coverage and has very good performance for fertilized catchments and very low performance in pristine catchments.
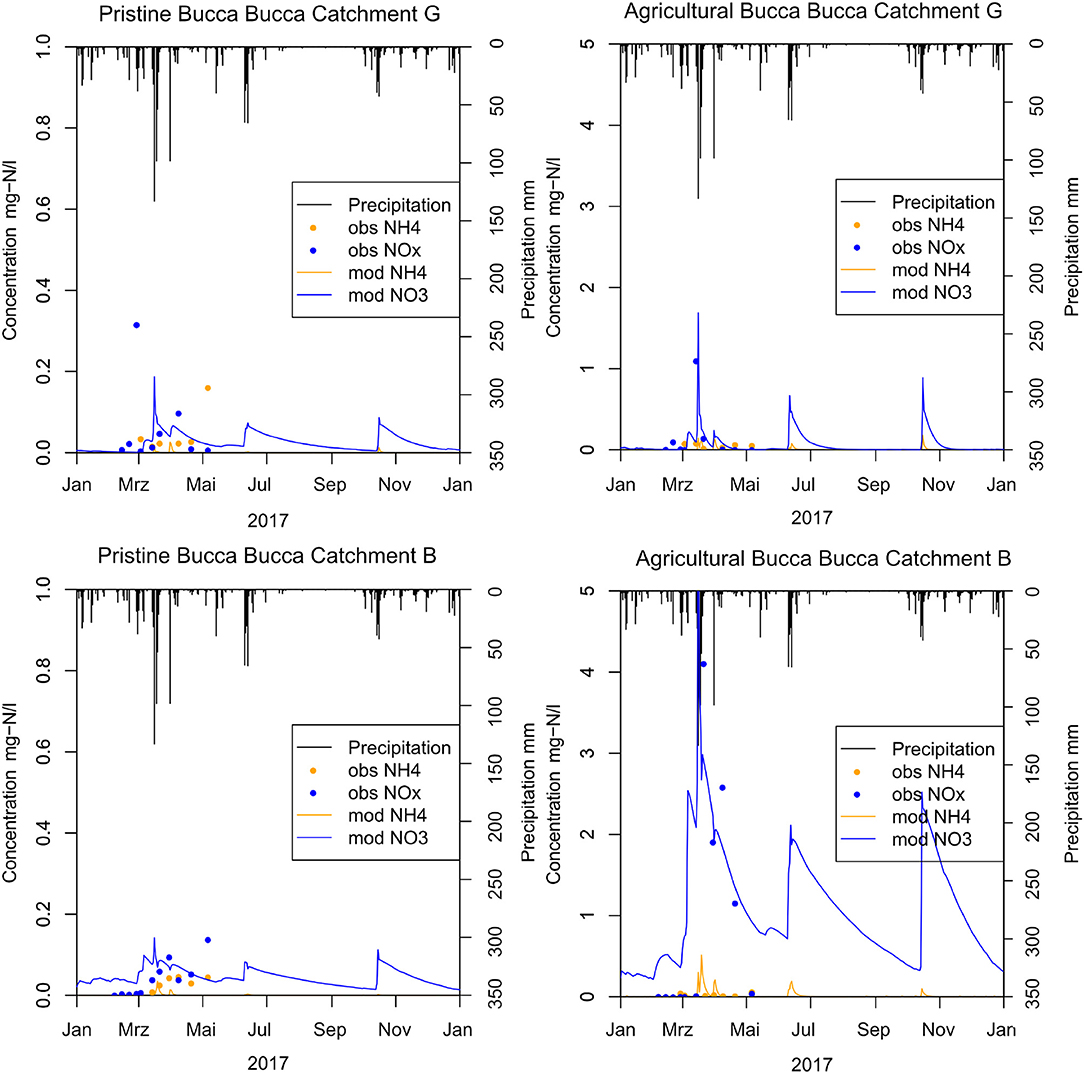
Figure 4. Modeled calibration results (mod) compared with weekly observed creek water measurements (obs) from February until May 2017 showing explanatory creek G (top) and B (bottom) for pristine (c) catchments (left) with 0% horticulture and agricultural (t) catchments (right) with horticultural coverage. The treatment catchment at creek G has 2.7% horticultural coverage and creek B has 59.1% horticulture.
Fitting NOx measurements of the Bucca Bucca creeks with the modeled creek nitrate concentrations revealed optimum values for catchment Nsurpl and the kdeni. As expected, catchments with less horticulture coverage showed lower Nsurpl (Figure 5). Catchments with larger horticultural coverage (creeks B, C, D, and E) had higher NOx flushing after precipitation events and showed continuously larger modeled NOx concentrations at dry periods (Figure 4, bottom right), on average 0.09 mg-N L−1. Optimum annual catchment Nsurpl ranged from a minimum of 0.12 kg-N ha−1 a−1 in a pristine catchment (creek FC) to a maximum of 66.02 kg-N ha−1 a−1 in an agricultural catchment (creek DT, 2). The model coefficient kdeni, ranged from 0.17 to 10.91, with a mean value of 4.40. The regression analysis of Nsurpl with horticulture, cleared land and forest resulted in p-values of p < 0.001, p = 0.95, and p = 0.003, respectively. Since Nsurpl has the most significant correlation with horticulture area (Figure 5, bottom), we extrapolated the linear trend onto the study site. The annual Nsurpl of catchments without horticulture ranged between 0.12 and 4.38 kg-N ha−1, with a mean of 2.25 kg-N ha−1 a−1 (0.6 mg-N ha−1 d−1). This mean value was extrapolated onto catchments without horticulture across the study site.
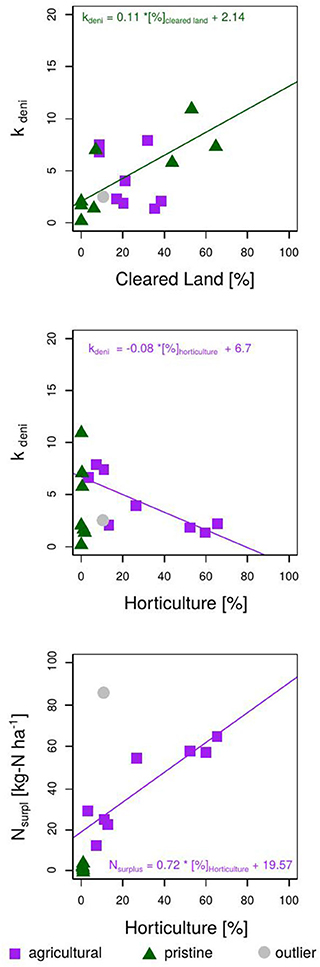
Figure 5. Result of the model calibration showing the optimum model parameters Nsurpl and kdeni for the 17 Bucca Bucca catchments. (Top) Linear correlation of kdeni with percentage cleared land. Middle: Linear correlation of kdeni and percentage horticulture. (Bottom) Linear correlation of Nsurpl and percentage horticulture. Control catchments are indicated in green (pristine = no horticulture) and show lower Nsurpl, than agricultural catchments (catchments with horticulture), indicated in purple. The pristine Bucca Bucca creek EC is indicated in gray; Creek NOx occurrence was delayed by multiple days, which resulted in erroneous model results, hence was not included in any regression analysis and is called Outlier.
The regression analysis of kdeni with horticulture, cleared land, and forest resulted in p-values of 0.16, 0.07, and 0.89, respectively, indicating only a correlation of low significance between kdeni and percentage cleared land. Excluding the pristine catchments from the regression analysis of kdeni and percentage horticulture, the significance increases (p = 0.02). Excluding the agricultural catchments from the correlation between kdeni and coverage cleared land, the significance increases also (p-value = 0.03). This indicates that the land uses, horticulture and cleared land, show different effects on the denitrification potential (kdeni). Non-agricultural sites with forest coverage have low kdeni values (0.17–2.05), and non-agricultural sites of mainly cleared land have high kdeni values (5.78–10.92). A high kdeni implies a higher reduction of N through denitrification, which is highest at sites with no horticulture and high coverage of cleared land. There is thus a negative and positive correlation between kdeni and increasing horticultural and cleared land coverage, respectively. We chose to extrapolate the significant correlation of kdeni and coverage cleared land at sites without horticulture (Figure 5, top) and the significant correlation between kdeni and horticulture on catchments with horticulture (Figure 5, middle).
We applied the derived linear correlations from the Bucca Bucca catchments to calculate kdeni for catchments without horticulture as a function of cleared land coverage, and for catchments with horticulture as a function of horticulture coverage. Nsurpl was calculated as a function of horticulture coverage. A total of 71 of the 217 sub-catchments are partly covered with horticulture, hence have higher Nsurpl than areas with only forest and cleared land (Figure 5, bottom). NH4 and NO3 leaching into creeks and rivers is high in the South and low in the North (Figure 6). The lowest Nsurpl (19.6 kg-N ha−1 a−1) was calculated for a catchment with 0.07% horticulture, and the highest Nsurpl (53.1 kg-N ha−1 a−1) was calculated for a catchment with 46.7% horticulture.
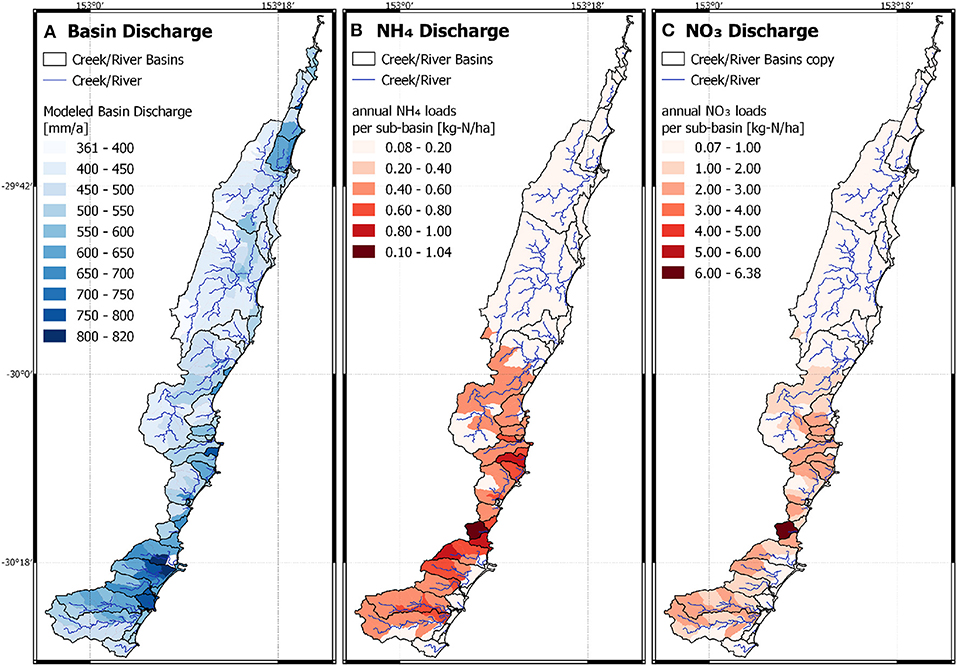
Figure 6. Model result of the extrapolation of the calibrated Bucca Bucca catchments applied on the study area. (A) Averaged annual discharge into creeks by immediate surface runoff and interflow. (B) Averaged annual discharge of ammonium into creeks. (C) Averaged annual nitrate discharge into creeks.
The 900 km2 study area has an estimated Nsurpl of 980,000 kg-N a−1, 87% of which originates from catchments with horticulture, even though horticulture covers only 3% of the total area. 149,000 kg-N a−1 are lost into surface water bodies. Losses into the atmosphere via volatilization and denitrification are 5-fold higher than surface water, at 806,000 kg-N a−1, where 91% originates from catchments with horticulture. Hence, catchments with horticulture release less N to creeks than into the atmosphere, but far more than pristine catchments (Figure 7).
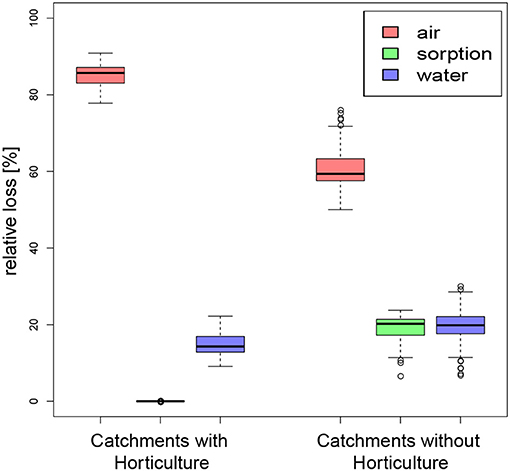
Figure 7. Relative losses of nitrogen into air, water, or retardation from catchments with and without horticulture, indicating a larger importance of volatilization and denitrification (losses into air) for catchments with horticulture than for pristine catchments.
The water balance of the model CoCa-RFSGD calculates for catchments with horticulture more surface runoff than interflow (soil drainage), 55.6 and 44.4%, respectively. In contrast, pristine catchment creek discharge originated 40.6% from immediate runoff and 59.4% from interflow. The form of N discharged into creek water also differed between different land use types. Catchments with horticulture and catchments with only cleared land and forest showed relative losses of 83 or 96% nitrate, 15 or 4% ammonium, and 1.2 or 0.07% urea, respectively.
Soil properties and meteorological conditions affected N transformations. Relative loads into air increased by increasing soil pH, soil depth, precipitation surplus, and residual water content (Equations 1–5). Hence, N transformations differed regarding land use, soil type, and meteorological conditions (see Table 2). Nitrification and denitrification were higher during the wet season in horticultural catchments, while volatilization and hydrolysis did not change. Volatilization was only 0.02% of the annual Nsurpl. Non-horticultural catchments retarded about 38% of the modeled N input during the wet and dry season. Horticultural topsoils show adsorption and desorption processes at equilibrium (Table 2).
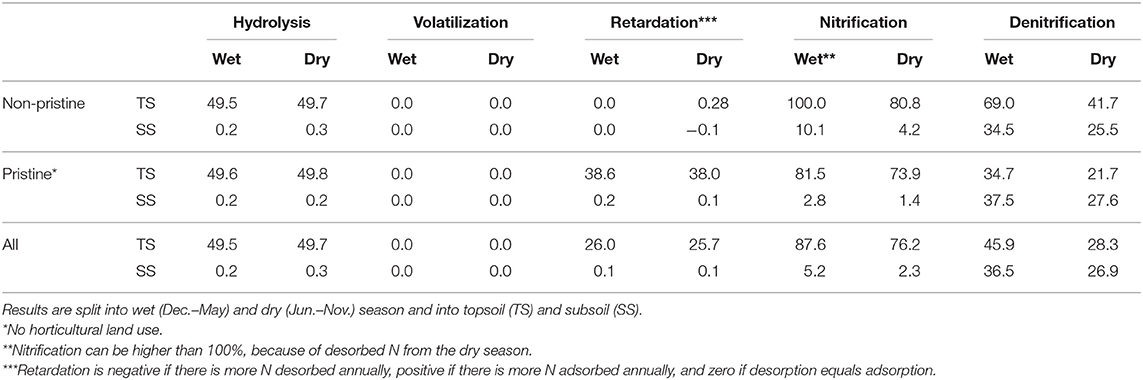
Table 2. Percentage of annual nitrogen surplus (Nsurpl) being transformed by hydrolysis, volatilization, nitrification, denitrification and retarded by ad- and desorption processes.
The effect of wet and dry seasons on N leaching into surface water bodies can be interpreted with the model. Catchments with horticulture released during the wet season from December to May 66 and 67% ammonium through surface runoff and interflow, respectively. Pristine catchments released during the wet season 55 and 50% ammonium though direct runoff and interflow, respectively. Catchments with horticulture released nitrate during the wet season 53 and 50% through direct runoff and interflow, respectively, while catchments without horticulture released 44 and 55% nitrate through direct runoff and interflow, respectively.
Monthly estimates revealed for the study year 2017, the highest releases of N through direct surface runoff and interflow were in March, June, and October, the wettest months of that year (Figure 8). Highest loads to creeks were in March, which was part of the measurement period from February to May. Lowest N losses to atmosphere were in the winter months with lower temperatures. Catchment N loads from horticultural catchments to creeks and rivers vary largely over the model years from 2009 till 2017 (see Figure 9). The wettest year, 2009 (on average 2,209 mm), and the driest year, 2016 (on average 1082 mm), did not show the largest and lowest N loads to surface water bodies. The highest loads for surface water bodies were in 2015 with 5.4 kg-N ha−1 and the lowest in 2013 with 1.9 kg-N ha−1, and the highest loads to atmosphere occurred in 2016 with 24.2 kg-N ha−1 and the lowest loads in 2015 with 12.8 kg-N ha−1.
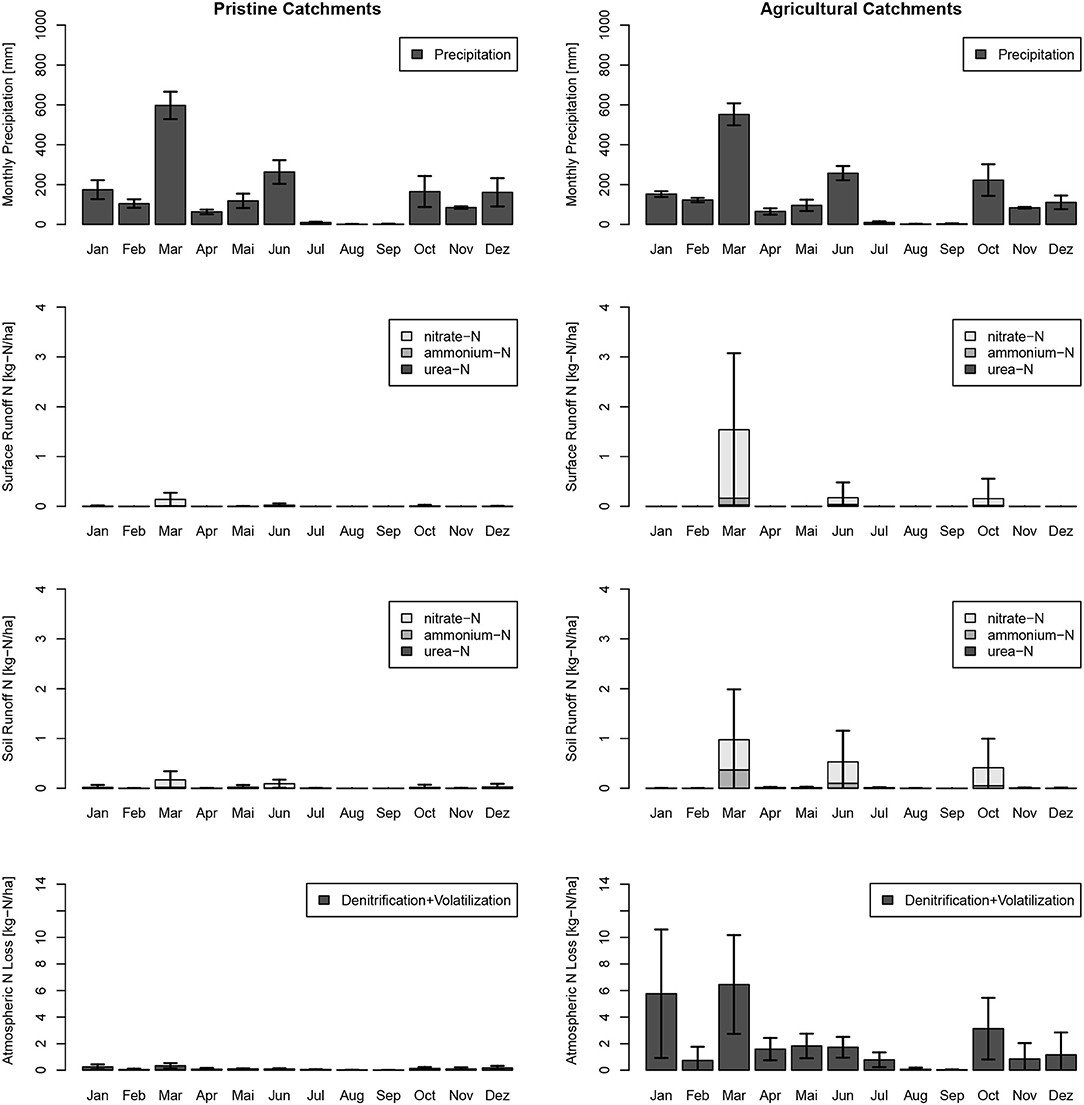
Figure 8. Monthly urea-N, ammonium-N, and nitrate-N loads of the study site sub-catchments in immediate surface runoff (Surface Runoff) and retarded interflow (Soil Runoff) for the calibration year 2017. Results were split into pristine (no horticulture) and horticultural catchments, and standard deviations of the model results of all 146 pristine catchments and 71 horticultural catchments are indicated.
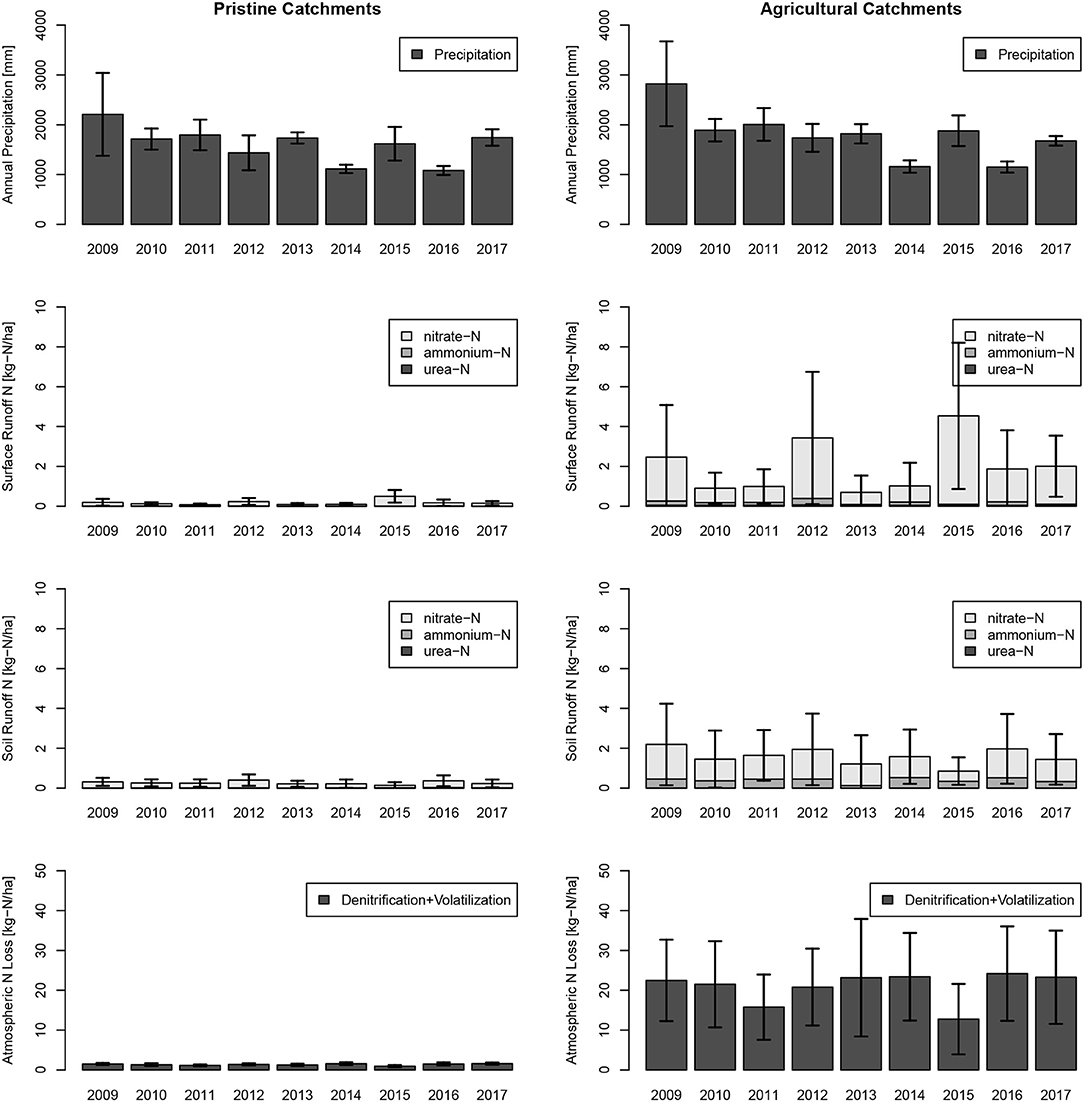
Figure 9. Annual sums of precipitation and total-N contribution from urea-N, ammonium-N, and nitrate-N to creeks and standard deviations of the model results in immediate surface runoff (Surface Runoff) and retarded interflow (Soil Runoff) are indicated. Results were split into pristine (no horticulture) and horticultural catchments. The year 2017, on which the model is calibrated, shows nitrogen leakage of an average amount compared to the years 2009–2017.
Nitrogen losses to creeks across a land use gradient in subtropical catchments were analyzed by upscaling the correlation of land use with water quality measurements of low-order creek catchments. The large N loads imply an open N cycle even for pristine catchments but increasingly with increased coverage of horticulture. Hence, an over-application of N fertilizers is likely the reason for NOx in surface water bodies. The model built in this study takes into account daily soil moisture changes, meteorological values and soil properties to calculate N transformations and transport. This model can be extrapolated to areas with a similar land use and a similar climate.
Soil pH, temperature and moisture are important factors impacting microbial processes and N transformations in the model, and their effect has also been observed in in situ studies. For example, soil pH impacts volatilization. Measurements at an acid soil in Canada resulted in volatilization losses between 3 and 7% (Fan and Mackenzie, 1993). The soil of the study area has low pH typical of tropical soil lowering N losses by volatilization to 0.02% and rendering this transformation locally irrelevant. Denitrification is also reduced at low soil pH, which has been observed in laboratory experiments (Remde and Conrad, 1991). The topsoil of the study site has a pH ranging from 5 to 6.2, potentially inhibiting nitrification (Meyerhof, 1916; Engel and Alexander, 1958; Wild et al., 1971). However, recent research showed high nitrification rates even in strongly acid soils due to autotrophic bacteria (Pett-Ridge et al., 2013), or more likely, specialized archaea (Gubry-Rangin et al., 2010; He et al., 2012; Hu et al., 2014; Stempfhuber et al., 2015; Li et al., 2018). Taking into account low NH4 and elevated NOx creek measurements after a heavy rain event, we assume nitrification is not limited by pH at our study site. Soil temperatures and soil moisture also impact volatilization, nitrification, and denitrification by increasing microbial activity (Talling et al., 1998; Rotz, 2004; Montes et al., 2009, e.g.,) and denitrification by changing oxygen availability for the microbial community (Jørgensen et al., 1998; Allen et al., 2010; Hansen et al., 2014), respectively.
Modeling results reveal that nitrate discharge into creeks did not change in wet and dry season, while 2/3 of the ammonium discharged to creeks during the wet season. Denitrification increases with higher nitrate concentrations, which reduces the potential for nitrate accumulation during the dry season and release during the wet season. During the wet season, ammonium pore water concentrations are diluted, and the soil can adsorb less ammonium resulting in lagged desorption of soil ammonium. This desorbed ammonium has the potential to be nitrified, delaying pollution loads to creeks until the wet season arrives and transports N from soil storages to the creeks. During months with high precipitation, the highest loads of N are transported into creeks (Figure 8). Seasonal N loads to rivers have been observed to affect N transformations in unregulated and small rivers elsewhere. For example, 85% of the annual river and most of the nitrate discharge was observed during the wet season from November to April in southwest Europe (Romero et al., 2013). In contrast, highly regulated rivers retain most of the nitrate in their catchment and have relatively low nitrogen concentrations (Lassaletta et al., 2009).
Prolonged droughts and increased extreme river runoff for many regions of the world are predicted for the next decades (Davidson et al., 2011), which may lead to increased nitrogen build-up in soils during the dry season and an increased sudden release of nitrate and ammonium during flooding events. The additional reactive N from horticulture will mainly transfer to the atmosphere rather than build up in soil due to higher denitrification potential (Figure 7), which would proportionally reduce stream loads (Lee et al., 2019). In contrast, desorption and nitrification of ammonium during the wet season will increase surface water nitrate concentrations. A large fraction of the nitrate losses into surface water bodies are expected to be denitrified at higher temperature and nitrate concentrations, which makes it an important process in tropical waters (Talling et al., 1998). Hence, the creek nitrogen loads in the study site may be reduced in a warming climate, replaced by atmospheric losses. Depending on the soil and sediment conditions, this reactive N may be exported as N2 or the greenhouse gas N2O.
Three pristine Bucca Bucca catchments showed 4.6, 137.6, and 19.6 times higher NOx concentrations in creek water during the wetter months (February and March) compared to the dryer months (April and May) during observations (White et al., 2018). These concentration gradients were incorporated in the model by assuming an annual Nsurpl of 2.25 kg-N ha−1 even for entirely pristine catchments. The Soil Landscapes of the Coffs Harbour dataset (OEH, 2018) describes the soil of the study area to be strongly acidic, which is typical for tropical and subtropical soils. The older underlying geologic substrates are generally depleted in phosphorus and cations (Pajares and Bohannan, 2016). Hence, tropical and subtropical soils tend to be P limited with relatively high losses of N via denitrification and groundwater leaching (Vitousek and Matson, 1988; Martinelli et al., 1999; Brookshire et al., 2012). The creek water measurements in the Bucca Bucca catchments confirm that soils in pristine forests are likely N-saturated, and they function as a long-term N source, which is typical for tropical forests (Hedin et al., 2009).
Our model implies that regional blueberry horticulture loses annually 92 kg-N ha−1, which is equivalent to 76% of the recommended application rate of 121 kg-N ha−1. Nsurpl is the total N, which was not retained within the catchment, without differentiating the source (fertilization, biological N fixation and/or atmospheric N fixation). Studies on blueberry farming showed an optimum growth:fertilizer ratio is at an annual N fertilizer rate of 63–93 kg-N ha−1. Higher fertilization generates more harvest at the cost of increasing N losses (Vargas and Bryla, 2015), potentially explaining our high nitrogen losses.
Globally, the fertilizer demand increases by 1.9% and the fertilizer supply increases by 1.7% per year (FAO, 2001). Australia follows this trend showing a growing consumption of nitrogen-based fertilizers from 47.6 kg-N ha−1 in 2002 to 68.1 kg-N ha−1 in 2016 (worldbank.org, 2019), representing an annual increase of 1.5%. The increased fertilizer application trend has been observed in the regional sediment record with an 8-fold increase of phosphorous in lake sediments following blueberry farming expansion in the last two decades (Conrad et al., 2019). Nitrogen burial in sediments did not increase because nitrates are soluble and will be exported to the ocean or lost to the atmosphere (White et al., 2018). This observation is consistent with our model results that catchments with horticulture lose 85% of the Nsurpl into the atmosphere and pristine catchments lose 61% into the atmosphere. If horticultural areas expand by 1%, losses to the atmosphere will increase by 1.3 kg-N ha−1 a−1, while losses to surface water bodies increase by 0.2 kg-N ha−1 a−1. While most N is lost primarily to atmosphere in the tropics by increasing denitrification, temperate climates lose more N to rivers as DIN (Lee et al., 2019).
The regional catchments have an 8% decline in denitrification potential in areas with increased horticultural land use, and an 11% increase in denitrification potential in areas with increased cleared land (Figure 5). The denitrification potential depends on soil organic carbon (SOC). SOC delivers energy to the denitrifying microbial community and thus increases denitrification. Land use changes have been reported to influence SOC, where agricultural lands have low SOC storage (Conant et al., 2017), whilst wet forest can store >25% more SOC than agricultural land (Detwiler, 1986; Penman et al., 2003; Don et al., 2011). Wet forests can store between 9% larger (Guo and Gifford, 2002) and 12% lower (Don et al., 2011) SOC than grassland, depending on local conditions. The improved denitrification potential of cleared land shows that grassland has a beneficial effect on soil organic carbon content at the study region (Conant et al., 2001).
Our model estimates Nsurpl at a coastal area of NSW, Australia, and provides a tool to better interpret catchment responses of nitrogen leakage to creeks in poorly studied subtropical and tropical climates. The model relies on the assumption that study site streams are comprised of surface runoff and interflow. Water fluxes are calculated using the model CoCa-RFSGD (Hajati et al., 2019). These fluxes depend on storage capacity and soil properties and not on surface topography. The model presented in this study has a series of simplifications and assumptions regarding model conceptualization and nitrogen transformation modeling.
The conceptualization of the catchment hydrology was simplified by neglecting groundwater recharge and discharge to creeks. This simplification is acceptable because the modeled catchments (Figure 1) have a fast discharge response to precipitation. Groundwater recharge and discharge processes are minor as implied from tracer observations (White et al., 2018). The model calculates the soil N cycle based on a mass balance, where N transformations are calculated with common process knowledge. Catchment nitrogen surplus is calculated using creek NOx measurements, while modeled atmospheric losses are not cross-checked with measurements. Even though it would be necessary to fit modeled atmospheric losses with measurements, this is an acceptable limitation since atmospheric losses are largely driven by temperature, soil moisture and soil pH, which are included in our model. Also, measuring the integrated atmospheric N losses is generally not possible at catchment-scale, compared to aqueous N losses. Lumping soil and meteorological variables, as well as topsoil and subsoil set-up, neglects local phenomenons (e.g., local precipitation events, the temporary pH increase by urea applications or the higher soil pH and lower permeability of the upper soil). This simplification seems reasonable, because the model calibration is done with NOx creek measurements that integrate catchment losses. An important part of the model conceptualization is the assumption that fertilizer application occurs daily at a constant rate with a ratio of 50% urea and 50% ammonium. The amount and timing of fertilizer application are important but not known for these farming practices. Conversations with farmers indicate that small amounts of fertilizer are added often, though they are dependent on crop needs and environmental variables. This closely matches our methodology of assuming continuous small inputs over time. As low nitrate concentrations can limit denitrification (Tomasek et al., 2017), the timing of fertilizer applications can reduce nitrate leaching (Bruulsema, 2009), which depends on the growth stage of the crop; in turn, this is indirectly taken into account by looking into the losses in creek water for precisely that particular season. However, NOx measurements during other crop growth phases are not available, and there is no information available about the fertilizer efficiency during other growth phases.
We did not take into account the N attenuation of the riparian zone, which potentially decreases nitrogen loads to creeks (Ranalli and Macalady, 2010), hence, underestimates the catchment Nsurpl. Furthermore, we neglected the effect of nitrate saturation on denitrification, which might overestimate denitrification and the catchment Nsurpl. Even in highly modified catchments, denitrification saturation was not observed (O'Brien et al., 2007), implying our assumption is reasonable. The carbon cycle is highly connected with the nitrogen cycle. Even though we did not model the carbon cycle, we calibrated the denitrification potential kdeni, which is associated with the beneficial effect of SOC. Therefore, kdeni is a proxy for the impact of the carbon cycle on the N cycle. The resulting significant linear correlation between denitrification potential and land use is a simplification of a complex correlation between soil organic carbon and denitrification and likely only valid in this region. Furthermore, the model is calibrated using measurements from February to May 2017. In these months, mean soil temperatures were slightly higher than in the annual average by 1.9°C, showing likely higher atmospheric losses during the observation months than the model period. Since temperature is considered in this model, the effect on calibration is negligible.
Besides the model conceptualization and simplifications on N transformations, the model calibration and model performance are impacted by the spatial and temporal input data. During the weekly measurements in 4 months, only one rain event flushed catchment N out into creek water. Multiple other rain events did not show an increase of NOx in creek water, likely due to low soil moisture in a dry period. Hence, it was not possible to validate the model on a second response of rain on creek water quality. The lack of validation and calibration on water fluxes raises concerns for equifinality, which cannot fully be eliminated. Equifinality is largely a problem of overparametrization (Young and Beven, 1994; Beven, 1995). Since we applied basic equations of the nitrogen cycle and only fitted two parameters (kdeni and Nsurplus), we limited the problem of equifinality. In future simulations, it would be advisable to validate the model on additional heavy rain events. Also, at the 17 observation catchments measurements were taken at 11 days within 4 months. With the low number of observations per catchment, model performance is difficult to calculate and results in all agricultural catchments to a good model performance, while 62.5% of pristine catchments show a bad model performance (NSE <0). The model performance analysis indicates that model performance increases with increased fertilization. One explanation might be that in pristine catchments, riverine N transformations become relatively more important, and this is not included in the model. Furthermore, the input data of the model are coarser resolved than the sub-catchments. This low resolution and missing standard deviations of input data prevents us from including the effect of microclimate on the microbial N transformations and an uncertainty analysis. Nevertheless, annual weather differences clearly show the model dependency on seasonal temperature and precipitation cycles (see Figures 8, 9).
Overall, it was reasonable to extrapolate the conceptualization and calibration results to multiple regional catchments because climate, lithology and land use are similar in the observed and modeled catchments. The modeled area has land use types similar to the observed Bucca Bucca catchments, which are 0–100% forest, 0–65% horticulture, and 0–68% cleared land. The model provides insights into the general nitrogen loads of pristine and horticultural catchments in the subtropics and its response to different land uses and precipitation patterns. This model could be improved by adding carbon cycling and riparian zone processes. For a thorough study site analysis, precipitation, temperature, and evapotranspiration data need to be available in an appropriate resolution, and observation data should include multiple catchment responses on precipitation events.
We developed a modeling tool calibrated on timeseries NOx loss measurements in low-order creeks improving our understanding of the effect agricultural and pristine land use has on catchment-wide water quality in subtropical conditions. The model extends the water balance model CoCa-RFSGD, adding soil nitrogen cycling based on well-established physical and empirical equations, and has an increasing model performance with increasing agricultural coverage. We found that 81% of the reactive Nsurpl leaves the catchments into the atmosphere and that 15% is transported to surface water bodies. The 900 km2 large study area is only covered by 3% horticulture, which is responsible for a 3.5-fold increase in N losses to surface water bodies and a 6.7-fold increase of N losses into the atmosphere.
The calibrated model gave insight into the general catchment behavior relative to seasonal climate and land use. Ammonium accumulated in soils during the dry season and was released during the wet season, potentially increasing nitrate concentrations in surface waters. Denitrification increased during the warmer wet season and is relatively higher in horticulture catchments than in pristine ones. Aqueous N losses occur mainly during wet months. A transformation into cleared land increased the denitrification potential due to the addition of soil organic carbon.
Our results underline that a large percentage of applied fertilizer is lost to waterways, especially in the humid subtropics and would need to be carefully regulated to prevent fueling eutrophication. In particular, we have estimated that agricultural land uses in northern NSW lose 92 kg-N ha−1 into the atmosphere and surface water bodies, which is equivalent to 76% of the recommended N fertilization rate. The lost N is a sizeable economic loss and potentially a health, ecological, and climate issue.
All datasets generated for this study are included in the article/Supplementary Material.
Research idea by M-CH and IS, with contributions from NM. Measurements and study side knowledge was supplied by SW. Model conceptualization, programming, model calibration, model extrapolation, and model analysis by M-CH. Manuscript writing by M-CH with contributions from SW, NM, and IS. All authors contributed to the article and approved the submitted version.
The German Federal Ministry of Education and Research (01LN1307A), the Coffs Harbour City Council Environmental Levy program, and the Australian Research Council (FT170100327) provided funding for this research.
The authors declare that the research was conducted in the absence of any commercial or financial relationships that could be construed as a potential conflict of interest.
We like to thank Brian Horton for a friendly and helpful feedback on soil temperature modeling, Kathie Macintosh for a brainstorming session on nitrogen cycling and Barbara Robson for discussing water quality modeling. A DAAD scholarship for doctorate candidates and the staff of the NMSC in Coffs Harbour made it possible to visit the study site and establish a lasting knowledge exchange. We thank two reviewers for very insightful comments.
The Supplementary Material for this article can be found online at: https://www.frontiersin.org/articles/10.3389/feart.2020.00347/full#supplementary-material
Allen, D. E., Kingston, G., Rennenberg, H., Dalal, R. C., and Schmidt, S. (2010). Effect of nitrogen fertilizer management and waterlogging on nitrous oxide emission from subtropical sugarcane soils. Agric. Ecosyst. Environ. 136, 209–217. doi: 10.1016/j.agee.2009.11.002
Beaulieu, J. J., Tank, J. L., Hamilton, S. K., Wollheim, W. M., Hall, R. O., Mulholland, P. J., et al. (2011). Nitrous oxide emission from denitrification in stream and river networks. Proc. Natl. Acad. Sci. U.S.A. 108, 214–219. doi: 10.1073/pnas.1011464108
Bernot, M. J., and Dodds, W. K. (2005). Nitrogen retention, removal, and saturation in lotic ecosystems. Ecosystems 8, 442–453. doi: 10.1007/s10021-003-0143-y
Beven, K. (1995). Linking parameters across scales: subgrid parameterizations and scale dependent hydrological models. Hydrol. Process. 9, 507–525. doi: 10.1002/hyp.3360090504
BOM (2012). Australian Hydrological Geospatial Fabric (Geofabric) Version 2.1. Technical report, BOM, Canberra.
BOM (2019). Climate Statistics for Australian Locations. Available online at: http://www.bom.gov.au/climate/averages/tables/cw_059040.shtml (accessed March 31, 2019).
Brookshire, E. N. J., Gerber, S., Menge, D. N. L., and Hedin, L. O. (2012). Large losses of inorganic nitrogen from tropical rainforests suggest a lack of nitrogen limitation. Ecol. Lett. 15, 9–16. doi: 10.1111/j.1461-0248.2011.01701.x
Bruulsema, T. (2009). Know your fertilizer rights. Crops Soils 42, 13–18. Available online at: http://www.ipni.net/ipniweb/portal/4r.nsf/0/1748D80FEC9FE7C185257DF10074A028/$FILE/Know%20Your%20Fertilizer%20Rights.pdf
Cleveland, C. C., Houlton, B. Z., Smith, W. K., Marklein, A. R., Reed, S. C., Parton, W., et al. (2013). Patterns of new versus recycled primary production in the terrestrial biosphere. Proc. Natl. Acad. Sci. U.S.A. 110, 12733–12737. doi: 10.1073/pnas.1302768110
Conant, R. T., Cerri, C. E. P., Osborne, B. B., and Paustian, K. (2017). Grassland management impacts on soil carbon stocks: a new synthesis. Ecol. Appl. 27, 662–668. doi: 10.1002/eap.1473
Conant, R. T., Paustian, K., and Elliott, E. T. (2001). Grassland management and conversion into grassland: effects on soil carbon. Ecol. Appl. 11, 343–355. doi: 10.1890/1051-0761(2001)011[0343:GMACIG]2.0.CO;2
Conrad, S. R., Sanders, C. J., Santos, I. R., and White, S. A. (2018). Investigating water quality in Coffs coastal estuaries and the relationship to adjacent land use. Part 1: Sediments. Coffs Harbour, NSW: National Marine Science Centre, Southern Cross University. 42.
Conrad, S. R., Santos, I. R., White, S., and Sanders, C. J. (2019). Nutrient and trace metal fluxes into estuarine sediments linked to historical and expanding agricultural activity (Hearnes Lake, Australia). Estuar. Coasts 42, 944–957. doi: 10.1007/s12237-019-00541-1
Davidson, E. A. (2009). The contribution of manure and fertilizer nitrogen to atmospheric nitrous oxide since 1860. Nat. Geosci. 2, 659–662. doi: 10.1038/ngeo608
Davidson, E. A., David, M. B., Galloway, J. N., Goodale, C. L., Haeuber, R., Harrison, J. A., et al. (2011). Excess nitrogen in the U.S. environment: trends, risks, and solutions. Issues Ecol.
Dawson, R., and Murphy, K. (1972). The temperature dependency of biological denitrification. Water Res. 6, 71–83. doi: 10.1016/0043-1354(72)90174-1
de Boer, F. (2016). Hihydrosoil: A High Resolution Soil Map of Hydraulic Properties. Wageningen. 20.
Detwiler, R. P. (1986). Land use change and the global carbon cycle: the role of tropical soils. Biogeochemistry 2, 67–93. doi: 10.1007/BF02186966
Diaz, R. J., and Rosenberg, R. (2008). Spreading dead zones and consequences for marine ecosystems. Science 321, 926–929. doi: 10.1126/science.1156401
Dieleman, W. I. J., Vicca, S., Dijkstra, F. A., Hagedorn, F., Hovenden, M. J., Larsen, K. S., et al. (2012). Simple additive effects are rare: a quantitative review of plant biomass and soil process responses to combined manipulations of CO2 and temperature. Glob. Change Biol. 18, 2681–2693. doi: 10.1111/j.1365-2486.2012.02745.x
Don, A., Schumacher, J., and Freibauer, A. (2011). Impact of tropical land-use change on soil organic carbon stocks–a meta-analysis. Glob. Change Biol. 17, 1658–1670. doi: 10.1111/j.1365-2486.2010.02336.x
Doughty, C. C. W. S. U., Adams, E. B., and Martin, L. W. (1988). Highbush Blueberry Production in Washington and Oregon. Washington, OR: PNW-Pacific Northwest Extension Publication; Idaho State Universities, Cooperative Extension Service (USA).
Emerson, K., Russo, R. C., Lund, R. E., and Thurston, R. V. (1975). Aqueous ammonia equilibrium calculations: effect of pH and temperature. J. Fish. Res. Board Can. 32, 2379–2383. doi: 10.1139/f75-274
Engel, M. S., and Alexander, M. (1958). Growth and autotrophic metabolism of nitrosomonas europaea. J. Bacteriol. 76:217–222.
Fan, M. X., and Mackenzie, A. F. (1993). Urea and phosphate interactions in fertilizer microsites: ammonia volatilization and pH changes. Soil Sci. Soc. Am. J. 57:839. doi: 10.2136/sssaj1993.03615995005700030034x
FAO (2001). Global Forest Resources Assessment 2000: Main Report. Rome: Food and Agriculture Organization of the United Nations.
Galloway, J. N., Dentener, F. J., Capone, D. G., Boyer, E. W., Howarth, R. W., Seitzinger, S. P., et al. (2004). Nitrogen cycles: past, present, and future. Biogeochemistry 70, 153–226. doi: 10.1007/s10533-004-0370-0
Geoscience Australia (2015). Digital Elevation Model (DEM) of Australia derived from LiDAR 5 Metre Grid. Technical report, Geoscience Australia, Canberra.
Gibbs, H. K., Ruesch, A. S., Achard, F., Clayton, M. K., Holmgren, P., Ramankutty, N., et al. (2010). Tropical forests were the primary sources of new agricultural land in the 1980s and 1990s. Proc. Natl. Acad. Sci. 107, 16732–16737. doi: 10.1073/pnas.0910275107
GRASS Development Team (2017). Geographic Resources Analysis Support System (GRASS GIS) Software, Version 7.2. Open Source Geospatial Foundation. Available online at: http://grass.osgeo.org
Gubry-Rangin, C., Nicol, G. W., and Prosser, J. I. (2010). Archaea rather than bacteria control nitrification in two agricultural acidic soils. FEMS Microbiol. Ecol. 74, 566–574. doi: 10.1111/j.1574-6941.2010.00971.x
Guo, L. B., and Gifford, R. M. (2002). Soil carbon stocks and land use change: a meta analysis. Glob. Change Biol. 8, 345–360. doi: 10.1046/j.1354-1013.2002.00486.x
Hajati, M.-C., Sutanudjaja, E., and Moosdorf, N. (2019). Quantifying regional fresh submarine groundwater discharge with the lumped modeling approach CoCa-RFSGD. Water Resour. Res. 55, 5321–5341. doi: 10.1029/2018WR024248
Hansen, M., Clough, T. J., and Elberling, B. (2014). Flooding-induced N2o emission bursts controlled by pH and nitrate in agricultural soils. Soil Biol. Biochem. 69, 17–24. doi: 10.1016/j.soilbio.2013.10.031
Hanson, E. (2006). Nitrogen fertilization of highbush blueberry. Acta Hortic. 715, 347–352. doi: 10.17660/ActaHortic.2006.715.51
He, J.-Z., Hu, H.-W., and Zhang, L.-M. (2012). Current insights into the autotrophic thaumarchaeal ammonia oxidation in acidic soils. Soil Biol. Biochem. 55, 146–154. doi: 10.1016/j.soilbio.2012.06.006
Hedin, L. O., Brookshire, E. J., Menge, D. N., and Barron, A. R. (2009). The nitrogen paradox in tropical forest ecosystems. Annu. Rev. Ecol. Evol. Syst. 40, 613–635. doi: 10.1146/annurev.ecolsys.37.091305.110246
Heinen, M. (2006). Simplified denitrification models: overview and properties. Geoderma 133, 444–463. doi: 10.1016/j.geoderma.2005.06.010
Hietz, P., Turner, B. L., Wanek, W., Richter, A., Nock, C. A., and Wright, S. J. (2011). Long-term change in the nitrogen cycle of tropical forests. Science 334, 664–666. doi: 10.1126/science.1211979
Hodnett, M. G., and Tomasella, J. (2002). Marked differences between van Genuchten soil water-retention parameters for temperate and tropical soils: a new water-retention pedo-transfer functions developed for tropical soils. Geoderma 108, 155–180. doi: 10.1016/S0016-7061(02)00105-2
Horton, B., and Corkrey, R. (2011). A weighted coefficient model for estimation of Australian daily soil temperature at depths of 5 cm to 100 cm based on air temperature and rainfall. Soil Res. 49, 305–314. doi: 10.1071/SR10151
Houlton, B. Z., Sigman, D. M., and Hedin, L. O. (2006). Isotopic evidence for large gaseous nitrogen losses from tropical rainforests. Proc. Natl. Acad. Sci. U.S.A. 103, 8745–8750. doi: 10.1073/pnas.0510185103
Howarth, R. W., and Marino, R. (2006). Nitrogen as the limiting nutrient for eutrophication in coastal marine ecosystems: evolving views over three decades. Limnol. Oceanogr. 51, 364–376. doi: 10.4319/lo.2006.51.1_part_2.0364
Hu, H.-W., Xu, Z.-H., and He, J.-Z. (2014). Chapter six–ammonia-oxidizing archaea play a predominant role in acid soil nitrification. Adv. Agron. 125, 261–302. doi: 10.1016/B978-0-12-800137-0.00006-6
IPCC. (2013). “Climate change 2013: the physical science basis,” in Contribution of Working Group I to the Fifth Assessment Report of the Intergovernmental Panel on Climate Change, eds T. F. Stocker, D. Qin, G.-K. Plattner, M. Tignor, S. K. Allen, J. Boschung, A. Nauels, Y. Xia, V. Bex, and P. M. Midgley (Cambridge; New York, NY: Cambridge University Press), 1535.
Ireland, G., and Wilk, P. (2006). Blueberry Production in Northern NSW. NSW Department of Primary Industries Primefact.
Jones, D., Wang, W., and Fawcett, R. (2009). High-quality spatial climate data-sets for Australia. Aust. Meteorol. Oceanogr. J. 58, 233–248. doi: 10.22499/2.5804.003
Jørgensen, R. N., Jørgensen, B. J., and Nielsen, N. E. (1998). N2O emission immediately after rainfall in a dry stubble field. Soil Biol. Biochem. 30, 545–546. doi: 10.1016/S0038-0717(97)00144-2
Keenan, J. D., Steiner, R. L., and Fungaroli, A. A. (1979). Substrate inhibition of nitrification. J. Environ. Sci. Health A 14, 377–397. doi: 10.1080/10934527909374887
Laffan, J. (2016). Organic Farming: An Introduction. NSW Agriculture. Google-Books-ID: KgeWCwAAQBAJ.
Lam, Q., Schmalz, B., and Fohrer, N. (2010). Modelling point and diffuse source pollution of nitrate in a rural lowland catchment using the swat model. Agric. Water Manage. 97, 317–325. doi: 10.1016/j.agwat.2009.10.004
Lambin, E. F. (1997). Modelling and monitoring land-cover change processes in tropical regions. Prog. Phys. Geogr. 21, 375–393. doi: 10.1177/030913339702100303
Lassaletta, L., García-Gómez, H., Gimeno, B. S., and Rovira, J. V. (2009). Agriculture-induced increase in nitrate concentrations in stream waters of a large Mediterranean catchment over 25 years (1981–2005). Sci. Total Environ. 407, 6034–6043. doi: 10.1016/j.scitotenv.2009.08.002
Lee, M., Shevliakova, E., Stock, C. A., Malyshev, S., and Milly, P. C. D. (2019). Prominence of the tropics in the recent rise of global nitrogen pollution. Nat. Commun. 10:1437. doi: 10.1038/s41467-019-13567-7
Lei, T., Sun, X., Guo, X., and Ma, J. (2017). Quantifying the relative importance of soil moisture, nitrogen, and temperature on the urea hydrolysis rate. Soil Sci. Plant Nutr. 63, 225–232. doi: 10.1080/00380768.2017.1340813
Leuzinger, S., Luo, Y., Beier, C., Dieleman, W., Vicca, S., and Körner, C. (2011). Do global change experiments overestimate impacts on terrestrial ecosystems? Trends Ecol. Evol. 26, 236–241. doi: 10.1016/j.tree.2011.02.011
Li, Y., Chapman, S. J., Nicol, G. W., and Yao, H. (2018). Nitrification and nitrifiers in acidic soils. Soil Biol. Biochem. 116, 290–301. doi: 10.1016/j.soilbio.2017.10.023
Lin, B.-L., Sakoda, A., Shibasaki, R., Goto, N., and Suzuki, M. (2000). Modelling a global biogeochemical nitrogen cycle in terrestrial ecosystems. Ecol. Modell. 135, 89–110. doi: 10.1016/S0304-3800(00)00372-0
Liu, Y., Yu, Z., Chen, J., Zhang, F., Doluschitz, R., and Axmacher, J. C. (2006). Changes of soil organic carbon in an intensively cultivated agricultural region: a denitrification-decomposition (DNDC) modelling approach. Sci. Total Environ. 372, 203–214. doi: 10.1016/j.scitotenv.2006.09.022
Martinelli, L., Piccolo, M., Townsend, A., Vitousek, P., Cuevas, E., McDowell, W., et al. (1999). Nitrogen stable isotopic composition of leaves and soil: tropical versus temperate forests. Biogeochemistry 46, 45–65. doi: 10.1007/BF01007573
McCrackin, M. L., Jones, H. P., Jones, P. C., and Moreno-Mateos, D. (2017). Recovery of lakes and coastal marine ecosystems from eutrophication: a global meta-analysis. Limnol. Oceanogr. 62, 507–518. doi: 10.1002/lno.10441
Meyerhof, O. (1916). Untersuchungen über den Atmungsvorgang nitrifizierender Bakterien. Pflügers Archiv. Gesamte Physiol. Menschen Tiere 165, 229–284. doi: 10.1007/BF01881512
Montes, F., Rotz, C., and Chaoui, H. (2009). Process modeling of ammonia volatilization from ammonium solution and manure surfaces: a review with recommended models. Trans. ASABE 52, 1707–1720. doi: 10.13031/2013.29133
Mosier, A., Kroeze, C., Nevison, C., Oenema, O., Seitzinger, S., and van Cleemput, O. (1998). Closing the global N2O budget: nitrous oxide emissions through the agricultural nitrogen cycle. Nutr. Cycl. Agroecosyst. 52, 225–248. doi: 10.1023/A:1009740530221
Nash, J. E., and Sutcliffe, J. V. (1970). River flow forecasting through conceptual models part I—a discussion of principles. J. Hydrol. 10, 282–290. doi: 10.1016/0022-1694(70)90255-6
Nicol, G. W., Leininger, S., Schleper, C., and Prosser, J. I. (2008). The influence of soil pH on the diversity, abundance and transcriptional activity of ammonia oxidizing archaea and bacteria. Environ. Microbiol. 10, 2966–2978. doi: 10.1111/j.1462-2920.2008.01701.x
O'Brien, J. M., Dodds, W. K., Wilson, K. C., Murdock, J. N., and Eichmiller, J. (2007). The saturation of N cycling in central plains streams: 15N experiments across a broad gradient of nitrate concentrations. Biogeochemistry 84, 31–49. doi: 10.1007/s10533-007-9073-7
Odgers, N. P., Holmes, K. W., Griffin, T., and Liddicoat, C. (2015). Derivation of soil-attribute estimations from legacy soil maps. Soil Res. 53, 881–894. doi: 10.1071/SR14274
OEH (2018). Soil Landscapes of the Coffs Harbour 1:100,000 Sheet. Technical report, Office of Environment and Heritage. Available online at: https://datasets.seed.nsw.gov.au/dataset/nsw-landuse-2013 (accessed March 4, 2019).
Paeth, H., Born, K., Girmes, R., Podzun, R., and Jacob, D. (2009). Regional climate change in tropical and northern Africa due to greenhouse forcing and land use changes. J. Clim. 22, 114–132. doi: 10.1175/2008JCLI2390.1
Pajares, S., and Bohannan, B. J. M. (2016). Ecology of nitrogen fixing, nitrifying, and denitrifying microorganisms in tropical forest soils. Front. Microbiol. 7:1045. doi: 10.3389/fmicb.2016.01045
Parton, W. J., Hartman, M., Ojima, D., and Schimel, D. (1998). Daycent and its land surface submodel: description and testing. Glob. Planet. Change 19, 35–48. doi: 10.1016/S0921-8181(98)00040-X
Penman, J., Gytarsky, M., Hiraishi, T., Krug, T., Kruger, D., Pipatti, R., et al. (2003). “Good practice guidance for land use, land-use change and forestry,” in The Intergovernmental Panel on Climate Change, ed J. Penman (Institute for Global Environmental Strategies (IGES): Hayama), 590. Available online at: https://www.ipcc-nggip.iges.or.jp/public/gpglulucf/gpglulucf_files/GPG_LULUCF_FULL.pdf
Peterjohn, W. T. (1991). Denitrification: enzyme content and activity in desert soils. Soil Biol. Biochem. 23, 845–855. doi: 10.1016/0038-0717(91)90096-3
Pett-Ridge, J., Petersen, D. G., Nuccio, E., and Firestone, M. K. (2013). Influence of oxic/anoxic fluctuations on ammonia oxidizers and nitrification potential in a wet tropical soil. FEMS Microbiol. Ecol. 85, 179–194. doi: 10.1111/1574-6941.12111
Pidgeon, J. D. (1972). The measurement and prediction of available water capacity of ferrallitic soils in Uganda. J. Soil Sci. 23, 431–441. doi: 10.1111/j.1365-2389.1972.tb01674.x
Prosser, J. I., and Nicol, G. W. (2012). Archaeal and bacterial ammonia-oxidisers in soil: the quest for niche specialisation and differentiation. Trends Microbiol. 20, 523–531. doi: 10.1016/j.tim.2012.08.001
Rabalais, N. N. (2002). Nitrogen in aquatic ecosystems. AMBIO J. Hum. Environ. 31, 102–112. doi: 10.1579/0044-7447-31.2.102
Ranalli, A. J., and Macalady, D. L. (2010). The importance of the riparian zone and in-stream processes in nitrate attenuation in undisturbed and agricultural watersheds—a review of the scientific literature. J. Hydrol. 389, 406–415. doi: 10.1016/j.jhydrol.2010.05.045
RDA Northern Rivers (2017). Blueberry Industry Business Barriers Review. Technical report. Available online at: https://www.rdanorthernrivers.org.au/download/rda-nr-nsw-blueberry-report-final-web/?wpdmdl=19411&refresh=5d635213202af1566790163 (accessed April 4, 2019).
Remde, A., and Conrad, R. (1991). Role of nitrification and denitrification for NO metabolism in soil. Biogeochemistry 12, 189–205. doi: 10.1007/BF00002607
Riedo, M., Grub, A., Rosset, M., and Fuhrer, J. (1998). A pasture simulation model for dry matter production, and fluxes of carbon, nitrogen, water and energy. Ecol. Modell. 105, 141–183. doi: 10.1016/S0304-3800(97)00110-5
Romero, E., Garnier, J., Lassaletta, L., Billen, G., Le Gendre, R., Riou, P., et al. (2013). Large-scale patterns of river inputs in southwestern Europe: seasonal and interannual variations and potential eutrophication effects at the coastal zone. Biogeochemistry 113, 481–505. doi: 10.1007/s10533-012-9778-0
Rossel, R. A. V., Chen, C., Grundy, M. J., Searle, R., Clifford, D., and Campbell, P. H. (2015). The Australian three-dimensional soil grid: Australia's contribution to the GlobalSoilMap project. Soil Res. 53, 845–864. doi: 10.1071/SR14366
Rotz, C. (2004). Management to reduce nitrogen losses in animal production. J. Anim. Sci. 82, E119–E137. doi: 10.2527/2004.8213_supplE119x
Running, S. W., Mu, Q., Zhao, M., and Moreno, A. (2017). MODIS Global Terrestrial Evapotranspiration (ET) Product (NASA MOD16a2/A3) NASA Earth Observing System MODIS Land Algorithm. Washington, DC: NASA.
Shen, J., Zhang, L., Zhu, Y., Zhang, J., and He, J. (2008). Abundance and composition of ammonia-oxidizing bacteria and ammonia-oxidizing archaea communities of an alkaline sandy loam. Environ. Microbiol. 10, 1601–1611. doi: 10.1111/j.1462-2920.2008.01578.x
Sheppard, S., Long, J., Sanipelli, B., and Sohlenius, G. (2009). Solid/Liquid Partition Coefficients (KD) for Selected Soils and Sediments at Forsmark and Laxemar-Simpevarp. Swedish Nuclear Fuel and Waste Management Co.
Singh, B. K., Bardgett, R. D., Smith, P., and Reay, D. S. (2010). Microorganisms and climate change: terrestrial feedbacks and mitigation options. Nat. Rev. Microbiol. 8, 779–790. doi: 10.1038/nrmicro2439
Smil, V. (1994). “Energy in world history,” in Social, Economic, and Political Forces in Environmental Change (Boulder, Co: Westview), 329.
Smil, V. (2004). Enriching the Earth: Fritz Haber, Carl Bosch, and the Transformation of World Food Production. Cambridge, MA; London: MIT Press. Google-Books-ID: G9FljcEASycC.
Smith, B. D., and Nesbitt, M. (1995). The Emergence of Agriculture. New York, NY: Scientific American Library.
Stempfhuber, B., Engel, M., Fischer, D., Neskovic-Prit, G., Wubet, T., Schöning, I., et al. (2015). pH as a driver for ammonia-oxidizing archaea in forest soils. Microb. Ecol. 69, 879–883. doi: 10.1007/s00248-014-0548-5
Tachikawa, T., Kaku, M., Iwasaki, A., Gesch, D. B., Oimoen, M. J., Zhang, Z., et al. (2011). Aster Global Digital Elevation Model Version 2-Summary of Validation Results. Technical report, NASA.
Talling, J. F., Talling, J. F., and Lemoalle, J. (1998). Ecological Dynamics of Tropical Inland Waters. Cambridge: Cambridge University Press.
Tomasek, A., Staley, C., Wang, P., Kaiser, T., Lurndahl, N., Kozarek, J. L., et al. (2017). Increased denitrification rates associated with shifts in prokaryotic community composition caused by varying hydrologic connectivity. Front. Microbiol. 8:2304. doi: 10.3389/fmicb.2017.02304
Townsend, A. R., Howarth, R. W., Bazzaz, F. A., Booth, M. S., Cleveland, C. C., Collinge, S. K., et al. (2003). Human health effects of a changing global nitrogen cycle. Front. Ecol. Environ. 1, 240–246. doi: 10.1890/1540-9295(2003)001[0240:HHEOAC]2.0.CO;2
Van Genuchten, M. T. (1980). A closed-form equation for predicting the hydraulic conductivity of unsaturated soils 1. Soil Sci. Soc. Am. J. 44, 892–898. doi: 10.2136/sssaj1980.03615995004400050002x
Vargas, O. L., and Bryla, D. R. (2015). Growth and fruit production of highbush blueberry fertilized with ammonium sulfate and urea applied by fertigation or as granular fertilizer. HortScience 50, 479–485. doi: 10.21273/HORTSCI.50.3.479
Vitousek, P. M., Hättenschwiler, S., Olander, L., and Allison, S. (2002). Nitrogen and Nature. AMBIO J. Hum. Environ. 31, 97–101. doi: 10.1579/0044-7447-31.2.97
Vitousek, P. M., and Matson, P. A. (1988). Nitrogen transformations in a range of tropical forest soils. Soil Biol. Biochem. 20, 361–367. doi: 10.1016/0038-0717(88)90017-X
Vogeler, I., Cichota, R., Snow, V. O., Dutton, T., and Daly, B. (2011). Pedotransfer functions for estimating ammonium adsorption in soils. Soil Sci. Soc. Am. J. 75:324. doi: 10.2136/sssaj2010.0192
Wadnerkar, P. D., Santos, I. R., Looman, A., Sanders, C. J., White, S., Tucker, J. P., et al. (2019). Significant nitrate attenuation in a mangrove-fringed estuary during a flood-chase experiment. Environ. Pollut. 253, 1000–1008. doi: 10.1016/j.envpol.2019.06.060
Walkley, A., and Black, I. A. (1934). An examination of the degtjareff method for determining soil organic matter, and a proposed modification of the chromic acid titration method. Soil Sci. 37:29. doi: 10.1097/00010694-193401000-00003
Wang, J., Bogena, H. R., Vereecken, H., and Brüggemann, N. (2018). Characterizing redox potential effects on greenhouse gas emissions induced by water-level changes. Vadose Zone J. 17, 1–13. doi: 10.2136/vzj2017.08.0152
Wellen, C., Kamran-Disfani, A.-R., and Arhonditsis, G. B. (2015). Evaluation of the current state of distributed watershed nutrient water quality modeling. Environ. Sci. Technol. 49, 3278–3290. doi: 10.1021/es5049557
White, S. A. (2018). Land Use Drivers of Nitrogen in Headwater Streams Surrounded by Blueberry Horticulture. Coffs Harbour, NSW: Southern Cross University.
White, S. A., Santos, I. R., and Hessey, S. (2018). Nitrate loads in sub-tropical headwater streams driven by intensive horticulture. Environ. Pollut. 243, 1036–1046. doi: 10.1016/j.envpol.2018.08.074
WHO (2003). Health Aspects of Air Pollution With Particulate Matter, Ozone and Nitrogen Dioxide. Bonn: World Health Organization.
Wild, H. E., Sawyer, C. N., and McMahon, T. C. (1971). Factors affecting nitrification kinetics. J. Water Pollut. Control Federation 43, 1845–1854.
worldbank.org (2019). Fertilizer Consumption (Kilograms per Hectare of Arable Land). Available online at: https://data.worldbank.org/indicator/AG.CON.FERT.ZS?locations=AU&view=chart (accessed March 7, 2019).
Yao, H., Gao, Y., Nicol, G. W., Campbell, C. D., Prosser, J. I., Zhang, L., et al. (2011). Links between ammonia oxidizer community structure, abundance, and nitrification potential in acidic soils. Appl. Environ. Microbiol. 77, 4618–4625. doi: 10.1128/AEM.00136-11
Keywords: modeling soil nitrogen cycling, subtropics, horticulture, nitrate leakage, eutrophication
Citation: Hajati M-C, White S, Moosdorf N and Santos IR (2020) Modeling Catchment-Scale Nitrogen Losses Across a Land-Use Gradient in the Subtropics. Front. Earth Sci. 8:347. doi: 10.3389/feart.2020.00347
Received: 24 January 2020; Accepted: 27 July 2020;
Published: 20 October 2020.
Edited by:
Christophe Darnault, Clemson University, United StatesReviewed by:
Meihua Deng, ZheJiang Academy of Agricultural Sciences, ChinaCopyright © 2020 Hajati, White, Moosdorf and Santos. This is an open-access article distributed under the terms of the Creative Commons Attribution License (CC BY). The use, distribution or reproduction in other forums is permitted, provided the original author(s) and the copyright owner(s) are credited and that the original publication in this journal is cited, in accordance with accepted academic practice. No use, distribution or reproduction is permitted which does not comply with these terms.
*Correspondence: Mithra-Christin Hajati, bS5oYWphdGlAcG9zdGVvLmRl
Disclaimer: All claims expressed in this article are solely those of the authors and do not necessarily represent those of their affiliated organizations, or those of the publisher, the editors and the reviewers. Any product that may be evaluated in this article or claim that may be made by its manufacturer is not guaranteed or endorsed by the publisher.
Research integrity at Frontiers
Learn more about the work of our research integrity team to safeguard the quality of each article we publish.