
94% of researchers rate our articles as excellent or good
Learn more about the work of our research integrity team to safeguard the quality of each article we publish.
Find out more
ORIGINAL RESEARCH article
Front. Earth Sci. , 16 July 2020
Sec. Quaternary Science, Geomorphology and Paleoenvironment
Volume 8 - 2020 | https://doi.org/10.3389/feart.2020.00293
This article is part of the Research Topic Rock Avalanches View all 14 articles
Glacial retreat and mountain-permafrost degradation resulting from rising global temperatures have the potential to impact the frequency and magnitude of landslides in glaciated environments. Several recent events, including the 2015 Taan Fiord rock avalanche, which triggered a tsunami with one of the highest wave runups ever recorded, have called attention to the hazards posed by landslides in regions like southern Alaska. In the Saint Elias Mountains, the presence of weak sedimentary and metamorphic rocks and active uplift resulting from the collision of the Yakutat and North American tectonic plates create landslide-prone conditions. To differentiate between the typical frequency of landsliding resulting from the geologic and tectonic setting of this region, and landslide processes that may be accelerated due to changes in climate, we used Landsat imagery to create an inventory of rock avalanches in a 3700 km2 area of the Saint Elias Mountains. During the period from 1984 to 2019, we identified 220 rock avalanches with a mean recurrence interval of 60 days. We compared our landslide inventory with a catalog of M ≥ 4 earthquakes to identify potential coseismic events, but only found three possible earthquake-triggered rock avalanches. We observed a distinct temporal cluster of 41 rock avalanches from 2013 through 2016 that correlated with above average air temperatures (including the three warmest years on record in Alaska, 2014–2016); this cluster was similar to a temporal cluster of recent rock avalanches in nearby Glacier Bay National Park and Preserve. The majority of rock avalanches initiated from bedrock ridges in probable permafrost zones, suggesting that ice loss due to permafrost degradation, as opposed to glacial thinning, could be a dominant factor contributing to rock-slope failures in the high elevation areas of the Saint Elias Mountains. Although earthquake-triggered landslides have episodically occurred in southern Alaska, evidence from our study suggests that area-normalized rates of non-coseismic rock avalanches were greater during the period from 1964 to 2019, and that the frequency of these events will continue to increase as the climate continues to warm. These findings highlight the need for hazard assessments in Alaska that address changes in landslide patterns related to climate change.
Changes in landslide magnitude and frequency caused by rising temperatures are expected in mountainous, cryospheric terrain (e.g., Hock et al., 2019). This is especially true for rock slides and rock avalanches because their occurrence can be influenced by the degradation of ice (e.g., Gruber and Haeberli, 2007). Throughout this paper, we use the term “landslide” as a general term for all types of slope failures, and the term “rock avalanche” to describe rapid, flow-like landslides of fragmented rock that began as rock slides or rock falls (Hungr et al., 2014). Rock avalanches are considered rare events, with estimated frequencies for rock avalanches >20 Mm3 or >1 km2 for mountainous regions of 10,000 km2 in Europe, New Zealand, and Canada ranging from 0.0002 to 0.0019 rock avalanches per year (526- to 5000-year recurrence intervals, Hungr and Evans, 2004). However, because recurrence intervals get longer as study area size gets smaller, and shorter as rock avalanche size gets smaller, these recurrence estimates are likely too short for individual sites, and too long for rock avalanches <20 Mm3. In support of the second part of this statement, prior to the work by Hungr and Evans (2004); McSaveney (2002) estimated a frequency of 0.05 to 0.03 rock avalanches per year (a recurrence interval of 20–30 years) for rock avalanches >1 Mm3 in the Southern Alps of New Zealand.
Because rock avalanches are common in cryospheric-mountainous terrain (e.g., Deline et al., 2015a) that is susceptible to degradation by warming from climate change (e.g., Beniston, 2003; Paul et al., 2004; Gruber and Haeberli, 2007; Fischer et al., 2012; Huss and Hock, 2015; Hock et al., 2019; Patton et al., 2019), studies of ice-degradation processes and their impact on slope stability (e.g., Fischer et al., 2006; Gruber and Haeberli, 2007; Krautblatter et al., 2013), as well as climate-induced changes in rock avalanche recurrence intervals and sizes, are active landslide research frontiers. For mountainous terrain, process research is generally of two types: studies on the degradation of mountain permafrost and the resulting impact on cohesion and pore pressure in rock slopes (e.g., Gruber and Haeberli, 2007), and studies investigating how the reduction and complete removal of glacial ice will impact steep rock slopes that were previously supported by ice (e.g., Grämiger et al., 2018). In the United States, Alaska is an emerging hot spot for such research because of abundant cryospheric terrain, annual (statewide) mean temperatures that have increased at a rate of 0.4°C (0.7°F) per decade since the 1970s (Walsh et al., 2014; Markon et al., 2018), and projected temperature increases (van Oldenborgh et al., 2013; Markon et al., 2018) that will be among the highest in the world.
Alaska is also tectonically active, and widespread rock avalanches are periodically triggered by earthquakes (e.g., Tarr and Martin, 1912; Post, 1967; Jibson et al., 2006). Uplift from tectonic plate collisions, especially in south-central Alaska, has likely weakened rocks, making them more susceptible to failure by both earthquake and non-coseismic triggers. Aside from earthquakes, climate related processes such as prolonged warming periods, freeze-thaw, rapid snowmelt, or intense or prolonged precipitation are common landslide triggers in cryospheric mountain regions. In addition, such factors have the capability to condition both earthquake-triggered and non-coseismic rock avalanches. An intriguing research question is related to the relative abundance and impact of rock avalanches from these different processes, as well as the compound effects that ice degradation will have on earthquake-triggered rock avalanches.
From a hazards and risk perspective, the question of how warming temperatures and changing patterns of precipitation as a result of climate change will impact rock avalanche frequency (recurrence intervals) and magnitude is important to consider because rock avalanches often entrain material and grow volumetrically as they travel downslope (e.g., Bessette-Kirton et al., 2018), travel long (>5 km) distances (Post, 1967; McSaveney, 1978; Evans and Clague, 1999; McSaveney, 2002; Huggel et al., 2005, 2007, 2010; Evans et al., 2009; Geertsema, 2012; Guthrie et al., 2012; Jacquemart et al., 2020), and can create cascading hazards (e.g., outburst floods or tsunamis) when they impact mountain lakes or fiords (Miller, 1960; Bessette-Kirton et al., 2017; Haeberli et al., 2017; Higman et al., 2018). These characteristics make rock avalanches a risk to humans in areas well downstream from locations where they initiate (e.g., Huggel et al., 2005; Evans et al., 2009; Duhart et al., 2019; Mergili et al., 2020; Walter et al., 2020).
Recent studies have suggested that rock avalanche recurrence intervals are becoming shorter in New Zealand (McSaveney et al., 2014, 2015) and Alaska (Coe et al., 2018), although the driving mechanisms for these changes are uncertain. In New Zealand’s Southern Alps, McSaveney et al. (2014) and McSaveney et al. (2015) suggested that the shortened recurrence interval for rock avalanches >1 Mm3 could be due to an increasing accumulation of strain in the crust since the last great earthquake, with mountain permafrost degradation being a possible contributing factor. In Alaska, Coe et al. (2018) found a temporal cluster of eight, large (total area >5 km2), highly mobile rock avalanches that occurred during a 4-year period (2012–2016) of record-breaking winter and spring temperatures, and suggested that mountain permafrost degradation was a likely cause, but acknowledged that other factors such as accumulating crustal strain, glacial thinning, and increased precipitation may have contributed.
A difficulty of assessing changes in rock avalanche magnitude and frequency caused by climatic variations is a lack of long-term, systematically and consistently collected data sets that can be used to investigate such changes. Additionally, rock avalanches deposited on glaciers often have a short residence time and are rapidly reworked by glacial processes and snow cover (McSaveney, 2002; Hewitt et al., 2011; Reznichenko et al., 2011; Deline et al., 2015b; Dunning et al., 2015). These challenges highlight the difficulty of collecting long-term data that are of high and consistent quality. Several previous studies have utilized long-term records generated from satellite imagery (Schlögel et al., 2011; Uhlmann et al., 2013; Bessette-Kirton and Coe, 2016) and seismic data (Hibert et al., 2019) to assess changes to the frequency and magnitude of landslides, but, overall, such records are rare, especially in mountainous cryospheric terrain.
In this paper, we present and analyze a new 36-year (1984–2019) rock avalanche inventory (GIS map data are available in Bessette-Kirton et al., 2020) from the high alpine, Saint (St.) Elias Mountains of southern Alaska. The St. Elias range lies at an active convergent tectonic plate boundary and is susceptible to rock avalanches (Petley, 2012; Evans and Delaney, 2014; Reid, 2017; Higman et al., 2018). We mapped rock avalanches in a 3700 km2 area by systematically examining Landsat imagery, and analyzed trends in rock avalanche frequency and magnitude in the context of historical climate data from a local meteorological station. We determined if any rock avalanches could have been seismically triggered and compared our inventory with past events (coseismic and not) in neighboring areas of southern Alaska. Finally, we discuss the implications of our results for erosion rates and glacier dynamics in the region, and the effects of glacial thinning and permafrost degradation on rock avalanche failures in the St. Elias Mountains.
The 3700 km2 study area is located in southern Alaska, within Wrangell-St. Elias National Park and Preserve and along the south flank of the glaciated St. Elias mountain range between Icy Bay and Yakutat Bay (Figure 1). The St. Elias range is an accretionary terrane at the convergent (collisional) boundary between the northwestward moving Yakutat tectonic microplate and the North American tectonic plate (e.g., Winkler et al., 2000; Bruhn et al., 2004). The convergence rate between the plates is ∼40–50 mm/yr (e.g., Elliott et al., 2010, 2013) and overall exhumation within the orogen is estimated to be 2–3 mm/year, with localized exhumation >10 mm/year (Pavlis et al., 2012). Uplift within the study area from combined tectonic and isostatic forces ranges from 16 to 18 mm/yr (Larsen et al., 2004). Geologic units within the study area (e.g., see Winkler et al., 2000; Richter et al., 2005; Wilson et al., 2015) consist of folded and faulted rocks including: flysches, altered volcanic rocks, chert, carbonate, and granitic rocks of the Cretaceous Yakutat Group; mudstones, siltstones and sandstones of the Tertiary and Quaternary Yakataga and Tugidak Formations; Eocene siltstones and sandstones of eastern Prince William Sound; flysches, volcanic rocks, and graywackes of the Cretaceous Chugach accretionary complex; and marbles, schists, and phyllites of the Mississippian Kaskawulsh group.
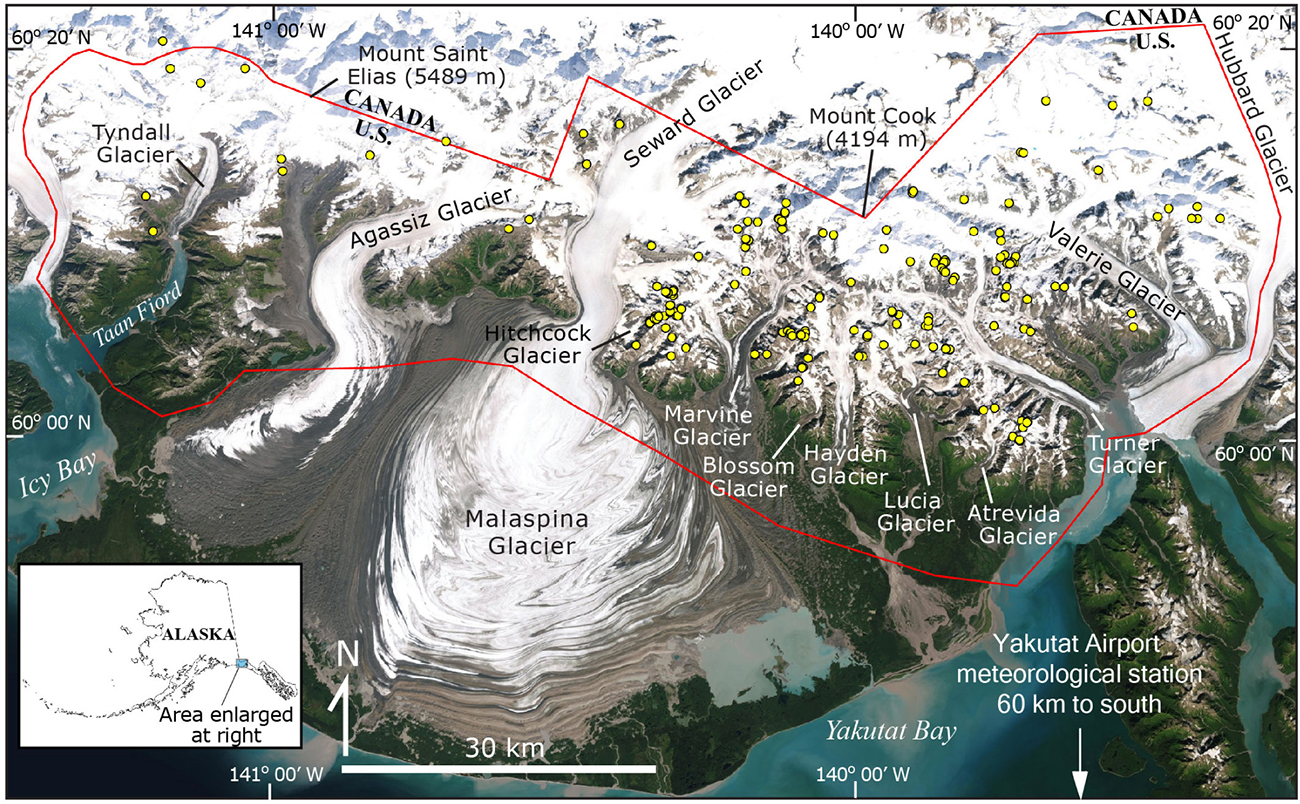
Figure 1. Map of the Saint Elias study area (red polygon) in Alaska, showing locations of rock avalanches mapped between 1984 and 2019 (yellow dots).
The St. Elias study area lies within the largest connected glacier and icefield complex in continental North America (Muskett et al., 2003), and relief within the study area is extreme, ranging from sea level to Mount St. Elias at 5489 m within a distance of 19 km (Figure 1). Gruber (2012a, b) indicates that mountain permafrost is likely present in high elevation areas (see Gruber (2012b) for map data). Glaciers cover roughly 50% of the study area (Figure 1) and include interior valley (e.g., Seward), tidewater (e.g., Hubbard), and piedmont (e.g., Malaspina) glaciers. Erosion by glaciers is approximately equal to the rate of uplift (Spotila et al., 2004). Between 1972/1973 and 2000, thinning of 47 ± 5 m was observed in the ablation areas of the Malaspina Glacier, including the Seward lobe, and the Agassiz, Marvine, and Hayden Glaciers (Muskett et al., 2003). More recent surveys between 2007 and 2012 have shown several meters of local thickening per year for Seward Glacier and the upper part of Malaspina Glacier, and thinning rates of one to several meters per year elsewhere in the study area (Loso et al., 2014).
Several studies have documented landslides in the study area during the past century. Most recently, in October 2015 the Taan Fiord landslide (Dufresne et al., 2018; Haeussler et al., 2018; Higman et al., 2018) involved the collapse of 76 Mm3 of material (Haeussler et al., 2018) from a previously identified, unstable mountain flank (Meigs and Sauber, 2000), onto the terminus of Tyndall Glacier and into Taan Fiord. This landslide generated a tsunami with a maximum onshore runup of 193 m (Higman et al., 2018). Prior to the Taan Fiord landslide, reported landslides in the study area included a rock avalanche that was detected seismically and occurred at the terminus of Hubbard Glacier at Disenchantment Bay (i.e., the northernmost part of Yakutat Bay, Figure 1) in 2012 (Petley, 2012), two rock avalanches in 1965 that were deposited on the Blossom (1.5 km2 deposit area) and Marvine (1 km2 deposit area) Glaciers (Post, 1967), a 3 Mm3 rock-ice avalanche that was deposited on Marvine Glacier in 1983 (e.g., Schneider et al., 2011) and three large (6–10 Mm3) rock avalanches triggered by a M 7.4 earthquake on February 28, 1979 that failed from rock slopes within 10 km of both sides of Seward Glacier (Cascade 1, 2, and 3 in Table 2 of Reid, 2017; see also Delaney and Evans, 2014; Evans and Delaney, 2014). In September 1899, coseismic rock avalanches throughout the St. Elias range were recorded in the aftermath of multiple large (M 7.8 to M 8.6, Stover et al., 1980) earthquakes that occurred in the Yakutat Bay area (Tarr and Martin, 1912; Evans and Clague, 1999). After making post-earthquake field observations in the region in 1905, Tarr and Martin (1912, p. 48) stated that rock and snow “avalanche tracks are far more abundant in the Yakutat Bay region than in any part of the thousand-mile mountainous inside passage from Seattle to Sitka” and attributed this abundance to their close proximity to active earthquake faults. Additionally, Tarr and Martin (1912) noted the locations of several rock avalanches near the coastline and indicated that multiple glaciers in the area experienced surging because of the amount of rock avalanche debris that was deposited on them during the earthquake.
The methods used in this work were replicated from Bessette-Kirton and Coe (2016) and Coe et al. (2018). Here, we provide a summary of the methodology and discuss some additional details that were necessary to consider for the St. Elias study area. We used 30-m resolution Collection 1 Level-1 Landsat imagery, which has been continuously collected since 1984, to create an inventory of rock avalanches in our study area from 1984 through 2019. To maintain consistency throughout the 36-year period of record we did not utilize the 15-m resolution panchromatic data that are available for Landsat 7 and Landsat 8 since these data are not available for earlier Landsat missions. The consistency and short acquisition time (∼16 days) of Landsat typically allowed us to examine at least one early summer (May or June) and one late summer (August or September) image from every year (Supplementary Table S1). Within the period of record, 1989 was the only year for which coverage of the study area was incomplete, when imagery was only available for half of the study area. Whenever possible, we used the best quality, cloud-free imagery to improve our ability to identify rock avalanches, but in rare cases we were forced to use cloudy or poor quality (e.g., striping, poor lighting) images out of necessity (see Bessette-Kirton et al., 2020 for details).
We performed a grid search of the study area and identified rock avalanches at a scale of 1:60,000, and then mapped the total affected area (undifferentiated source and deposit areas) at a scale of 1:20,000. In addition to mapping total area polygons, we mapped headscarp points corresponding to the center of each rock avalanche headscarp, and travel distance lines, which reflect the maximum distance from the headscarp point to the farthest extent of visible rock avalanche deposits. Geographic information system (GIS) data are available from Bessette-Kirton et al. (2020) and here we include summary attributes for each mapped rock avalanche (Supplementary Table S2). Whenever possible, we used additional Landsat imagery (including fall and winter images) to map and constrain the date range for each event, and in a few cases, we also used DigitalGlobe imagery to further constrain rock avalanche dates (see Supplementary Table S2, Bessette-Kirton et al., 2020). We typically used false color images (band combinations 453 for Landsat 4, 5, 7, and 564 for Landsat 8) to systematically search the study area since the color contrast allowed for detection of events at a small scale. Subsequently, we used both true color and false color images (e.g., Figure 2) to map each event in detail. In some cases, good quality, true-color images allowed us to delineate disturbed source areas more easily than false color images, but contrast between disrupted or entrained snow and ice was often more noticeable in false color images.
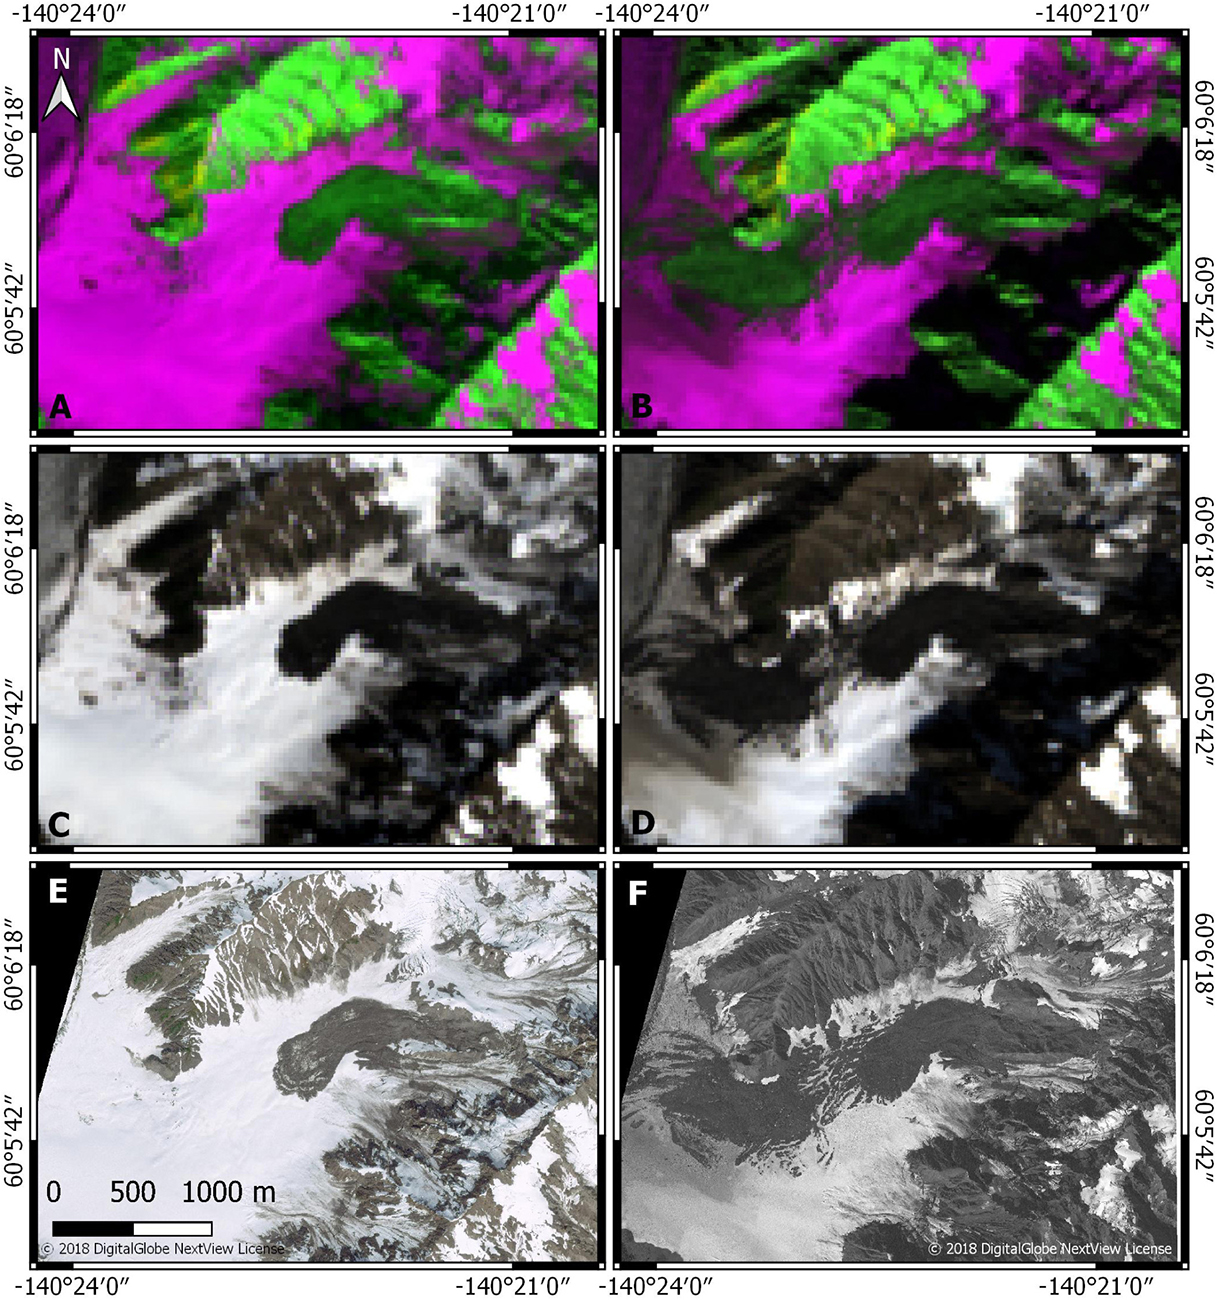
Figure 2. (A) Landsat image acquired on 24 July 2018 (false color band combination RGB = 564) showing a fresh rock avalanche deposit (RA 212, event occurred between 8 June 2018 and 1 July 2018) and older rock avalanche deposits buried under snow on the surface of Hitchcock Glacier. (B) Landsat image acquired on 3 September 2018 showing the deposit of RA 212 starting to degrade and older rock avalanche deposits that have been uncoved by snow. (C,D) True color images of (A,B), respectively. DigitalGlobe satellite images that were collected at similar times are shown in parts (E) 5 July 2018 and (F) 4 September 2018 for comparison.
We mapped rock avalanches by identifying lobate deposits that exhibited a high contrast with the surrounding surface and noticeable differences between progressive Landsat images. At the resolution of Landsat imagery (30 m), dark-colored rock avalanche deposits emplaced on glacier surfaces were much more readily identifiable than rock avalanche source areas. In addition, it was much more difficult to identify rock avalanche deposits with a high percentage (i.e., >50%) of snow and ice that were emplaced on glaciers (i.e., because of low contrast with surrounding ice surfaces), rock avalanches that were disturbed by glacier movement, or rock avalanches that were predominantly deposited onto rock surfaces. We identified several events that fit these criteria, but our mapping methods could have caused us to miss additional events with these characteristics. Rock avalanches that occurred during the winter and were rapidly covered by snowfall and reworked before reappearing during the summer were particularly difficult to detect, and our inventory may have missed events with these characteristics.
Based on the size of events that could be consistently identified in 30-m resolution imagery, we used a total rock avalanche area of 0.1 km2 as a minimum limit of detection. Thus, we did not map rock falls or continuously active talus slopes in which relatively small movements were consistently visible. The accuracy with which we were able to map rock avalanches varied with image quality and terrain type. In general, headscarp locations were much more difficult to delineate than deposit areas because shadows were often present in areas of steep terrain, and contrasts between fresh failure surfaces and intact rock were more difficult to identify on bedrock ridges with partial or no snow cover (which was typical during the summer months). Thus, we estimated the absolute accuracy of deposit polygons and headscarp points to be ±50 m and ±150 m, respectively.
In the St. Elias study area, rock avalanches commonly occurred from source areas that had previously failed. We observed repeated failures with temporal spacing ranging from days to years, and thus developed the following criteria to classify rock avalanches originating from the same source areas. In a few cases, we observed repeated rock avalanche failures from the same location within a 1-month time period. When two rock avalanches occurred from the same source area location within a 1-month period of time, we classified the event as a “two-part” failure. These events were recognized on rare occasions when high-quality images were closely spaced in time, and we acknowledge that they consisted of a minimum of two parts but may have included more. The general lack of closely spaced imagery could have prevented us from identifying many more failures which happened in multiple parts. Furthermore, if an event occurred in multiple episodes, closely spaced imagery allowed us to detect a small event followed by a larger event, but not a large event followed by a small event (due to the lack of contrast between overlapping rock avalanche deposits). Therefore, two-part failures were mapped as separate events, but were counted together, as a single event for statistical analyses of rock avalanche rates.
In the case of rock avalanche failures that originated from the same source area but were separated by months or years, we used successive imagery to differentiate between old and new deposits. If a rock avalanche was found in an area where an older rock avalanche had previously been mapped, we compared the shapes and textures of the deposits to decide if the new event was distinct from the old event. Often, the shape of a new deposit was substantially different from that of older deposits. Recent deposits were usually characterized by smooth, lobate edges that contrasted sharply with the surrounding surface (Figures 2A,C), whereas old deposits typically had rough or uneven edges and sometimes became more visible throughout the summer as snow cover progressively melted (Figures 2B,D). After identifying all distinct rock avalanches, we used our headscarp accuracy limit of ±150 m to group rock avalanches with overlapping source areas into spatial clusters.
To identify rock avalanches that could have been triggered by earthquakes, we searched the U.S. Geological Survey earthquake catalog (U.S. Geological Survey, 2019, 2020) for M ≥ 4 earthquakes that occurred within a distance of 1000 km from the headscarp location and coincided with the event date range of each rock avalanche in our inventory. We analyzed each resulting earthquake based on the magnitude-distance criteria established by Keefer (1984) and subsequently modified by Jibson (2013) to determine whether it could have triggered the rock avalanche. For example, based on these criteria, an earthquake that occurred 100 km away from the rock avalanche source area could have been a possible trigger if it was M ≥ 6.2. In accordance with Coe et al. (2018), we used the conservative “disrupted landslides” criteria (i.e., the most susceptible type of landslide) of Keefer (1984) since we did not have prior knowledge of hillslope conditions. Disrupted landslides have experienced movement in the past and may, therefore, have established failure surfaces. Disrupted landslides are more sensitive to triggering by earthquakes than coherent landslides. For example, at a distance of 100 km from an earthquake epicenter, a disrupted landslide could be triggered by a smaller magnitude earthquake than the one required to trigger a coherent landslide.
We used climate data from the Yakutat Airport weather station (Lawrimore, 2017) to examine long-term temperature and precipitation trends in close proximity to the St. Elias study area. The Yakutat Airport weather station (59.512°, −139.6712°) is located 60 km southeast of the St. Elias study area and has a nearly complete data record dating back to 1948. We examined data from the 72-year period for which nearly continuous data were recorded at the station (1948–2019) to identify trends over the entire data record and also during the 36-year period corresponding to our rock avalanche inventory (1984–2019).
We used monthly temperature (minimum, maximum, and average), precipitation, and snowfall averages from 1948 to 2019 and 1984–2019 to track monthly, seasonal (multi-month), and yearly climate trends at the Yakutat Airport weather station. We used data from October 1-September 30 (water year) to represent annual climate intervals and evaluated trends in annual data using Mann-Kendall statistical tests (Hussain and Mahmud, 2019). The low elevation (10 m above sea level) and geographic position of the Yakutat Airport weather station undoubtedly contributed to differences in absolute temperature and precipitation values between the weather station and the higher elevation, mountainous terrain characteristic of the St. Elias study area. Because of this potential problem, we focused our analysis on long-term temperature and precipitation trends that may have influenced rock avalanche processes in the region, rather than examining absolute climate conditions for individual rock avalanche events. Furthermore, the presence of only one meteorological station in proximity to the St. Elias study area limited the extent of interpretations that we were able to make.
Our inventory mapping revealed 220 rock avalanches in the St. Elias study area during the 36-year period between 1984 and 2019 (Figure 1 and Supplementary Table S2). We did not observe other types of landslides during the period of record. On average, 6 rock avalanches occurred annually, with at least 2, and up to 14 events occurring each year (Figure 3). The greatest number of rock avalanches (per year) occurred during 2016 (14 rock avalanches, Figure 3). The longest period of consecutive years (four) with numbers of rock avalanches above the average of six, was from 2013 to 2016. Since we primarily used imagery to constrain the timing of rock avalanches in our inventory, most events were characterized by a range of possible event dates (Supplementary Table S2 and Figure 3A). These ranges varied from several days to nearly 14 months. The only exceptions are a rock avalanche on the Hubbard Glacier in 2012 (RA 161, Supplementary Table S2; Petley, 2012), the Taan Fiord landslide (RA 188, Supplementary Table S2), and a rock avalanche which occurred in 2017 (RA 204, Supplementary Table S2) for which we were able to confirm the exact date with seismic data analysis. Overall, the mean recurrence interval between rock avalanches was 60 days. However, rock avalanches were not evenly distributed throughout the year, but instead, occurred primarily during summer months, with 82% of all possible rock avalanche occurrences during May, June, July, and August (Figure 3A). During the period of record, the month with the highest number of possible rock avalanche occurrences was July (129; Figure 3A), and we observed no considerable changes in the occurrence dates of rock avalanches over time. We acknowledge that the observed predominance of summer season rock avalanches could be biased by the difficulty of detecting rock avalanches during winter months. We also acknowledge that this bias could have resulted in an undercounting of events.
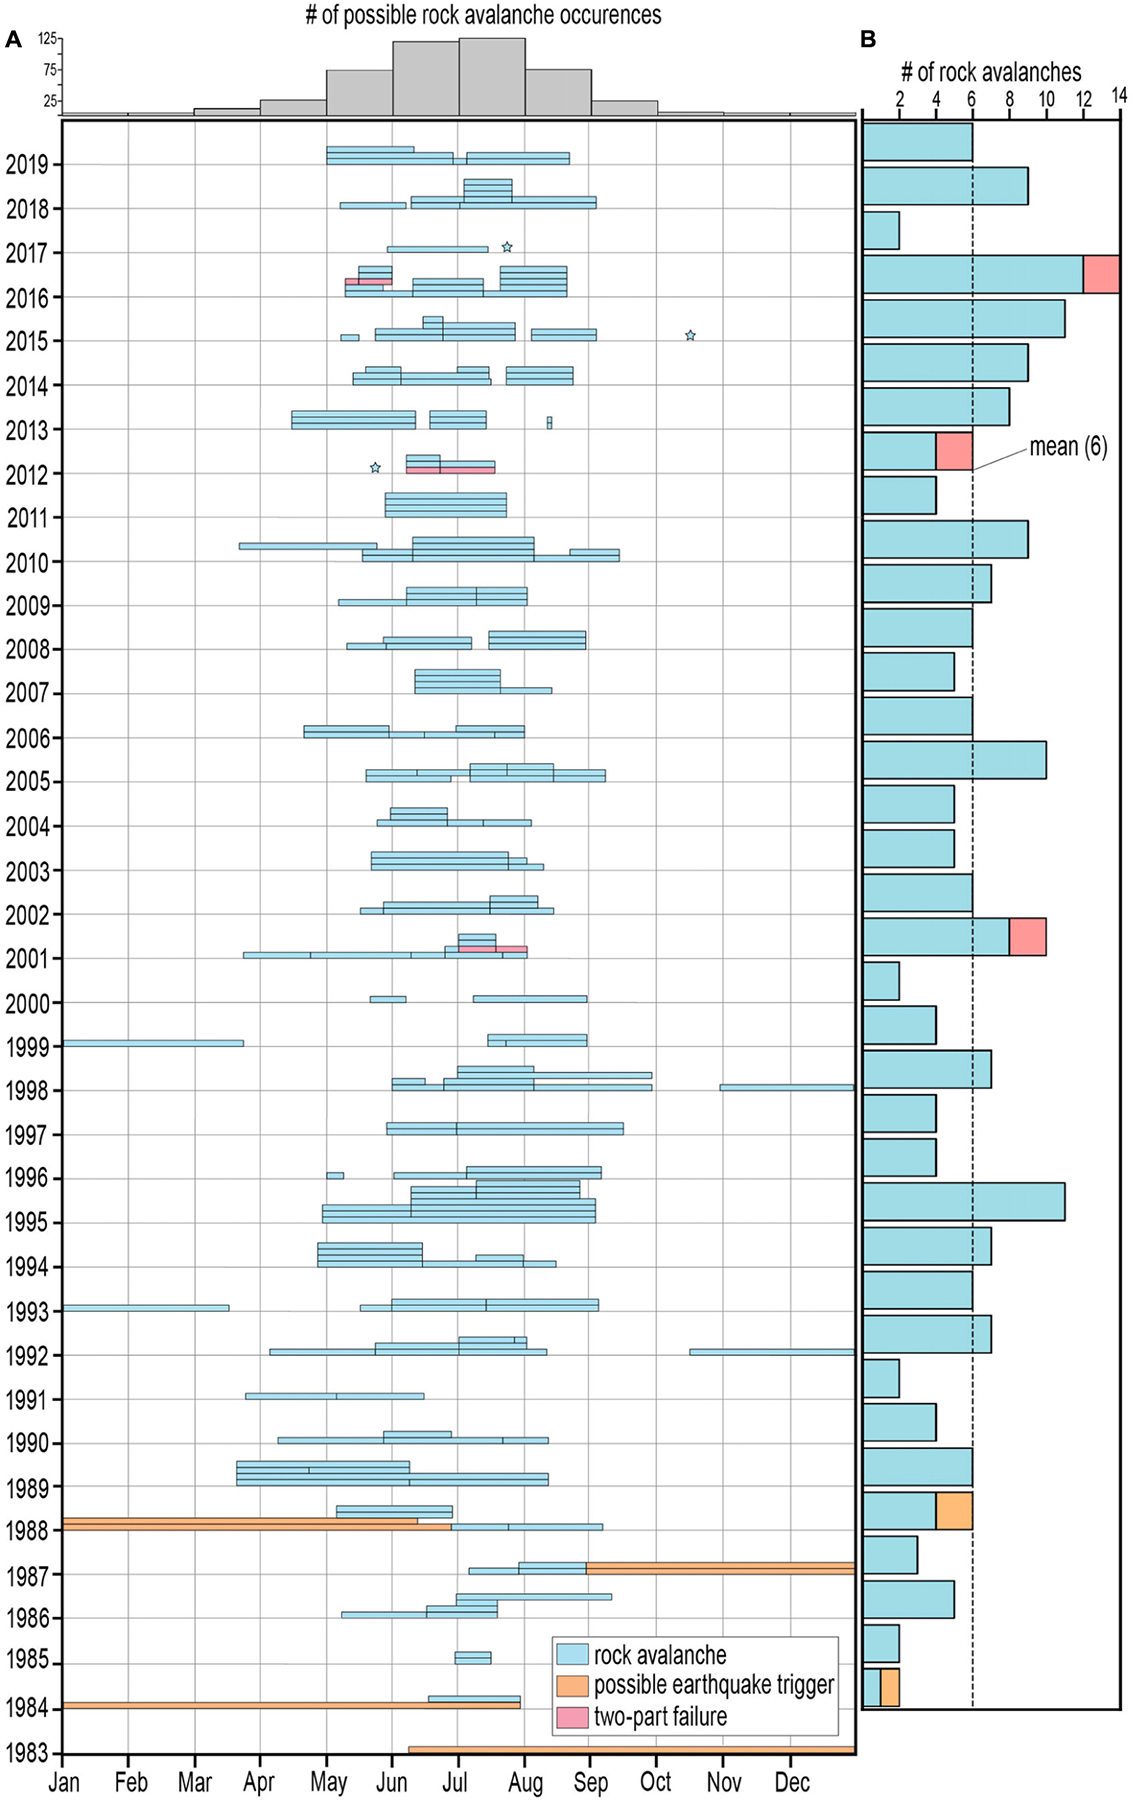
Figure 3. (A) Chart showing the range of possible dates for 220 rock avalanches in the Saint Elias Mountains between 1984 and 2019 (center) and the number of possible rock avalanche events during each month of the year (top). Rock avalanches for which the exact event date is known are shown by stars. (B) Total number of rock avalanches that occurred annually during the period of record, with an overall mean of six rock avalanches per year.
Earthquake catalog search results yielded three rock avalanches (shown in orange in Figure 3) that could have been triggered by earthquakes (Supplementary Table S3). The absence of good quality imagery for these events limited our ability to narrow the range of possible event dates to fewer than 9–14 months (Figure 3A), which may have hindered the potential to rule out seismic triggers. Additionally, we identified three two-part failures (shown in red in Figure 3). Since any of the rock avalanches in our inventory could have also failed in multiple parts, we consider each two-part failure only once when quantifying rock avalanche rates and comparing rock avalanches to climate data. Additionally, possible earthquake-triggered landslides were not included in comparisons to climate data.
Rock avalanche areas (combined source and deposit areas) ranged from 0.1 to 4.4 km2, with a median area of 0.4 km2 (Figure 4A). Travel distances of rock avalanches ranged from 0.6 to 6.5 km with a median of 1.8 km (Figure 4B). The skewed distributions of area and travel distance indicate that most rock avalanches were small and had short travel distances. These distributions differed from the uniform distribution of rock avalanche mobility, measured by the ratio of fall height (H) to travel distance (L), which had a mean of 0.37 (Figure 4C). The examination of rock avalanche characteristics revealed no changes in area, travel distance, or mobility as a function of time.
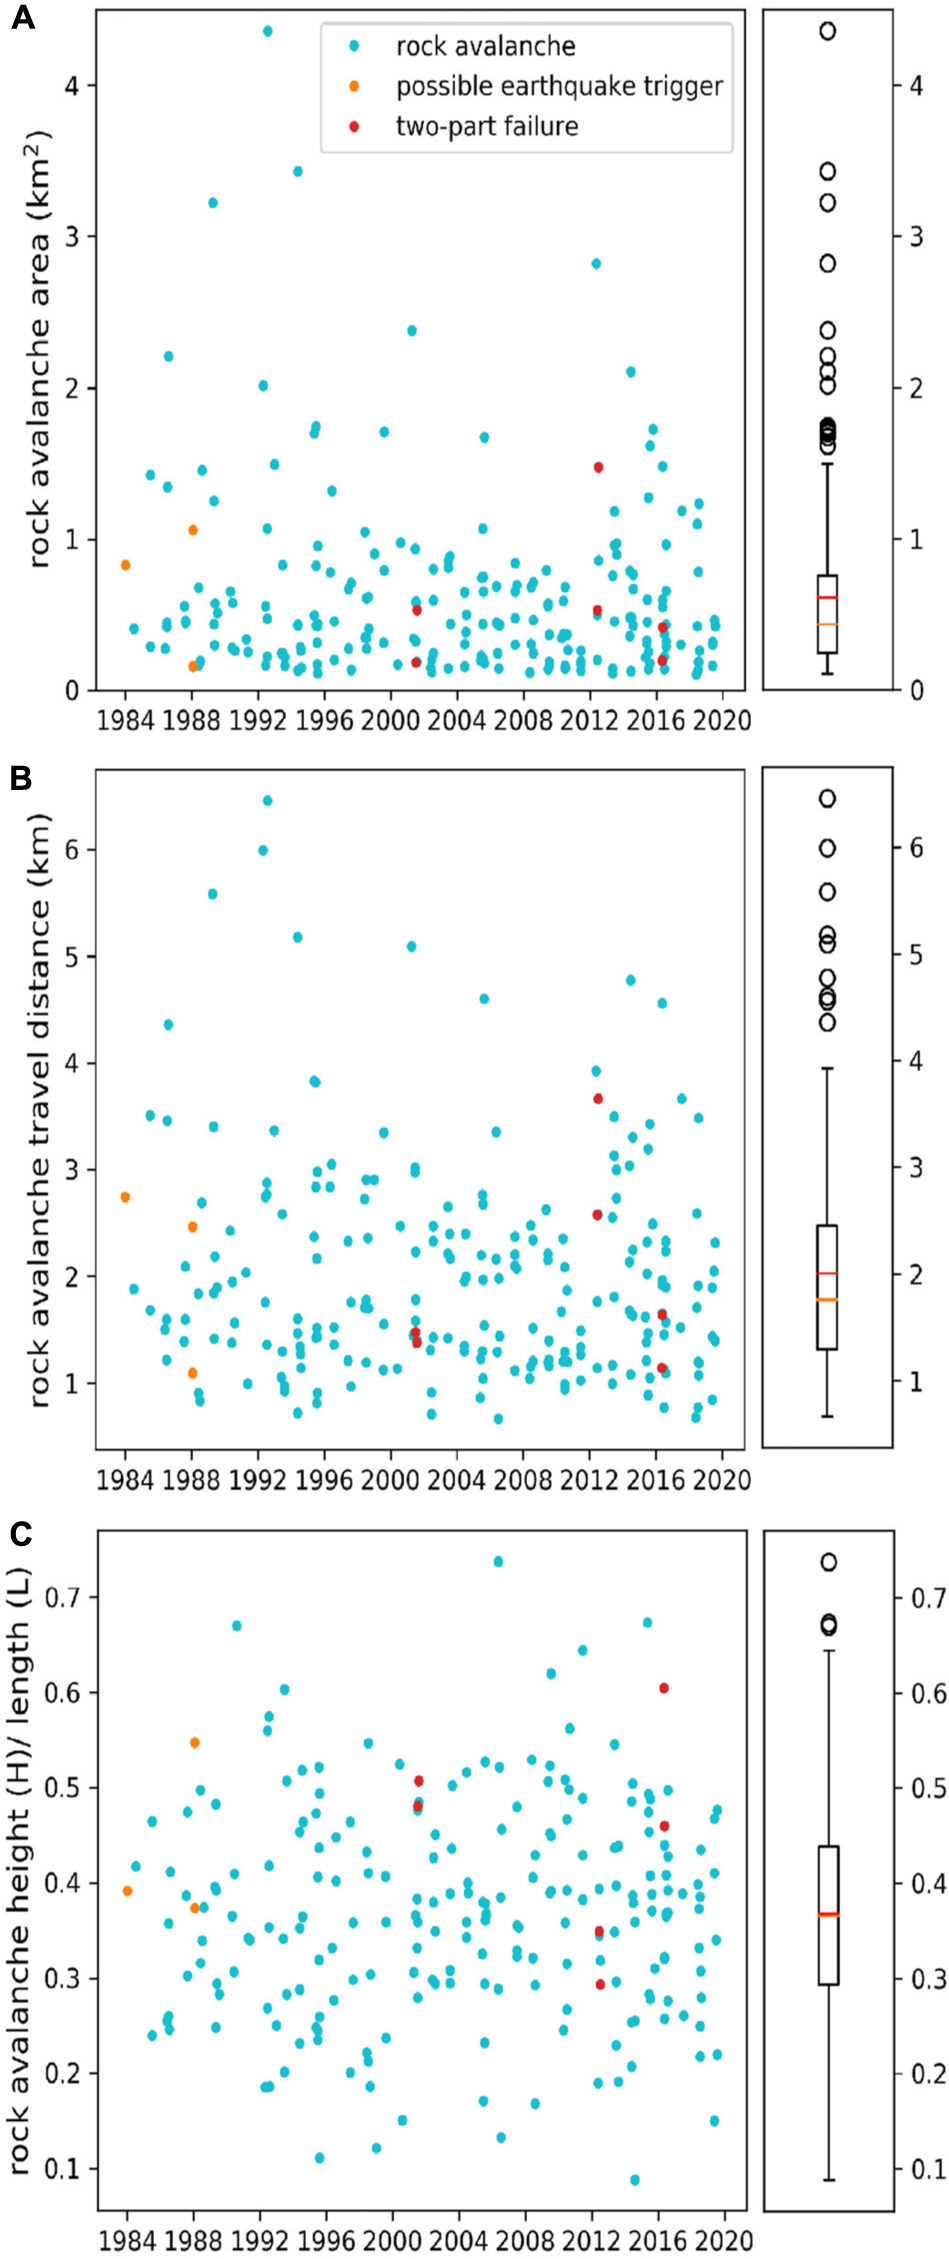
Figure 4. Rock avalanche (A) area, (B) travel distance, and (C) ratio of fall height (H) to travel distance length (L) for rock avalanches in the Saint Elias study area during the period 1984–2019.
Rock avalanches commonly initiated at or near bedrock ridges in probable permafrost zones (Figure 5B; Gruber, 2012b) were transported over mountainsides irregularly covered with snow and ice, and deposited onto either glacier accumulation zones or occasionally, gently sloping valley glaciers. Notably, the only rock avalanche in our inventory that did not predominantly run out onto a glacier was the Taan Fiord landslide, which partially deposited material onto Tyndall Glacier, but was mostly emplaced in Taan Fiord (Higman et al., 2018). We observed that rock avalanche deposits typically disappeared rapidly and were rarely identifiable in the years following an event unless they were uncovered by snowmelt at the end of a following summer (e.g., Figure 2). In some cases, we found that rock avalanche deposits were covered by snow or reworked within a few months after deposition (Figure 6). Some large rock avalanche deposits that traveled onto glacier ablation zones were visible on glaciers for multiple (up to 27) years after occurrence. The largest rock avalanche in our inventory (RA 33, Supplementary Table S2), which occurred in 1992 and had a total area of 4.4 km2, was visible in imagery through 2019 (Figure 7). The movement rate of the deposit terminus on the glacier surface varied between 65 and 250 m/year (Supplementary Table S4).
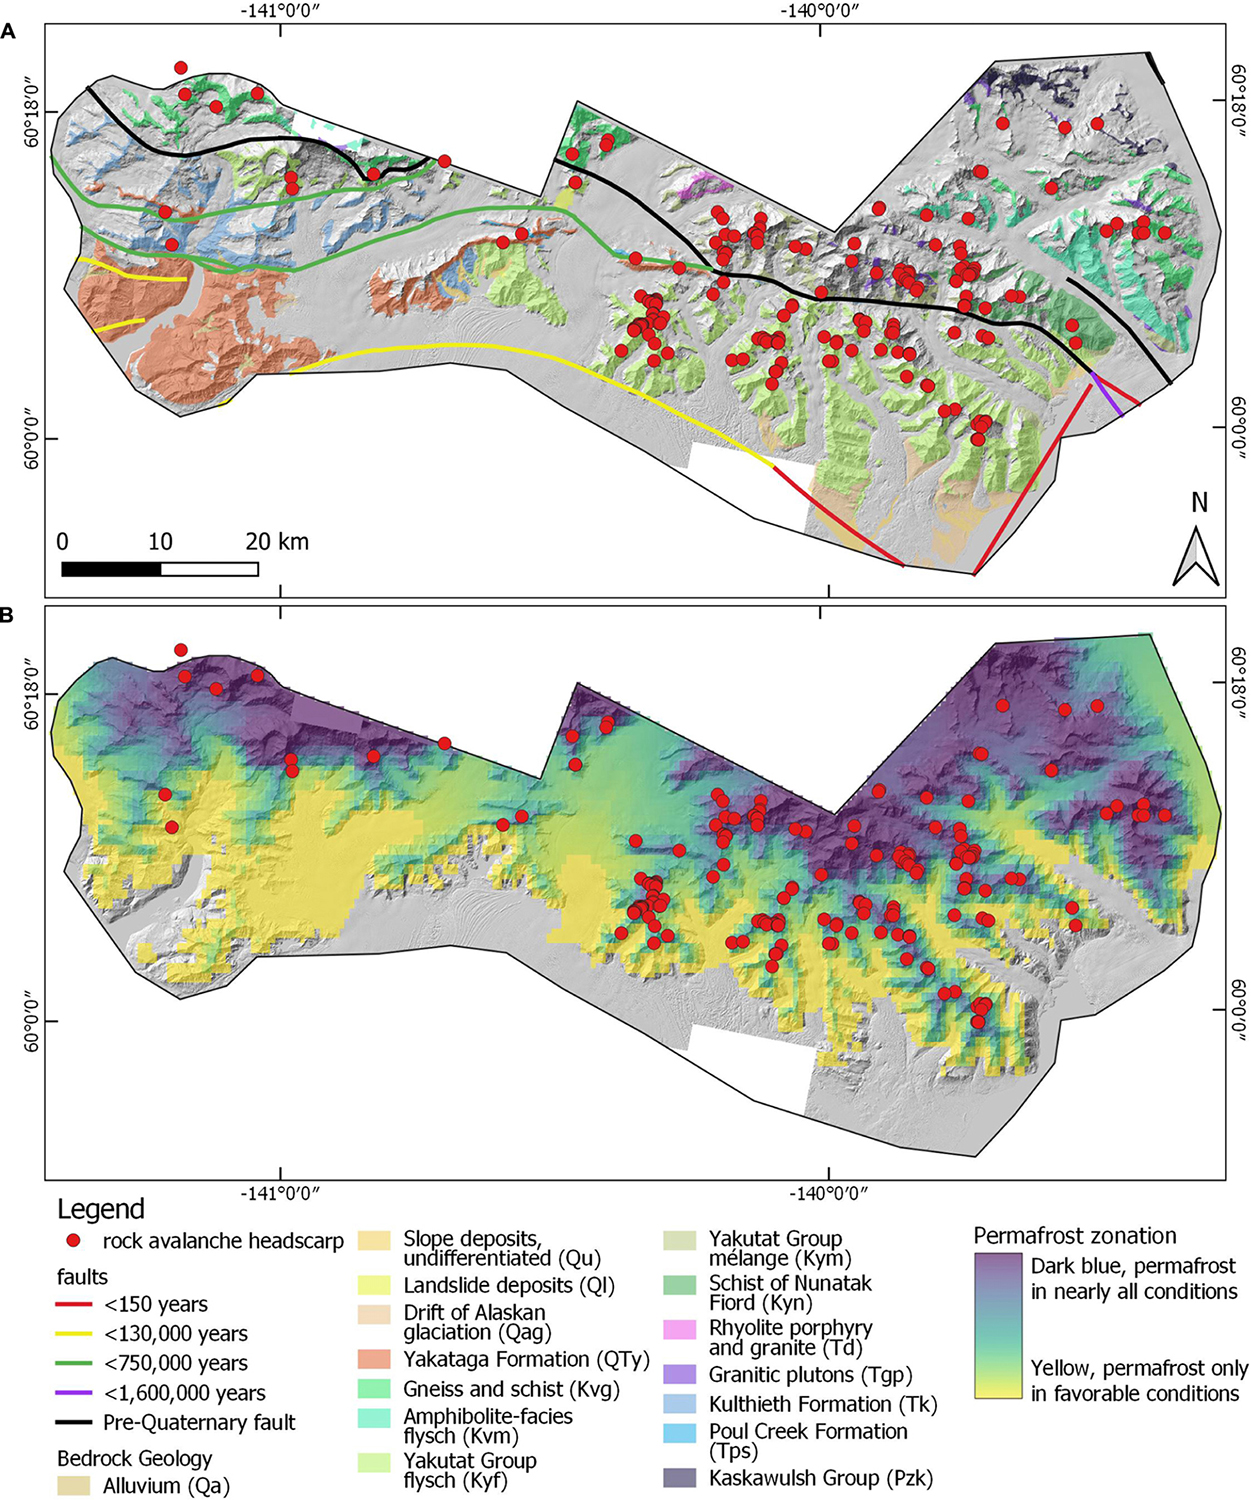
Figure 5. (A) Map of the Saint Elias study area showing mapped rock avalanches, bedrock geology (Richter et al., 2005; Wilson et al., 2005) and fault locations (Koehler et al., 2012). Timing of most recent movement for each fault is shown. Geologic units have not been mapped in ice-covered areas, which account for ∼68% of the study area. (B) Permafrost zonation map (Gruber, 2012b) of the Saint Elias study area showing the locations of rock avalanches that occurred between 1984 and 2019.
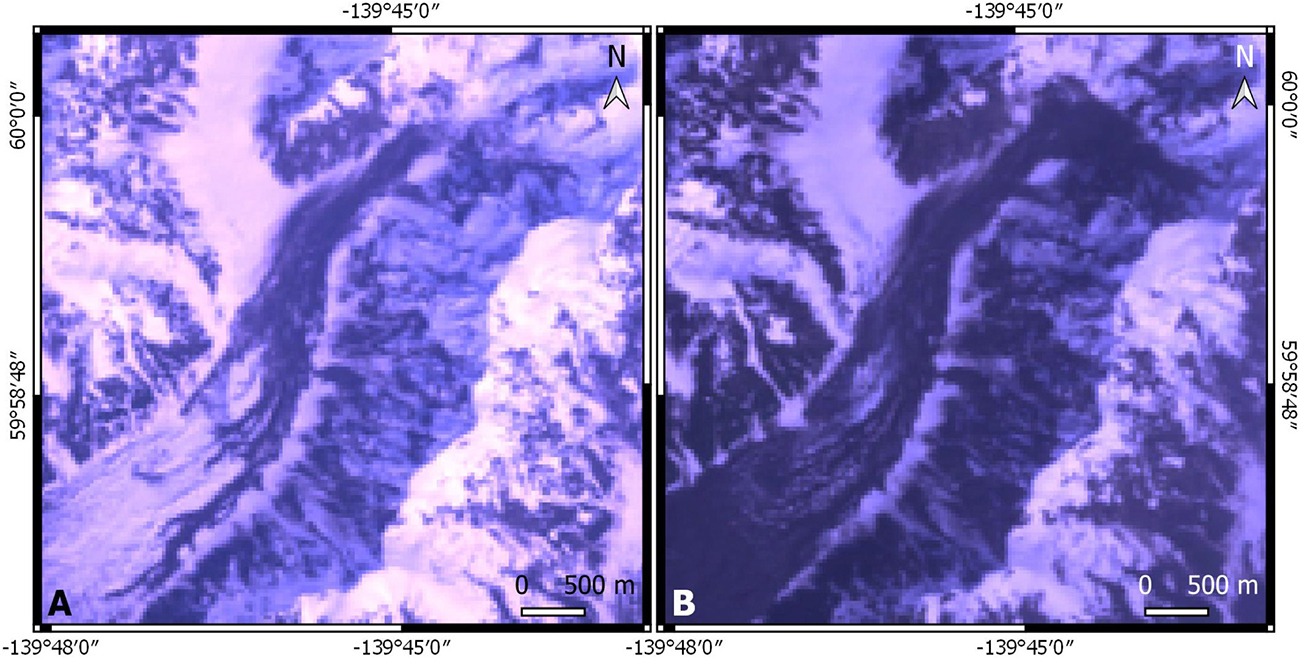
Figure 6. Landsat images acquired on (A) 2 July 1992 and (B) 10 August 1992, showing the rapidly reworked deposit of RA 36 (event occurred between 4 April and 22 May 1992) on Atrevida Glacier.
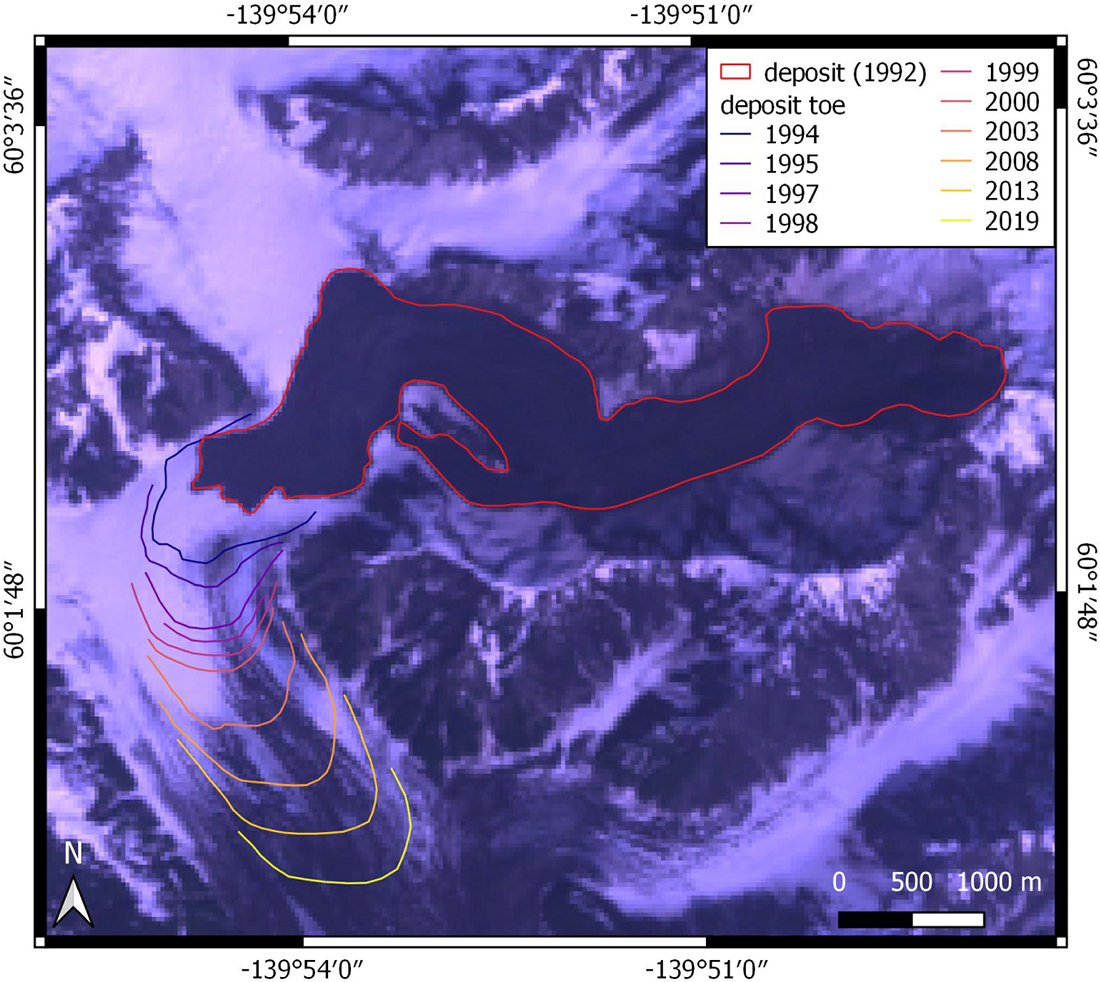
Figure 7. Landsat image acquired on 10 August 1992 showing RA 33, which occurred between 25 July 1992 and 2 August 1992. In subsequent years, the rock avalanche toe was visible on the surface of Lucia Glacier, as shown by colored lines.
Rock avalanches initiated from a variety of rock types, but were particularly abundant to the east of Malaspina Glacier in the schist of Nunatuk Fiord (Kyn), flysch (Kyf) and mélange (Kym) of the Yakutat Group, and granitic plutons (Td, Tgp) which intruded Kyn and Kym (Figure 5A). Over half of all rock avalanches (131) originated in the flysch (Kyf) of the Yakutat Group (Table 1), which is the most areally extensive bedrock unit in the study area, underlying 34% of all non-ice-covered areas. The spatial density of rock avalanches in the flysch (Kyf) was 0.32 rock avalanches/km2 (Table 1), which was relatively low compared to other geologic units. For example, the units with the highest spatial densities (1.3 rock avalanches/km2) were the intrusive units (Td and Tgp; Table 1). The spatial density of rock avalanches in the schist of Nunatuk Fiord and other (non-flysch) units in the Yakutat Group ranged from 0.32 to 0.40 rock avalanches/km2 (Table 1).
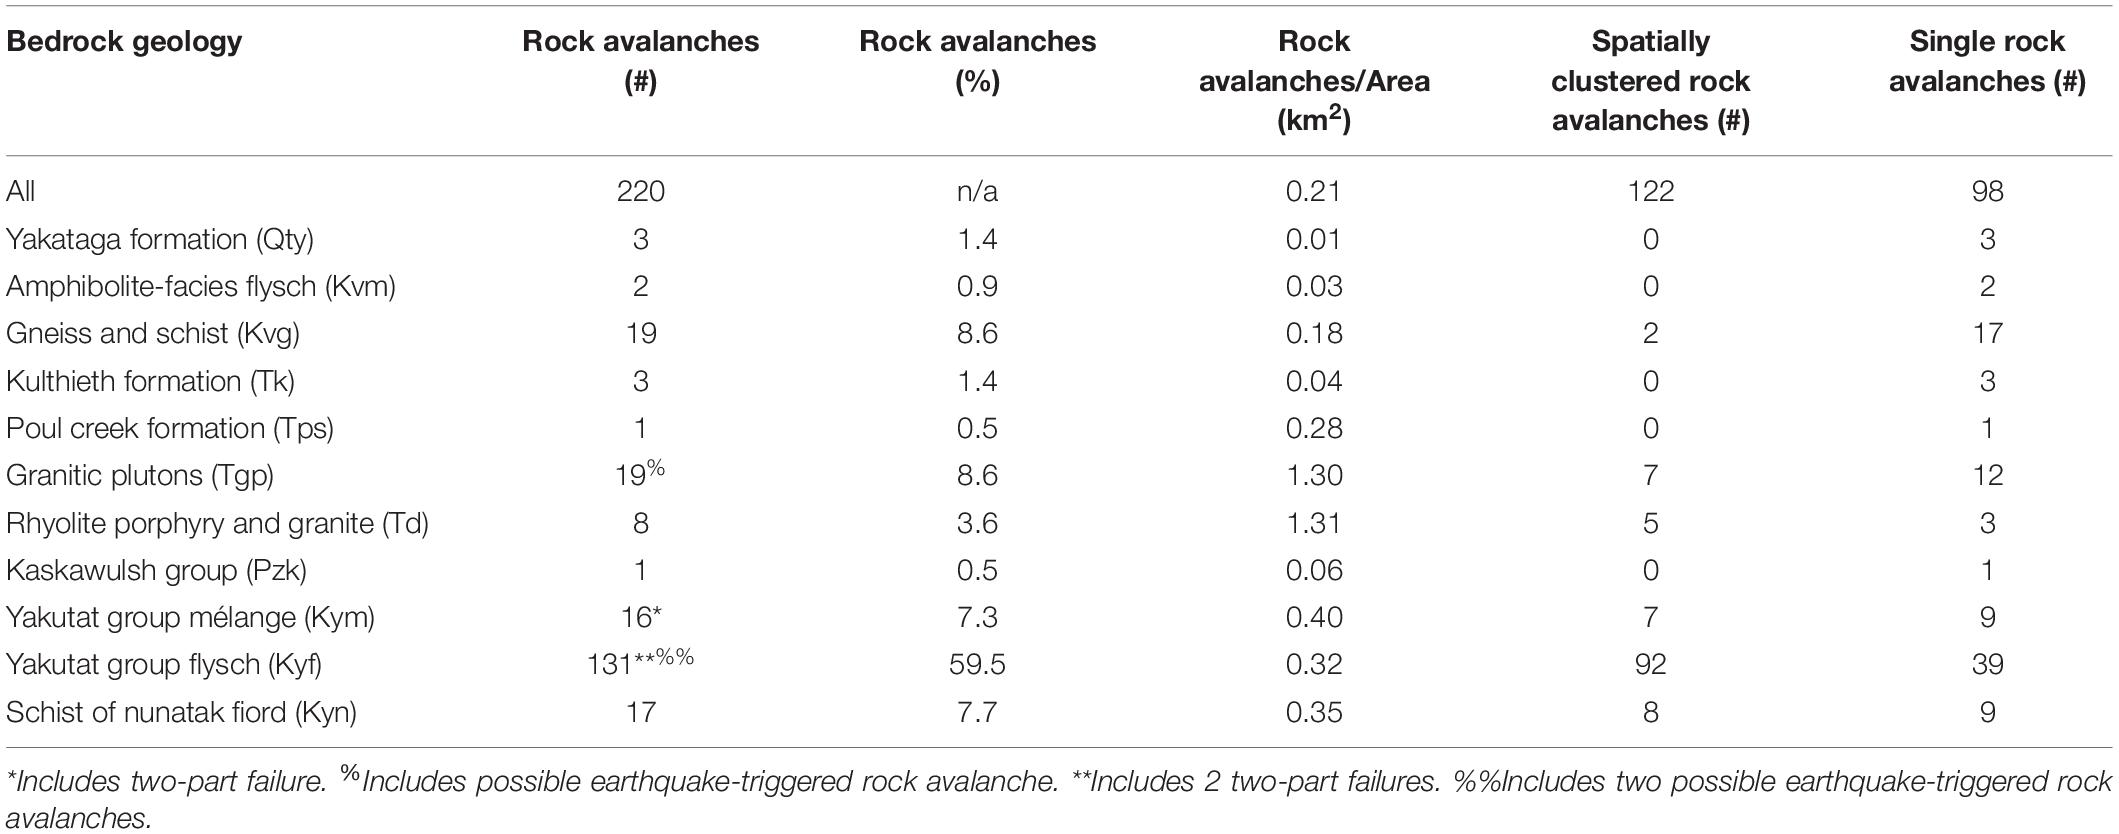
Table 1. Characteristics of rock avalanches that occurred in the Saint Elias study area between 1984 and 2019 in varying bedrock formations (Richter et al., 2005).
Over half of the rock avalanches in our inventory (122; Table 1) initiated from source areas that failed repeatedly during the period of record. We identified 34 different source areas that contained between 2 and 14 distinct failures (i.e., spatial rock avalanche clusters). Spatial rock avalanche clusters occurred in rocks of the Yakutat Group (Kyf, Kyn, and Kym), intrusive units (Td and Tgp) and gneiss and schist (Kvg) of the Chugach terrane. Spatial clusters occurred in all geologic units with at least five failures, and nearly 70% of all failures in flysch (Kyf) of the Yakutat Group occurred in spatial clusters. Three rock avalanches that were documented in the study area prior to 1984 coincided with the locations of spatial clusters in our inventory. The exact location of two 1965 rock avalanches on Marvine and Blossom Glaciers (Post, 1967) are unknown, but approximately coincided with clusters c23 and c5, respectively (Table 2). A coseismic rock avalanche triggered by the 1979 St. Elias earthquake (Cascade 3; Delaney and Evans, 2014; Evans and Delaney, 2014; Reid, 2017) was located on Hitchcock Glacier (Figure 1) and coincided with cluster c12 (Table 2). Spatial rock avalanche clusters predominantly originated from slopes with north and west aspects, whereas single rock avalanches preferentially failed from south-southeast facing slopes (Supplementary Table S2, Supplementary Figure S1). We found no substantial differences between the deposit characteristics (area, travel distance, H/L) between rock avalanches that occurred in spatial clusters and those that did not.
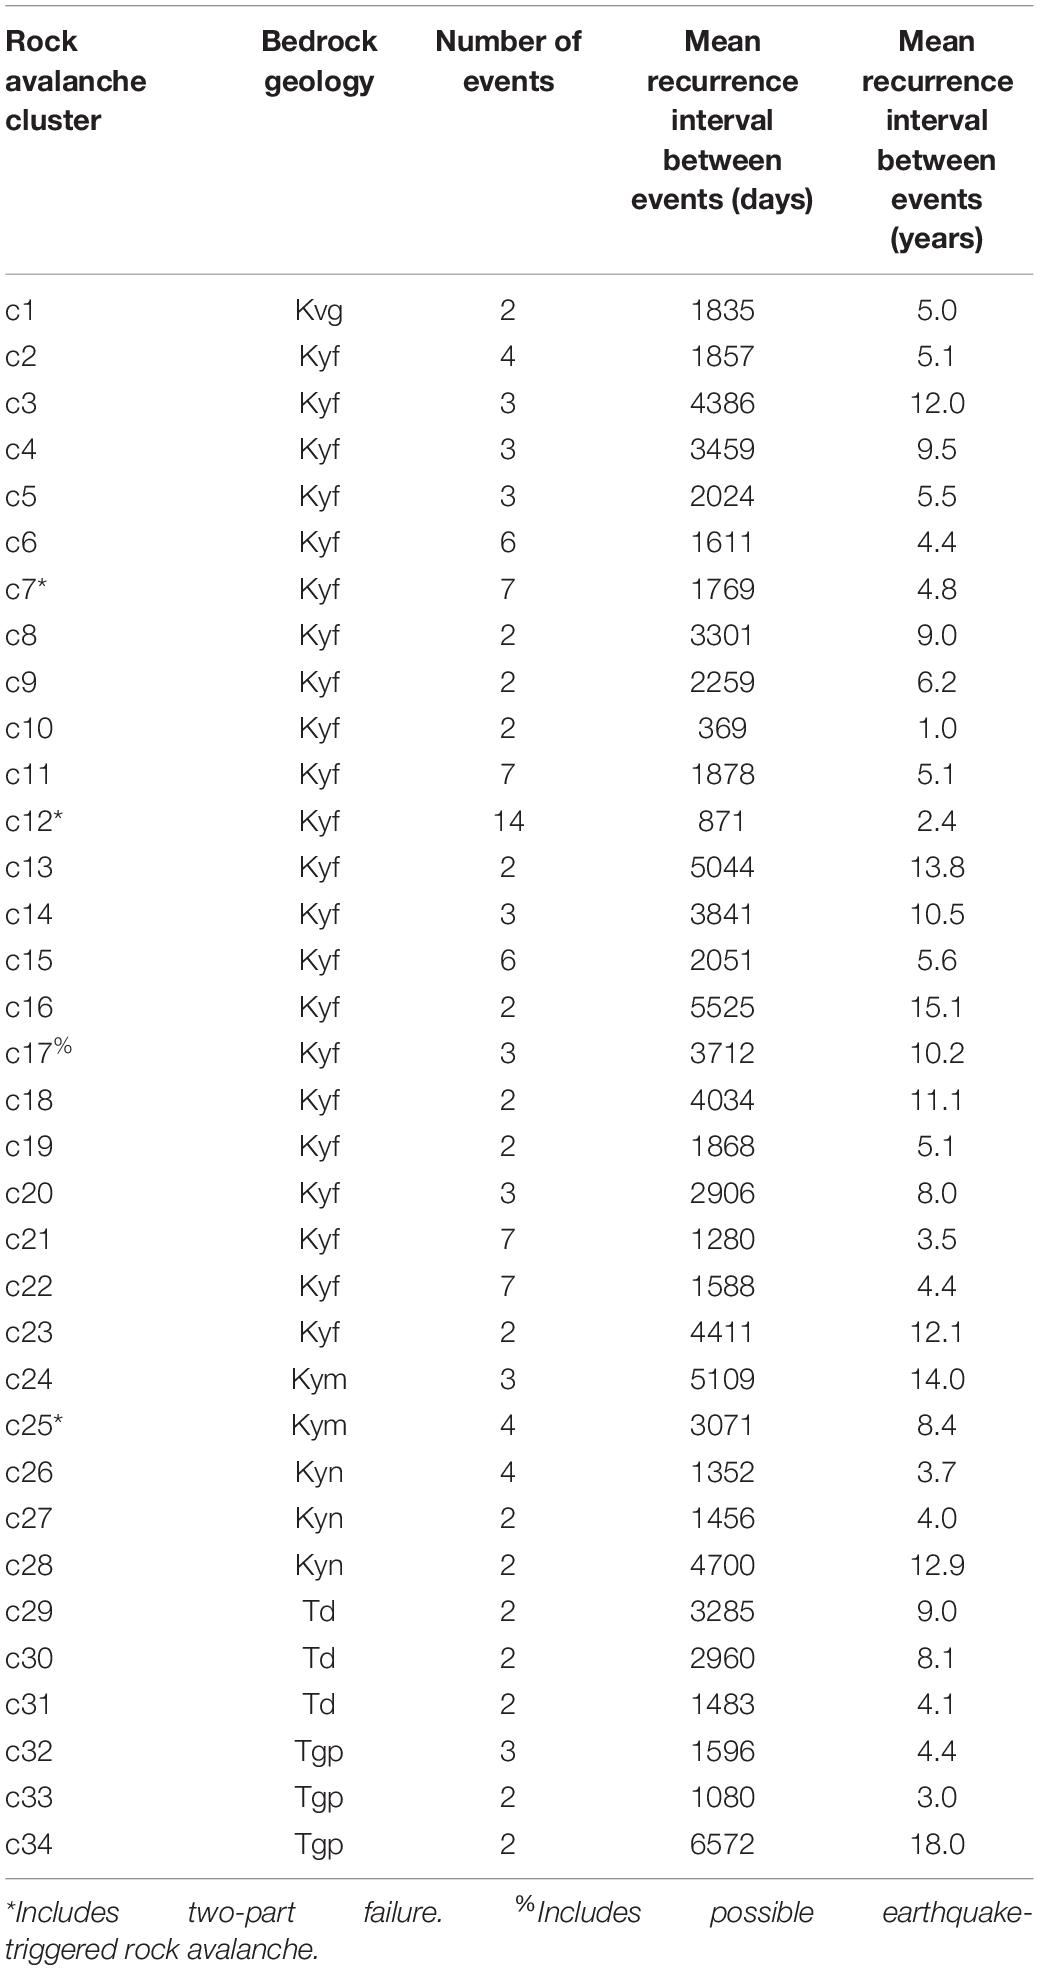
Table 2. Characteristics of 34 rock avalanche clusters (122 rock avalanche events) in the Saint Elias study area.
Among all spatial clusters of rock avalanches, the timing of repeated events had no apparent pattern (Figure 8), although seven different clusters had events that occurred in consecutive years. The recurrence intervals for distinct spatial clusters ranged from just over a year (369 days) to more than 18 years (6572 days; Table 2). Overall, about 67% of basins in which rock avalanches occurred, had one event in the 36-year period of record. The other 33% of basins had multiple rock avalanches during the period of record (e.g., Figures 9, 10). The source areas of spatial clusters c11 and c12 were located approximately 800 m apart and deposits from both clusters were emplaced in the same area of Hitchcock Glacier (Figure 9), making this the most active basin in the study area. The combination of seven failures from cluster c11, 14 failures from cluster c12, and spatially overlapping deposits from both clusters, resulted in a mean recurrence interval of 2 years (18 overlapping rock avalanche deposits in 36 years) for a small part of the Hitchcock Glacier (Figures 9B, 10).
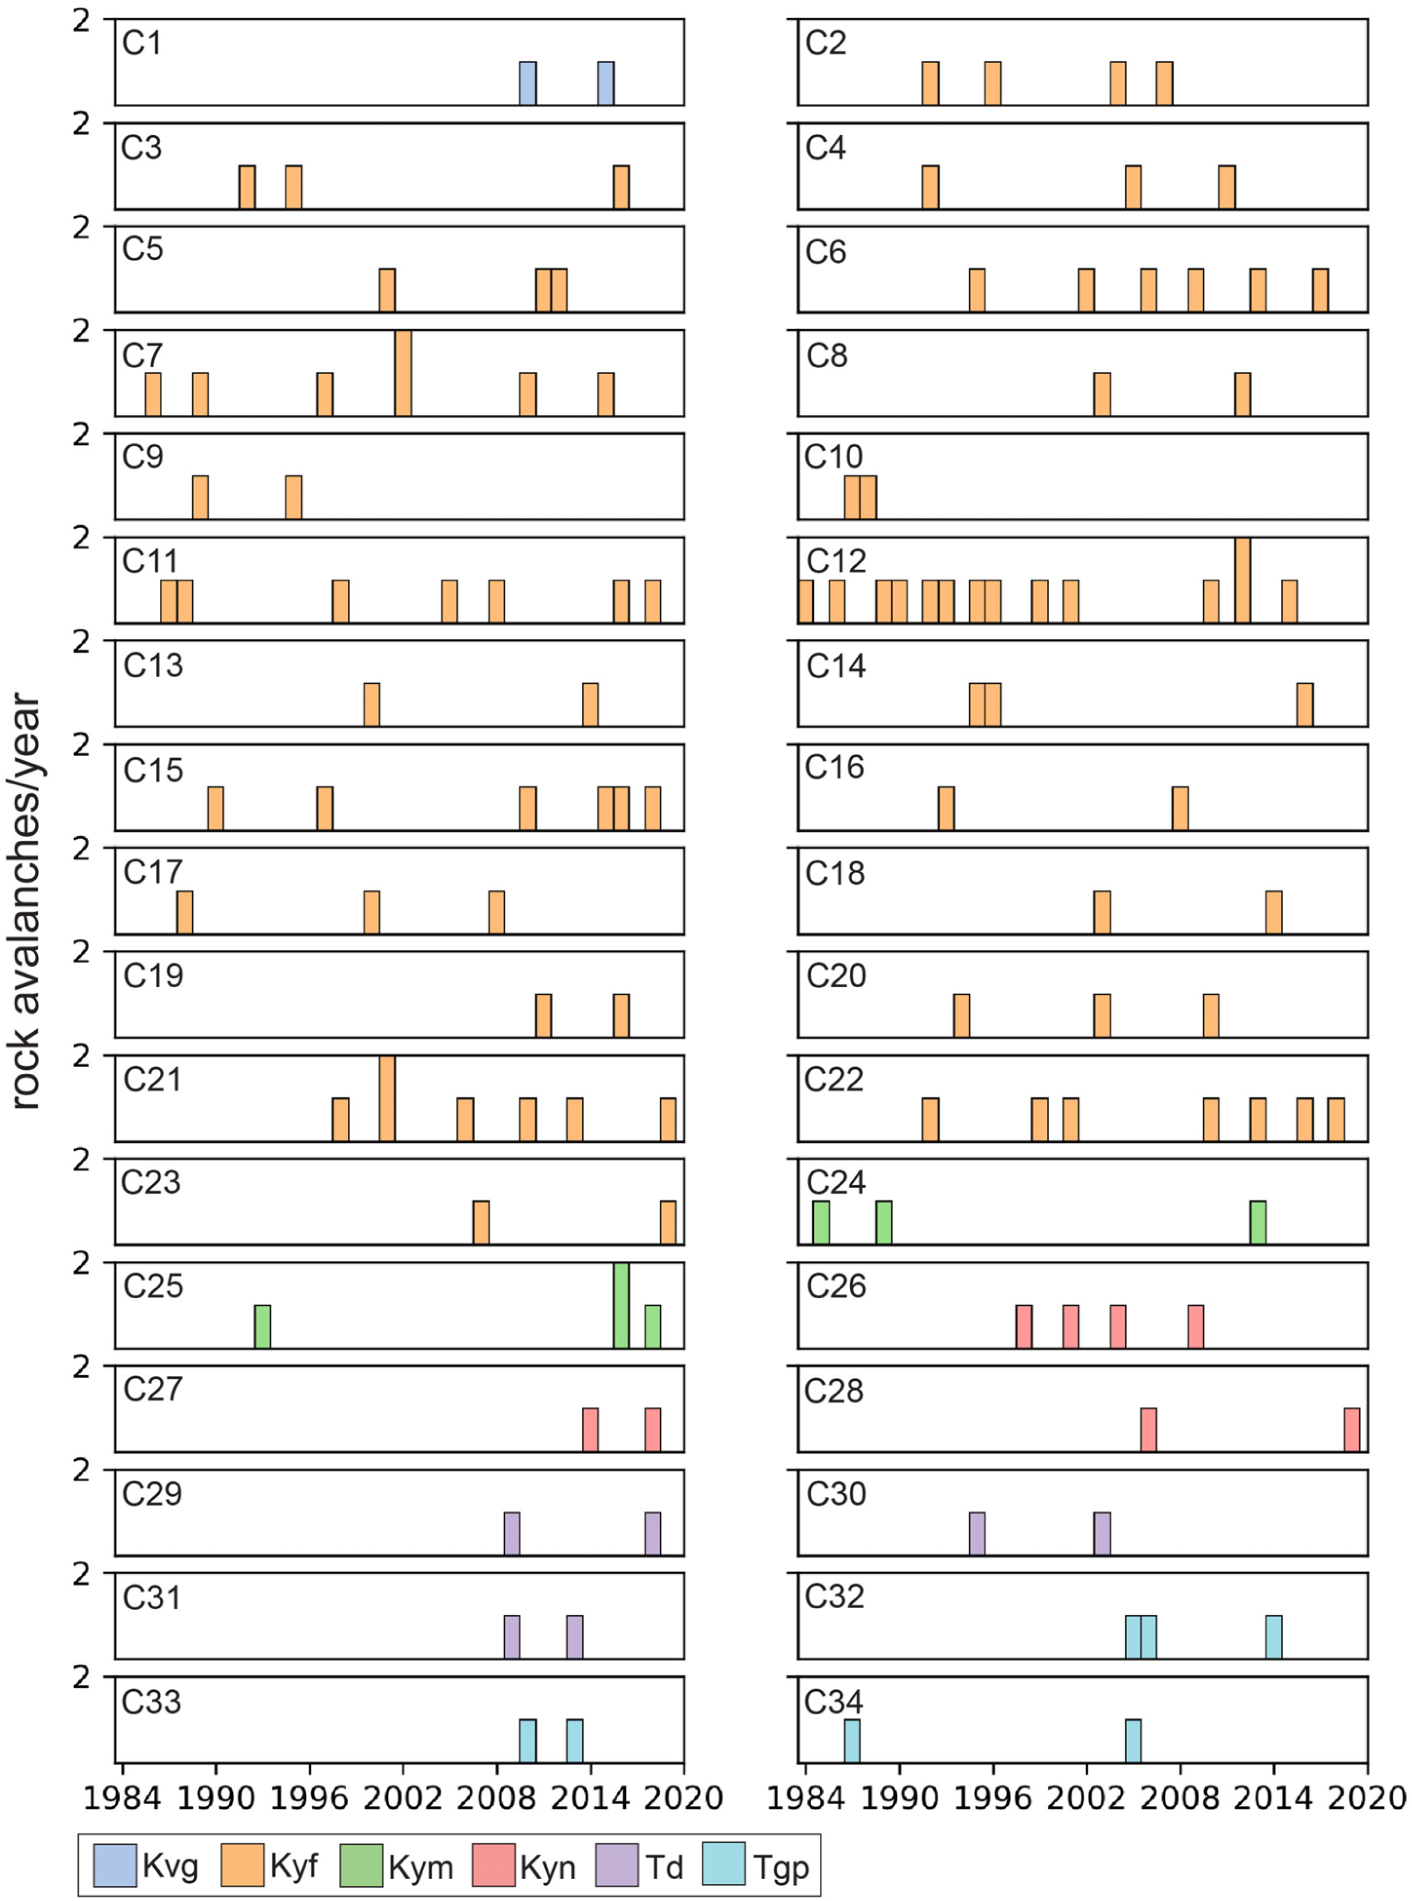
Figure 8. Histograms showing the timing of clustered rock avalanche failures in the flysch (Kyf) and mélange (Kym) members of the Yakutat Group, schist of Nunatak Fiord (Kyn), gneiss and schist of the Chugach terrane (Kvg), granitic plutons (Tgp), and rhyolite porphyry and granite (Td) in the Saint Elias study area between 1984 and 2019.
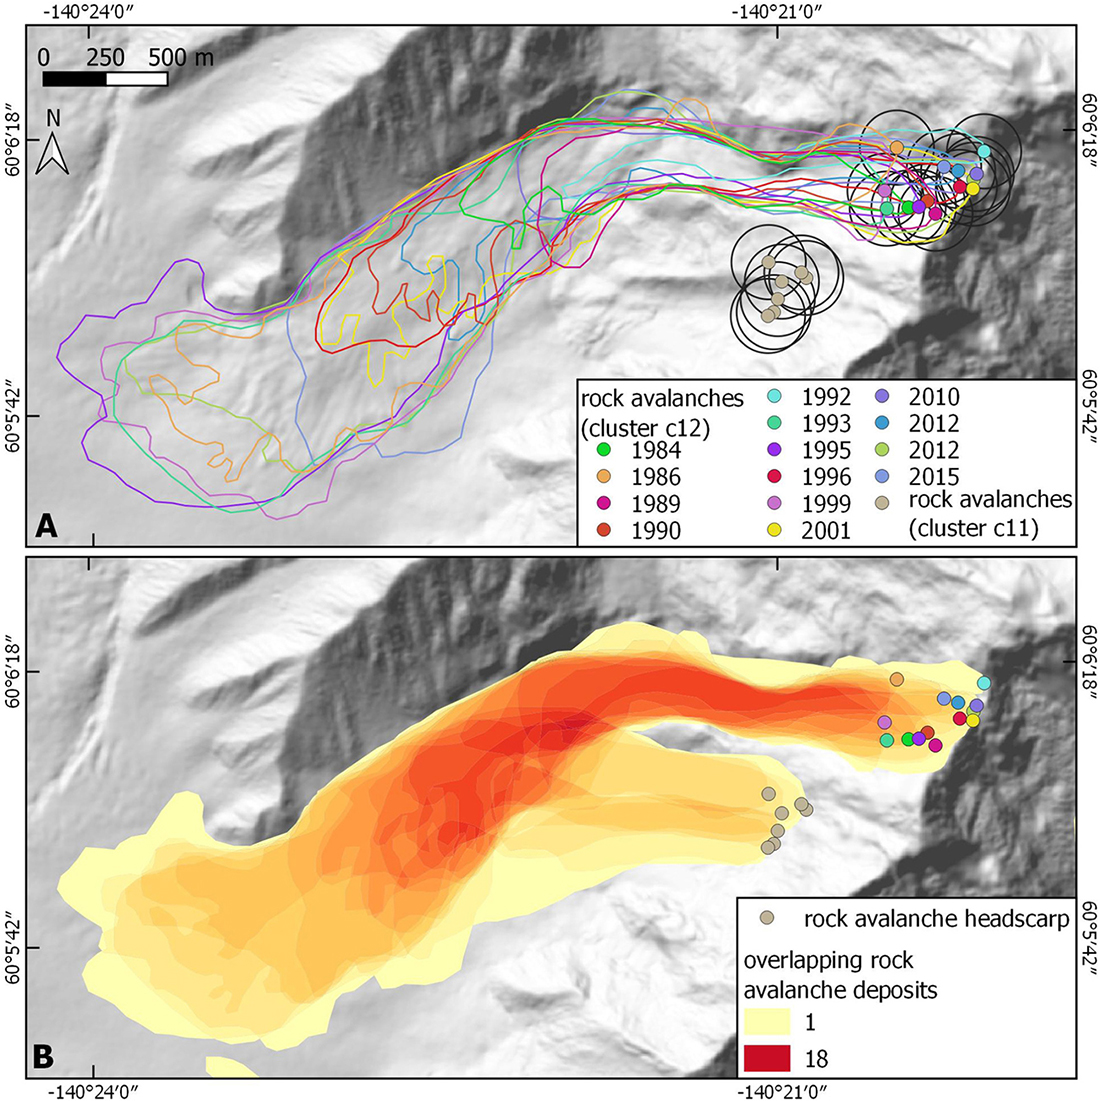
Figure 9. (A) Closeup of the Hitchcock Glacier showing mapped headscarp locations for rock avalanche clusters c11 (gray dots) and c12 (colored dots) and deposits (colored lines) for cluster c12. Black circles denote a 150 m buffer zone around each headscarp point, indicating the extent of possible mapping error. (B) Heat map showing the number of overlapping rock avalanche deposits from clusters c11 (gray headscarp points) and c12 (colored headscarp points) on the Hitchcock Glacier.
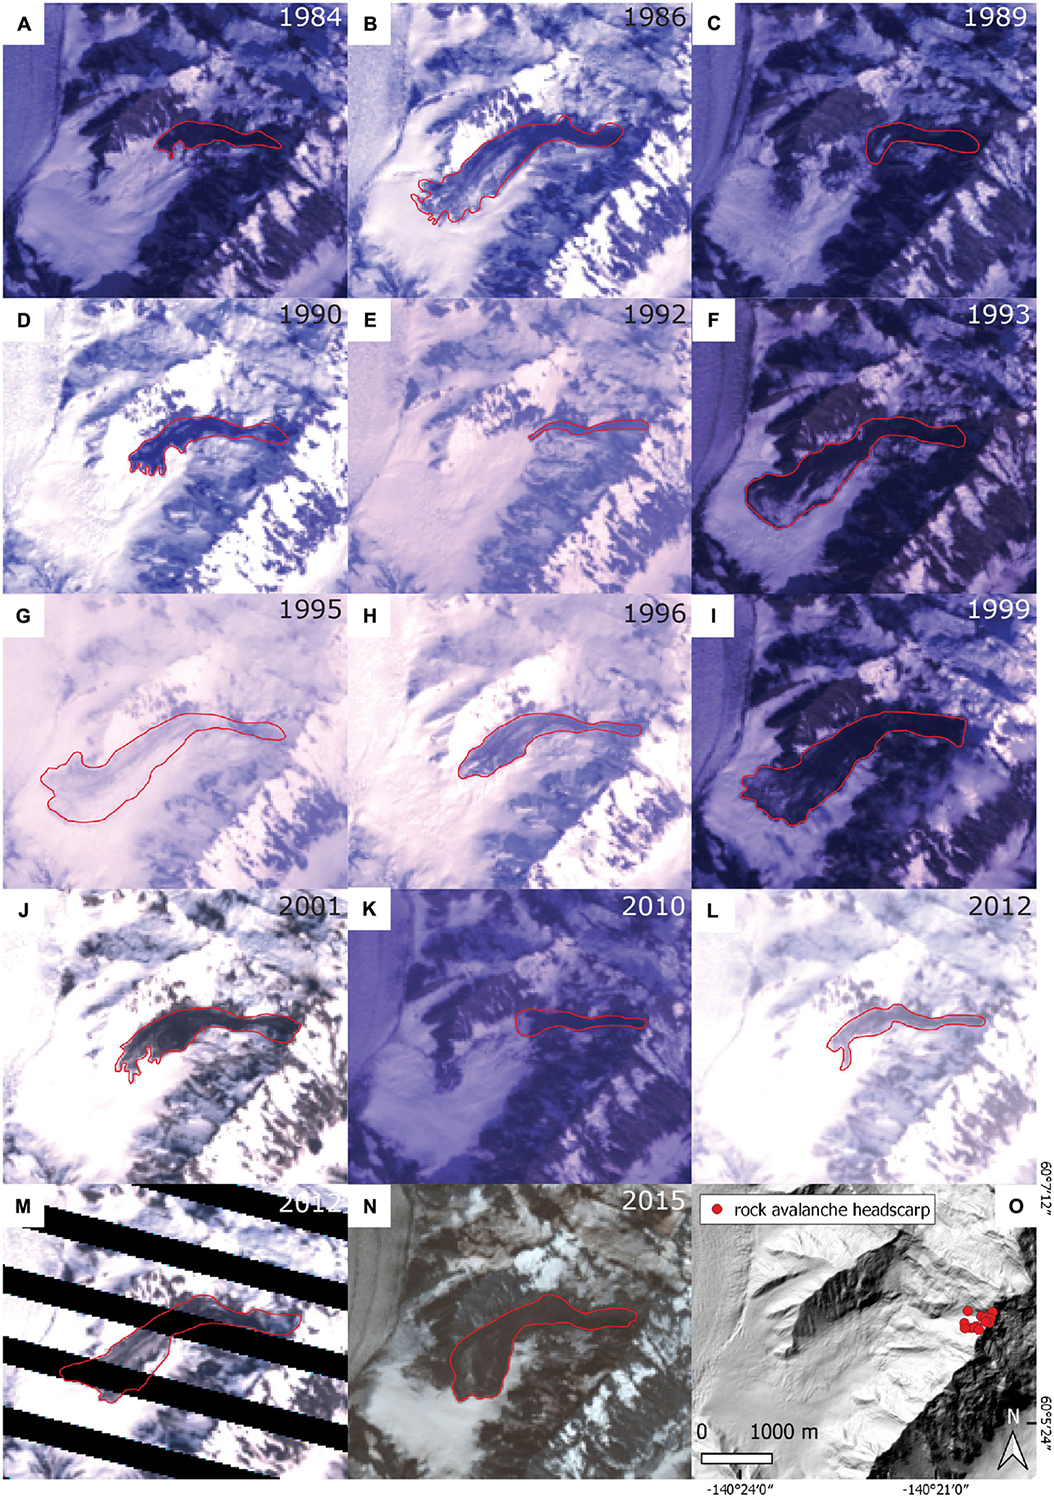
Figure 10. Landsat imagery showing 14 mapped rock avalanches (cluster c12) on Hitchcock Glacier in the Saint Elias Mountains. Rock avalanches occurred in (A) 1984 (RA 2), (B) 1986 (RA 8), (C) 1989 (RA 24), (D) 1990 (RA 25), (E) 1992 (RA 37), (F) 1993 (RA 43), (G) 1995 (RA 51), (H) 1996 (RA 62), (I) 1999 (RA 78), (J) 2001 (RA 86), (K) 2010 (RA 149), (L,M) 2012 (RA 158 and RA 159), and (N) 2015 (RA 182). (O) Hillshade (derived from a 5 m digital elevation model (DEM; U.S. Geological Survey, 2012) of Hitchcock Glacier and the surrounding area showing the locations of rock avalanche headscarps. Note: the IFSAR-derived DEM was acquired in 2012 and the deposit of RA 159 is apparent in the hillshade.
Mann–Kendall tests for temperature and precipitation during the 72-year period for which nearly continuous data were recorded at the Yakutat Airport weather station (1948–2019) yielded statistically significant (p = 0.05) increasing trends for average (slope = 0.028°C/year), maximum (slope = 0.028°C/year), and minimum (slope = 0.030°C/year) annual temperatures, a statistically significant (p = 0.05) decreasing trend for annual snowfall (slope = −3.5 mm/year), and no trend for precipitation. During the 72-year period, a warmer than average period began in 1977 and continued through 2019 (Figure 11A). This period was characterized by less than average snowfall (Figure 11B) but wide variations in overall precipitation (Figure 11C). Between 1977 and 2019, average annual temperatures exceeded the 72-year average 65% of the time, while minimum annual temperatures were above average 70% of the time. Total annual snowfall was below average during 79% of the years between 1977 and 2019. Beginning in about 1977, total precipitation was above average until the early 2000s, when precipitation decreased and remained below average through 2019 (Figure 11C).
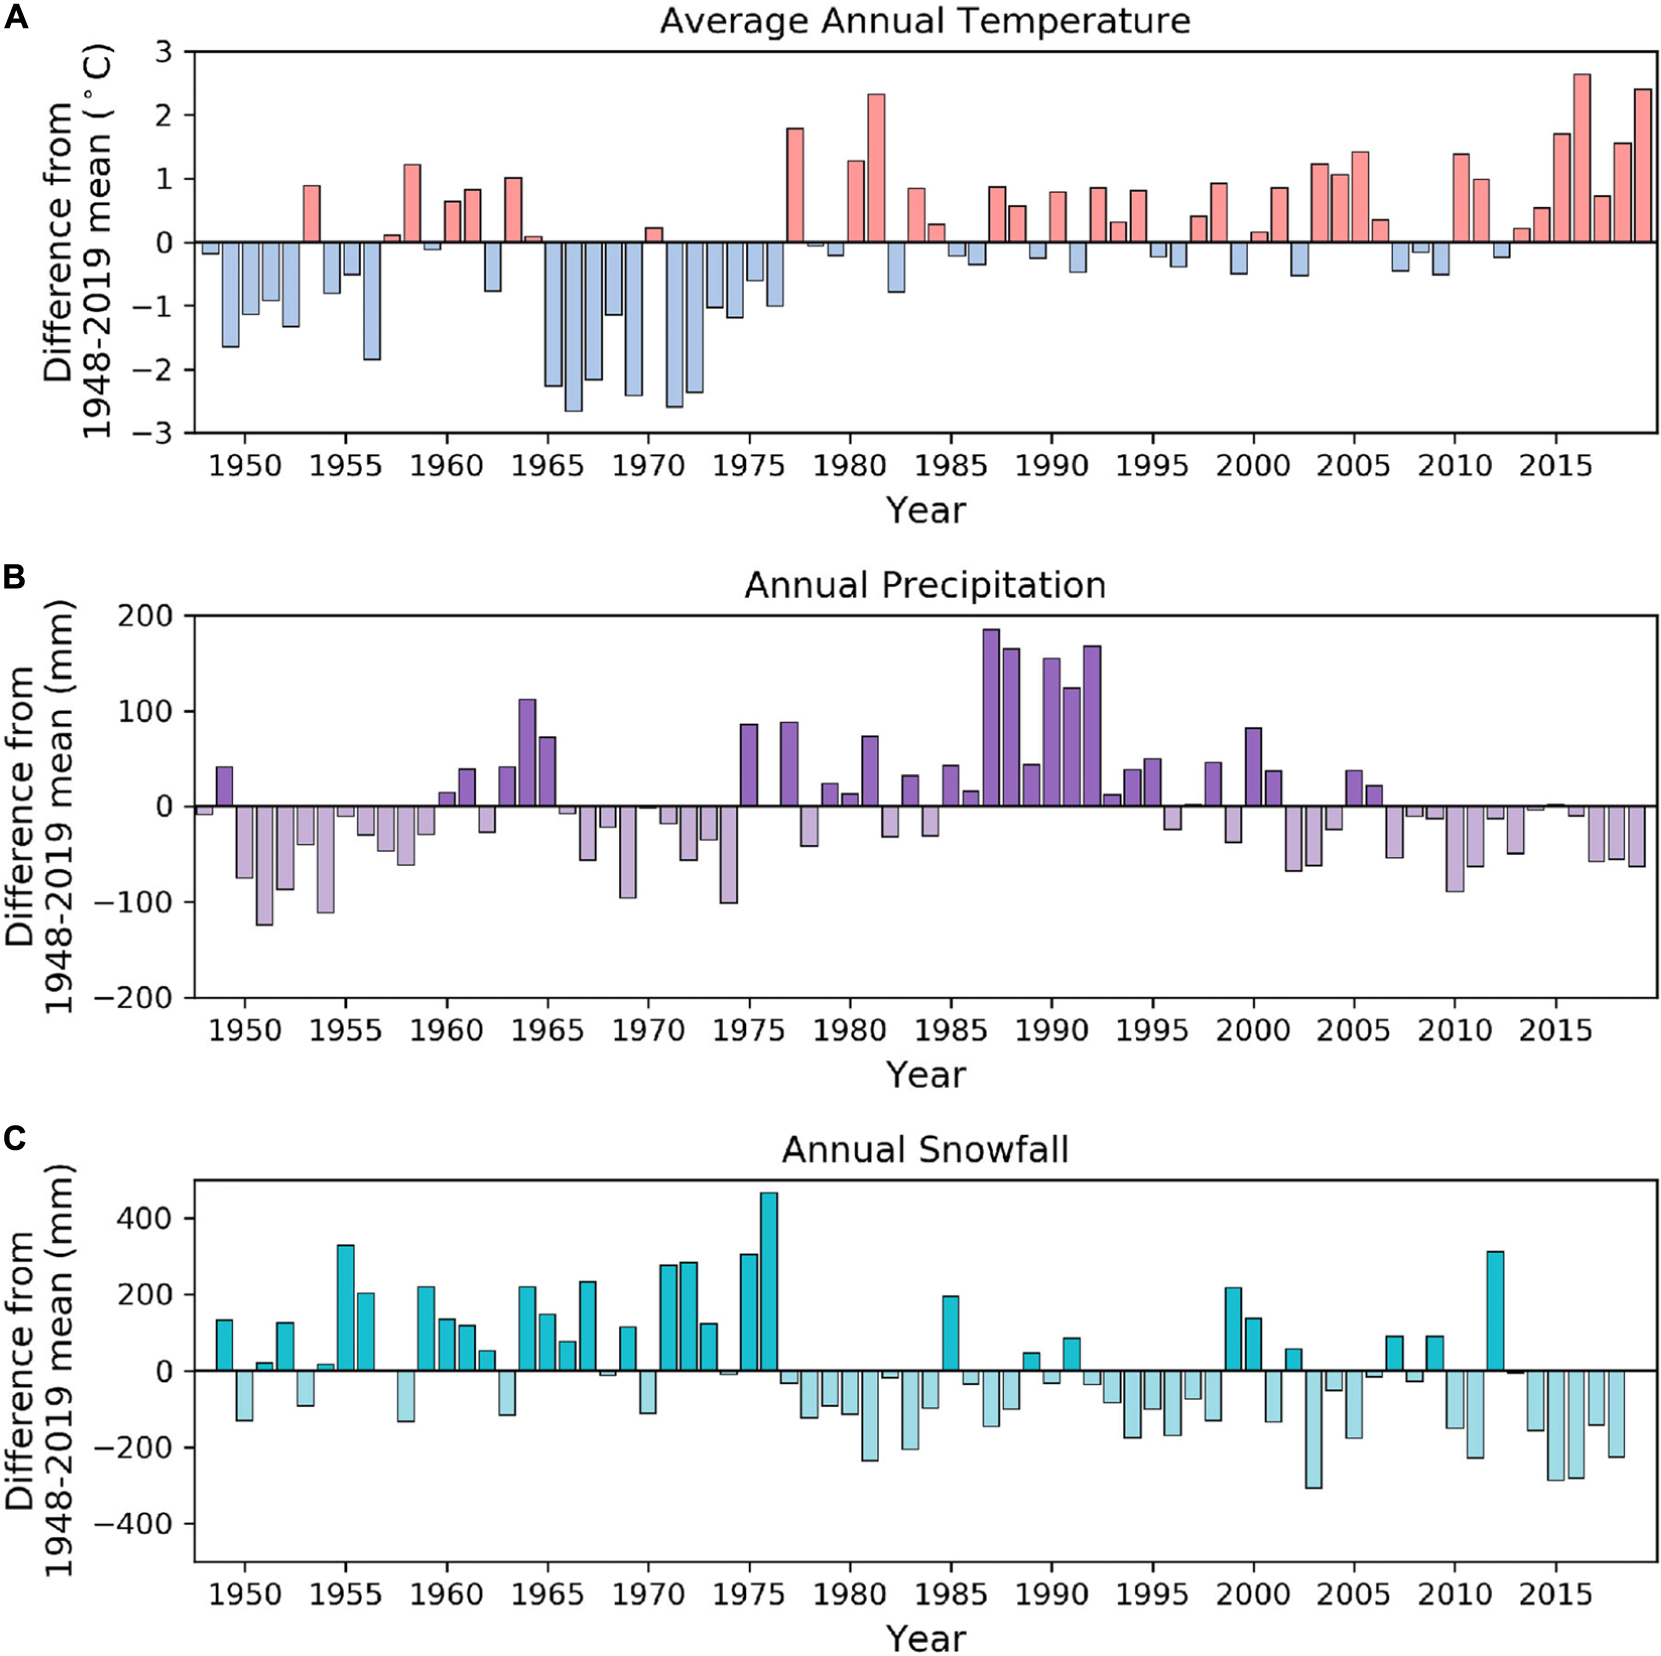
Figure 11. Deviation from 1948 to 2019 mean (A) average annual temperature, (B) annual precipitation and (C) annual snowfall at the Yakutat Airport weather station in southern Alaska.
The examination of monthly data throughout the period of record revealed seasonal discrepancies in the timing and magnitude of temperature changes. During the period between 1948 and 2019, winter (December through February) temperatures were generally more above average than summer temperatures. During the period of our rock avalanche inventory (1984–2019), January temperatures exceeded average by about twice as much as any other month (Figure 12A), and summer temperatures (May through August) also exceeded average more than temperatures during spring and fall months, although to a lesser extent than winter temperatures. Because winter and summer temperatures showed larger deviations from average during the period of our rock avalanche inventory, we used winter (December through February) and summer (June through August) seasonal averages to investigate temperature trends that may have affected rock avalanche processes.
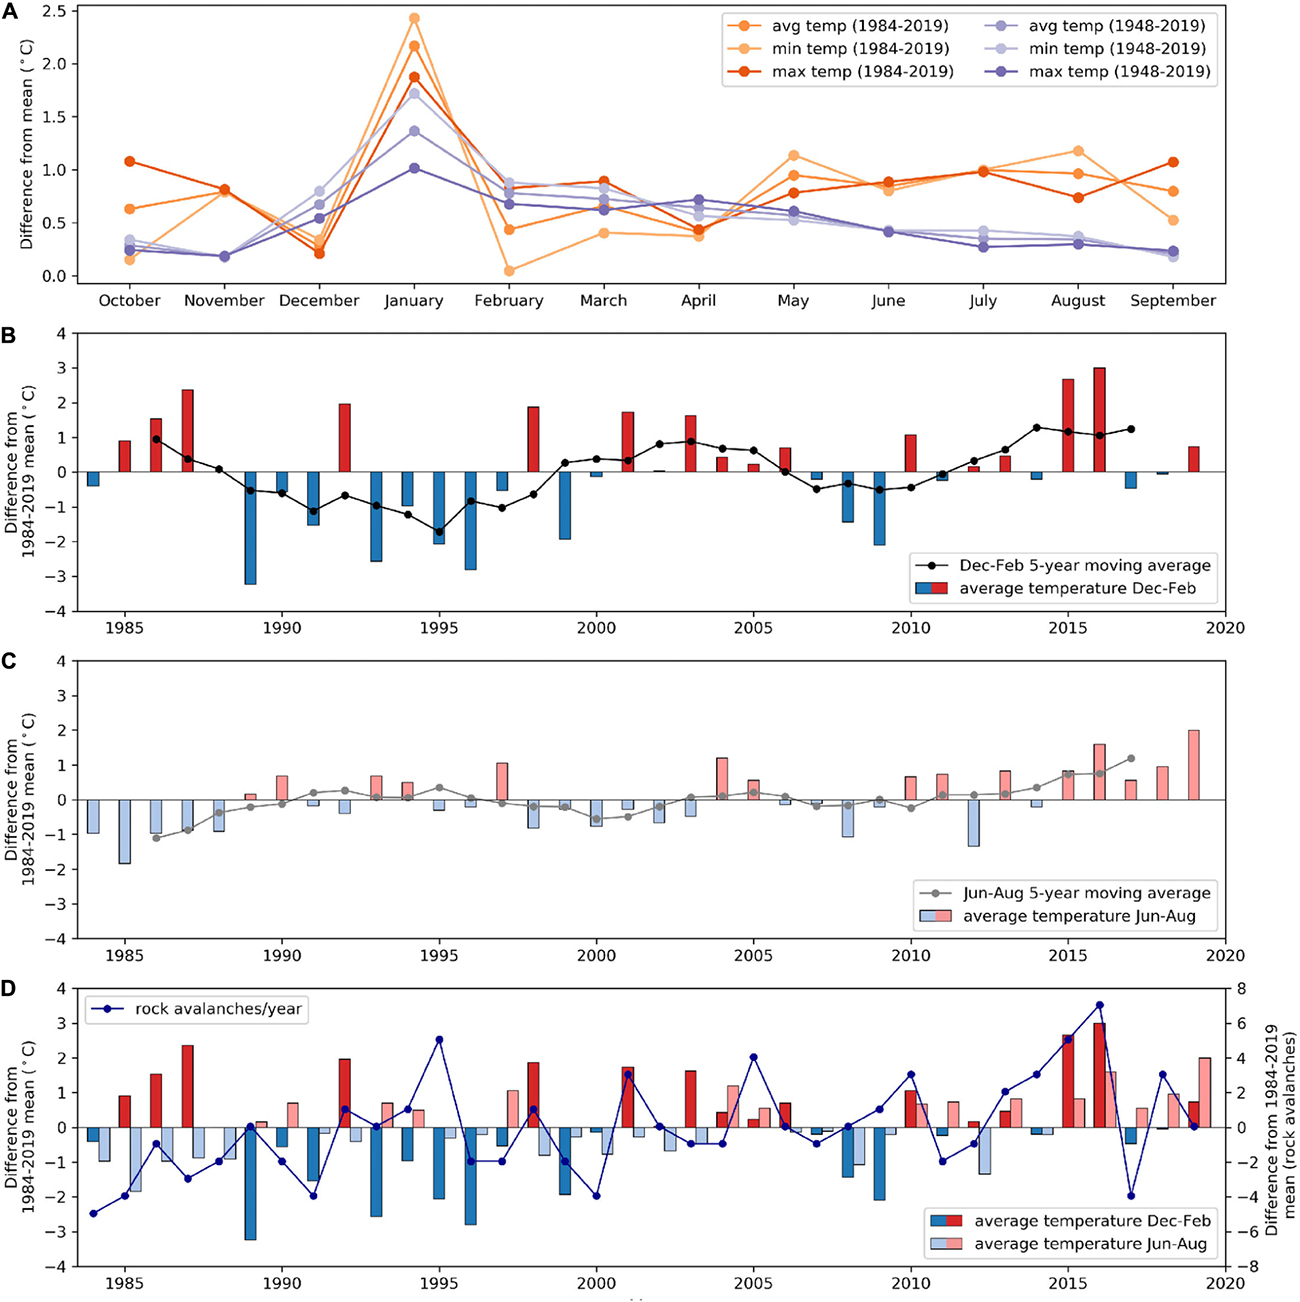
Figure 12. (A) Deviations from the 1948–2019 (purple) and 1984–2019 (orange) mean monthly temperatures (average, minimum and maximum) at the Yakutat Airport weather station in southern Alaska. Difference from 1984 to 2019 mean temperature for average (B) winter (December-February) and (C) summer (June-August) temperatures. (D) Comparison of the number of rock avalanches per year and average winter (December-February) and summer (June-August) temperatures during the period from 1984 to 2019 in the Saint Elias study area. Rock avalanche data do not include possible earthquake-triggered events (three) and each two-part failure is only counted once.
During the period between 1984 and 2019, winter (December through February) and summer (June through August) temperatures were variably above and below the overall (1984–2019) mean (Figures 12B,C). Five-year moving average winter temperatures were above average for two or more consecutive years between 1986–1988, 1999–2006, and 2012–2017 (Figure 12B). Five-year moving average summer temperatures were similarly above average for two or more consecutive years between 2003–2006 and 2011–2017 (Figure 12C). The most recent and longest period during which both summer and winter temperatures were consistently above average coincided with a peak in rock avalanche activity that occurred between 2013 and 2016 (Figure 12D). In the future, additional climate data from multiple stations located in the study area or in similar terrain could aid in the understanding of climate-driven rock avalanche processes.
Recent works by Uhlmann et al. (2013) and Coe et al. (2018) present inventory data of rock avalanches in areas of southern Alaska that have terrain and climate characteristics that are similar to the St. Elias study area. Uhlmann et al. (2013) utilized Landsat imagery to identify and track the movement of rock avalanche deposits on glaciers in the Chugach Mountains between ∼1950–2008. The methods and data sources that we used in the St. Elias study area were identical to those used by Coe et al. (2018) in their study of rock avalanches in Glacier Bay National Park and Preserve (GBNPP) between 1984 and 2016. Rock avalanches in the St. Elias Mountains occurred seven times more frequently (Figure 13A), but were, on average, an order of magnitude smaller (Figure 13B) than rock avalanches in a 5000 km2 area of GBNPP between 1984 and 2019 (Bessette-Kirton and Coe, 2016; Coe et al., 2018 and Supplementary Table S5). The average recurrence interval for rock avalanches in GBNPP was 437 days (30 rock avalanches), with an average of 0.8 rock avalanches occurring annually (Coe et al., 2018 and Supplementary Table S5). Similarly, Uhlmann et al. (2013) reported rock avalanche rates of 0.8–1.7 events/year in the Chugach Mountains (including rock avalanches triggered by earthquakes), which is about 4–8 times less frequent than non-coseismic rock avalanches in the St. Elias area.
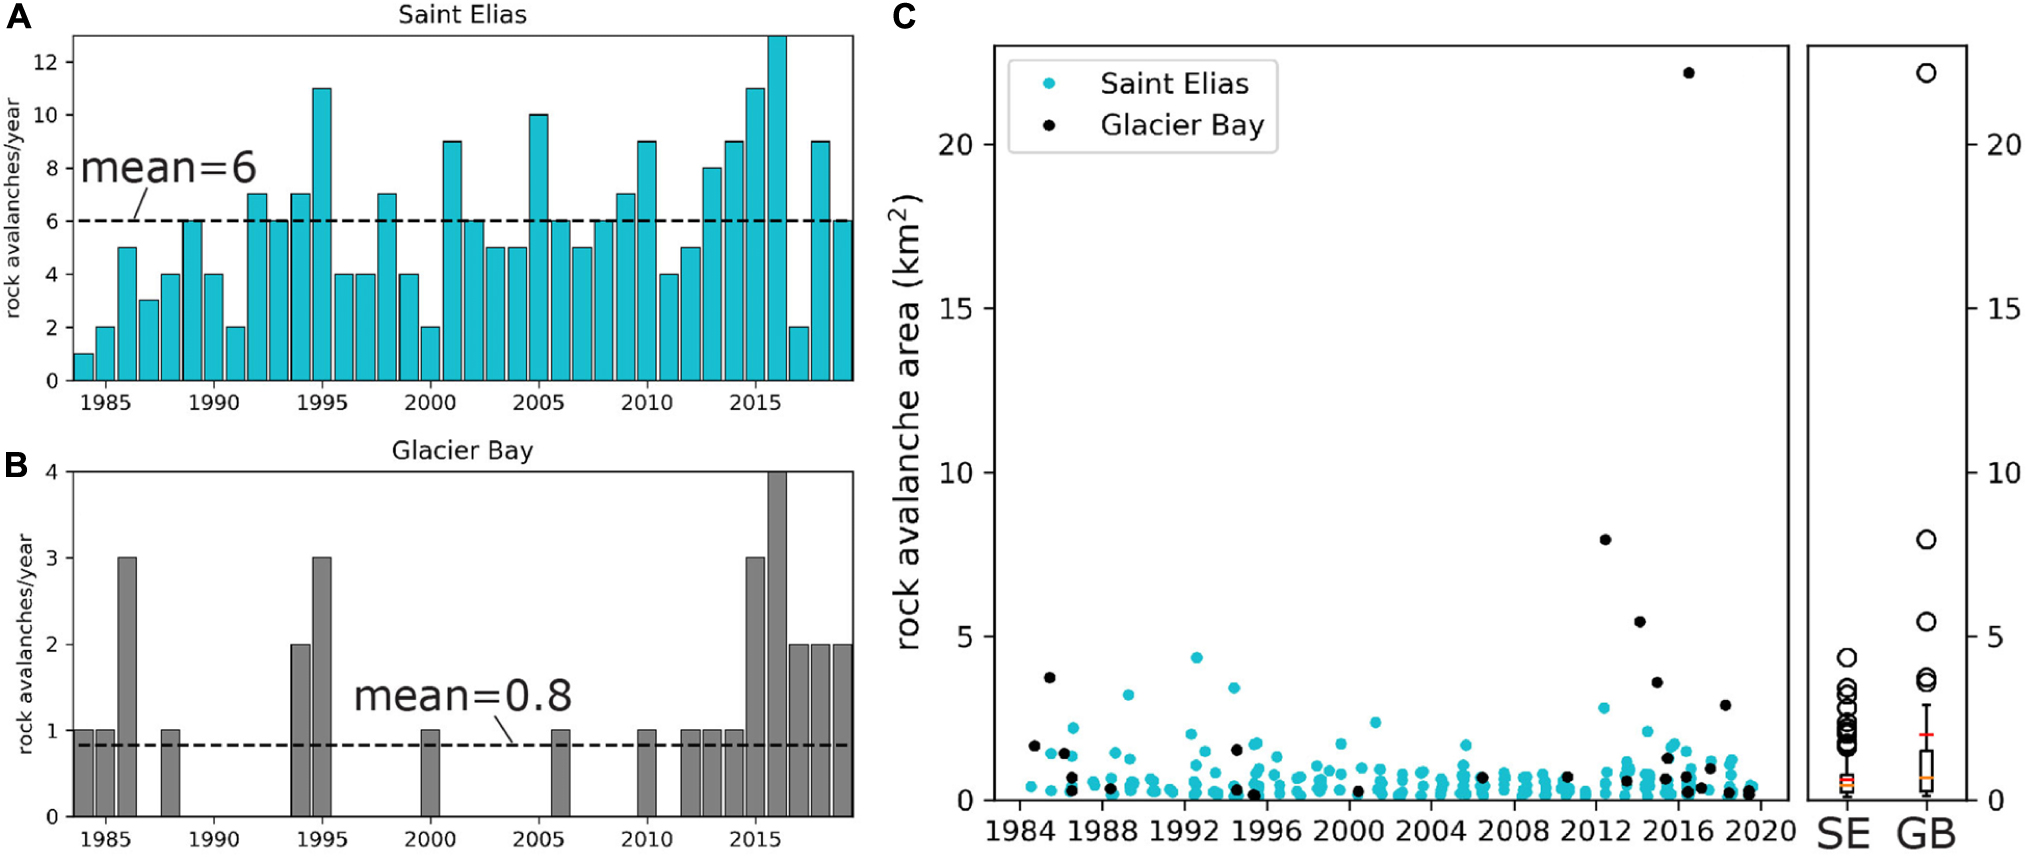
Figure 13. Histograms showing the distribution of rock avalanches per year in the (A) Saint Elias (SE) and (B) Glacier Bay National Park and Preserve (GB) study areas. Data for GB are from Bessette-Kirton and Coe (2016) and Supplementary Table S5. (C) Comparison of rock avalanche areas for 214 and 30 rock avalanches in the SE and GB study areas, respectively, between 1984 and 2019. Rock avalanche data for the Saint Elias study area do not include possible earthquake-triggered events (three) and each two-part failure is only counted once.
We suspect that the large difference in the frequency of rock avalanches between the St. Elias and GBNPP study areas is due to differences in tectonic settings and rock types. The St. Elias area is undergoing rapid uplift due to compression from the collision of the Yakutat micro-tectonic plate and the North American tectonic plate. The GBNPP area is undergoing rapid uplift from viscoelastic rebound from post-Little Ice Age deglaciation, but lacks comparable active compression because it is located adjacent to a transform plate boundary between the Pacific and North American plates. In the St. Elias area, the presence of flysch (flysch of the Yakutat Group, Kyf), a weak rock type which is known to be highly susceptible to rock-slope failures in many parts of the world (e.g., Duman et al., 2005; Margielewski, 2006), likely contributed to the relatively high occurrence of rock avalanches. A comparable geologic unit is not present in GBNPP.
Although we observed differences in the total number and magnitude of events in the neighboring GBNPP study area, the timing and frequency changes observed in both study areas share important similarities. In both the GBNPP and St. Elias areas, a large departure from the average number of rock avalanches occurred between 2013 and 2016, a period during which regional temperatures were above average (Figures 11A, 12B–D). During this period, the annual number of rock avalanches was, on average, 1.5 and 4 rock avalanches above the overall yearly average for St. Elias and GBNPP, respectively (Figure 13A). A smaller positive departure from average (0.5–3 rock avalanches) also occurred in both study areas between 1994 and 1996, which correlates to increased winter temperatures in the GBNPP study area (Coe et al., 2018), but no strong positive or negative temperature change at the Yakutat weather station (Figures 11A, 12B–D). The rate of rock avalanches per year increased during the period of record for both study areas, with increases of 1.2 and 0.3 rock avalanches per year in St. Elias and GBNPP, respectively.
A comparison of rock avalanche frequencies between the St. Elias study area and mountainous regions in the European Alps, New Zealand Alps, and Canada (McSaveney, 2002; and Table 1 of Hungr and Evans, 2004) suggests that the frequency of rock avalanches in the St. Elias area is exceptional. For events larger than 1 km2, the St. Elias study area had a rock avalanche frequency of 2.3 events/year/10,000 km2 (30 events >1 km2). This rate is >45 times higher than the rate of rock avalanches >1 Mm3 in New Zealand (0.03–0.05 events/year, McSaveney, 2002) and >1000 times higher than the frequencies (0.0002 to 0.0019 events/year/10,000 km2) reported by Hungr and Evans (2004) for rock avalanches >20 Mm3 or >1 km2. Additionally, the St. Elias rate is 4 times greater than the frequency of rock avalanches greater than 1 km2 in GBNPP (Coe et al., 2018 and Supplementary Table S5). Comparisons with rock avalanche frequencies in additional areas should be made as more systematically derived inventories become available.
Many of the rock avalanches that have been mapped and documented in southern Alaska have been triggered by earthquakes (Tarr and Martin, 1912; Miller, 1960; Post, 1967; Jibson et al., 2006, 2020; Delaney and Evans, 2014). In contrast, several large rock avalanches in Alaska during the last 15 years have attracted attention because they may have been conditioned by warming temperatures (Huggel et al., 2008, 2010). Additionally, in GBNPP non-coseismic rock avalanches (30 total; Bessette-Kirton and Coe, 2016; Coe et al., 2018, Supplementary Table S5) dominated the record of rock-slope failures during a period of relative earthquake quiescence between 1984 and 2019. This recent work suggests that a comparison between the number of rock avalanches triggered by earthquakes and those triggered by other sources would improve the understanding of the relative contribution of each type.
Since 1964, there have been three, large (>M 7.1) earthquakes that triggered widespread, well-documented landslides in southern Alaska: (1) the 1964 M 9.2 Anchorage earthquake (Hansen et al., 1966; Post, 1967); (2) the 2002 M 7.9 Denali earthquake (Eberhart-Phillips et al., 2003; Jibson et al., 2006); and (3) the 2018 M 7.1 Anchorage earthquake (Jibson et al., 2020). Nearly all of the landslides triggered in 2018 occurred at low altitudes and were not located in cryospheric terrain (Jibson et al., 2020). The 1964 and 2002 earthquakes triggered many rock avalanches in mountainous terrain similar to our study area (e.g., Post, 1967; Jibson et al., 2006; Schulz, in press). Two additional earthquakes in the late 20th century, one in 1958 and one in 1979, caused a few isolated, but notable landslides. The 1958 M 7.8 earthquake triggered a rock avalanche that entered Lituya Bay in GBNPP and caused a tsunami with a runup of 524 m (Miller, 1960). The 1979 M 7.2 St. Elias earthquake (Lahr et al., 1979) triggered three large (∼3–5 km2) rock avalanches in the St. Elias study area (Delaney and Evans, 2014; Evans and Delaney, 2014). Although the epicenter of the 1979 St. Elias earthquake was located amidst the precipitous terrain of the St. Elias mountains (∼40 km from our study area) widespread rock avalanches were not triggered by the event (Lahr et al., 1979). However, since the earthquake occurred during the winter, the presence of ice-filled discontinuities could have resulted in increased cohesion of otherwise susceptible slopes (Gruber and Haeberli, 2007) or snowfall could have rapidly covered deposits, making them difficult to detect (e.g., Dunning et al., 2015).
At least 78 rock avalanches were triggered by the 1964 earthquake [Table 2 of Post (1967)], and approximately 1580 events were triggered by the 2002 earthquake (Schulz, in press). Summing these numbers in addition to the three 1979 St. Elias rock avalanches (we omitted the 1958 Lituya Bay rock avalanche since an inventory was not conducted for the earthquake), yields a crude minimum estimate of 1661 rock avalanches triggered by earthquakes in southern Alaska since 1964, or a mean of about 27 per year (1661/55 years) in an area with a size of 140,000 ± 30,000 km2. The combined area of the St. Elias (3700 km2) and GBNPP (5000 km2) study areas is about 8700 km2. The total number of non-coseismic rock avalanches in both areas between 1984 and 2019 is 244. Although we don’t have systematic records of rock avalanches prior to 1984 in either of the study areas, we can compare with coseismic rock avalanches during the period from 1964 to 2019 by assuming 244 as a minimum number of non-coseismic events. Thus, the minimum rate of non-coseismic rock avalanches for the St. Elias and GBNPP study areas was about 4 events per year (244/55 years). Normalizing the two means by area (27/year/140,000 ± 30,000 km2 and 4/year/8,700 km2) yields values of 0.0002 ± 0.00005/year/km2 for earthquake-triggered rock avalanches, and 0.0005/year/km2 for non-coseismic rock avalanches. These estimates suggest that, in cryospheric mountainous terrain since 1964, the area-normalized rate of non-coseismic rock avalanches was, at a minimum, about 2x greater than that of earthquake-triggered rock avalanches.
We acknowledge that a longer period of time may be needed to better characterize the frequency of rock avalanches triggered by earthquakes. Additionally, intense shaking from earthquakes can destabilize slopes, or cause marginally stable slopes to fail, and thus alter the frequency of subsequent non-coseismic rock avalanches (e.g., Shafique, 2020). The opposite effect would also be true, that is, future earthquakes could be more impactful because intense shaking could have a greater effect on slopes that are increasingly susceptible to failure as a result of glacial retreat or permafrost degradation; a phenomenon that has been demonstrated for the combination of earthquake shaking and increased precipitation in soil landslides (Bontemps et al., 2020). Overall, the relative number of rock avalanches is likely to increase in the future as a result of warming temperatures in mountain cryosphere environments (e.g., Huggel et al., 2010; McColl, 2012; Deline et al., 2015a; Coe et al., 2018). The distinct, overlapping temporal clusters of rock avalanche activity in the St. Elias (2013–2016) and GBNPP (2012–2016) study areas encompassed a 3-year period (2014–2016) of record-breaking warmth in Alaska (e.g., NOAA, 2017; Walsh et al., 2017), and demonstrate that this phenomenon has already begun to occur.
Supraglacial rock avalanches contribute to large-scale sediment fluxes of glaciated basins and can affect the movement and composition of the glaciers upon which they are deposited. The presence of rock avalanche debris (with a thickness of at least 10 cm) on glaciers insulates underlying surfaces and can reduce ice ablation by between 25 and 100% (Jiskoot, 2011; Reznichenko et al., 2011; Bessette-Kirton et al., 2018). Conversely, the presence of a dust layer or very thin deposits (<2 cm), can increase the rate of ice ablation (Jiskoot, 2011). Rock avalanche deposits can also cause changes in glacier velocities (e.g., McSaveney, 1975; Shugar et al., 2012) and glacial surges have been observed following rock avalanche emplacement (Tarr and Martin, 1912; Deline, 2009). The interactions between rock avalanche debris and glacier dynamics depend in part on the location of deposition with respect to the accumulation and ablation zones of the glacier (Hewitt et al., 2011). Rock avalanches that are deposited in the accumulation zone may be covered by snow and substantially reworked before appearing in the ablation zone (Uhlmann et al., 2013; Dunning et al., 2015), while rock avalanches that are deposited directly on, or travel far enough to reach the ablation zone, more commonly remain visible on the glacier surface for multiple years (Uhlmann et al., 2013).
In the St. Elias study area, all of the rock avalanches in our inventory, with the exception of the Taan Fiord landslide, were emplaced entirely on ice and did not travel beyond glacial margins. Most rock avalanches were deposited on glacier accumulation zones and were subsumed within a year or less. A few large rock avalanches (e.g., Figure 7) were deposited in ablation zones and could be traced moving down glacier for several to tens of years. The recognition of a large number of rock avalanches that were deposited predominantly in glacier accumulation zones and were rapidly covered by snow and reworked by glaciers, contrasts to many past studies which were able to trace rock avalanche deposits for years to decades after occurrence (Jiskoot, 2011; Shugar et al., 2012; Uhlmann et al., 2013; Dufresne et al., 2019). This finding highlights the possibility that numerous rock avalanches in glaciated areas may go undetected without systematic examination of repeat satellite imagery. Furthermore, there may be additional, largely unquantified contributions to glacier sediment flux from the incorporation of rock avalanche deposits in glacier accumulation zones, that cannot be traced at the surface, but which influence glacier movement and composition (Deline, 2009; Dunning et al., 2015).
While it is not possible to directly quantify the sediment flux of rock avalanches that disappeared in accumulation zones and may have reappeared at a later time in glacier ablation zones, we can estimate rock slope erosion rates based on the magnitude and frequency of mapped landslides and an estimated deposit area and thickness. In accordance with similar calculations made for rock avalanches deposited on glaciers in the Chugach Mountains of southeast Alaska (Uhlmann et al., 2013), we used an estimated deposit thickness of 2–3 m for rock avalanches in the St. Elias study area. Additionally, since our inventory mapping quantifies total (source and deposit) rock avalanche areas, we estimated rock avalanche deposit areas as 80% of total rock avalanche areas. For a conservative estimate, we calculated average annual erosion rates using the entire 3700 km2 study area instead of using only the area of landslide-prone slopes, as was done by Uhlmann et al. (2013). The average rock erosion rate in the St. Elias study area ranged from 0.7 to 1.0 mm/year, which was, on average ∼20% higher than similarly calculated rates of 0.5–0.8 mm/year for GBNPP (rock avalanche data from Coe et al., 2018 and Supplementary Table S5) and reported rates of 0.5–0.7 mm/year (Arsenault and Meigs, 2005; Uhlmann et al., 2013) for the Chugach Mountains.
Sediment yields from tidewater glaciers in southern Alaska are among some of the highest worldwide (Koppes and Hallet, 2006). Basin-wide sediment yields for the Seward Malaspina glacier system ranged between 5 and 10 mm/year (Jaeger et al., 1998; Sheaf et al., 2003), with localized erosion rates of up to 20 mm/year in high flow velocity areas of Seward Glacier (Headley et al., 2012). At Tyndall Glacier at the head of Taan Fiord, basin-wide erosion rates between 1961 and 2014 were estimated at 26 ± 5 mm/yr, (Williams and Koppes, 2019). Rock slope erosion rates due to rock avalanches in the St. Elias study area are about an order of magnitude lower than estimated rates of total sediment production (glacial erosion plus rock avalanche debris), a finding that is similar to that from the Chugach Mountains (Uhlmann et al., 2013). Nonetheless, the sediment yield from rock avalanche debris is not insignificant and could account for up to 20% of basin-wide sediment flux. Furthermore, the role of incorporated rock avalanche debris is important for an overall understanding of glacier dynamics and mass balance (e.g., Deline, 2009; Reznichenko et al., 2011; Dunning et al., 2015; Tielidze et al., 2020), which are important considerations for the response of glaciers to climate changes (Larsen et al., 2007; Burgess et al., 2013) and the role of meltwater in sea level rise, particularly in places like the Gulf of Alaska (Berthier et al., 2010).
Rapid deglaciation and isostatic rebound following the Little Ice Age (Muskett et al., 2003; Larsen et al., 2004; Hewitt et al., 2011), in addition to rapid tectonic uplift, exhumation, and glacial erosion (Elliott et al., 2010; Pavlis et al., 2012) have predisposed many of the steep slopes composed of weak lithologic materials in the St. Elias Mountains to failure. The Taan Fiord landslide has been attributed to debutressing due to rapid ice loss at the outlet of the Tyndall Glacier (Higman et al., 2018). While this mechanism may be prevalent in coastal areas that are presently devoid of ice (Meigs and Sauber, 2000; Koppes and Hallet, 2006), our inventory highlights the ubiquity of rock-slope failures on inland, glaciated slopes. Only 2 of 220 landslides in our inventory (RA 161 and RA 188) occurred in ice-free areas along the coast, prompting further evaluation of the processes that condition landslides from higher-elevation glaciated slopes throughout the remainder of the study area.
Glacial thinning within the study area has been predominantly observed at low elevations in glacier ablation zones (Arendt et al., 2002; Muskett et al., 2003). In addition, the high surface velocities (up to 5 m/day) measured on glaciers within the St. Elias study area (Headley et al., 2012; Burgess et al., 2013; Waechter et al., 2015) have been partially attributed to large accumulation rates from the high elevation basins that feed glaciers (Burgess et al., 2013). Thus, the fact that the majority of the rock avalanches in our inventory initiated from bedrock ridges in probable permafrost zones (Figure 5B) and traveled onto glacial accumulation zones, suggests that ice loss due to permafrost degradation, as opposed to glacial thinning, could be a dominant factor contributing to rock-slope failures in the high elevation areas of the St. Elias Mountains. Previous work on permafrost degradation and its influence on rock-slope stability indicates that the advection of heat via the movement of water in fractures can promote the thawing of ice, which leads to an increase in effective stress, a reduction in rock-mass strength, and the destabilization of rock masses (e.g., Gruber and Haeberli, 2007; Noetzli and Gruber, 2009; Fischer et al., 2010; Hasler et al., 2011). We acknowledge that our results could be biased by a possible lack of detection of rock avalanches in areas where glacier thinning and retreat were taking place (because they were less likely to have traveled over ice at, and downslope from, glacier termini). However, even if this were the case, the large number of rock avalanches that initiated from bedrock ridges in glacier accumulation areas suggests that the likely influence of permafrost degradation cannot be ignored.
Additional clues to processes controlling rock avalanche occurrence in southern Alaska can be found in the similarities between results from the St. Elias and GBNPP study areas. The primary similarity is that both sites had temporal clusters of exceptional rock avalanche activity during multi-year periods of above normal temperatures (2013–2016), with much of the temperature anomaly associated with the prevalence of above normal winter temperatures. These data suggest that warmer than normal winter temperatures are an antecedent condition needed to promote the initiation of exceptional rock avalanche activity later in the spring and summer. These antecedent conditions likely weaken rock masses and make them more susceptible to failure when air temperatures exceed freezing. A notable difference between rock avalanches in the St. Elias and GBNPP study areas during the period between 1984 and 2019 is the prevalence of spatial rock avalanche clusters in the St. Elias area. Disparities in lithology and tectonic setting, as previously discussed, likely contribute to the difference in overall rock avalanche activity in addition to the commonality of repeated failures in the St. Elias area. However, field work, localized climate data, and in situ monitoring, would help gain a better understanding of spatial clusters and the conditioning processes influencing rock avalanches in the St. Elias Mountains.
We mapped and analyzed 220 rock avalanches that occurred from 1984 through 2019 in a 3700 km2 area of the tectonically active St. Elias Mountains of southern Alaska. During the 36-year period of record, the frequency of large rock avalanches (>1 km2) in the study area was 2.3 rock avalanches/year/10,000 km2, which is more than 1000 times larger than rates for similarly sized (>1 km2) rock avalanches documented by Hungr and Evans (2004) in Europe, New Zealand, and Canada. We observed a distinct temporal cluster of 41 rock avalanches from 2013 through 2016. This temporal cluster occurred during a period of above average air temperatures (including the three warmest years on record in Alaska, 2014–2016), and corresponds to a temporal cluster of rock avalanches during a similar period (2012–2016) in an area of Glacier Bay National Park and Preserve (about 220 km to the southeast). The majority of rock avalanches in the St. Elias inventory occurred from high-elevation inland terrain, highlighting permafrost degradation as opposed to glacial thinning as a dominant driving factor for the majority of failures in this area. Our work suggests that the area-normalized rate of non-coseismic rock avalanches was at least 2× greater than that of earthquake-triggered rock avalanches in southern Alaska from 1964 to 2019. Additionally, all available evidence indicates that frequencies of non-coseismic rock avalanches will continue to increase as climates continue to warm in the future. While the St. Elias study area is remote, events such as the Taan Fiord landslide and tsunami underscore the importance of understanding the processes that control changes in landslide frequency and magnitude in cryospheric mountainous terrain.
All datasets presented in this study are included in the article/Supplementary Material and in Bessette-Kirton et al. (2020).
EB-K conducted the inventory data collection and analysis. JC consulted on inventory collection and analysis. EB-K and JC contributed equally to the manuscript preparation. All authors contributed to the article and approved the submitted version.
The authors declare that the research was conducted in the absence of any commercial or financial relationships that could be construed as a potential conflict of interest.
We thank Michael Loso and two Frontiers in Earth Science reviewers for their insightful and constructive reviews that helped improve our manuscript. Janet Slate provided helpful editorial improvements. Ian Kellogg, Chloe Roth, Shyanne Wilson, Luke Jeter, and Caleb Smith from Colorado School of Mines helped with preliminary data collection that was advantageous to the development of the project. We also thank Kate Allstadt for seismic data analyses that confirmed the date of RA 204. Any use of trade, firm, or product names is for descriptive purposes only and does not imply endorsement by the United States Government.
The Supplementary Material for this article can be found online at: https://www.frontiersin.org/articles/10.3389/feart.2020.00293/full#supplementary-material
Arendt, A. A., Echelmeyer, K. A., Harrison, W. D., Lingle, C. S., and Valentine, V. B. (2002). Rapid wastage of Alaska glaciers and their contribution to rising sea level. Science 297, 382–386. doi: 10.1126/science.1072497
Arsenault, A. M., and Meigs, A. J. (2005). Contribution of deep-seated bedrock landslides to erosion of a glaciated basin in southern Alaska. Earth Surf. Proc. Land. 30, 1111–1125. doi: 10.1002/esp.1265
Beniston, M. (2003). Climatic change in mountain regions. A review of possible impacts. Clim. Chang. 59, 5–31. doi: 10.1007/978-94-015-1252-7_2
Berthier, E., Schiefer, E., Clarke, G. K. C., Menounos, B., and Rémy, F. (2010). Contribution of Alaskan glaciers to sea-level rise derived from satellite imagery. Nat. Geosci. 3:92. doi: 10.1038/NGEO737
Bessette-Kirton, E., Allstadt, K., Godt, J., and Pursley, J. (2017). Preliminary Analysis of Satellite Imagery and Seismic Observations of the Nuugaatsiaq Landslide and Tsunami, Greenland. Available online at: https://www.usgs.gov/natural-hazards/landslide-hazards/science/preliminary-analysis-satellite-imagery-and-seismic?qt-science_center_objects = 0#qt-science_center_objects (accessed April 29, 2020).
Bessette-Kirton, E. K., and Coe, J. A. (2016). Inventory of Rock Avalanches In Western Glacier Bay National Park And Preserve, Alaska, 1984-2016: A Baseline Data Set For Evaluating The Impact Of Climate Change On Avalanche Magnitude, Mobility, and Frequency. Reston, VA: U.S. Geological Survey.
Bessette-Kirton, E. K., Coe, J. A., and Kellogg, I. N. (2020). Inventory Data Of Rock Avalanches In The Saint Elias Mountains Of Southeast Alaska, Derived From Landsat Imagery (1984-2019). Reston, VA: U.S. Geological Survey.
Bessette-Kirton, E. K., Coe, J. A., and Zhou, W. (2018). Using stereo satellite imagery to account for ablation, entrainment, and compaction in volume calculations for rock avalanches on glaciers: application to the 2016 Lamplugh rock avalanche in Glacier Bay National Park, Alaska. J. Geophys. Res. Earth Surf. 123, 622–641. doi: 10.1002/2017JF004512
Bontemps, N., Lacroix, P., Larose, E., Jara, J., and Taipe, E. (2020). Rain and small earthquakes maintain a slow-moving landslide in a persistent critical state. Nat. Commun. 11, 1–10. doi: 10.1038/s41467-020-14445-3
Bruhn, R. L., Pavlis, T. L., Plafker, G., and Serpa, L. (2004). Deformation during terrane accretion in the Saint Elias Orogen, Alaska. Geol. Soc. Am. Bull. 116, 771–787. doi: 10.1130/B25182.1
Burgess, E. W., Forster, R. R., and Larsen, C. F. (2013). Flow velocities of Alaskan glaciers. Nat. Commun. 4:2146. doi: 10.1038/ncomms3146
Coe, J. A., Bessette-Kirton, E. K., and Geertsema, M. (2018). Increasing rock-avalanche size and mobility in Glacier Bay National Park and Preserve, Alaska detected from 1984-2016 Landsat imagery. Landslides 15, 393–407. doi: 10.1007/s10346-017-0879-7
Delaney, K. B., and Evans, S. G. (2014). The 1997 mount munday landslide (British Columbia) and the behaviour of rock avalanches on glacier surfaces. Landslides 11, 1019–1036. doi: 10.1007/s10346-013-0456-7
Deline, P. (2009). Interactions between rock avalanches and glaciers in the Mont Blanc massif during the late Holocene. Quat. Sci. Rev. 28, 1070–1083. doi: 10.1016/j.quascirev.2008.09.025
Deline, P., Gruber, S., Delaloye, R., Fischer, L., Geertsema, M., Giardino, M., et al. (2015a). “Chapter 15, ice loss and slope stability in high-mountain regions,” in Snow and Ice-Related Hazards, Risks, And Disasters, eds W. Haeberli, C. Whiteman, and J. F. Shroder ((Amsterdam: Elsevier), 521–561. doi: 10.1016/B978-0-12-394849-6.00015-9
Deline, P., Hewitt, K., Reznichenko, N., and Shugar, D. (2015b). “Rock avalanches onto glaciers,” in Landslide Hazards, Risks, And Disasters, eds T. Davies and J. F. Shroder (Amsterdam: Elsevier), 263–270. doi: 10.1016/B978-0-12-396452-6.00009-4
Dufresne, A., Geertsema, M., Shugar, D. H., Koppes, M., Higman, B., Haeussler, P. J., et al. (2018). Sedimentology and geomorphology of a large tsunamigenic landslide, Taan Fiord, Alaska. Sediment. Geol. 364, 302–318. doi: 10.1016/j.sedgeo.2017.10.004
Dufresne, A., Wolken, G. J., Hibert, C., Bessette-Kirton, E. K., Coe, J. A., Geertsema, M., et al. (2019). The 2016 lamplugh rock avalanche, alaska: deposit structures and emplacement dynamics. Landslides 16, 2301–2319. doi: 10.1007/s10346-019-01225-4
Duhart, P., Sepúlveda, V., Garrido, N., Mella, M., Quiroz, D., Fernández, J., et al. (2019). “The Santa lucia landslide disaster, Chaitén-Chile: origin and effects,” in Debris-Flow Hazards Mitigation: Mechanics, Monitoring, Modeling, and Assessment, Proceedings of the 7th International Conference on Debris Flow Hazards Mitigation, eds J. W. Kean, J. A. Coe, P. M. Santi, and B. K. Guillen (Golden, CO: Association of Environmental & Engineering Geologists Special Publication), 653–660. doi: 10.25676/11124/173159
Duman, T. Y., Çan, T., Emre, Ö, Keçer, M., Doðan, A., and Ateş, Ş, et al. (2005). Landslide inventory of northwestern Anatolia, Turkey. Eng. Geol. 77, 99–114. doi: 10.1016/j.enggeo.2004.08.005
Dunning, S. A., Rosser, N. J., McColl, S. T., and Reznichenko, N. V. (2015). Rapid sequestration of rock avalanche deposits within glaciers. Nat. Commun. 6:7964. doi: 10.1038/ncomms8964
Eberhart-Phillips, D., Haeussler, P. J., Freymueller, J. T., Frankel, A. D., Rubin, C. M., Craw, P., et al. (2003). The 2002 Denali fault earthquake, Alaska: a large magnitude, slip-partitioned event. Science 300, 1113–1118. doi: 10.1126/science.1082703
Elliott, J., Freymueller, J. T., and Larsen, C. F. (2013). Active tectonics of the St. Elias orogen, Alaska, observed with GPS measurements. J. Geophys. Res. Solid Earth 118, 5625–5642. doi: 10.1002/jgrb.50341
Elliott, J. L., Larsen, C. F., Freymueller, J. T., and Motyka, R. J. (2010). Tectonic block motion and glacial isostatic adjustment in southeast Alaska and adjacent Canada constrained by GPS measurements. J. Geophys. Res. 115:B09407. doi: 10.1029/2009JB007139
Evans, S. G., Bishop, N. F., Smoll, L. F., Murillo, R. V., Delancy, K. B., and Oliver-Smith, A. (2009). A re-examination of the mechanism and human impact of catastrophic mass flows originating in Nevada Huascarán, Cordillera Blanca, Peru in 1092 and 1970. Eng. Geol. 108, 96–118. doi: 10.1016/j.enggeo.2009.06.020
Evans, S. G., and Clague, J. J. (1999). “Rock avalanches on glaciers in the Coast and St. Elias Mountains, British Columbia,” in Proceedings of the 13th Annual Vancouver Geotechnical Society Symposium, Vancouver.
Evans, S. G., and Delaney, K. B. (2014). “Catastrophic mass flows in the mountain glacial environment,” in Snow and Ice-Related Hazards, Risks, And Disasters, eds W. Haeberli, C. Whiteman, and J. F. Shroder (Amsterdam: Elsevier), 563–606. doi: 10.1016/b978-0-12-394849-6.00016-0
Fischer, L., Amann, F., Moore, J., and Huggel, C. (2010). Assessment of periglacial slope stability for the 1988 Tschierva rock avalanche (Piz Morteratsch, Switzerland). Eng. Geol. 116, 32–43. doi: 10.1016/j.enggeo.2010.07.005
Fischer, L., Kääb, A., Huggel, C., and Noetzli, J. (2006). Geology, glacier retreat and permafrost degradation as controlling factors of slope instabilities in a high-mountain rock wall: the Monte Rosa east face. Nat. Hazard Earth Syst. 6, 761–772. doi: 10.5194/nhess-6-761-2006
Fischer, L., Purves, R. S., Huggel, C., Noetzli, J., and Haeberli, W. (2012). On the influence of topographic, geological and cryospheric factors on rock avalanches and rockfalls in high-mountain areas. Nat. Hazards Earth Syst. Sci. 12, 241–254. doi: 10.5194/nhess-12-241-2012
Geertsema, M. (2012). “Initial Observations of the 11 June 2012 Rock/Ice Avalanches, Lituya Mountain, Alaska,” in Conference: The First Meeting of ICL Cold Region Landslides Network, Harbin, China. doi: 10.13140/2.1.2473.5682
Grämiger, L. M., Moore, J. R., Gischig, V. S., and Loew, S. (2018). Thermomechanical stresses drive damage of Alpine valley rock walls during repeat glacial cycles. J. Geophys. Res. Earth Surf. 123, 2620–2646. doi: 10.1029/2018JF004626
Gruber, S. (2012a). Derivation and analysis of a high resolution estimate of global permafrost zonation. Cryosphere 6, 221–233. doi: 10.5194/tc-6-221-2012
Gruber, S. (2012b). Global Permafrost Zonation Index Map. Available online at: http://www.geo.uzh.ch/microsite/cryodata/pf_global/ (accessed April 29, 2020).
Gruber, S., and Haeberli, W. (2007). Permafrost in steep bedrock slopes and its temperature-related destabilization following climate change. J. Geophys. Res. 112:F02S18. doi: 10.1029/2006JF000547
Guthrie, R. H., Friele, P., Allstadt, K., Roberts, N., Evans, S. G., Delaney, K. B., et al. (2012). The 6 August 2010 Mount Meager rock slide-debris flow, Coast mountains, British Columbia: characteristics, dynamics, and implications for hazard and risk assessment. Nat. Hazard Earth Syst. 12, 1277–1294. doi: 10.5194/nhess-12-1277-2012
Haeberli, W., Schaub, Y., and Huggel, C. (2017). Increasing risks related to landslides from degrading permafrost into new lakes in de-glaciating mountain ranges. Geomorphology 293, 405–417. doi: 10.1016/j.geomorph.2016.02.009
Haeussler, P. J., Gulick, S. P. S., McCall, N., Walton, M., Reece, R., Larsen, C., et al. (2018). Submarine deposition of a subaerial landslide in Taan Fiord, Alaska. J. Geophys. Res. Earth Surf. 123, 2443–2463. doi: 10.1029/2018JF004608
Hansen, W. R., Eckel, E. B., Schaem, W. E., Lyle, R. E., George, W., and Chance, G. (1966). The Alaska Earthquake of March 27, 1964, Field investigations and reconstruction effort. U.S. Geol. Survey Prof. Pap. 541:111.
Hasler, A., Gruber, S., Font, M., and Dubois, A. (2011). Advective heat transport in frozen rock clefts—Conceptual model, laboratory experiments and numerical simulation. Permafr. Periglac. Process. 22, 387–398. doi: 10.1002/ppp.737
Headley, R., Hallet, B., Roe, G., Waddington, E. D., and Rignot, E. (2012). Spatial distribution of glacial erosion rates in the St. Elias range, Alaska, inferred from a realistic model of glacier dynamics. J. Geophys. Res. 117:F03027. doi: 10.1029/2011JF002291
Hewitt, K., Clague, J. J., and Deline, P. (2011). “Catastrophic rock slope failures and mountain glaciers,” in Encyclopedia of Snow, Ice and Glaciers, Encyclopedia of Earth Sciences Series, eds V. P. Singh, P. Singh, and U. K. Haritashya (Dordrecht: Springer), doi: 10.1007/978-90-481-2642-2_615
Hibert, C., Michéa, D., Provost, F., Malet, J.-P., and Geertsema, M. (2019). Exploration of continuous seismic recordings with a machine learning approach to document 20?yr of landslide activity in Alaska. Geophys. J. Int. 219, 1138–1147. doi: 10.1093/gji/ggz354
Higman, B., Shugar, D. H., Stark, C. P., Ekström, G., Koppes, M. N., Lynett, P., et al. (2018). The 2015 landslide and tsunami in Taan Fiord, Alaska. Sci. Rep. 8:12993. doi: 10.1038/s41598-018-30475-w
Hock, R., Rasul, G., Adler, C., Cáceres, B., Gruber, S., Hirabayashi, Y., et al. (2019). “High mountain areas,” in IPCC Special Report on the Ocean and Cryosphere in a Changing Climate, eds H.-O. Pörtner, D. C. Roberts, V. Masson-Delmotte, P. Zhai, M. Tignor, E. Poloczanska, et al. (Geneva: IPCC).
Huggel, C., Caplan-Auerbach, J., Waythomas, C. F., and Wessels, R. L. (2007). Monitoring and modeling ice-rock avalanches from ice-capped volcanoes: a case study of frequent large avalanches on Iliamna Volcano, Alaska. J. Volcanol. Geoth. Res. 168, 114–136. doi: 10.1016/j.jvolgeores.2007.08.009
Huggel, C., Gruber, S., Caplan-Auerbach, J., Wessels, R. L., and Molnia, B. F. (2008). “The 2005 Mt. Steller, Alaska, rock-ice avalanche: a large slope failure in cold permafrost,” in Proceedings of the 9th International Conference on Permafrost, Fairbanks.
Huggel, C., Salzmann, N., Allen, S., Caplan-Auerbach, J., Fischer, L., Haeberli, W., et al. (2010). Recent and future warm extreme evens and high-mountain slope stability. Philos. Trans. R. Soc. 368, 2435–2459. doi: 10.1098/rsta.2010.0078
Huggel, C., Zgraggen-Oswald, S., Haeberli, W., Kääb, A., Polkvoj, A., Galushkin, I., et al. (2005). The 2002 rock/ice avalanche at Kolka/Karmadon, Russian Caucasus: assessment of extraordinary avalanche formation and mobility, and application of QuickBird satellite imagery. Nat. Hazard Earth Syst. 5, 173–187. doi: 10.5194/nhess-5-173-2005
Hungr, O., and Evans, S. G. (2004). The occurrence and classification of massive rock slope failure. Felsbau 22, 16–23.
Hungr, O., Leroueil, S., and Picarelli, L. (2014). The Varnes classification of landslide types, an update. Landslides 11, 167–194. doi: 10.1007/s10346-013-0436-y
Huss, M., and Hock, R. (2015). A new model for global glacier change and sea-level rise. Front. Earth Sci. 3:54. doi: 10.3389/feart.2015.00054
Hussain, M., and Mahmud, I. (2019). Pymannkendall: a python package for non parametric Mann Kendall family of trend tests. J. Open Source Softw. 4:1556. doi: 10.21105/joss.01556
Jacquemart, M., Loso, M., Leopold, M., Welty, E., Berthier, E., Hansen, J. S. S., et al. (2020). What drives large-scale glacier detachments? Insights from Flat Creek glacier, St. Elias Mountains, Alaska. Geology 48, 703–707. doi: 10.1130/G47211.1
Jaeger, J. M., Nittrouer, C. A., Scott, N. D., and Milliman, J. D. (1998). Sediment accumulation along a glacially impacted mountainous coastline: north-east Gulf of Alaska. Basin Res. 10, 155–173. doi: 10.1046/j.1365-2117.1998.00059.x
Jibson, R. W. (2013). “Mass-movement causes: earthquakes,” in Treatise on Geomorphology, v. 7, Mountain and Hillslope Geomorphology, eds J. Shroder, R. A. Marston, and M. Stoffel (San Diego: Academic Press), 223–229.
Jibson, R. W., Grant, A. R., Witter, R. C., Allstadt, K. E., Thompson, E. M., and Bender, A. M. (2020). Ground failure from the anchorage, Alaska, earthquake of 30 November 2018. Seismol. Res. Lett. 91, 19–32. doi: 10.1785/0220190187
Jibson, R. W., Harp, E. L., Schulz, W., and Keefer, W. K. (2006). Large rock avalanches triggered by the M 7.9 Denali Fault, Alaska, earthquake of 3 November 2002. Eng. Geol. 83, 144–160. doi: 10.1016/j.enggeo.2005.06.029
Jiskoot, H. (2011). Long-runout rockslide on glacier at Tsar Mountain, Canadian rocky mountains: potential triggers, seismic and glaciological implications. Earth Surf. Proc. Land. 36, 203–216. doi: 10.1002/esp.2037
Koehler, R. D., Burns, P. A. C., and Combellick, R. A. (2012). Quaternary Faults And Folds In Alaska: A Digital Database: Miscellaneous Publication MP 141. Fairbanks: Alaska Division of Geological & Geophysical Surveys.
Koppes, M., and Hallet, B. (2006). Erosion rates during rapid deglaciation in Icy Bay, Alaska. J. Geophys. Res. Earth Surf. 111, 1–11. doi: 10.1029/2005JF000349
Krautblatter, M., Funk, D., and Günzel, F. K. (2013). Why permafrost rocks become unstable: a rock-ice mechanical model in time and space. Earth Surf. Process. Land. 38, 876–887. doi: 10.1002/esp.3374
Lahr, J. C., Plafker, G., Stephens, C. D., Fogleman, K. A., and Blackford, M. E. (1979). Interim report on the St. Elias, Alaska Earthquake of 28 February 1979. Reston, VA: U.S. Geological Survey.
Larsen, C. F., Motyka, R. J., Arendt, A. A., Echelmeyer, K. A., and Geissler, P. E. (2007). Glacier changes in southeast Alaska and northwest British Columbia and contribution to sea level rise. J. Geophys. Res. Earth Surf. 112:F01007. doi: 10.1029/2006JF000586
Larsen, C. F., Motyka, R. J., Freymueller, J. T., Echelmeyer, K. A., and Ivins, E. R. (2004). Rapid uplift of southern Alaska caused by recent ice loss. Geophys. J. Int. 158, 1118–1133. doi: 10.1111/j.1365-246X.2004.02356.x
Lawrimore, J. (2017). Dataset Description Document, Global Summary of the Month/Year Dataset. Silver Spring, MD: National Oceanic and Atmospheric Administration.
Loso, M., Arendt, A., Larsen, C., Rich, J., and Murphy, N. (2014). Alaskan National Park Glaciers - Status And Trends. Final Report: natural Resource Technical Report NPS/AKRO/NRTR—2014/922. Fort Collins: U.S. National Park Service.
Margielewski, W. (2006). Structural control and types of movements of rock mass in anisotropic rocks: case studies in the polish Flysch Carpathians. Geomorphology 77, 47–68. doi: 10.1016/j.geomorph.2006.01.003
Markon, C., Gray, S., Berman, M., Eerkes-Medrano, L., Hennessy, T., Huntington, H., et al. (2018). “Alaska,” in Impacts, Risks, and Adaptation in the United States: Fourth National Climate Assessment, eds D. R. Reidmiller, C. W. Avery, D. R. Easterling, K. E. Kunkel, K. L. M. Lewis, T. K. Maycock, et al. (Washington, DC: U.S. Global Change Research Program), 1185–1241. doi: 10.7930/NCA4.2018.CH26
McColl, S. T. (2012). Paraglacial rock-slope stability. Geomorphology 153-154, 1–16. doi: 10.1016/j.geomorph.2012.02.015
McSaveney, M. J. (1975). Sherman Glacier Rock Avalanche Of 1964: Its Emplacement And Subsequent Effects On The Glacier Beneath It. Ph.D. thesis, The Ohio State University, Columbus, OH.
McSaveney, M. J. (1978). “Sherman glacier rock avalanche, Alaska, U.S.A,” in Rockslides and Avalanches, 1: Natural Phenomena, Developments in Geotechnical Engineering 14A, ed. B. Voight (Amsterdam: Elsevier), 197–258.
McSaveney, M. J. (2002). “Recent rockfalls and rock avalanches in Mount Cook National Park, New Zealand,” in Catastrophic landslides: Effects, Occurrence, And Mechanisms, Geological Society of America Reviews in Engineering Geology, eds S. G. Evans and J. V. DeGraff (Boulder: Geological Society of America), 35–70.
McSaveney, M. J., Cox, S. C., and Hancox, G. T. (2014). Seeking a Credible Cause Of The Recent Increase In Rock-Avalanche Frequency in New Zealand’s Southern Alps. San Francisco: American Geophysical Union.
McSaveney, M. J., Cox, S. C., and Hancox, G. T. (2015). Increasing rock-avalanche frequency correlates with increasing seismic moment release in New Zealand’s Southern Alps. Geophys. Res. Abstr. 17:EGU2015-8074.
Meigs, A., and Sauber, J. (2000). Southern Alaska as an example of long-term consequences of mountain building under the influence of glaciers. Quat. Sci. Rev. 19, 1543–1562.
Mergili, M., Mergili, M., Jaboyedoff, M., Pullarello, J., and Pudasaini, S. P. (2020). Back calculation of the 2017 Piz Cengalo-Bondo landslide cascade with r.avaflow: what we can do and what we can learn. Nat. Hazard Earth Sys. 20, 505–520. doi: 10.5194/nhess-20-505-2020
Muskett, R. R., Lingle, C. S., Tangborn, W. V., and Rabus, B. T. (2003). Multi-decadal elevation changes on Bagley Ice Valley and Malaspina Glacier, Alaska. Geophys. Res. 30, 1–4. doi: 10.1029/2003GL017707
Noetzli, J., and Gruber, S. (2009). Transient thermal effects in Alpine permafrost. Cryosphere 3, 85–99. doi: 10.5194/tc-3-85-2009
Patton, A. I., Rathburn, S. L., and Capps, D. M. (2019). Landslide response to climate change in permafrost regions. Geomorphology 340, 116–128. doi: 10.1016/j.geomorph.2019.04.029
Paul, F., Kääb, A., Maisch, M., Kellenberger, T., and Haeberli, W. (2004). Rapid disintegration of alpine glaciers observed with satellite data. Geophys. Res. 31:L21402.
Pavlis, T. L., Chapman, J. B., Bruhn, R. L., Ridgway, K., Worthington, L. L., Gulick, S. P. S., et al. (2012). Structure of the actively deforming fold-thrust best of the St. Elias orogen with implications for glacial exhumation and three-dimensional tectonic processes. Geosphere 8, 991–1019.
Petley, D. (2012). Another Teleseismic Landslide- This Time In Alaska On Monday 21st May 2012. Available online at: https://blogs.agu.org/landslideblog/2012/05/24/another-teleseismic-landslide-this-time-in-alaska/ (accessed April 29, 2020).
Post, A. (1967). Effects of the March 1964 Alaska earthquake on glaciers. U.S. Geological Survey Professional Paper 544-D. Reston, VA: U.S. Geological Survey.
Reid, M. (2017). Landslide Hazard And Climate Change In The Mountain Glacial Environment of Northwest North America, Masters thesis, University of Waterloo, Waterloo, ON.
Reznichenko, N. V., Davies, T. R., and Alexander, D. J. (2011). Effects of rock avalanches on glacier behaviour and moraine formation. Geomorphology 132, 327–338.
Richter, D. H., Preller, C. C., Labay, K. A., and Shew, N. B. (2005). Geology of Wrangell-Saint Elias National Park and Preserve, South Central Alaska: U.S. Geological Survey Scientific Investigations Series Map SIM-2877. Reston, VA: U.S. Geological Survey.
Schlögel, R., Torgoev, I., De Marneffe, C., and Havenith, H. (2011). Evidence of a changing size-frequency distribution of landslides in the Kygyz Tien Shan, central Asia. Earth Surf. Proc. Land. 36, 1658–1669. doi: 10.1002/esp.2184
Schneider, D., Huggel, C., Haeberli, W., and Kaitna, R. (2011). Unraveling driving factors for large rock-ice avalanche mobility. Earth Surf. Proc. Land. 36, 1948–1966. doi: 10.1002/esp.2218
Shafique, M. (2020). Spatial and temporal evolution of co-seismic landslides after the 2005 Kashmir earthquake. Geomorphology 362:107228. doi: 10.1016/j.geomorph.2020.107228
Sheaf, M., Serpa, L., and Pavlis, T. L. (2003). Exhumation rates in the St. Elias Mountains, Alaska. Tectonopysics 367, 1–11. doi: 10.1016/S0040-1951(03)00124-0
Shugar, D. H., Rabus, B. T., Clague, J. J., and Capps, D. M. (2012). The response of black rapids glacier, Alaska, to the Denali earthquake rock avalanches. J. Geophys. Res. 117:F01006.
Spotila, J. A., Buscher, J. T., Meigs, A. J., and Reiners, P. W. (2004). Long-term glacial erosion of active mountain belts: example of the Chugach-St. Elias Range, Alaska. Geology 32, 501–504. doi: 10.1130/G20343.1
Stover, C. W., Reagor, B. G., and Wetmiller, R. J. (1980). Intensities and isoseismal map for the St. Elias earthquake of February 28, 1979. B. Seismol. Soc. Am. 70, 1635–1649.
Tarr, R. S., and Martin, L. (1912). Earthquakes at Yakutat Bay, Alaska in September, 1899. U.S. Geol. Surv. Prof. Pap. 69:135.
Tielidze, L. G., Bolch, T., Wheate, R. D., Kutuzov, S. S., Lavrentiev, I. I., and Zemp, M. (2020). Supra-glacial debris cover changes in the Greater Caucasus from 1986 to 2014. Cryosphere 14, 585–598.
U.S. Geological Survey (2019). Libcomcat, Version 1.0. GitHub Repository. Reston, VA: U. S. Geological Survey.
U.S. Geological Survey (2020). ANSS Comprehensive Earthquake Catalog (ComCat) Documentation. Reston, VA: U. S. Geological Survey.
U.S. Geological Survey (2012). USGS NED Original Product Resolution (OPR) AK IFSAR. Available online at: http://ned.usgs.gov/ (accessed April 1, 2020).
Uhlmann, M., Korup, O., Huggel, C., Fischer, L., and Kargel, J. S. (2013). Supra-glacial deposition and flux of catastrophic rock-slope failure debris, south-central Alaska. Earth Surf. Proc. Land. 38, 675–682. doi: 10.1002/esp.3311
van Oldenborgh, G. J., Collins, M., Arblaster, J., Christensen, J. H., Marotzke, J., Power, S. B., et al. (2013). “Annex I: atlas of global and regional climate projections,” in Climate Change 2013: The Physical Science Basis. Contribution of Working Group I to the Fifth Assessment Report of the Intergovernmental Panel on Climate Change, eds T. F. Stocker, D. Qin, G.-K. Plattner, M. Tignor, S. K. Allen, J. Boschung, et al. (Cambridge: Cambridge University Press), 1311–1393.
Waechter, A., Copland, L., and Herdes, E. (2015). Modern glacier velocities across the Icefield Ranges, St Elias Mountains, and variability at selected glaciers from 1959 to 2012. J. Glaciol. 61:228. doi: 10.3189/2015JoG14J147
Walsh, J., Wuebbles, D., Hayhoe, K., Kossin, K., Kunkel, K., Stephens, G., et al. (2014). “Chapter 2: our changing climate,” in Climate Change Impacts in the United States: The Third National Climate Assessment, eds J. M. Melillo, T. C. Richmond, and G. W. Yohe (Washington, DC: U.S. Global Change Research Program), 19–67.
Walsh, J. E., Bieniek, P. A., Brettschneider, B., Euskirchen, E. S., Lader, R., and Thoman, R. L. (2017). The exceptionally warm winter of 2015/16 in Alaska. J. Clim. 30, 2069–2088. doi: 10.1175/JCLI-D-16-0473.1
Walter, F., Amann, F., Kos, A., Kenner, R., Phillips, M., de Preux, A., et al. (2020). Direct observations of a three million cubic meter rock-slope collapse with almost immediate initiation of ensuing debris flows. Geomorphology 351:106933. doi: 10.1016/j.geomorph.2019.106933
Williams, H. B., and Koppes, M. N. (2019). A comparison of glacial and paraglacial denudation responses to rapid glacial retreat. Ann. Glaciol. 60, 151–164. doi: 10.1017/aog.2020.1
Wilson, F. H., Hults, C. P., Mull, C. G., and Karl, S. M. (2015). Geologic map of Alaska. U.S. Geol. Surv. Sci. Invest. Map 3340:197.
Wilson, F. H., Labay, K. A., Shew, N. B., Preller, C. C., and Mohadjer, S. (2005). Digital data for the geology of Wrangell-Saint Elias National Park and Preserve, Alaska. U.S. Geological Survey Open-File Report 2005-1342. Reston, VA: U.S. Geological Survey.
Keywords: rock avalanche, Alaska, landslide inventory, landsat, saint elias mountains, frequency-magnitude
Citation: Bessette-Kirton EK and Coe JA (2020) A 36-Year Record of Rock Avalanches in the Saint Elias Mountains of Alaska, With Implications for Future Hazards. Front. Earth Sci. 8:293. doi: 10.3389/feart.2020.00293
Received: 30 April 2020; Accepted: 23 June 2020;
Published: 16 July 2020.
Edited by:
John Joseph Clague, Simon Fraser University, CanadaReviewed by:
Marten Geertsema, Ministry of Forests and Range, CanadaCopyright © 2020 Bessette-Kirton and Coe. This is an open-access article distributed under the terms of the Creative Commons Attribution License (CC BY). The use, distribution or reproduction in other forums is permitted, provided the original author(s) and the copyright owner(s) are credited and that the original publication in this journal is cited, in accordance with accepted academic practice. No use, distribution or reproduction is permitted which does not comply with these terms.
*Correspondence: Erin K. Bessette-Kirton, erin.bessette.kirton@utah.edu
Disclaimer: All claims expressed in this article are solely those of the authors and do not necessarily represent those of their affiliated organizations, or those of the publisher, the editors and the reviewers. Any product that may be evaluated in this article or claim that may be made by its manufacturer is not guaranteed or endorsed by the publisher.
Research integrity at Frontiers

Learn more about the work of our research integrity team to safeguard the quality of each article we publish.