 Marco Voltolini
 Jonathan B. Ajo-Franklin
- Lawrence Berkeley National Laboratory, Earth and Environmental Sciences Area, Energy Geosciences Division, Berkeley, CA, United States
The detailed mechanisms of the sealing of a single fracture, from hydration to almost complete closure by increase of confining pressure, as monitored from in situ synchrotron X-ray microtomography during the flow of carbonated water, is here shown for the first time. Different mechanisms play the key role at different stages in the evolution of the fracture. Hydration mechanically weakens the surfaces of the fracture and induces a first closure due to microcracking at the asperity contacts, increasing their size and creating choke points. Increase in confining stress promptly hydraulically seals the fracture by closing the main choke point, with a relative small deformation of the sample. Finally, the more pervasive mechanical deformation observed at higher stresses almost completely seals the whole fracture. The evolution of the sample has been described and quantified using 4D image processing, focusing on the evolution of aperture and digital volume correlation. Hydraulic properties of the sample at different stages have been modeled via Stokes flow simulation, and the results compared to the morphometric analysis, finding positive correlations with the average fracture aperture variation along the flowpath in function of confining pressure. Opalinus Clay is found to be a rock markedly prone to sealing in case of flow with carbonated water; this behavior is the result of the large fraction of clays and of its microstructure, lacking both cementing phases and large stiff particles. CO2 in this sample has no evident role in the evolution of the fracture; chemically induced weathering on the surface has not been detected, in contrast with the behavior observed in samples with carbonates as cementing phase.
Introduction
Caprocks are geological bodies with low both intrinsic and effective permeability, forming a seal preventing the migration of fluids. Understanding the behavior of caprocks under different conditions is important for a variety of fields including oil and gas extraction, radioactive waste repositories, and geological carbon sequestration (GCS).
There are different types of caprocks and sealing rocks fulfilling the above requirements, with variable mineralogical compositions and textures. Two main groups of seal rocks can be considered: (i) seals comprised primarily of evaporitic minerals, such as halite, anhydrite, gypsum; and (ii) clay-bearing rocks such as shales, mudstones, and clay-rich carbonates (marls). Given their frequent occurrence in a geologic context, clay-rich rocks are particularly relevant to the applications mentioned previously. Rocks such as shales are common caprocks for conventional oil and gas reservoirs, given the high capillary pressure required for hydrocarbon migration in a material with such small pore/throat sizes and surface properties (e.g., Al-Bazali et al., 2005). Shales are also the primary sealing unit at many GCS sites (e.g., the Eau Claire Formation above the Mt. Simon sandstone reservoir, see Neufelder et al., 2012). In a GCS context, since CO2-rich brines are potentially reactive, weathering of the caprock should also be considered when assessing long-term seal performance (e.g., Busch et al., 2009). The behavior of clay minerals with supercritical CO2 can potentially have an impact in the sealing properties in deep reservoirs for both reactive clays, such as smectites (Loring et al., 2013) as well as conventionally stable clay minerals, including illite/muscovite (Wan et al., 2018).
The basic requirement for caprock sealing capacity is to display a very low intrinsic matrix permeability, on the order of the nanodarcy (∼1e–14 cm2), but the effective permeability of such rocks can be drastically increased by the presence of fractures. Increasing the permeability of such tight rocks by means of induced fracturing (hydrofracturing) is also the basis of modern unconventional oil and gas production. Since the presence of fractures can be detrimental to the effectiveness of a sealing unit, caprock integrity studies are a fundamental step in assessing the safety of a storage site (e.g., Busch et al., 2010). The presence of pre-existing fracture networks, or the generation of new ones due to stress changes in the reservoir, does not necessarily prevent the use of shales as caprocks, since the evolution of the fractures in time could lead to re-sealing of such structures. Fractures in caprocks intended for GCS can display different evolutionary paths, ranging from self-enhancing (i.e., progressive spontaneous enhancement of fracture conductivity due e.g., to the generation and enlargement of preferential flowpaths) to self-sealing (i.e., progressive spontaneous decrease in conductivity due e.g., to swelling of the material in contact with the fluid) or self-healing (i.e., the closure of the fracture with a complete recovery of the original properties of the rock prior to fracturing) behavior. This kind of behavior is complex in nature, and depends on a series of coupled processes, usually referred as THMC (thermal-hydraulic-mechanical-chemical) e.g., in the field of natural and engineered barriers (Tsang, 1991). The evolution of such a system is extremely complex to predict, given the coupling between the different parameters; a simplified approach based only on the mineralogical composition is presented in Bourg (2015) where the self-sealing vs. self-enhancing behavior is inferred only by the clay fraction of the caprock, which provides a proxy for behavior of a clay-rich rock. This approach seems to provide a starting point for evaluation, but quantitative estimates about how the fracture evolves requires a more detailed analysis. In particular, self-enhancing behavior (on short time scales) observed in Deng et al. (2016) has also been observed in “shales” rich in cementing carbonates and clays with a partial contribution due to erosion after the formation of channeling features due to reaction with carbonates (Deng et al., 2017). Broadly, the increase in clay fraction decreases the reactivity with aqueous CO2, compared to carbonates, and the rock becomes mechanically weaker (ultimate tensile strength tends to decrease with the clay amount increase), thus facilitating the collapse of the contact areas in the fractures. In such conditions rapid self-sealing is generally observed [Figure 2 in Zhang (2011), Bourg and Ajo-Franklin (2017)]. Other sealing mechanisms can be present in caprocks: mineralization in fractures is a common behavior observed in the field, but rather difficult to replicate experimentally, since it often requires long paths along fractures to reach the saturation state needed to trigger crystallization, and often longer reaction times as well (Noiriel et al., 2010). Another important and frequently neglected process is pressure-solution (Yasuhara et al., 2004): in materials such as halite, pressure-solution is extremely fast and pervasive (Renard et al., 2004), but in carbonates, and more so in silicates, it is a slower process not easily observable in short laboratory experiments (Yasuhara and Elsworth, 2008); however, its contribution in the field can be important, given the long time scale considered. While clays, and phyllosilicates in general, have been found to facilitate pressure-solution (Renard et al., 1997), its role in shales is still not clear.
Most of previously cited fracture evolution studies utilize X-ray micro-computed tomography (XRμCT); over the last two decades, this experimental technique has proven to be an excellent tool for obtaining quantitative 3D information about the microstructure of geological materials (Cnudde and Boone, 2013). With steady improvements in both conventional and unconventional (synchrotron) X-ray sources, in situ time-resolved experiments are becoming more common and Earth scientists are taking advantage of such capabilities to probe the rapid evolution of geological systems at micron length scales (e.g., Voltolini et al., 2017a). In the field of subsurface studies, mini triaxial cells able to perform flow experiments at both high pressure and temperature have recently been developed, opening new opportunities for 4D X-ray imaging at P/T ranges not accessible until a few years ago (Renard et al., 2016; Voltolini et al., 2019).
In this study, we utilize in situ synchrotron XRμCT to monitor the evolution of a fractured Opalinus Clay sample at increasing differential pressure during flow with CO2-saturated water in the mini-triaxial cell described in Voltolini et al. (2017b). The choice of Opalinus Clay (OPA) was driven by two reasons: (i) it provides an excellent model for a clay-based seal rock, with a large clay fraction, and therefore theoretically prone to fast (self-) sealing; (ii) it is an extremely well characterized formation due to exposure within the Mont Terri Underground Rock Laboratory in Canton Jura, Switzerland (Bossart et al., 2018). The aim of this work is to observe and quantify the mechanisms involved in the sealing of a single fracture in OPA as a function of differential pressure, and their impact on the hydrological properties of the fracture.
Materials and Methods
The Opalinus Clay Sample
The OPA sample considered in this study was obtained from the Mont Terri URL. Opalinus Clay is shale (or claystone) of Toarcian-Aalenian age (upper Liassic- lower Dogger). The mineralogical composition of OPA, from the shaly facies used in our experiment, includes 40–70 wt.% clay minerals, 10–30 wt.% carbonates (mainly calcite, subordinate siderite, and ankerite), 10–30 wt.% quartz and accessory feldspars, pyrite, and organic matter. At smaller scale, inhomogeneities are largely layers enriched in silt or carbonate concretions, often including siderite. Calcite, the most abundant carbonate, is present in the form of isolated bioclasts (sometimes pyritized), and not in the form of cementing material. This has a strong impact on the mechanical as well as geochemical properties of the rock. The rock also displays a significant textural anisotropy, as quantified by X-ray diffraction for the crystalline part (Wenk et al., 2008) and by BIB-SEM for morphological analysis including pores (Houben et al., 2013, 2014).
The OPA core was obtained from the source wrapped in plastic wrap, aluminum foil, and sealed in a vacuum bag to preserve the original saturation. A section of the sample was sawn (slow speed cutting, with air cooling by use of a notched 1” diameter ultrathin blade) to obtain a manageable size piece. The block was fractured first, by compression between two blades, generating a single tensile fracture at ∼10 degrees relative to the average bedding plane; two half cylinders were then machined (dry) to obtain a 9 mm cylindrical core, 24 mm tall. To provide a small area of starting asperity contacts (and avoiding the perfect matching of the two halves), half of the sample was rotated by 180 degrees before re-assembly. This assembly was chosen to have a scenario where the fracture conductivity would be sustained longer than e.g., in a fracture with matching surfaces and to have more defined asperity contacts. A sustained conductivity would also allow for better observation of possible chemical reactions (e.g., dissolution of carbonates). Sample was prepared 2 days prior the experiment, and was kept in aluminum foil and in a sealed plastic bags to preserve the original saturation as much as possible.
The Synchrotron X-Ray Micro-Computed Tomography Experiment
When assembling the mini-triaxial cell, the sample was jacketed with heat-shrink polyvinylidene fluoride (PVDF) tubing, and fixed to the piston of the cell. The saturating fluid was deionized water saturated with CO2 at 40 psi (0.28 MPa) for ∼8 h. This fluid was chosen to try to generate geochemical weathering (i.e., dissolution of the carbonates fraction close to the fracture surface) induced by the reaction with CO2 during the flow. The cell and sample were pressurized by an array of three high-pressure syringe pumps (Teledyne-Isco 260D): the first pump was connected to both the water annulus and the vertical piston and worked in constant pressure mode, providing the confining stress conditions. The pressure of this pump was progressively increased to induce the closure of the fracture. The second pump was connected to the inlet of the cell, and contained the CO2 saturated water. This pump was operated in constant flow rate mode. The third pump was connected to the outlet of the sample and worked as a fluid back-pressure regulator. This configuration allowed to operat at constant flow (before sample hydraulic sealing, when the flow was stopped) and pore pressure, being the only controlled variable the confining pressure.
Between each step of confining pressure increase the system was allowed to flow for ∼3 h to circulate ∼10 ml of solution through the sample (constant flow at 0.05 ml/min). Flow was of course stopped after the hydraulic sealing of the fracture. A first scan was run before flowing the solution, as a baseline, then after 1 h of saturation the series of increased confining pressure measurement started. The flow through the sample was kept constant, both in flowrate and pore pressure, through the two pumps system. This status was not sustainable anymore when the fracture sealing occurred, therefore the flow pump was stopped at that point to avoid an increase in pore pressure that would have damaged the sample environment. The sealing of the fracture was highlighted by a sudden increase in pressure at the inlet pump, which was then switched to constant pressure mode at the pore pressure value. The experiment lasted from the first assembly of the fracture sample until the complete occlusion of the fracture, with significant obliteration of the baseline microstructure. A total of seven confining pressure steps (plus one baseline scan of the sample with the as-received saturation) were collected. Measurements were run in a quasi-static fashion, stopping the flow and waiting until the sample was stable for scanning, i.e., when the sample motion observable was slower than the pixel size, at 3.22 μm, per tile scan time (15 min). Sample stabilization was relatively fast (less than 1 h) even at high confining pressures.
The experiment was conducted at beamline 8.3.2 (MacDowell et al., 2012) at the Advanced Light Source (Lawrence Berkeley National Laboratory). Data were collected using filter-hardened (6 mm Al, 0.5 mm Cu) white light. The detector system consisted of a conventional scintillator, visible light optics, and a sCMOS detector. More specifically, we used a 50 μm LuAG scintillator with a 2 × microscope objective (yielding a pixel size of 3.22 μm) optical system, recording the projection images with a low-noise sCMOS camera (PCO-Edge, Cooke Corporation, 2560 × 2560 px).
The data collection strategy at the beamline was to operate in continuous tomography mode, with 2049 projections over a 180 degrees rotation of the sample. A “local area” imaging setup (i.e., sample larger than the field of view) was used to collect the highest resolution dataset possible with the available optics: as a consequence an outer rim of the sample 50–100 μm thick was not measured. The choice of privileging this resolution vs. the larger field of view was done since from previous experience this resolution provides much better quality data in terms of subsequent data analysis and modeling (e.g., digital volume correlation). The significant loss in resolution (more than doubled) needed to image the whole sample is generally used when boundary conditions for modeling are critical. Given the small size of features in shales, we privileged the resolution (with enough detail to identify the evolution of microstructures, and enough fracture to compute a correct flow simulation) with respect to the full boundary conditions. Exposure time was 400 ms per projection. Given that the vertical size of the sample exceeded the vertical size of the beam, a series of six vertical tiles for each measurement was collected for each time step to image the whole sample. From the raw projections, a conventional filtered back-projection approach (Kak and Slaney, 2001), as implemented in the software Octopus® (Dierick et al., 2004) was used to obtain the reconstructed slices for each dataset, finally the different tiles were combined to obtain the full sample volume for each time step.
Results
Qualitative Observations of the Evolution
During the experiment, flow in the sample was obstructed early in the fracture closure process: after the saturation of the sample the pressure of the constant flow pump started to increase slowly, highlighting the presence of choke points in the sample making the flow more difficult. The flow stopped immediately and completely after increasing the differential pressure (confining minus pore pressure set by the backpressure pump) to 300 psi (2.07 MPa); at that point the pressure in the constant flow pump quickly increased to values close to the confining pressure, hence the pump was stopped and the system was kept at a constant pore pressure, set on both pumps [40 psi (0.28 MPa)]. After that threshold, no fluid was transferred through the sample.
This behavior can be qualitatively correlated to CT image features observed at the different closure steps. In Figure 1, volume renderings of the sample at the different stages during the flow of the carbonated water are shown (differential pressures are listed in psi). The closure of the fracture is progressive; at the first stages of the experiment, aperture reduction is more evident in the middle and lower sections of the sample.
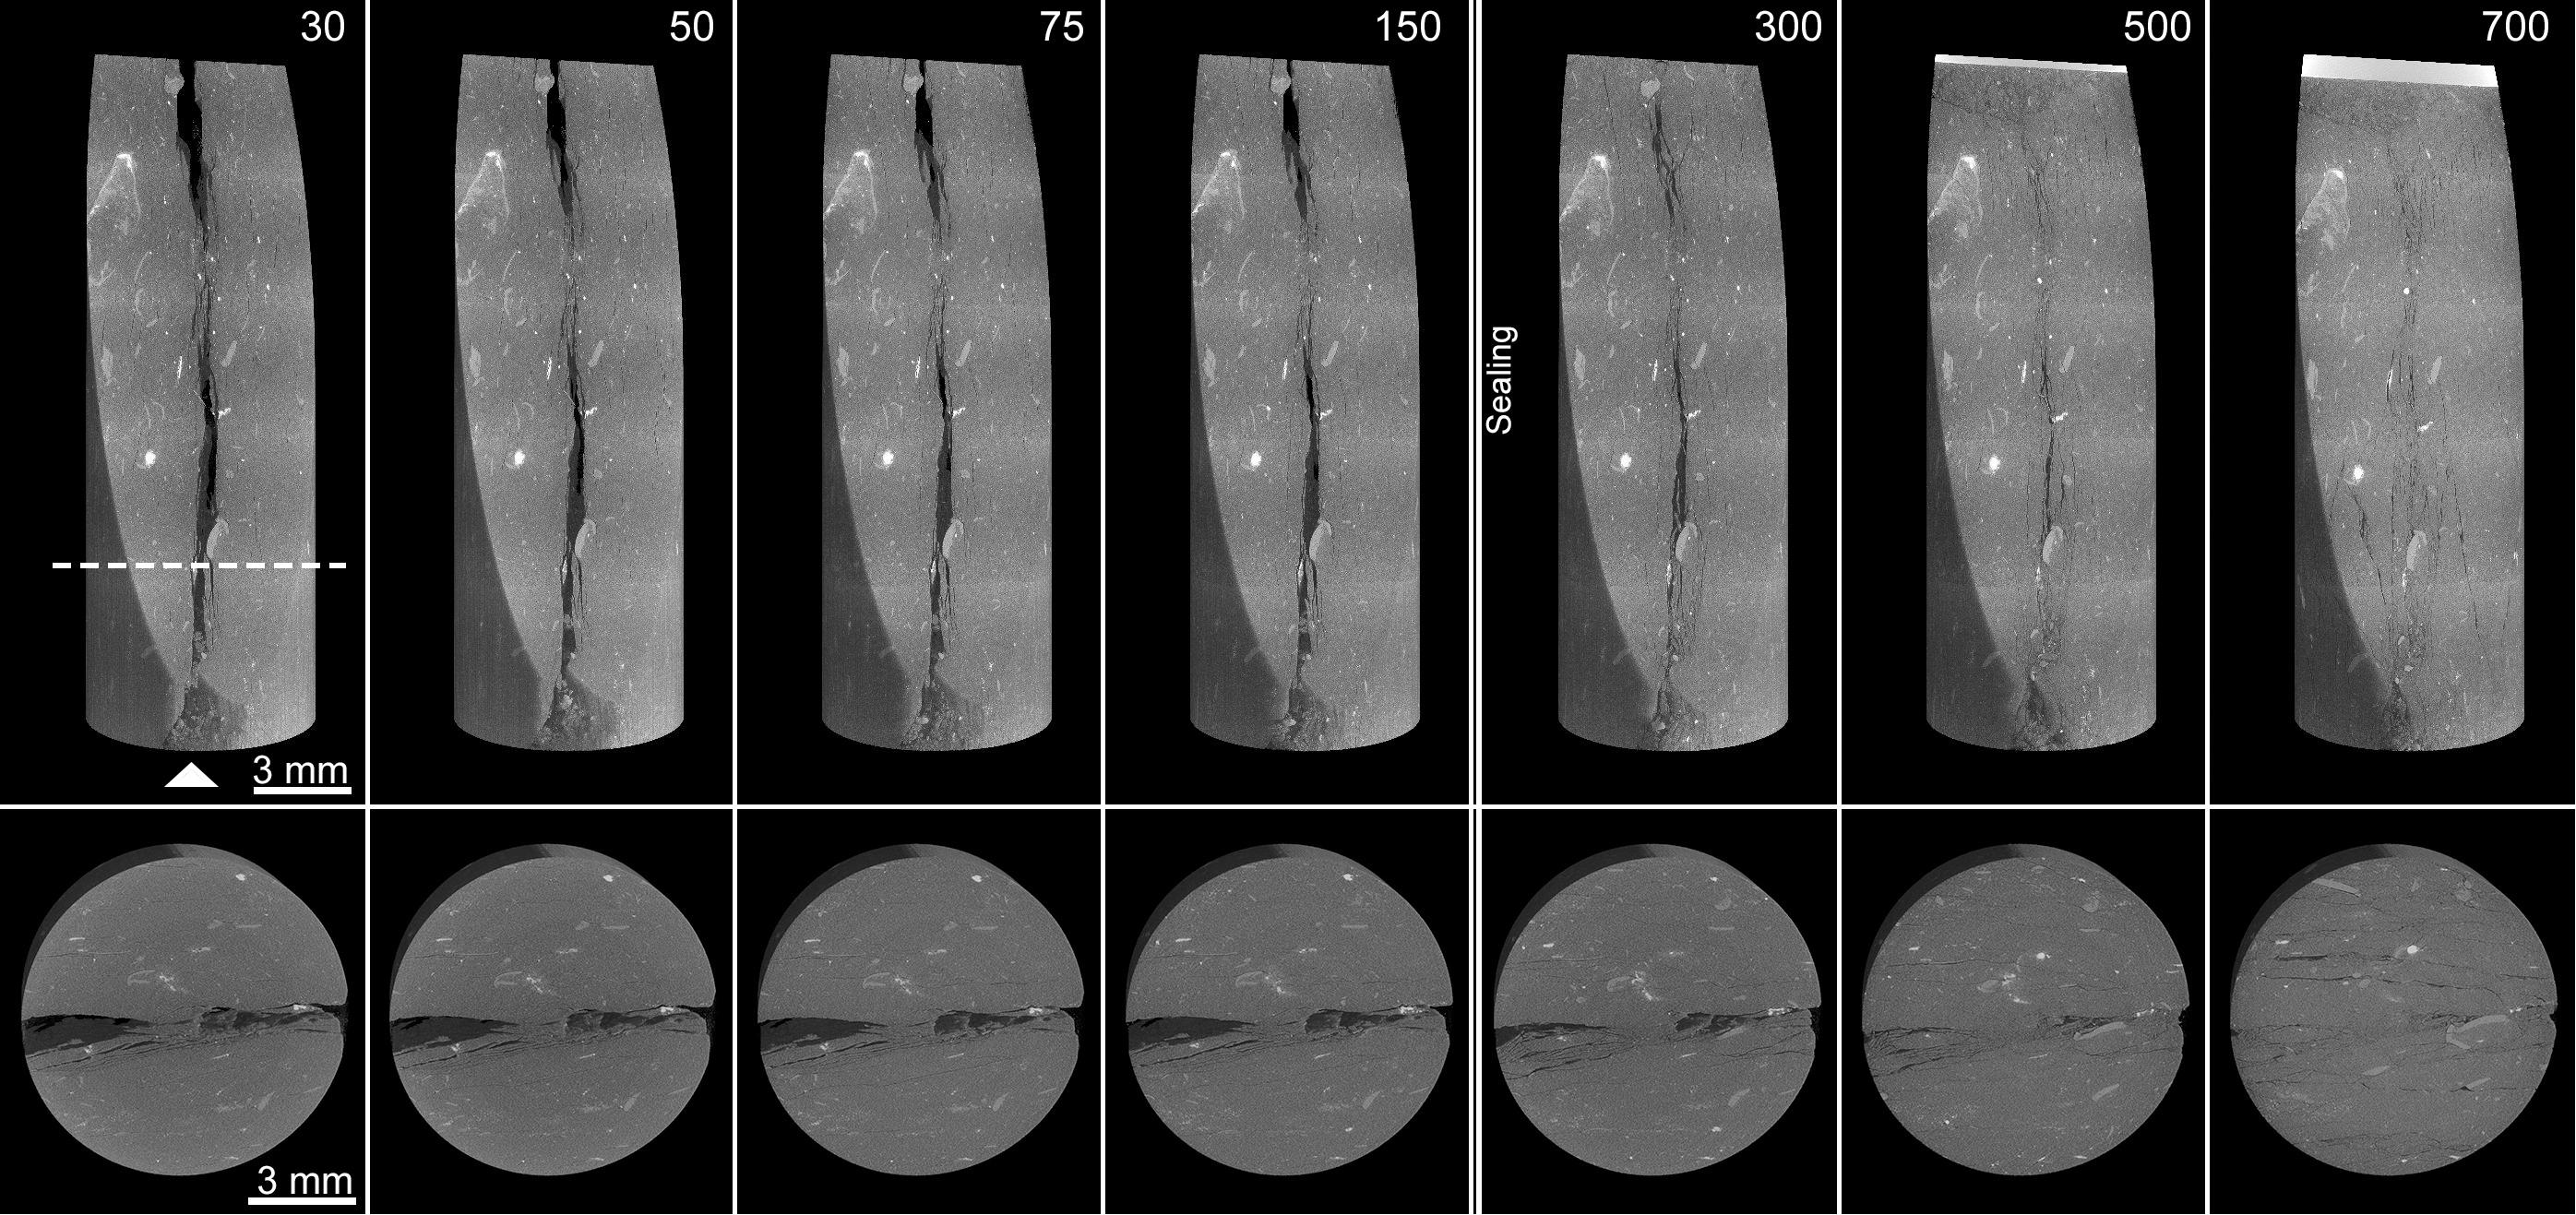
Figure 1. Volume rendering of the sample during the flow experiment, while increasing the confining pressure (volumes in figure are labeled with differential pressure values, in psi). Inlet at the bottom (see arrow). On the top row a subvertical section of the sample is shown. The bottom row displays a slice of sample (at the dashed line) looking from the inlet direction.
In the lower row of Figure 1 a horizontal section of this part of the sample looking from the lower inlet is also displayed to better appreciate the features present in the sample during the sealing of the fracture. Just under this section of the sample, the main choke point of the fracture is present. This choke point controls the flow along the fracture length. The sealing of the fracture seems to be a rather regular process, with the fracture monotonically decreasing in aperture, as seen in the subvertical sections on the top row in Figure 1, until the final stage where the seal is almost complete and significant vertical shortening of the sample due to pervasive microfracturing and shear is also observable.
In Figure 2 a detail of the sample before and after hydraulic sealing is shown, in a vertical section of the sample (perpendicular with respect to the fracture plane) and a zoom of the most interesting region (middle column), with the main choke point at the bottom, and a large aperture zone of the fracture just above. A binarized version of the inset, better highlighting the morphology of the fracture in that section, is provided on the right. The deformation observable in the choke point area is small, but enough to completely obstruct flow: the original fracture plane before the sealing is still noticeable, while after the sealing it becomes difficult to distinguish from the unaltered OPA, in terms of CT number (which translates into gray value in the resulting image). The larger aperture zone deforms to a larger degree, with a progressive development of a microfractured zone, with most of the microfractures starting parallel to the bedding plane at, and around, the asperity contacts.
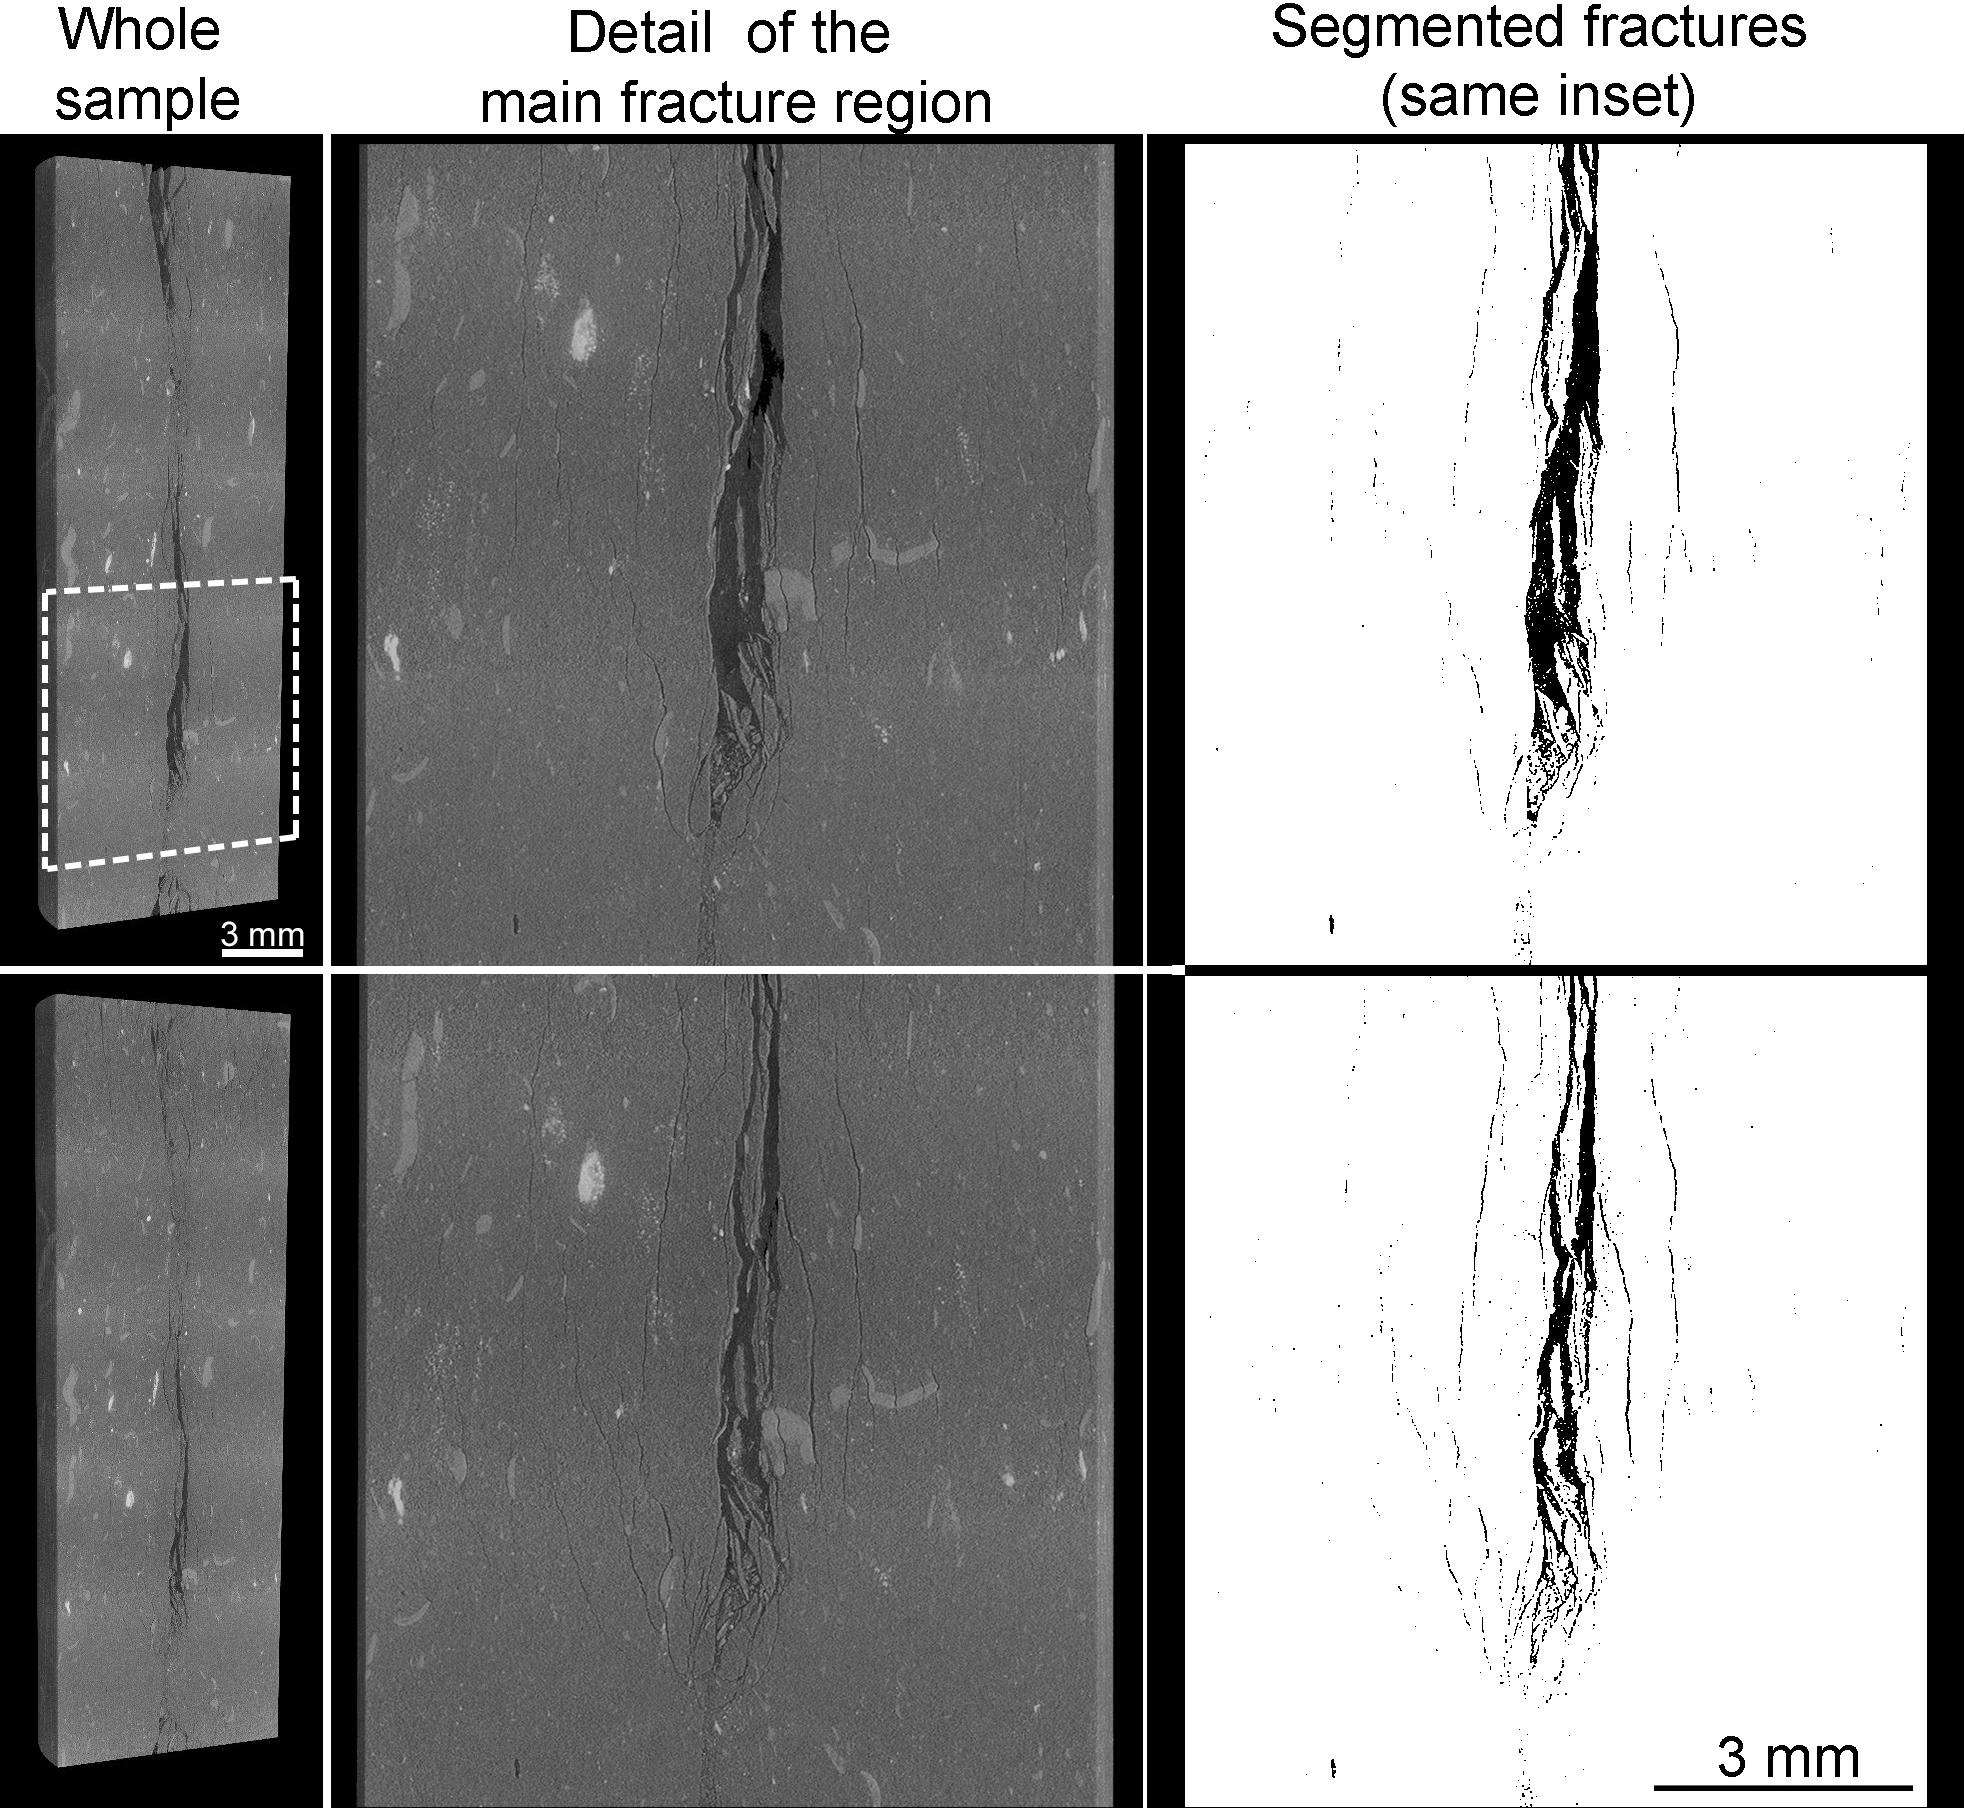
Figure 2. Vertical section of the sample before and after hydraulic sealing. On the middle column, a detail of the part of the sample with the choke point and a large aperture section of the fracture are displayed. On the right, corresponding binarized images further highlight the fracture morphology in the sample.
The carbonated water was circulated in order to observe eventual geochemical weathering, as for the shale sample documented in Deng et al. (2017), However, the facies of OPA studied in this experiment (“shaly facies”), in addition to having a lower fraction of carbonates, those carbonates are also not present as a microcrystalline cementing phase, but as bioclasts, making them less accessible to the reactive fluid. For this reason, no clear evidence of CO2-induced weathering was observed in this experiment. Time, P/T conditions, and type of clays, also minimize significant interaction between the aqueous CO2 and the clay minerals in OPA.
Stress-Induced Microstructures
The increase in differential pressure generated a variety of mechanical responses in the sample. During the sealing stage of the large aperture fracture, shown in Figure 3A (P = 500 psi [3.45 MPa]), the development of a pervasive microfracture network in the material around the fracture is evident, with the progressive filling of the fracture zone with microlithons. Most of the microfractures are subparallel to the bedding plane, but different mechanisms in the whole sample can be observed. In Figure 3, an example of purely tensile crack is shown in yellow: the behavior is highlighted by the presence of a bioclast, which is broken into two pieces. Fractures with a significant shear component are also present, as the one highlighted in light green. These fractures are difficult to observe, since the shearing action generates fines mixed with the pore fluid, resulting in a weak density (and consequently CT number) contrast. The presence of en echelon conjugated fracture systems, due to vertical shortening under load, are also observable in the sample (highlighted in light blue in Figure 3A). An eventual axial dilation of the bulk sample is not measurable given the “local area” setup used for the experiment. The deformation microstructures observed close to the fracture plane display affinities with those observed in the deformed zones at the Mont Terri site (Laurich et al., 2018).
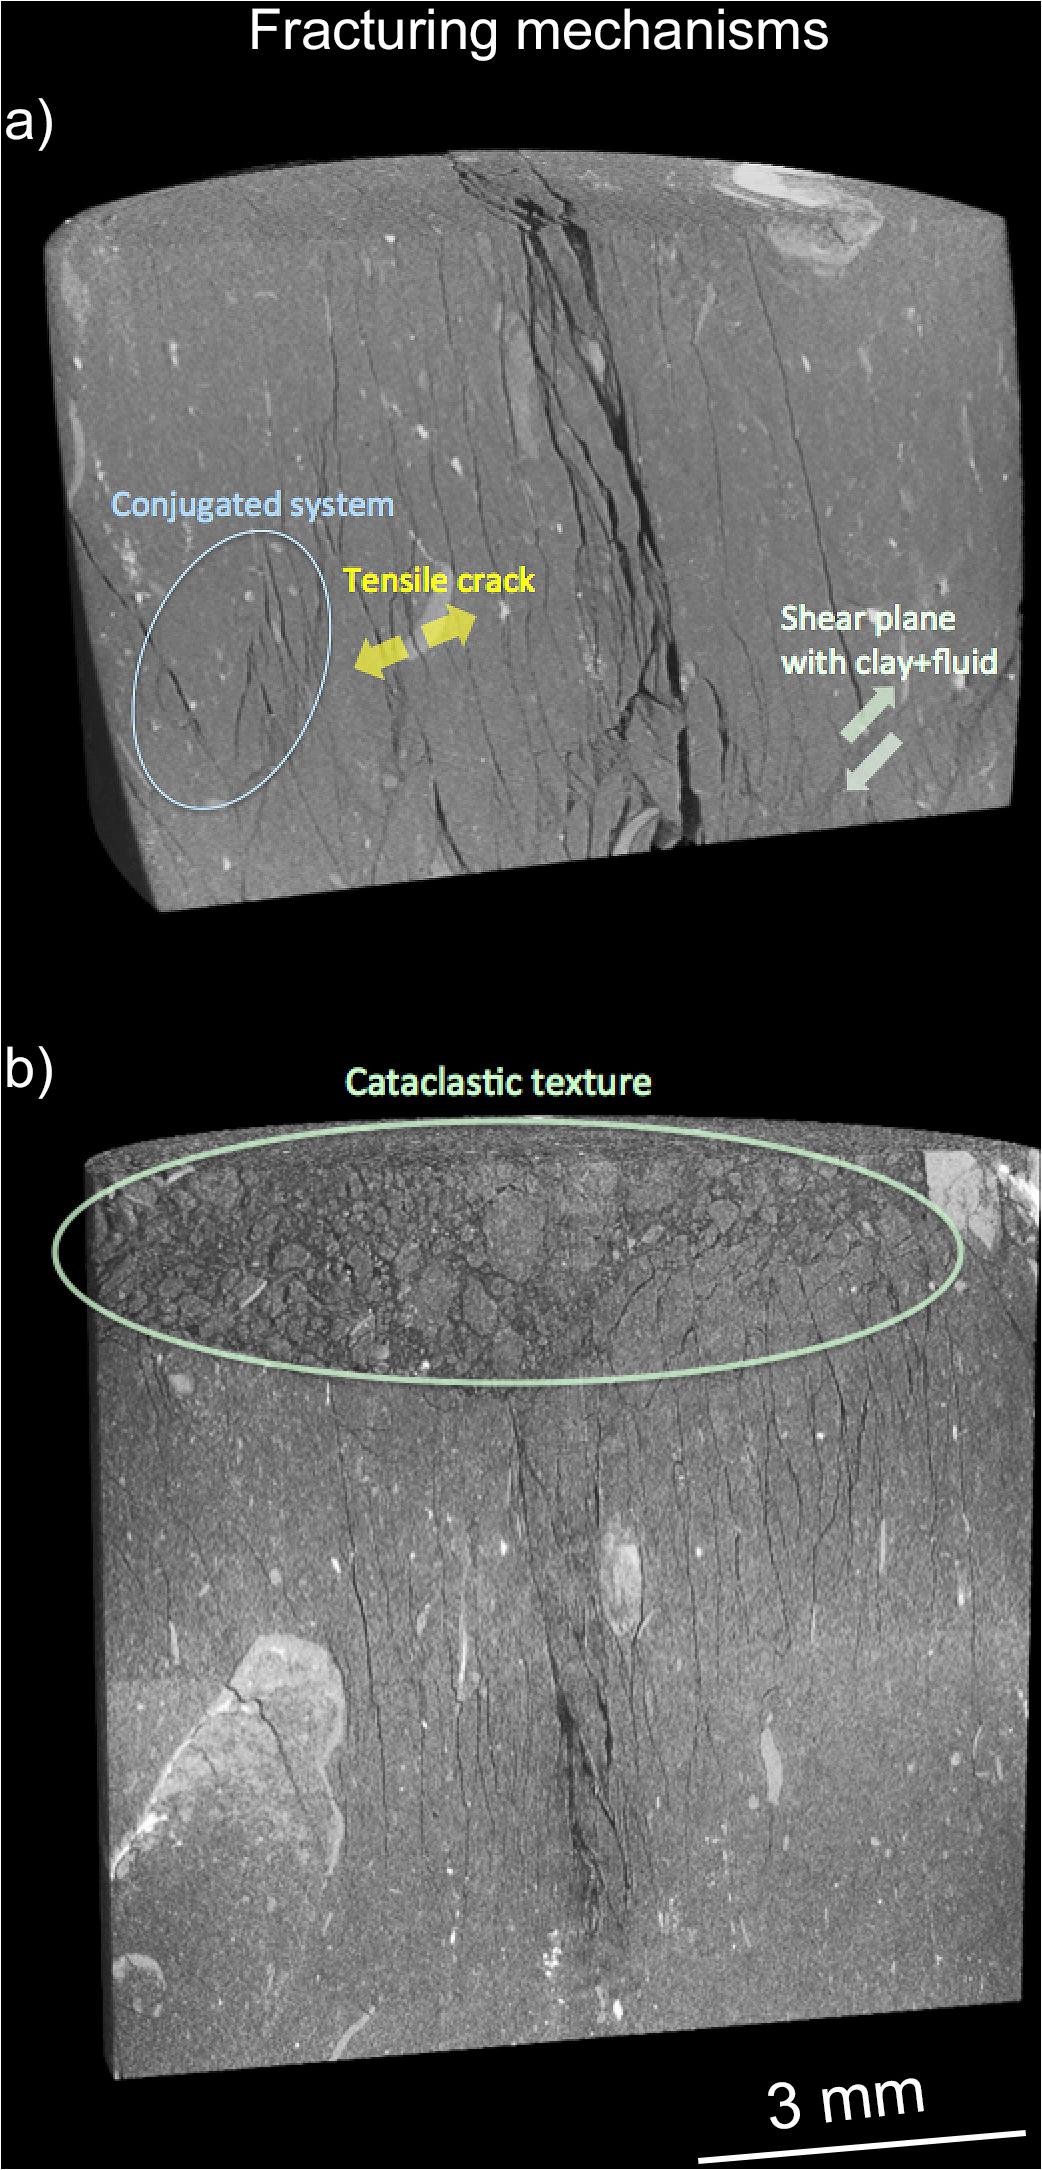
Figure 3. Subsections of the sample at the latter stages of the experiment, where the mechanical deformation of the sample was more pronounced: different fracturing mechanisms are highlighted in the figures (see text for complete details). (a) middle section of the sample, (b) top section of the sample.
In sections of the sample where deformation is more pronounced, a microstructure with a similarity to cataclasites is present, where angular-shaped microlithons and silt particles are surrounded by a mixture of clays and fluid. This microstructure is shown in Figure 3B, which focuses on the top of the sample at the last stage of the experiment. This pervasive microfracturing and the related deformation, starting at the asperity contacts of the fracture, is the mechanisms controlling the sealing of the system.
Quantitative Analysis of Local Deformation
In order to better quantify the mechanisms of the closure of the main choke point in the fracture, and hence the sealing, we used the digital volume correlation (DVC) technique, which has proven to be an effective analysis tool for rock deformation experiments in argillaceous rocks (Lenoir et al., 2007). The DVC approach utilizes local patch-wise image correlation calculations between two volumetric datasets, such as the ones acquired via tomographic techniques, to estimate local vector displacements and volumetric deformation between the two (see Bay et al., 1999, for the first development on tomographic datasets). Using DVC, local displacements of the sample in the three directions were calculated for the lower section of the sample, where the main choke point and the large aperture zone are. We used the TomoWarp2 software (Tudisco et al., 2017) on the datasets collected before and after the sealing of the fracture.
The most interesting results are visible in the horizontal displacement maps, along the normal of the fracture plane, roughly corresponding to bedding plane. In Figure 4 the volume rendering of the lower half of the sample is shown with the local displacement volume along the fracture normal superimposed. The look up table (LUT) chosen to label the DVC volume has two different colors for each displacement direction, and the color intensity is proportional to the displacement absolute value with a range of ±130 μm. From the figure it is possible to observe how the two sample halves are pushed toward each other, with the half on the left displaying higher displacement values. This is evident in the section of the sample where the fracture has a larger effective aperture, with the largest displacement present at the very center of the volume where a new asperity contact is developing and the largest amount of open microfractures are opening. The closure of the fracture in the zone of the choke point, in the lower part of the sample, where the asperity contacts are more developed, is much more limited; nevertheless, a very small displacement in this area, on the order of ∼30 μm, resulted in the complete hydraulic sealing of the fracture.
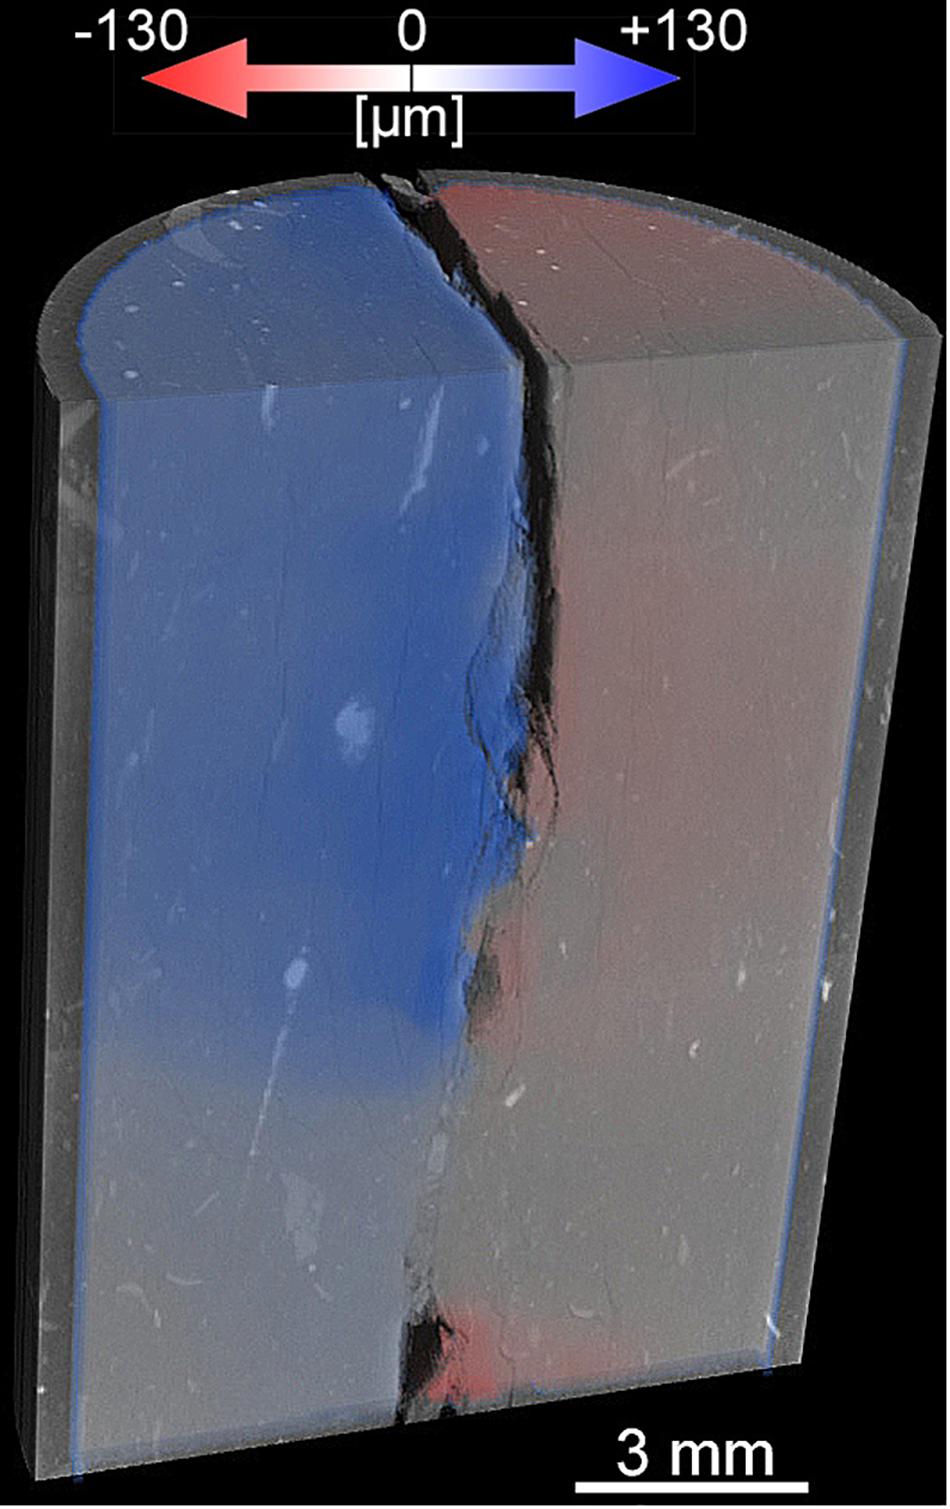
Figure 4. Digital volume correlation of the sample before and after hydraulic sealing (lower half of the sample. A colormap of the local displacements along the direction perpendicular to the fracture plane has been superimposed to the sample volume rendering.
Local Evolution of the Fracture Aperture
The evolution of the aperture has a significant impact on the hydraulic properties of the fracture, therefore in this section we will address the morphological evolution of the fracture with a focus on the consequence on the flow field; we observed from the DVC analysis that a small displacement in an already constricted region resulted in sealing. To provide a more quantitative view of aperture evolution during the whole experiment, the slice-by-slice average aperture of the fracture has been calculated for the different steps.
The general results can be summarized by Figure 5. On the left part of the figure, in grays, a volume rendering of a virtual vertical section of the sample at the beginning of the flow experiment {differential pressure = 30 psi [(0.21 MPa)]} is displayed as a reference, to have a transversal section of the fracture in the sample. Superimposed to the volume rendering, the 3D Stokes flow field of the fracture has been plotted as well. The color-coding of the Stokes flow field corresponds to the flow velocity at any given voxel, and transparency has been added to better visualize the whole field in the context of the fracture. From this color-coding it is possible to see the main, small, choke point, close to the inlet (bottom) which results in the only orange-red color in the flow field. A larger section about 1 cm from the top (outlet) also exhibits high flow velocities to a lesser extent (green colors), due to the more constricted flow. The Stokes flow velocity field has been provided as a reference to the slice-by-slice aperture plots displayed on the right of Figure 5 where the flow velocity plotted displays a very good agreement with the aperture variations along the flow direction plotted on the right. Observing the sample at the beginning of the flow experiment (red curve), starting from the inlet (bottom) we can see how the main choke point is immediately recognizable. Further along the flow path, the aperture gradually increases reaching a maximum; in this section of the fracture the flow is slower as would be expected. This local aperture-flow velocity correlation holds along the sample, where a secondary, and not as well developed as the first one, choke point is present, and where the fracture becomes larger again, going to the outlet.
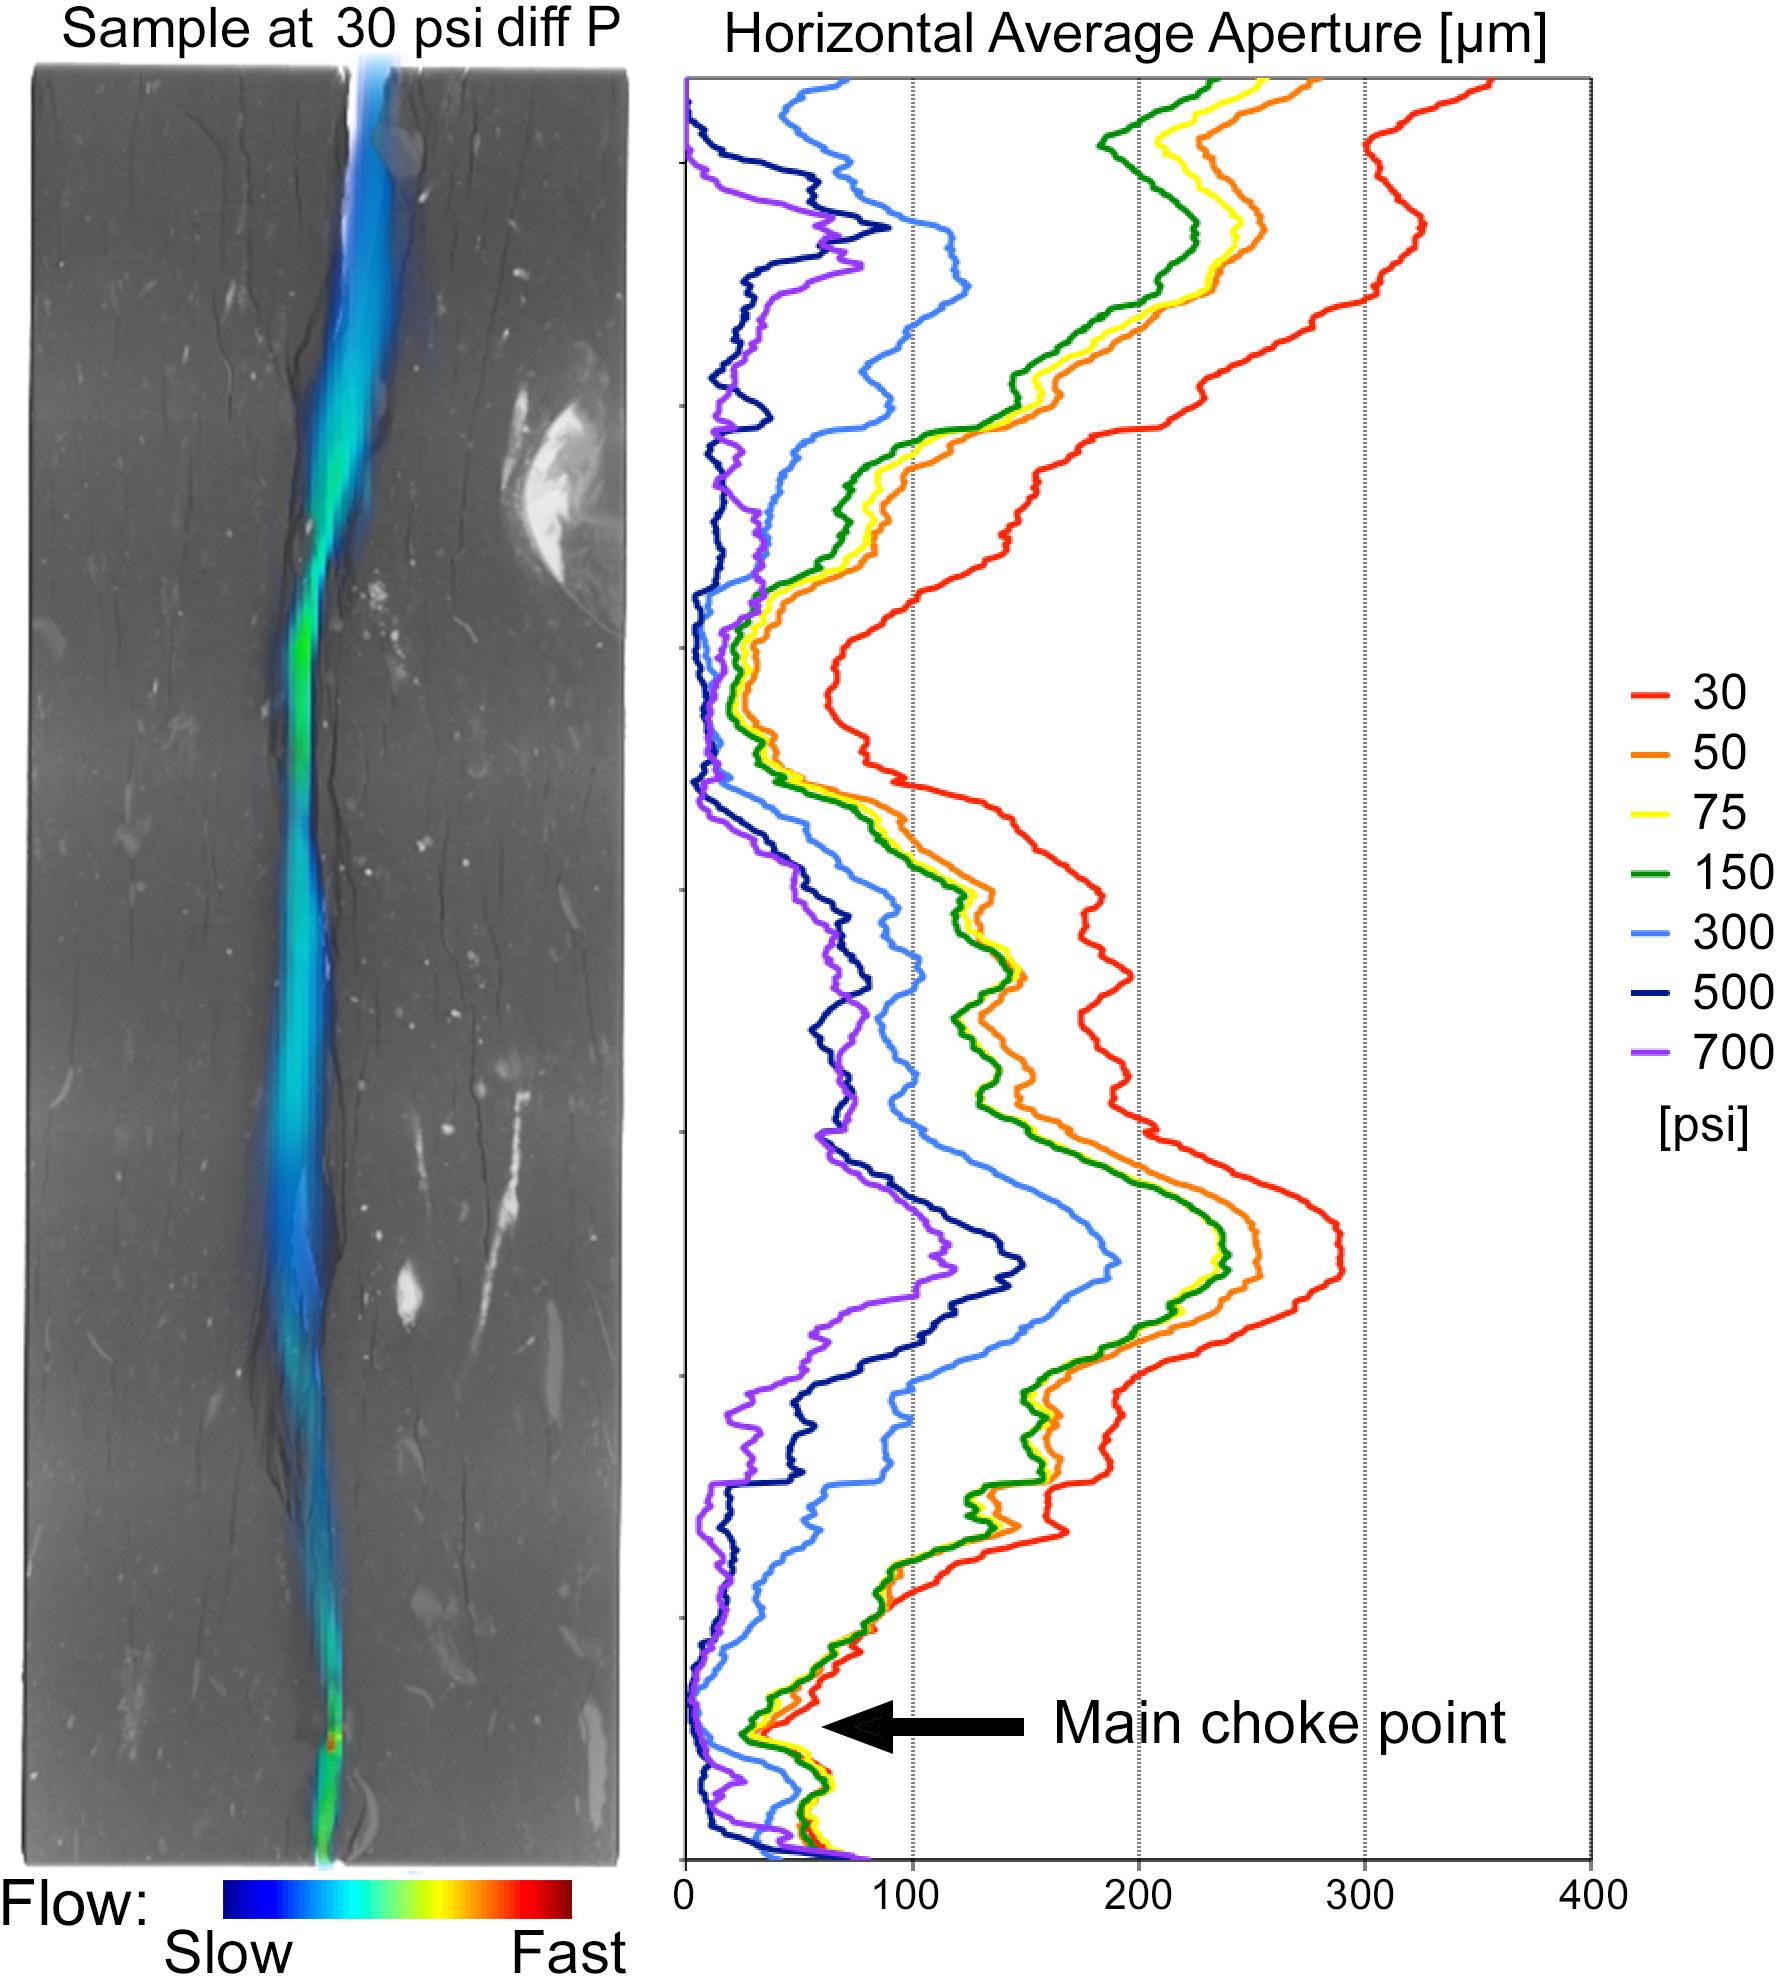
Figure 5. Average aperture distributions along the vertical axis of the sample during the flow experiment. On the left, a vertical section of the sample at the beginning of the flow, with superimposed in colors the Stokes flow velocity field calculated for the fracture at that stage.
Comparing the sequence of aperture measurements as a function of differential pressure, we see how the evolution of the aperture plots is not regular. The first important feature is the closure of the main choke point, visible on the local aperture plot (see arrow in figure): at 300 psi (2.07 MPa) that section of the plot goes sharply to values close to zero. The part of the sample above this choke point closes substantially, but never completely seals, even if the absolute changes in aperture are much larger than in the part of the sample with the main choke point. This behavior is in agreement with results obtained through DVC analysis, and it is also consistent with the evolution of the asperity contacts discussed later in this work. The secondary choke point in the upper half of the sample eventually seals the fracture as well. The top of the sample is where the most pronounced fracture closure is observed; as discussed previously, this is due primarily to the generation of a very pervasive fracturing of the OPA and the generation of the cataclastic texture (Figure 3B) which can deform and fill the fracture more efficiently when compared to the less pervasive mechanisms observed in the other parts of the sample.
Hydraulic Properties and Relationship With the Fracture Topology
A direct measurement of the permeability of the real sample in the experimental setup used in this study would be challenging at best, therefore we utilize the digital rock physics approach and calculate the single phase hydraulic properties of the sample directly from the tomographic datasets. To calculate the permeability of the fracture, the binarized volume of the fracture was directly used to calculate Stoke’s flow, which results in a permeability value and volumes with the flow velocity fields in the three orthogonal directions. The calculation of Stokes flow velocity fields also is also helpful, since it facilitates understanding of controlling features such as channels, choke points, etc. To calculate the flow properties of the sample at the different stages we used the approach described in Zuo et al. (2017), with an updated version of the code used in that work, in a rescaled volume. The calculated permeability values, for comparison purposes, have been normalized with respect the starting permeability of the system (value = 100). The topological parameters of the fracture we calculated to compare the permeability are the average aperture and the percentage of contact areas in the fracture plane.
The permeability modeling results are summarized in Figure 6. The modeled permeability drops by 50% during the first increase in differential pressure (20 psi [0.14 MP]). After this first steep decrease, the permeability reductions becomes less pronounced, until the closure of the choke point, when the permeability goes to zero: this is in good agreement with the behavior observed during the experiment, since it’s the point where flow was stopped due to the loss of hydraulic conductivity. The general trend in permeability modification follows the average aperture of the fracture, with the main difference being that such an averaged calculation cannot identify the closure of the choke point, and therefore the hydraulic sealing of the fracture. The increase in contact areas is rather regular during the sample evolution and it is not directly related to either the average aperture or permeability. An interesting detail is how the starting steep decrease in permeability is coupled with only a modest increase in asperity contacts in the fracture.
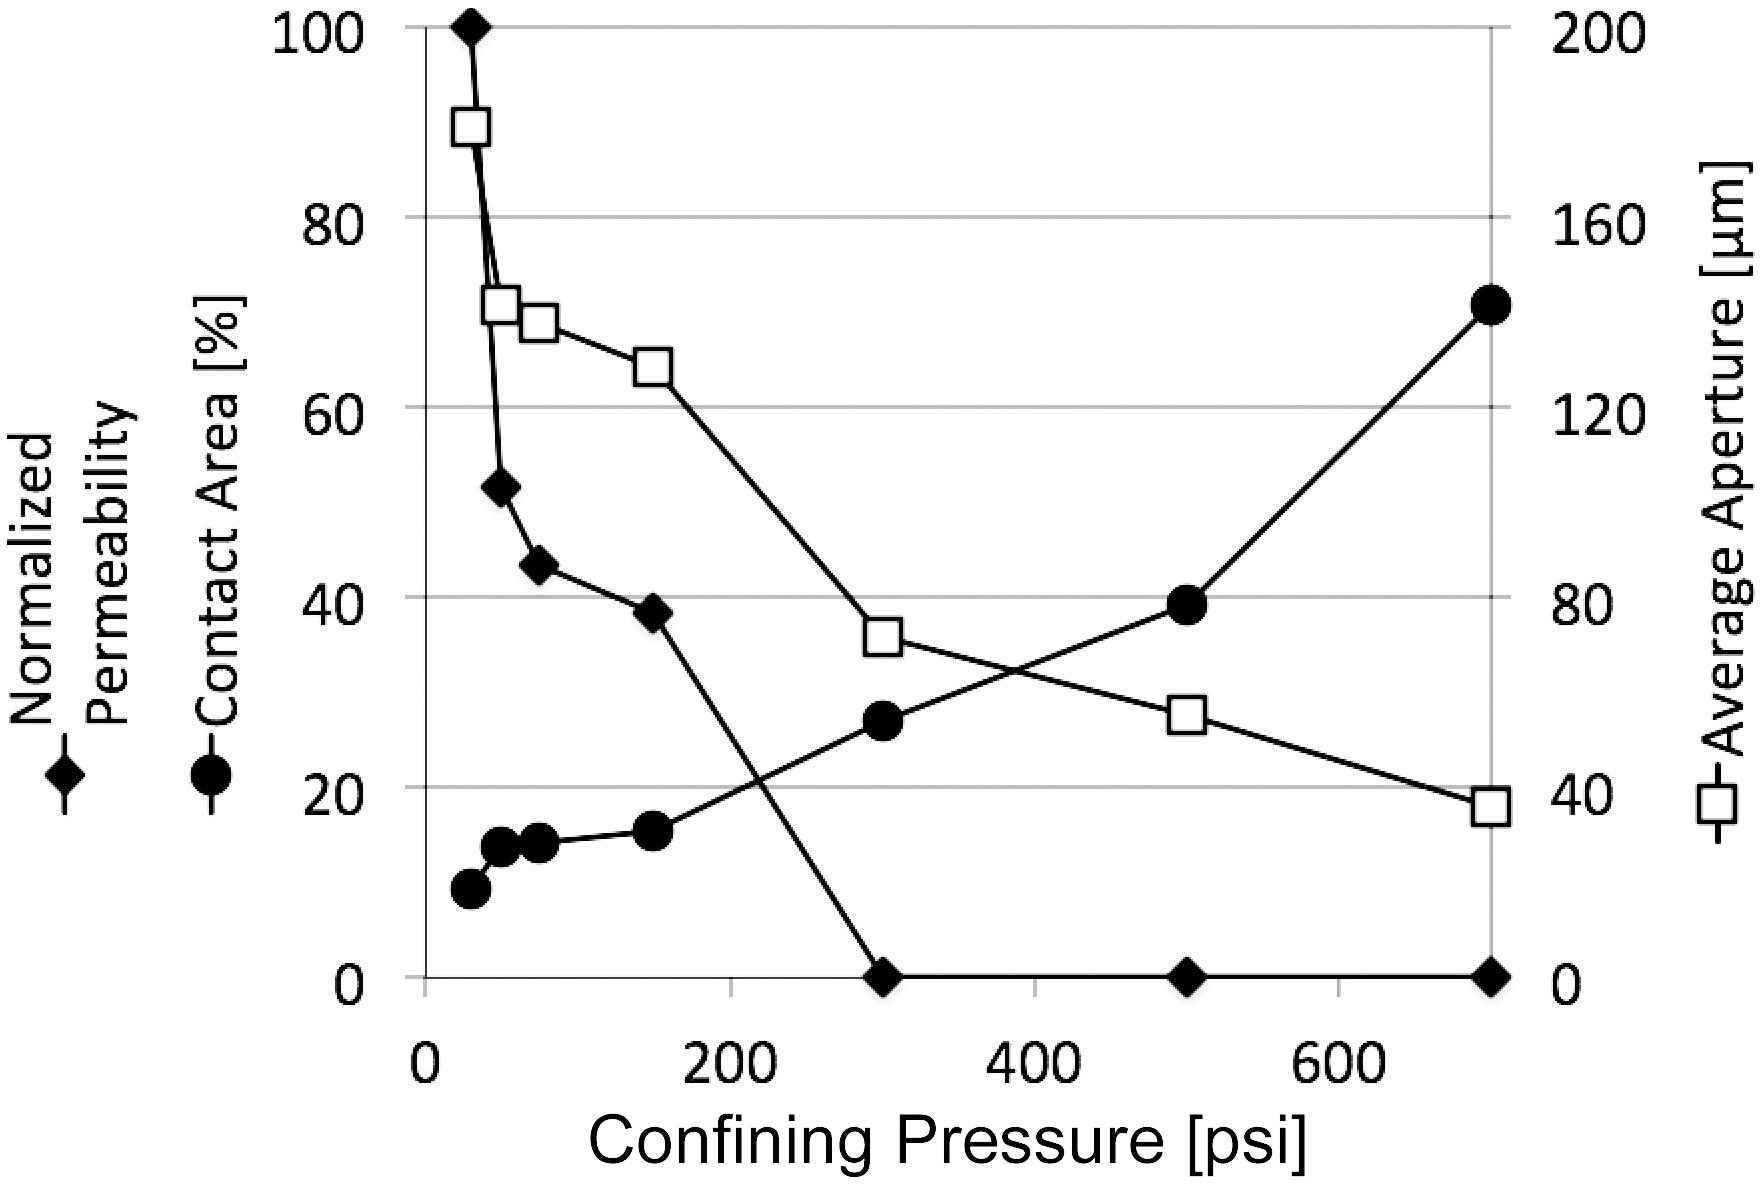
Figure 6. Plots comparing hydraulic properties and morphometric parameters calculated for the fracture: normalized permeability [100 = value at the start of the experiment], asperity contacts area [%], and average aperture [μm].
Discussion
The evolution of the fractured OPA sample studied in this experiment depends on a series of different coupled processes. Mechanisms of localized and bulk strain have been observed, leading to the development of new microcracks and slaking at the fracture surface, and to bulk sealing of the main fracture, respectively. The loss in permeability occurs at relatively low confining stress levels. At higher confining pressures (differential P > 300 psi [2.07 MPa]) the sample microstructure becomes noticeably distorted and aperture reduction is more extensive. The conductivity of the fracture studied is controlled by the evolution of a single feature of the system, the main choke point. This evolution is largely controlled by the evolution of the asperity contacts in that region of the fracture.
The effect of hydration of OPA has been shown to induce self-sealing in prior studies. In Bourg and Ajo-Franklin (2017) the sample displayed in Figure 2 shows a self-sealing behavior, and the sealing happened at a constant differential pressure of 300 psi (2.07 MPa), the same value observed in this study, after less than 1 h of flowing carbonated water. The saturation of the sample seems to play a significant role. In Bastiaens et al. (2007) flow experiments, in an artificially fractured Boom Clay core, displayed a self-sealing/healing behavior due to sample hydration. The authors also found OPA behave in a similar fashion, only significantly slowly and to a lesser sealing extent. Hydration is an important process in assessing the sealing behavior of OPA and clay-bearing materials in general, concerning OPA, even complete self-sealing has been observed, as in the 2D cell of Laurich et al. (2019), where the fracture was optically sealed after as little as 1.4 h. This time is similar to the hydration period at constant flow and pressures allowed to our sample before increasing the confining pressure. In this timeframe we observed a clear partial sealing, but after that time the sample was considered “stable”, meaning that during a scan no motion artifacts were observable. This translates to the fact that any motion in the sample (e.g., swelling) was -at that point- slower than the pixel size of the detector (3.22 μm) in the timeframe of the tomographic scan, but slower swelling that would eventually seal the fracture by hydration alone cannot be excluded. The self-sealing properties of OPA are, as expected, increased as a function of the confining stress (Heitz et al., 2003; Bock et al., 2010). These experiments confirm the behavior observed in our study; however, with the addition of in situ imaging we have been able to both identify and quantify the sealing process in a case where shale hydration is combined with micromechanical alteration to inducing fracture sealing.
The role of hydration in our experiment is explored in Figure 7. The sample with “as received” saturation and the sample after flowing the carbonated water for ∼1 h (at the same differential pressure of 30 psi) are shown by way of the renderings on the left panel: the hydration of the shale at the asperity contacts weakened their mechanical properties. This results in localized microfracturing due to the swelling induced by the free water flow along the surface, with the consequent preferential failure along discontinuities parallel to the bedding plane. This results in a fast, partial sealing behavior due to hydration. Microfracturing induced by hydration is combined with the fracturing mechanisms induced by mechanical loading in the second phase of the experiment; fluid pressure built up and presumably slower pressure dissipation throughout the sample likely have caused local fluid over pressures. These, in conjunction with the proximity to the upper moving piston, might have favored cataclasis, as evident in the upper sample section shown in Figure 3B. The result of this combination is the generation of an extremely complex and pervasive deformation pattern.
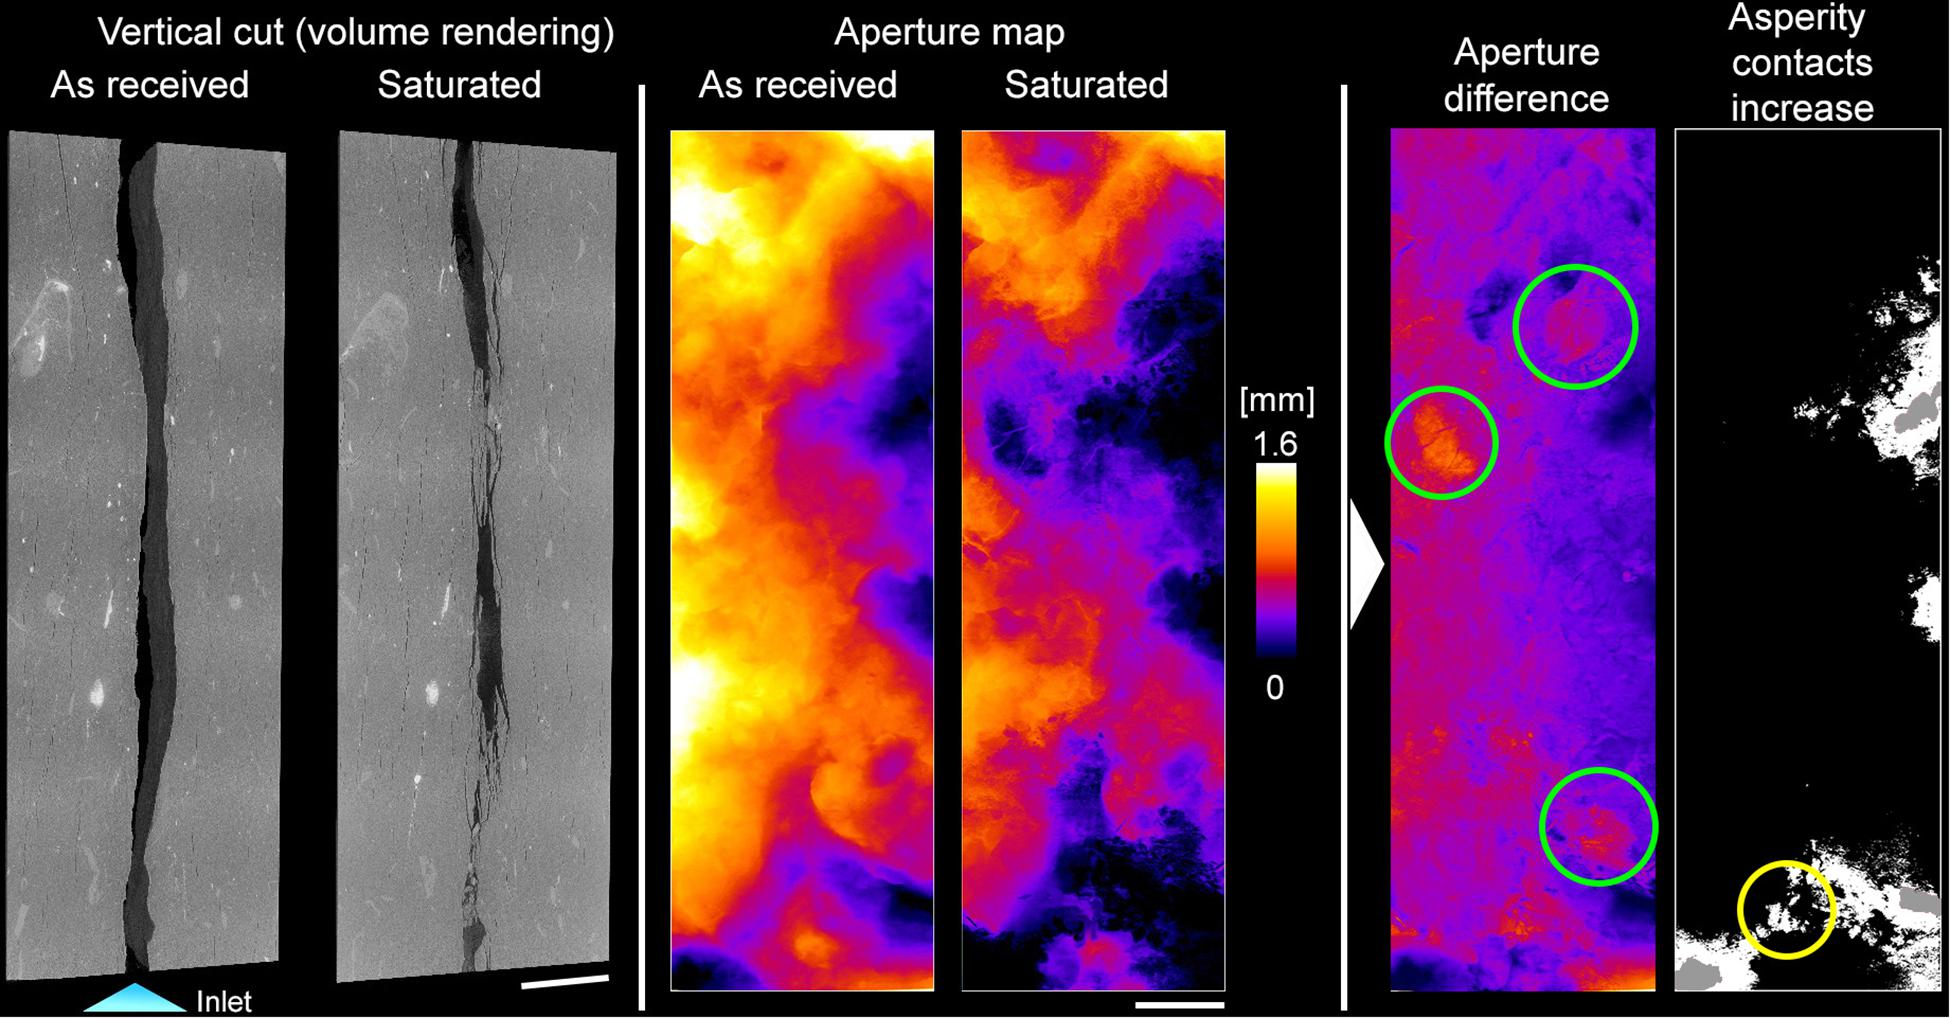
Figure 7. Role of the hydration in the morphology of the fracture: volume renderings (left), and aperture maps (center) of the sample before and after hydration are shown. On the right, the difference in apertures and the evolution of asperity contacts is shown. In gray the starting contact areas are shown, and in white the new contact areas after saturation have been displayed. Areas of special interest have been highlighted: the generation of choke points because of the swelling and fracturing of material close to the fracture surface (green circles), and the generation of the main choke point which will be responsible of the hydraulic sealing on this specific sample (yellow circle) during the differential pressure increase.
Hydration of the shale close to the fracture surface seems to significantly impact the initial aperture distribution on the fracture plane. In Figure 7 the aperture maps of the fracture before and after hydration are shown: from the volume rendering section, the closure of the fracture is evident, but the aperture maps show the phenomenon in a quantitative fashion and allow the identification of interesting details. The average aperture loss due to the hydration process is 44%, while contact area increases by a factor of 9. The evolution of aperture in the maps displays both a global decrease and some different behavior in specific areas. To better understand this evolution, the difference in aperture values and the newly formed asperity contacts are displayed on the right panel of Figure 7. The aperture decrease is roughly proportional to the aperture absolute values map, but there are some significant exceptions in the areas of the fracture with a low aperture starting value. Where both fracture surfaces come in contact, the subjected confining pressure might suppress any free clay mineral swelling. This suppression likely results in heterogeneous stress distributions and apparently enhances swelling and slaking around such wall-to-wall contacts. This fracturing and subsequent slaking of fragments is evident (for the largest fragments) in the difference aperture map, and three of these events have been highlighted with the green circles. The swelling of the material at the asperity contacts and in the zones with low aperture values had another effect, which was the most influential in the present experiment, from an hydraulic point of view: the generation of choke points. The single choke point controlling the evolution of the permeability, as calculated for this experiment, has been highlighted in yellow in the asperity contacts map. Before hydration, the area around the choke point displays low aperture values, with small asperity contacts surrounding it. After the hydration, swelling in that portion of the sample (coupled with the swelling-induced fracturing) generates a barrier with a few gaps where the fluid can pass through, setting thus the main choke point that will be sealed when increasing in confining pressure will be applied. The evolution of the hydraulic properties of the whole fracture was controlled by the evolution of that specific choke point: as we can observe, especially from the aperture maps, the asperity contacts generate this transverse “barrier” with respect to the flow direction. This barrier has a small channel left allowing flow to go through (highlighted with the yellow circle).
The hydration step seems to trigger the fast sealing behavior observed in OPA: the microfracturing due to the local swelling induced by the interaction of clays with the water, and the relative stress relief at the fracture surface, provides mechanically weaker asperity contacts, thus the closure of the fracture becomes easier. This process is also emphasized with the current sample geometry, where the bedding is subparallel to the fracture plane. Swelling strain measurements in OPA display a strongly anisotropic behavior, with the largest strain increase in the direction normal to the bedding plane (Wolter, 2003; Zhang et al., 2009), this results in preferential slaking along the lamination planes and the release of the stress with the expansion in the fracture space. This behavior is also highlighted by the DVC analysis, which detects a more pronounced local strain in the part of the sample closer to the fracture surface (and in the part of the surface with larger aperture), and presented in Figure 4. The changes of the sealing mechanisms in function of the bedding plane direction is an important topic, but is outside the scope of the present work, and would require a series of dedicated experiments. From the results found in our experiment we can indirectly obtain some insight about important factors: first, the slaking of the fracture surface due to hydration seems to be enhanced in the parallel configuration. Being the main detachment planes (planes between laminae) parallel to the fracture surface, the detachment is favored. This favored detachment of microlithons is also favored by the compression mechanisms around the contact areas, this is especially evident in Figure 7, both from the renderings and from the local aperture maps, where the decrease in aperture in specific parts of the fracture are due to the detachment of flat fragments parallel to the fracture surface. Such a behavior would not be possible, to this extent, in a sample where the fracture would be perpendicular to the bedding plane. Second, the layered nature of the microstructure, especially in presence of alternating laminae with different mechanical properties, would also become more important in fractures cutting those structures orthogonally: the mechanically stronger layers would control the evolution of the fracture, up to the point of acting as self-propping features, for example. An extended local variability of chemical properties, would also be important in a reactive environment, coupled with mechanics, in the evolution of the fracture (e.g., Ellis et al., 2011).
The sealing of the fracture starts with the weakening of the surface induced by hydration, and the mechanical response of the closure is also a result of this first event. The DVC analysis shows larger displacements (in the direction normal to the fracture plane/bedding) in the part of the sample close to the fracture surface, where water is more abundant. This behavior can be explained by a combination of stress induced by the increase of confining pressure and the swelling due to hydration with the stress release at the fracture surface, resulting in the larger displacement values observed in this zone. At higher confining pressure values, the mechanisms become increasingly dominated by a primarily mechanical response of the sample, where different fracturing patterns are observable until the almost complete sealing of the sample. No true fracture healing processes have been observed, since the sealed zone displays bands composed of either microfractured OPA or bands and pockets of OPA fragments embedded in a clay and water mixture. These textures are expected to display low permeability values, being extremely rich in clays, but mechanical properties are expected to be significantly different than the unaltered OPA, also potentially acting as lubricant facilitating the development of preferential shear planes.
The mechanism responsible for hydraulically sealing the fracture seems to be the generation and the closure of choke points. This mechanism involves the area increase of specific asperity contacts. The increase in confining pressure is the most obvious way to start the process, but the effect of hydration weakening these areas due to swelling, and subsequent stress release by microfracturing, plays an important role in the pressure needed to seal the system, which is expected to be significantly smaller compared to a dry sample. The hydraulic sealing of the system happens well before the whole fracture is closed: when the calculated permeability in the fracture drops to zero, a substantial amount of open fracture is still present. The geometrical distribution of the starting contact (and close-to-contact) asperities seems to play a key role in the evolution of the fracture by generation (and closure) of choke points.
The sealing of OPA is complete at a relatively low differential pressure, and at these conditions fast self-sealing occurs as well, as observed in different experiments. The presence of large amounts of clays, combined with the absence of a cementing phase (carbonates), greatly increases the ease of sealing, by a synergistic effect of clay swelling/slaking with the decrease in strength of the asperity contacts. Also the absence of large and mechanically strong grains, (or laminae) with the exception for the few bioclasts, inhibits self-propping behavior in OPA fractures, and of course the low fraction of sand and silt particles prevents the development of a mechanically strong framework, therefore the system is controlled mostly by the behavior of clays. The presence of cementing phases would be detrimental for sealing properties as well; in a mechanically stronger matrix, the stress generated by the swelling of clays in contact with water would not result in the microfracturing and the subsequent weakening of the asperity contacts observed in this experiment. The presence of cementing phases seems to be instead a desirable feature in unconventional oil and gas recovery scenarios, where long-term high conductivity of fractures is the desired outcome: the pervasive weakening of the mechanical properties of the contacts of proppant grains and fracture surface does not occur, thus avoiding the embedment of the proppant in the shale and keeping the fracture open for production (Voltolini and Ajo-Franklin, 2020). In the case of OPA the weathering due to clay hydration is much more pervasive than the weathering due to the reaction with the CO2 present in the fluid. This is exactly the opposite behavior observed in a strongly cemented “shale” (Deng et al., 2017), where the dissolution of calcite is triggered and carbonates dissolution geochemistry controls the evolution of the fracture. In our experiment the presence of dissolved CO2 is in fact a negligible factor, and the hydraulic evolution is controlled by the mechanical response to hydration and stress increase of the asperity contacts alone.
Conclusion
The sealing of a fracture in OPA in function of hydration (1 h) and confining pressure (with datasets recorded every 3 h of flow, before sealing, after each pressure increase) has been observed via in situ SXRμCT. Different mechanisms play different key roles at the different stages of the evolution: first, the hydration of the sample induces a decrease in fracture aperture due to the hydration of the sample close to the fracture surfaces. Hydration induces swelling, and local stress is released via microfracturing. This generates the enlargement and mechanical weakening of the asperity contacts. After this first step, the increase in confining pressure induces the closure of the fracture; the mechanically weakened asperity contacts yield to the stress and the fracture progressively closes. The development of the asperity contacts completely controls the geometry of choke points, which in turn are the structures controlling the hydraulic properties of the fracture during sealing. At higher confining stresses, with the fracture already hydraulically sealed, more pervasive mechanical fracturing of the sample is observed: shear bands filled with fine clay mixed with water are observed; different fracturing mechanisms with conjugate fractures are present as well. In the parts of the sample with higher mechanical solicitation, material with a texture affine to cataclasites is observed as well, and the fracture becomes almost completely sealed.
As a formation able to self-seal after fracturing, OPA has proven, through both prior studies and the measurements presented in this work, to be a material with desirable characteristics for application where low-permeability seals are needed. The presence of CO2 in this experiment seems to make no difference since the swelling induced by water is so fast and pervasive at this scale and time. In addition to that, the presence of swelling clays in OPA is limited, and clays such as montmorillonite are the most prone to react with CO2. In a GCS scenario, the presence of supercritical CO2 could influence the swelling properties of the clay fraction as has been observed, but in a scenario limited in time and at moderate P and T water plays the main role. While the observations about CO2 are true in the temporal and spatial constraints of our experiment, evidence in nature, e.g., fractures sealed with calcite, clearly suggests that in given enough time and space different behaviors that can greatly influence the hydraulic properties of fractures can be also observed.
The present work has been able to identify and quantify the different processes involved in fracture sealing in a clay-rich rock such as the OPA, from the early stage of hydration until complete sealing due to confining stress progressive increase. The whole process is a combination of different mechanisms (triggered at different stages) that influence the morphology of the fracture, and as a consequence its hydraulic properties. The large amount of clays and the microstructure of the sample (especially the lack of cementing phases) are the main factors influencing the sealing properties of this group of rocks. The mechanical weakening of asperity contacts is the key process controlling hydraulic properties: microfracturing due to hydration and local stress increase provide a rapid sealing of choke points, resulting in prompt hydraulic sealing, a crucial requisite for an effective caprock or seal rock.
Data Availability Statement
The datasets generated for this study are available on request to the corresponding author.
Author Contributions
MV planned and executed the measurement, performed morphometric analysis and flow simulations, and wrote/edited the final manuscript. JA-F conceptualized the experiment, provided the sample, and wrote/edited the manuscript.
Conflict of Interest
The authors declare that the research was conducted in the absence of any commercial or financial relationships that could be construed as a potential conflict of interest.
Funding
This work was supported as part of the Center for Nanoscale Control of Geologic CO2 (NCGC), an Energy Frontier Research Center funded by the U.S. Department of Energy, Office of Science, Basic Energy Sciences under Award # DE-AC02-05CH11231. Beamline 8.3.2, at the Advanced Light Source at the Lawrence Berkeley National Laboratory is supported by the U.S. DOE Office of Science, Office of Basic Energy Sciences (DE-AC02-05CH11231).
Acknowledgments
The SXR-μCT experiment was performed with the assistance of Alastair MacDowell and Dula Parkinson at the Advanced Light Source. The authors acknowledge the reviews of BL and PB, which were very helpful in improving the manuscript.
References
Al-Bazali, T. M., Zhang, J., Chenevert, M. E., and Sharma, M. M. (2005). “Measurement of the sealing capacity of shale caprocks,” in Proceedings of the SPE Annual Technical Conference and Exhibition, Texas.
Bastiaens, W., Bernier, F., and Li, X. L. (2007). SELFRAC: experiments and conclusions on fracturing, self-healing and self-sealing processes in clays. Phys. Chem. Earth Parts A/B/C 32, 600–615. doi: 10.1016/j.pce.2006.04.026
Bay, B. K., Smith, T. S., Fyhrie, D. P., and Saad, M. (1999). Digital volume correlation: three-dimensional strain mapping using X-ray tomography. Exper. Mech. 39, 217–226. doi: 10.1007/bf02323555
Bock, H., Dehandschutter, B., Martin, C. D., Mazurek, M., De Haller, A., Skoczylas, F., et al. (2010). Self-Sealing Of Fractures in Argillaceous Formations In The Context Of Geological Disposal Of Radioactive Waste. OECD/NEA report 6184.
Bossart, P., Bernier, F., Birkholzer, J., Bruggeman, C., Connolly, P., Dewonck, S., et al. (2018). “Mont terri rock laboratory, 20 years of research: introduction, site characteristics and overview of experiments,” in Mont Terri Rock Laboratory, 20 Years. Swiss Journal of Geosciences Supplement, eds P. Bossart and A. Milnes (Cham: Birkhäuser).
Bourg, I. C. (2015). Sealing shales versus brittle shales: a sharp threshold in the material properties and energy technology uses of fine-grained sedimentary rocks. Environ. Sci. Technol. Lett. 2, 255–259. doi: 10.1021/acs.estlett.5b00233
Bourg, I. C., and Ajo-Franklin, J. B. (2017). Clay, water, and salt: controls on the permeability of fine-grained sedimentary rocks. Acc. Chem. Res. 50, 2067–2074. doi: 10.1021/acs.accounts.7b00261
Busch, A., Alles, S., Krooss, B. M., Stanjek, H., and Dewhurst, D. (2009). Effects of physical sorption and chemical reactions of CO2 in shaly caprocks. Energy Proc. 1, 3229–3235. doi: 10.1016/j.egypro.2009.02.107
Busch, A., Amann-Hildenbrand, A., Bertier, P., Waschbuesch, M., and Krooss, B. M. (2010). “The significance of caprock sealing integrity for CO2 storage,” in Proceedings of the SPE International Conference on CO2 Capture Storage and Utilization, Louisiana.
Cnudde, V., and Boone, M. N. (2013). High-resolution X-ray computed tomography in geosciences: a review of the current technology and applications. Earth Sci. Rev. 123, 1–17. doi: 10.1016/j.earscirev.2013.04.003
Deng, H., Molins, S., Steefel, C., DePaolo, D., Voltolini, M., Yang, L., et al. (2016). A 2.5 D reactive transport model for fracture alteration simulation. Environ. Sci. Technol. 50, 7564–7571. doi: 10.1021/acs.est.6b02184
Deng, H., Voltolini, M., Molins, S., Steefel, C., DePaolo, D., Ajo-Franklin, J., et al. (2017). Alteration and erosion of rock matrix bordering a carbonate-rich shale fracture. Environ. Sci. Technol. 51, 8861–8868. doi: 10.1021/acs.est.7b02063
Dierick, M., Masschaele, B., and Van Hoorebeke, L. (2004). Octopus, a fast and user-friendly tomographic reconstruction package developed in LabView®. Measur. Sci. Technol. 15:1366. doi: 10.1088/0957-0233/15/7/020
Ellis, B., Peters, C., Fitts, J., Bromhal, G., McIntyre, D., Warzinski, R., et al. (2011). Deterioration of a fractured carbonate caprock exposed to CO2-acidified brine flow. Greenhouse Gases 1, 248–260. doi: 10.1002/ghg.25
Heitz, D., Trick, T., and Bühler, C. (2003). Selfrac (SE) experiment: long term plate load experiment. Mont. Terri. Proj. Techn. 51:106.
Houben, M. E., Desbois, G., and Urai, J. L. (2013). Pore morphology and distribution in the shaly facies of opalinus clay (Mont Terri, Switzerland): insights from representative 2D BIB–SEM investigations on mm to nm scale. Appl. Clay Sci. 71, 82–97. doi: 10.1016/j.clay.2012.11.006
Houben, M. E., Desbois, G., and Urai, J. L. (2014). A comparative study of representative 2D microstructures in shaly and sandy facies of opalinus clay (Mont Terri, Switzerland) inferred form BIB-SEM and MIP methods. Mar. Petrol. Geol. 49, 143–161. doi: 10.1016/j.marpetgeo.2013.10.009
Kak, A. C., and Slaney, M. (2001). Principles of Computerized Tomographic Imaging. Philadelphia, PA: Society for Industrial and Applied Mathematics.
Laurich, B., Fourrière, A., and Gräsle, W. (2019). LT-A experiment: how fracture wetting leads to closure. Mont. Terri. Proj. Techn. TN 2020-29.
Laurich, B., Urai, J. L., Vollmer, C., and Nussbaum, C. (2018). Deformation mechanisms and evolution of the microstructure of gouge in the main fault in opalinus clay in the mont terri rock laboratory (CH). Solid Earth 9, 1–24.
Lenoir, N., Bornert, M., Desrues, J., Bésuelle, P., and Viggiani, G. (2007). Volumetric digital image correlation applied to X-ray microtomography images from triaxial compression tests on argillaceous rock. Strain 43, 193–205. doi: 10.1111/j.1475-1305.2007.00348.x
Loring, J. S., Schaef, H. T., Thompson, C. J., Turcu, R. V., Miller, Q. R., Chen, J., et al. (2013). Clay hydration/dehydration in dry to water-saturated supercritical CO2: implications for caprock integrity. Energy Proc. 37, 5443–5448. doi: 10.1016/j.egypro.2013.06.463
MacDowell, A. A., Parkinson, D. Y., Haboub, A., Schaible, E., Nasiatka, J. R., Yee, C. A., et al. (2012). “X-ray micro-tomography at the advanced light source,” in Proceedings of the Developments in X-Ray Tomography VIII, San Diego, CA.
Neufelder, R. J., Bowen, B. B., Lahann, R. W., and Rupp, J. A. (2012). Lithologic, mineralogical, and petrophysical characteristics of the Eau Claire Formation: complexities of a carbon storage system sealLithologic, mineralogical, and petrophysical characteristics, eau claire formation. Environ. Geosci. 19, 81–104. doi: 10.1306/eg.02081211014
Noiriel, C., Renard, F., Doan, M. L., and Gratier, J. P. (2010). Intense fracturing and fracture sealing induced by mineral growth in porous rocks. Chem. Geol. 269, 197–209. doi: 10.1016/j.chemgeo.2009.09.018
Renard, F., Bernard, D., Thibault, X., and Boller, E. (2004). Synchrotron 3D microtomography of halite aggregates during experimental pressure solution creep and evolution of the permeability. Geophys. Res. Lett. 31:L07607. doi: 10.1029/2004GL019605
Renard, F., Cordonnier, B., Dysthe, D. K., Boller, E., Tafforeau, P., and Rack, A. (2016). A deformation rig for synchrotron microtomography studies of geomaterials under conditions down to 10 km depth in the Earth. J. Synchrot. Rad. 23, 1030–1034. doi: 10.1107/s1600577516008730
Renard, F., Ortoleva, P., and Gratier, J. P. (1997). Pressure solution in sandstones: influence of clays and dependence on temperature and stress. Tectonophysics 280, 257–266. doi: 10.1016/s0040-1951(97)00039-5
Tsang, C. F. (1991). Coupled hydromechanical-thermochemical processes in rock fractures. Rev. Geophys. 29, 537–551.
Tudisco, E., Andò, E., Cailletaud, R., and Hall, S. A. (2017). TomoWarp2: a local digital volume correlation code. SoftwareX 6, 267–270. doi: 10.1016/j.softx.2017.10.002
Voltolini, M., and Ajo-Franklin, J. (2020). Evolution of propped fractures in shales: the microscale controlling factors as revealed by in situ X-Ray microtomography. J. Petrol. Sci. Eng. 188:106861. doi: 10.1016/j.petrol.2019.106861
Voltolini, M., Barnard, H., Creux, P., and Ajo-Franklin, J. (2019). A new mini-triaxial cell for combined high-pressure and high-temperature in situ synchrotron X-ray microtomography experiments up to 400° C and 24 MPa. J. Synchrot. Rad. 26(Pt 1), 238–243. doi: 10.1107/s1600577518015606
Voltolini, M., Haboub, A., Dou, S., Kwon, T. H., MacDowell, A. A., Parkinson, D. Y., et al. (2017a). The emerging role of 4D synchrotron X-ray micro-tomography for climate and fossil energy studies: five experiments showing the present capabilities at beamline 8.3. 2 at the Advanced light source. J. Synchrot. Rad. 24, 1237–1249. doi: 10.1107/s1600577517012449
Voltolini, M., Kwon, T. H., and Ajo-Franklin, J. (2017b). Visualization and prediction of supercritical CO2 distribution in sandstones during drainage: an in situ synchrotron X-ray micro-computed tomography study. Intern. J. Greenhouse Gas Control 66, 230–245. doi: 10.1016/j.ijggc.2017.10.002
Wan, J., Tokunaga, T. K., Ashby, P. D., Kim, Y., Voltolini, M., Gilbert, B., et al. (2018). Supercritical CO2 uptake by nonswelling phyllosilicates. Proc. Natl. Acad. Sci. U.S.A. 115, 873–878. doi: 10.1073/pnas.1710853114
Wenk, H. R., Voltolini, M., Mazurek, M., Van Loon, L. R., and Vinsot, A. (2008). Preferred orientations and anisotropy in shales: callovo-oxfordian shale (France) and Opalinus Clay (Switzerland). Clays Clay Min. 56, 285–306. doi: 10.1346/ccmn.2008.0560301
Wolter, K. E. (2003). Rock mechanical analyses (RA) experiment: petrophysical analyses of drill cores from the Opalinus clay formation at the Mont Terri laboratory. Swiss Natl. Hydrol. Geol. Survey.
Yasuhara, H., and Elsworth, D. (2008). Compaction of a rock fracture moderated by competing roles of stress corrosion and pressure solution. Pure Appl. Geophys. 165, 1289–1306. doi: 10.1007/s00024-008-0356-2
Yasuhara, H., Elsworth, D., and Polak, A. (2004). Evolution of permeability in a natural fracture: significant role of pressure solution. J. Geophys. Res. Solid Earth 109:B03204.
Zhang, C. L. (2011). Experimental evidence for self-sealing of fractures in claystone. Phys. Chem. Earth Parts A/B/C 36, 1972–1980. doi: 10.1016/j.pce.2011.07.030
Zhang, C. L., Wieczorek, K., and Xie, M. L. (2009). “Swelling experiments on mudrocks,” in Proceedings of the International Symposium On Unsaturated Soil Mechanics And Deep Geological Nuclear Waste Disposal (UNSAT-WASTE 2009), New York, NY.
Keywords: opalinus clay, fracture sealing, caprocks, in situ synchrotron X-ray micro-computed tomography, digital rock physics
Citation: Voltolini M and Ajo-Franklin JB (2020) The Sealing Mechanisms of a Fracture in Opalinus Clay as Revealed by in situ Synchrotron X-Ray Micro-Tomography. Front. Earth Sci. 8:207. doi: 10.3389/feart.2020.00207
Received: 18 June 2019; Accepted: 19 May 2020;
Published: 16 June 2020.
Edited by:
Marie Estelle Solange Violay, École Polytechnique Fédérale de Lausanne, SwitzerlandReviewed by:
Paul Josef Bossart, Swisstopo, SwitzerlandBen Laurich, Federal Institute for Geosciences and Natural Resources, Germany
Copyright © 2020 Voltolini and Ajo-Franklin. This is an open-access article distributed under the terms of the Creative Commons Attribution License (CC BY). The use, distribution or reproduction in other forums is permitted, provided the original author(s) and the copyright owner(s) are credited and that the original publication in this journal is cited, in accordance with accepted academic practice. No use, distribution or reproduction is permitted which does not comply with these terms.
*Correspondence: Marco Voltolini, bXZvbHRvbGluaUBsYmwuZ292