
94% of researchers rate our articles as excellent or good
Learn more about the work of our research integrity team to safeguard the quality of each article we publish.
Find out more
ORIGINAL RESEARCH article
Front. Earth Sci., 10 June 2020
Sec. Interdisciplinary Climate Studies
Volume 8 - 2020 | https://doi.org/10.3389/feart.2020.00199
 Chantelle Burton1*†
 Richard A. Betts1,2†
 Chris D. Jones1†
 Ted R. Feldpausch3†
 Manoel Cardoso4†
 Liana O. Anderson5†
El Niño years are characterized by a high sea surface temperature anomaly in the Equatorial Pacific Ocean, which leads to unusually warm and dry conditions over many fire-prone regions globally. This can lead to an increase in burned area and emissions from fire activity, and socio-economic, and environmental losses. Previous studies using satellite observations to assess the impacts of the recent 2015/16 El Niño found an increase in burned area in some regions compared to La Niña years. Here, we use the dynamic land surface model JULES to assess how conditions differed as a result of the El Niño by comparing simulations driven by observations from the year 2015/16 with mean climatological drivers of temperature, precipitation, humidity, wind, air pressure, and short and long-wave radiation. We use JULES with the interactive fire module INFERNO to assess the effects on precipitation, temperature, burned area, and the associated impacts on the carbon sink globally and for three regions: South America, Africa, and Asia. We find that the model projects a variable response in precipitation, with some areas including northern South America, southern Africa and East Asia getting drier, and most areas globally seeing an increase in temperature. As a result, higher burned area is simulated with El Niño conditions in most regions, although there are areas of both increased and decreased burned area over Africa. South America shows the largest fire response with El Niño, with a 13% increase in burned area and emitted carbon, corresponding with the largest decrease in carbon uptake. Within South America, peak fire occurs from August to October across central-southern Brazil, and temperature is shown to be the main driver of the El Niño-induced increase in burned area during this period. Combined, our results indicate that although 2015/16 was not a peak year for global total burned area or fire emissions, the El Niño led to an overall increase of 4% in burned area and 5% in emissions compared to a “No El Niño” scenario for 2015/16, and contributed to a 4% reduction in the terrestrial carbon sink.
The El Niño Southern Oscillation (ENSO) is a reasonably predictable mode of variability that occurs every 2–7 years, and can have a large impact on regular rainfall patterns and temperatures on a global scale. It is also the biggest driver of variability in the terrestrial carbon cycle, dominated by the response in the tropics (Cox et al., 2013; Betts et al., 2016). An ENSO event is defined as a Sea Surface Temperature (SST) anomaly compared to a baseline period of 1971–2000, centered on the equatorial Pacific Ocean in the Niño-3.4 region (5°N–5°S, 120°–170°W), that is 0.5°C, or larger over three consecutive months (Trenberth, 1997, and updated by NOAA, 2003; Larkin and Harrison, 2005; Yu et al., 2017). ENSO years are characterized by unusually warm SSTs (El Niño) or by unusually cold SSTs (La Niña) in the Equatorial Pacific ocean, but can have global impacts (Larkin and Harrison, 2005). The El Niño phase of ENSO commonly results in higher temperatures and reduced precipitation across the tropics, although the timing of this varies globally (Chen et al., 2017). This can lead to increases in fire and autotrophic respiration, and decreases in productivity. However, the impacts across continents can be variable, for example southern South America often experiences wetter conditions, while northern, and central-east regions experience drought (Grimm, 2003; Stauffer, 2015).
In the last 25 years, there have been two large El Niños, and a number of years with high SSTs. During 1997/98 and 2015/16, very high SST anomalies were recorded over Niño-3.4, while the years 2002/03, 2004/05, 2006/07, and 2009/10 also showed higher than average SSTs (NOAA CPC1). The 2015/16 El Niño was one of the strongest on record, beating the previous highest 1997/98 record for Niño-3.4 Index, although showing lower Nino 3, and Nino 1 + 2 Eastern values (L’Heureux, 2016). There were initial signs of the developing El Niño in 2014 before meeting the official El Niño criteria in May 2015, peaking in late 2015, and ending in May 2016. The event has been associated with a large rise in global levels of CO2 (Betts et al., 2016), which one study used satellite-derived data to attribute to different factors that vary spatially: in tropical South America the cause was linked to a decrease in Gross Primary Productivity (GPP) and reduced carbon uptake from reduced precipitation; in tropical Asia the increase was linked to higher fire occurrence; and in Africa an increase in respiration led to increased carbon release (Liu et al., 2017). Other studies, however, show GPP as the main driver of carbon loss across the tropics as a whole, with a decline in photosynthesis (Bastos et al., 2018) and a 28% reduction in tree growth (Rifai et al., 2018; Santos et al., 2018) evident in the Amazon. A temperature rise of up to 3°C and annual rainfall anomalies of 200 mm below the long-term mean were recorded in east Amazonia (Malhi et al., 2018), which led to a decline in photosynthesis and resulted in a reduction in GPP (Luo et al., 2018). Anderson et al. (2018) show that repeated exposure to drought over the last 40 years has increased the sensitivity of Amazon vegetation, as demonstrated by increasingly negative Enhanced Vegetation Index anomalies, suggesting that Amazonia is becoming more vulnerable to extreme and repeated drought events (Feldpausch et al., 2016).
Fires depend on a combination of factors, including ignitions (anthropogenic, or natural ignitions from lightning), fuel (including vegetation), and meteorological conditions (higher temperatures, reduced precipitation, humidity, and soil moisture). One of the consequences of regional increases in temperature and drought is increased meteorological fire danger and fuel availability, which can lead to extreme wildfire events. CO2 accounts for in excess of 90% of global fire carbon emissions each year (∼2 PgC total emissions), which usually peaks during El Niño years (Eldering et al., 2017). In March 1998 for example, large fires associated with drought in the state of Roraima in Brazil burned nearly 12,000 km2 of forests and savannas, heavily affecting air quality, transportation and food production in urban and rural areas. Despite the effort of about 1500 fire fighters, these burnings were controlled only at the end of the month when precipitation returned (Kirchhoff and Escada, 1998). Recent research has shown that drought-induced fires in the Brazilian Amazon increased by 36% during the 2015/16 El Niño period according to MODIS data, with an estimated 523 TgCO2 from fire emissions in 2015 (Aragão et al., 2018). In Indonesia, more than 4.5 million hectares burned during the 2015 fire season, predominantly started deliberately for land clearance, and much of which was over high carbon emission-producing peatlands (Lohberger et al., 2018). Generally, overall fire emissions in pan-tropical forests have increased by 133% in El Niño years compared to La Niña years over 1997–2016 (Chen et al., 2017). Fires are important contributors to the carbon cycle through fire emissions which contribute to atmospheric greenhouse gas concentrations. In addition, forests impacted by fires may not recover their original carbon stock, resulting in a net positive carbon contribution to the atmosphere (Silva et al., 2018).
While a clear link has been found between the 2015/16 El Niño and an increase in satellite and radar-detected fire events across a number of pan-tropical regions, a model-based assessment of the full impact of the El Niño on drivers of fire and terrestrial carbon uptake using a coupled fire-vegetation model has not yet been done. Using interactive fire and vegetation within a land surface model enables us to assess the impacts of the 2015/16 El Niño compared to a mean climatology representing a “No El Niño” state, allowing a comprehensive investigation into the impacts of the El Niño across a range of variables and their associated drivers.
Here we use the coupled fire-vegetation model JULES-INFERNO (Clark et al., 2011; Mangeon et al., 2016; Burton et al., 2019) to investigate the impact of the 2015/16 El Niño on fire globally and in three regions, South America, Africa, and Asia, compared with a “No El Niño” baseline. First, we assess model performance against observations, and then consider the change in burned area and emissions due to the El Niño, before exploring the underlying drivers of burned area. We then assess the resultant impact on the carbon sink globally and regionally, taking fire into account. The advantage of using a model over observations for this study is that we can represent 2015/16 land surface and levels of CO2 in both experiments, while altering the climatology in one to represent an average year as if the El Niño had not occurred. This makes a direct comparison possible between an “El Niño” and a “No El Niño” state for the 2015/16 period. It also enables factorial experiments to be used to understand dominant climatological drivers, where one variable can be modified while all other conditions are kept constant. Here, we vary first temperature and then precipitation to attribute the change to one dominant driver.
We use the land surface model JULES (Joint UK Land Environment Simulator; Clark et al., 2011) based on the JULES-C configuration here, coupled with INFERNO (INteractive Fire and Emission algoRithm for Natural envirOnments; Mangeon et al., 2016). We used JULES vn4.9 with coupled fire and vegetation as described in Burton et al. (2019) for the initial experiments, and then updated to JULES vn 5.4 including varying mortality by plant functional type (PFT), which is here set to 40% for trees, 60% for shrubs, and 100% for grasses to achieve improved levels of present day vegetation carbon. The results of the experiment were not affected by the version of JULES used. We use varying ignitions from population density data from HYDE (Hurtt et al., 2011) and monthly LIS-OTD (Lightning Imaging Sensor – Optical Transient Detector) observations for 2013 from NASA (Christian et al., 2003) for lightning ignitions to calculate burned area. JULES-INFERNO simulates flammability using temperature, precipitation and calculated relative humidity from the driving data, and fuel density, soil moisture and saturation vapor pressure simulated internally by JULES. Flammability is multiplied by ignitions from lightning and population density, together with an average burnt area per PFT, to simulate burned area by PFT and gridbox as described in Mangeon et al. (2016). We use observations of burned area and fire emissions from GFED4.1s (Global Fire Emissions Database, including small fires; van der Werf et al., 2017) for comparison with the model. We include varying land use as described in Burton et al. (2019) from HYDE 3.2 (History Database of the Global Environment; Klein Goldewijk et al., 2017), updated to include 2013–2016 as part of the Global Carbon budget (Le Quéré et al., 2018), and dynamic vegetation. The model is run at a spatial resolution of N96 (1.25° latitude × 1.875° longitude). We use 6-hourly climatology from CRU-NCEP v7 (Harris et al., 2014; Viovy, 2018) to drive JULES, including CO2, precipitation, temperature, specific humidity, wind, air pressure, and short and long wave radiation which models the observed 2015/16 El Niño.
We ran the model from 1860–2016 with this forcing, and then again using the mean climatology from the previous 10 years (2005–2014) for all variables except CO2. This is considered to represent a reasonable approximation to standard baseline conditions for 2015/16 without the El Niño event occurrence (Betts et al., 2018), referred to in the results as “No El Niño.” The experimental design used here is intended for use in investigating the impacts driven by the occurrence of the 2015/2016 El Niño, compared with the same period without the observed SST anomaly, ensuring CO2 and land cover dynamics are comparable. The period of 2005–2014 is chosen to ensure conditions are as similar as possible to 2015/16 in terms of climate and CO2 levels, while 10 years is chosen to even out anomalous years. We can define the 2015/16 perturbation as dominated by the significant El Niño, and study the impacts against a 10-year baseline. Changes referred to as “due to El Niño” throughout this study are calculated as absolute change between the two model conditions (El Niño – No El Niño), or as percentage change (El Niño – No El Niño/No El Niño ×100). We select the period July 2015–June 2016 to study the impacts over 12 months covering the peak El Niño. This period is slightly later than the official El Niño period to capture some of the lag effect in fire response as identified by Chen et al. (2017).
We perform an additional factorial experiment to test whether temperature or precipitation is the largest driver of change. We create two new simulations, the first just using the precipitation associated with observed El Niño together with the mean climatology for other climatic variables, “ENSO-Precip,” and the second just using the temperature associated with the El Niño together with the mean climatology of other variables, “ENSO-Temp.” We then use Net Biome Productivity (NBP) to assess the impact of the El Niño on the carbon sink. NBP is calculated here as Net Primary Productivity (NPP) minus soil respiration, wood product emissions from land-use change, and fire emissions. The percentage contribution of inputs respiration, fire and NPP to NBP is calculated as (change in input)/(change in NBP) ×100. We first analyze the results globally, and then for three fire-prone regions: South America, Africa, and Asia.
We first consider the model performance against observations. Spatially JULES-INFERNO captures the global pattern well, with high burned area over Africa, South America, and Northern Australia (Figure 1). However, the lower burned area fraction over Africa compared to observations is compensated by higher burned area in other areas, including India and United States which is not seen in the observations, giving the right approximate global total while maintaining some regional errors (see also Figure 2).
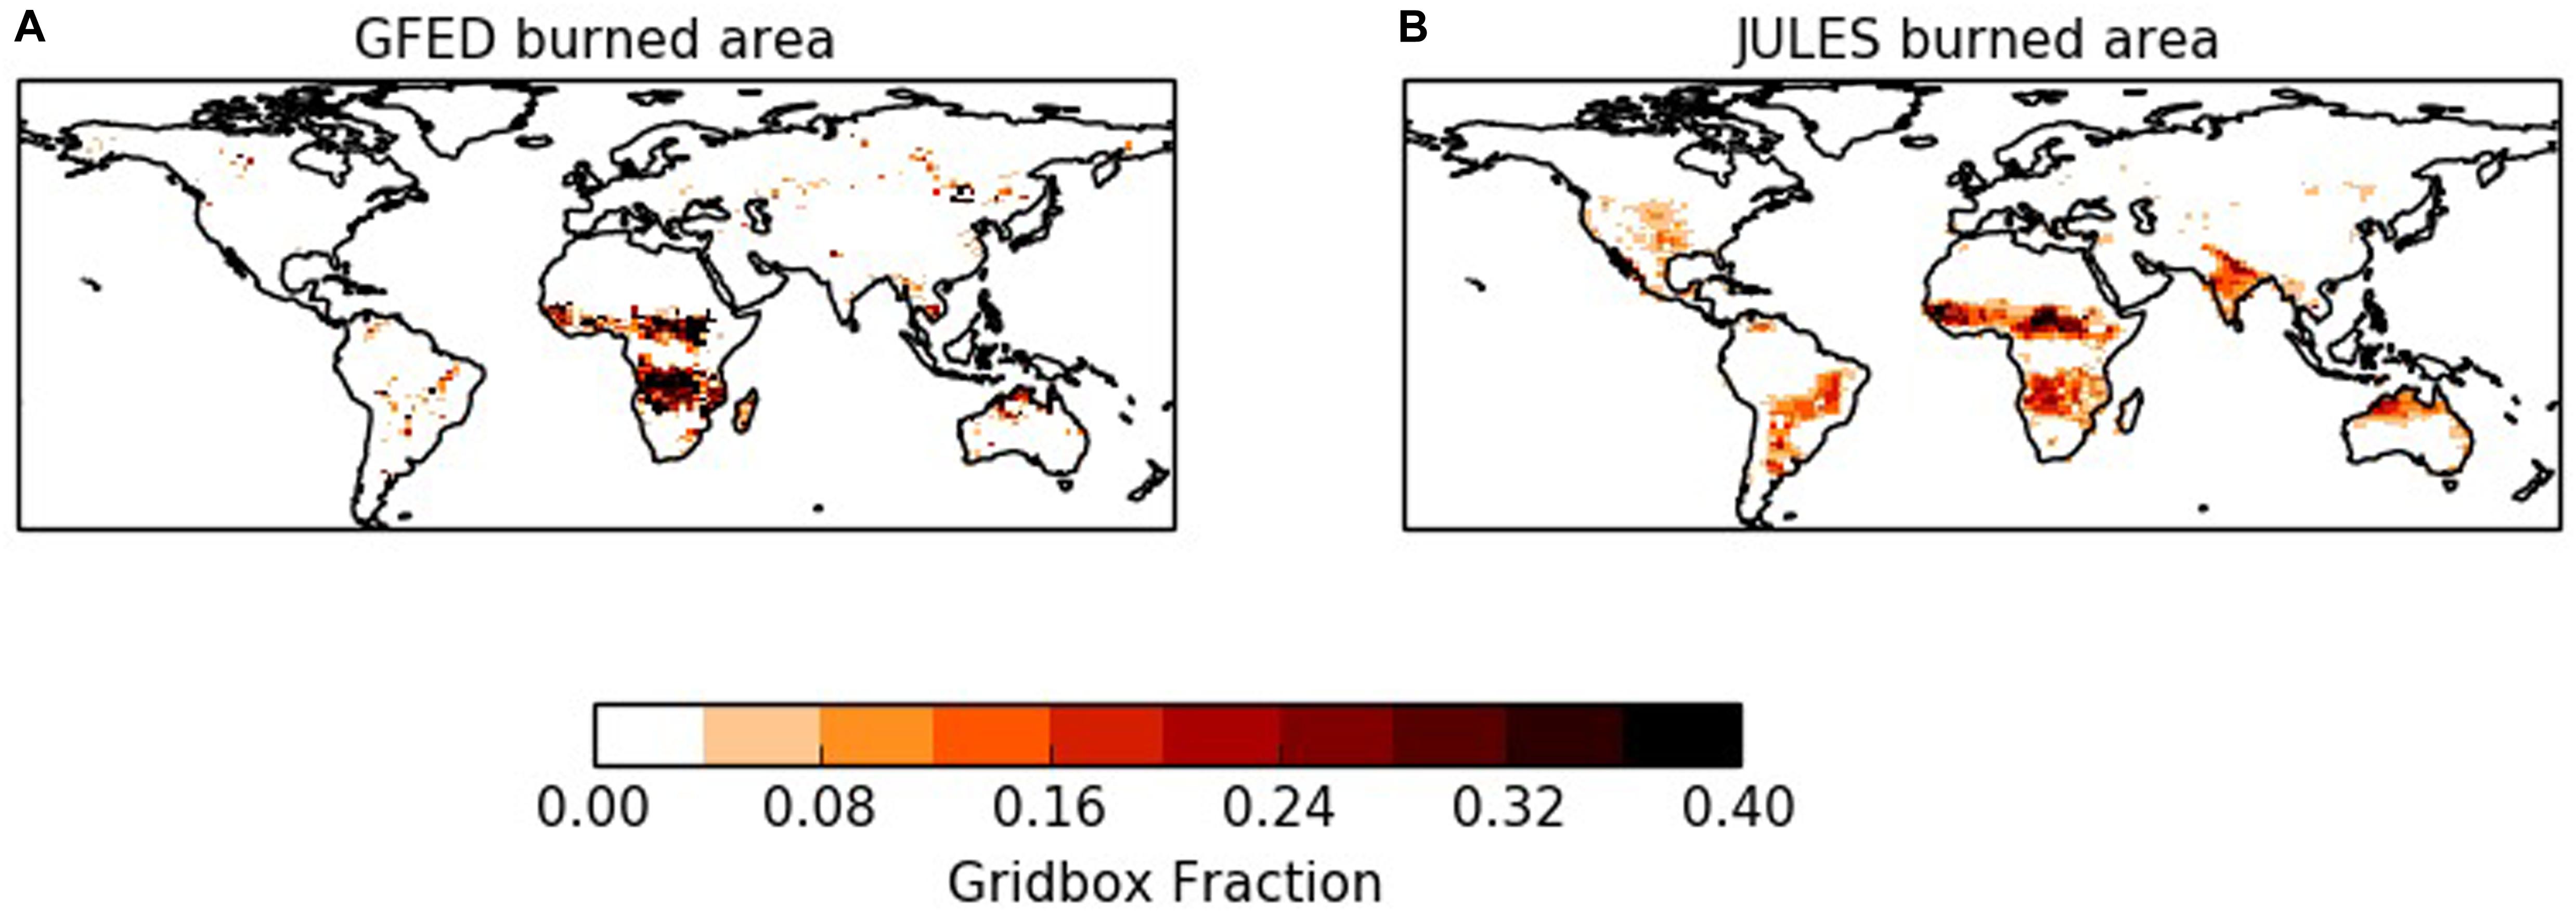
Figure 1. Gridbox total burned area from GFED observations (A) and as modeled by JULES-INFERNO (B), July 2015–June 2016.
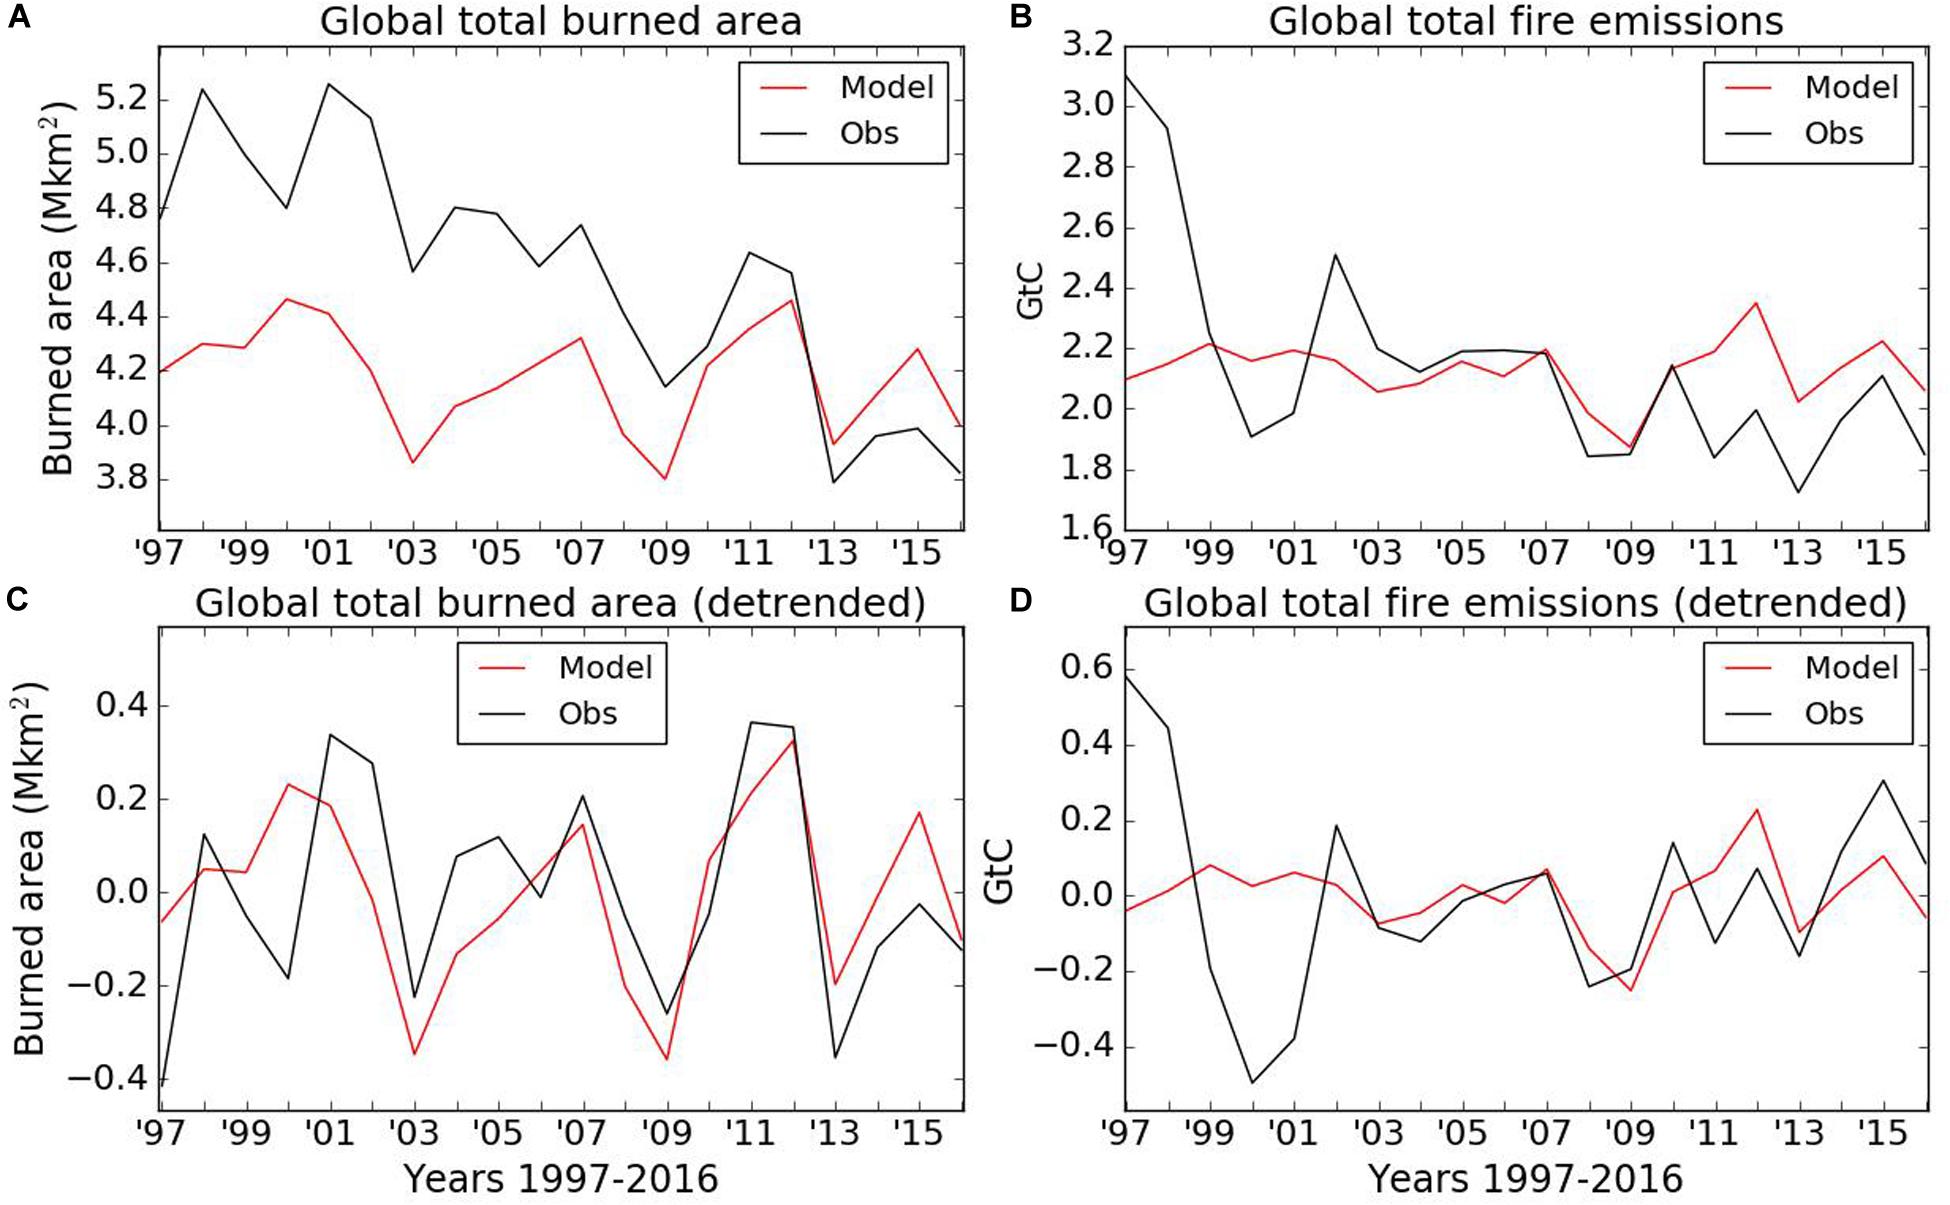
Figure 2. Burned area (left column) and emitted carbon from fires (right column) simulated by JULES-INFERNO (red) with GFED observations (black), 1997–2016. Top plots show total burned area, bottom plots show de-trended data. Burned area (left column A and C) and emitted carbon from fires (right column B and D) simulated by JULES-INFERNO (red) with GFED observations (black) 1997-2016. Top plots (A,B) show total burned area, bottom plots (C,D) show de-trended data.
Andela et al. (2017) have shown that global burned area has declined in the last 20 years, with the largest decline in African savannas due to change in land management practices and increasing use of agriculture. These factors are not currently included in most fire models, and therefore this decline is not captured in the global time series (Figures 2A,B). However, detrending the data by simple linear regression to remove the anthropogenic-driven decline shows that JULES-INFERNO simulates interannual variability well compared to observations, and simulates approximately the correct present-day global total burned area and fire emissions.
Compared with GFED observations of burned area for the period July 2015–June 2016, the model simulates burned area and emissions in the same order of magnitude, and approximately captures the timing of the seasonal cycle (Figures 3A,B). The peak burned area in August and the decline in emissions in November is correctly simulated, although the amplitude of the seasonal cycle is weaker than the observations. However, the global decline in burned area in January is not well modeled (Figure 3A). This is because the high burned area and emissions in Africa dominates the global signal, and this decrease occurs just after peak burning in December and January in northern hemisphere Africa (Laris et al., 2016; Figures 3C,D), reducing the global total. In general, burnt area is under-simulated in Africa and over-simulated in South America (Figure 3C), but while the peak in regional emissions is not captured in the model, other months particularly in Asia and South Africa are reasonably represented (Figure 3D).
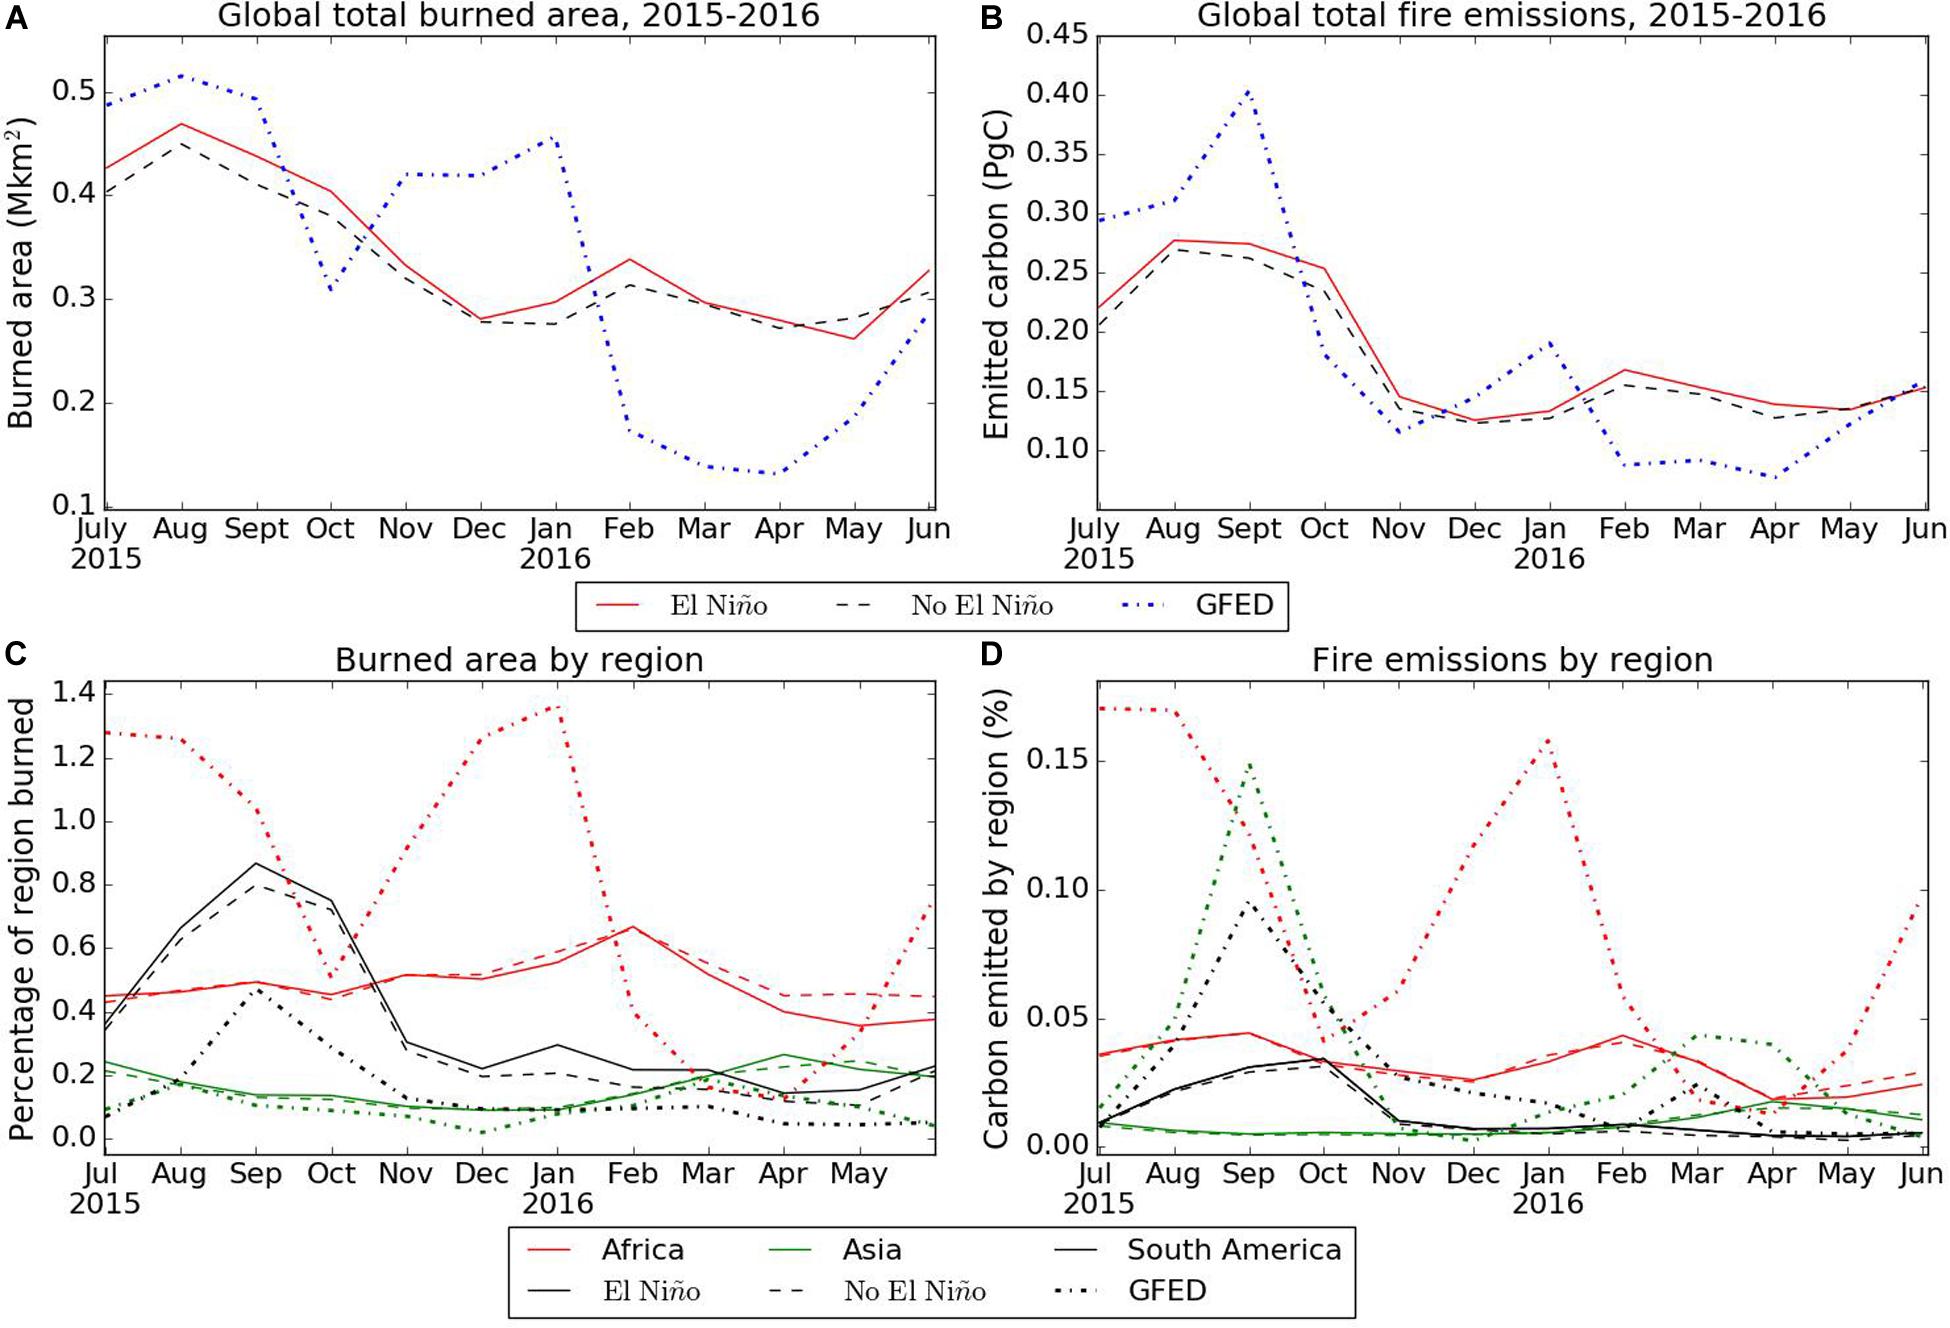
Figure 3. Monthly modeled burned area and emitted carbon with observations July 2015–June 2016. Top row: Global total burned area (Mkm2; A) and emitted carbon (PgC; B) as modeled by JULES-INFERNO with El Nino (red solid) and without El Nino (black dashed) and from GFED 4.1s observations 2015/16 (blue dot/dash). Bottom row: Modeled percentage of region burned (C) and percentage of carbon emitted from total vegetation and soil carbon by region (D).
Focusing now on the changes due to the El Niño, the percentage increase in burned area shows the areas of highest change as northern South America, southern United States and central/southern Australia which see up to 100% increase in some regions (Figure 4). Decreases in burned area are seen across Canada, the Sahara and Southern Africa, and East Asia, although these are mostly smaller than the increases (see Supplementary Material for values of change in gridbox fraction).
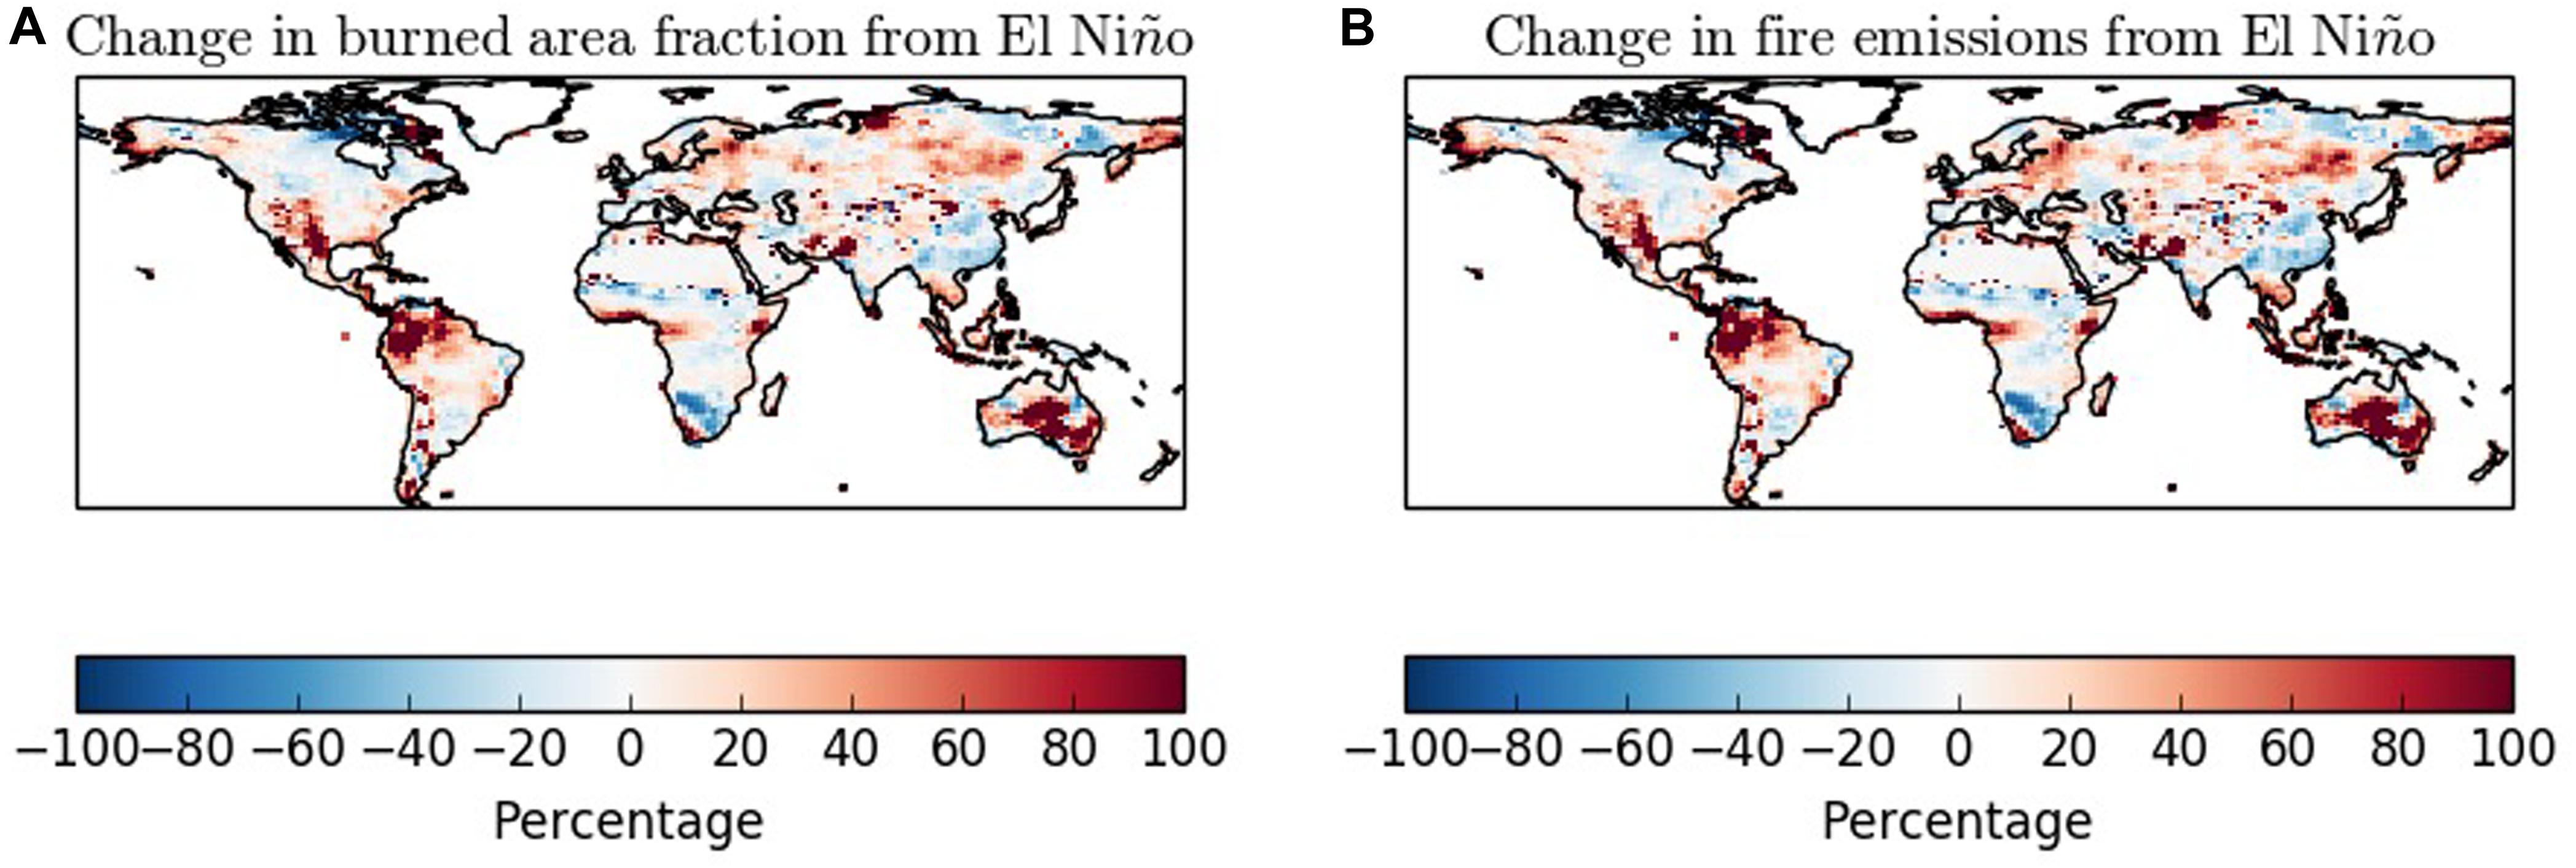
Figure 4. Change in burned fraction (A) and fire emissions (B) due to El Niño, July 2015–June 2016 simulated by JULES-INFERNO.
Out of each of the three regions considered, South America has the largest change in burned area and emitted carbon due to El Niño conditions, with a 12.738% increase in burned area and a 13.043% increase in fire emissions (Table 1). Africa has an overall decrease in burned area (−4.442%) and emissions (−1.415%). The tropics as a whole shows a slight increase in burned area (2.031%), and a larger increase in emissions with El Niño compared to without the El Niño (5.574%). There is a global total increase of 4.132% in burned area, and 4.911% in emissions.
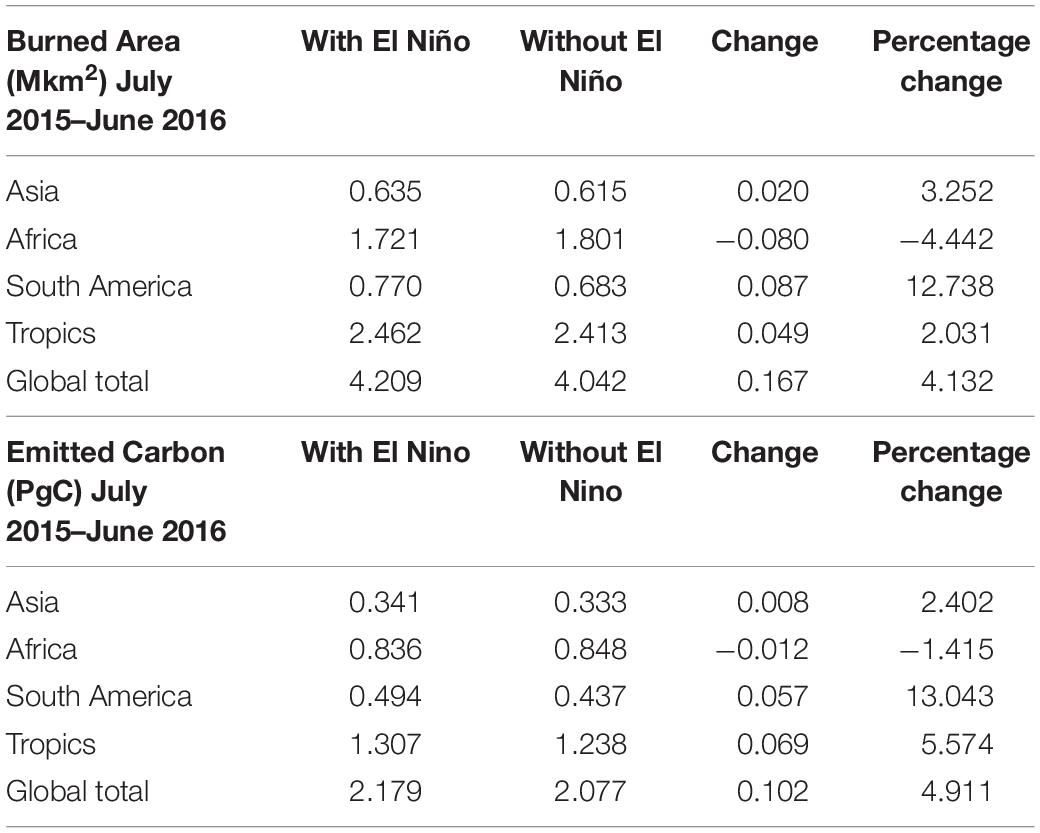
Table 1. Burned area and emitted carbon globally and by region, with and without El Niño for total burned area (Mkm2) and emitted carbon (PgC) simulated by JULES-INFERNO.
What is apparent from GFED observations is that 2015/16 was not a significant year for global total burned area, contrary to the previous El Niño year 1997/98, although emissions were higher than average (2A,B, Figures 5). However, the impacts of El Niño events are spatially heterogeneous, with some areas presenting hotter and drier conditions, and some experiencing increased rainfall. This results in areas of increased burned area in some regions, and areas of decrease in other regions, which impacts the global mean. The fires of the 1997/98 El Niño were dominated by widespread peatland fires, particularly in Indonesia (Page et al., 2002) which drove unusually high emissions that year (Figure 5B). However, JULES-INFERNO does not yet include peatlands and therefore we would not expect to see this spike reflected in the model results.
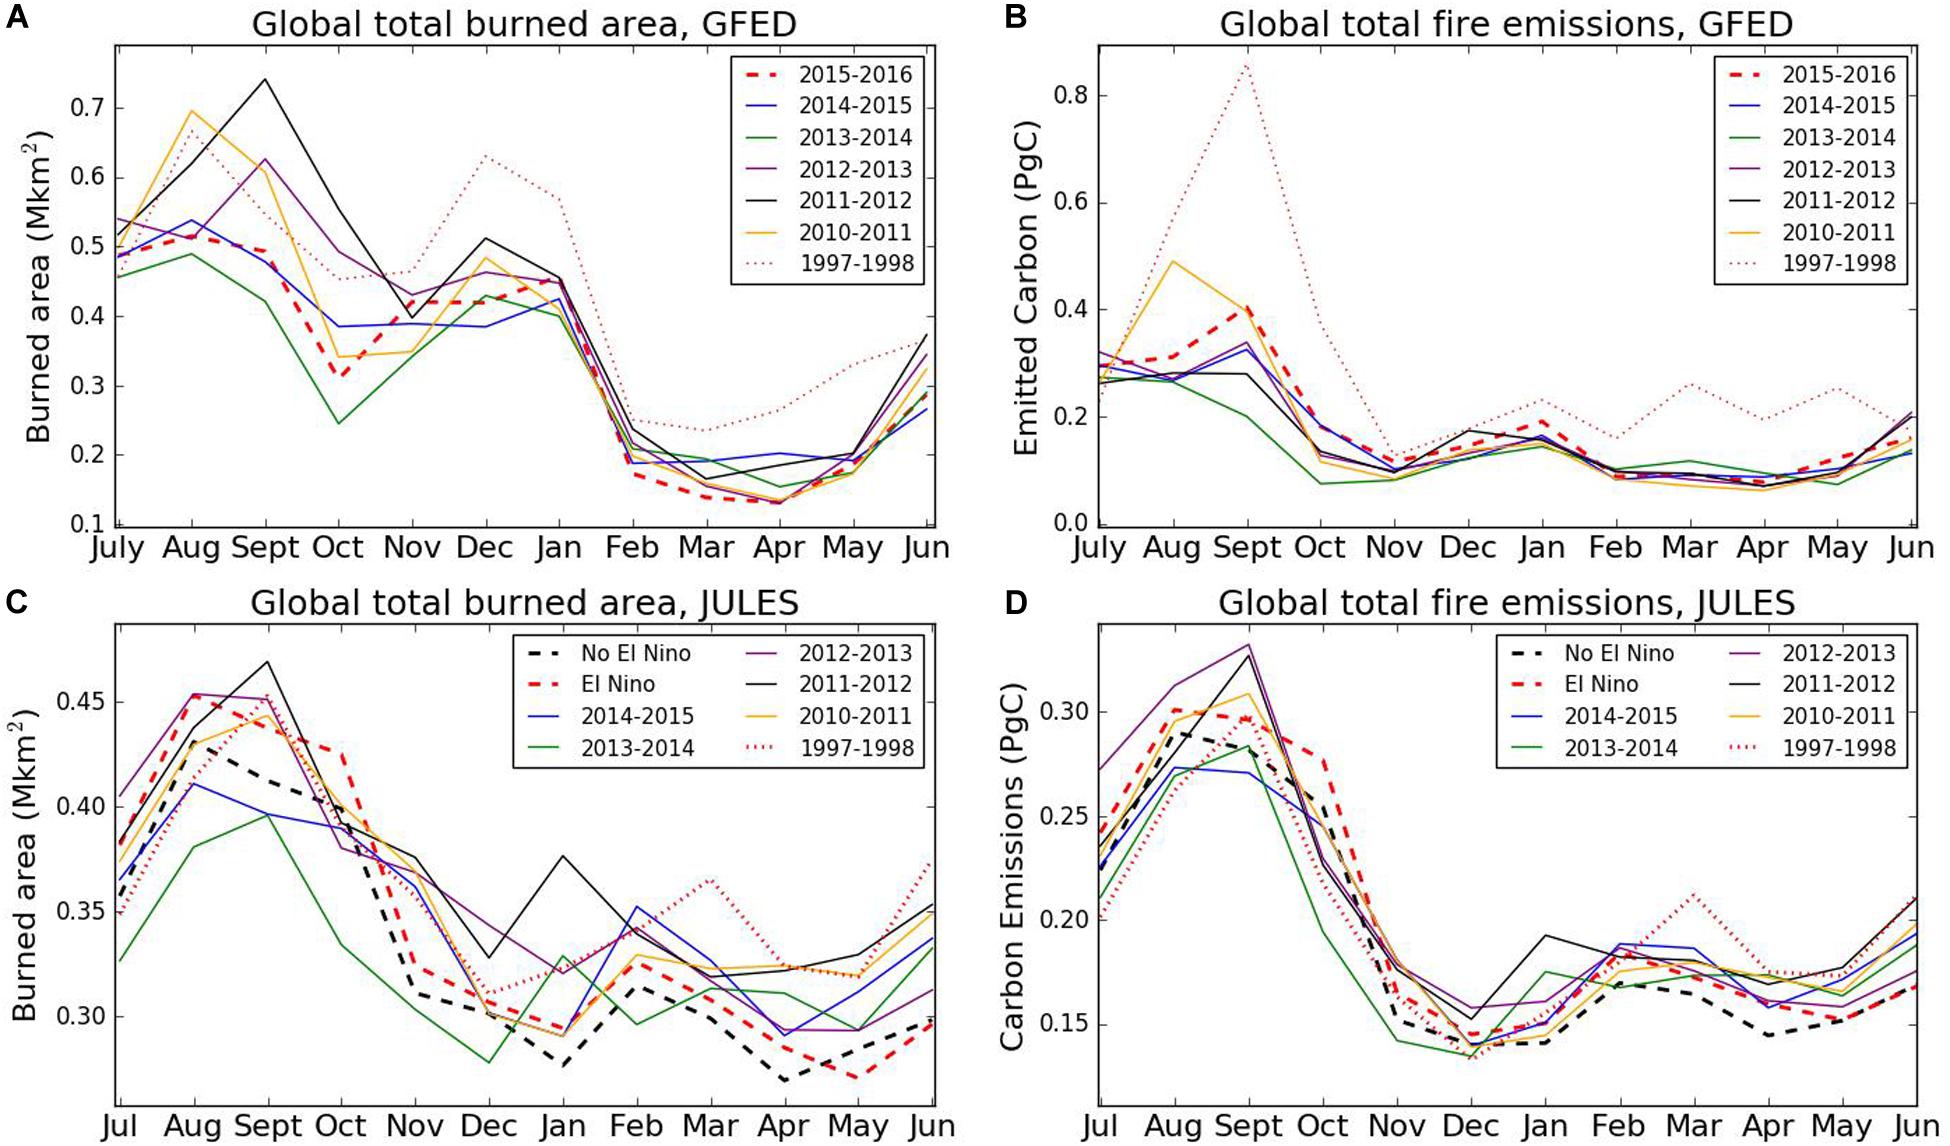
Figure 5. GFED4.1s observations of global burned area (A) and fire emissions (B), and JULES-INFERNO simulated global burned area (C) and fire emissions (D), July–June from 2010 to 2016, plus 1997/98 (dotted). 2015–2016 is shown in red dashed (El Niño), and black dashed (No El Niño).
Considering the key drivers of the change in burned area, across the north of the South American continent there was an increase in temperature and a decrease in precipitation and soil moisture due to the El Niño (Figure 6). These hotter, drier conditions are typical of the impacts that we expect to see with a strong El Niño (Foley et al., 2002), and have been linked to an increase in fire (van der Werf et al., 2004). The change in burned area across Africa, however, is more variable, with some regions showing an increase and some showing a decrease. Across the northern half of the continent the variability is in line with changes in precipitation, soil moisture and temperature, but there is a strong signal of decreased burned area in the far south which does not fit this trend. In this region the precipitation and soil moisture are lower, and temperature is higher compared to the mean climatology, which would usually be expected to lead to higher burned area.
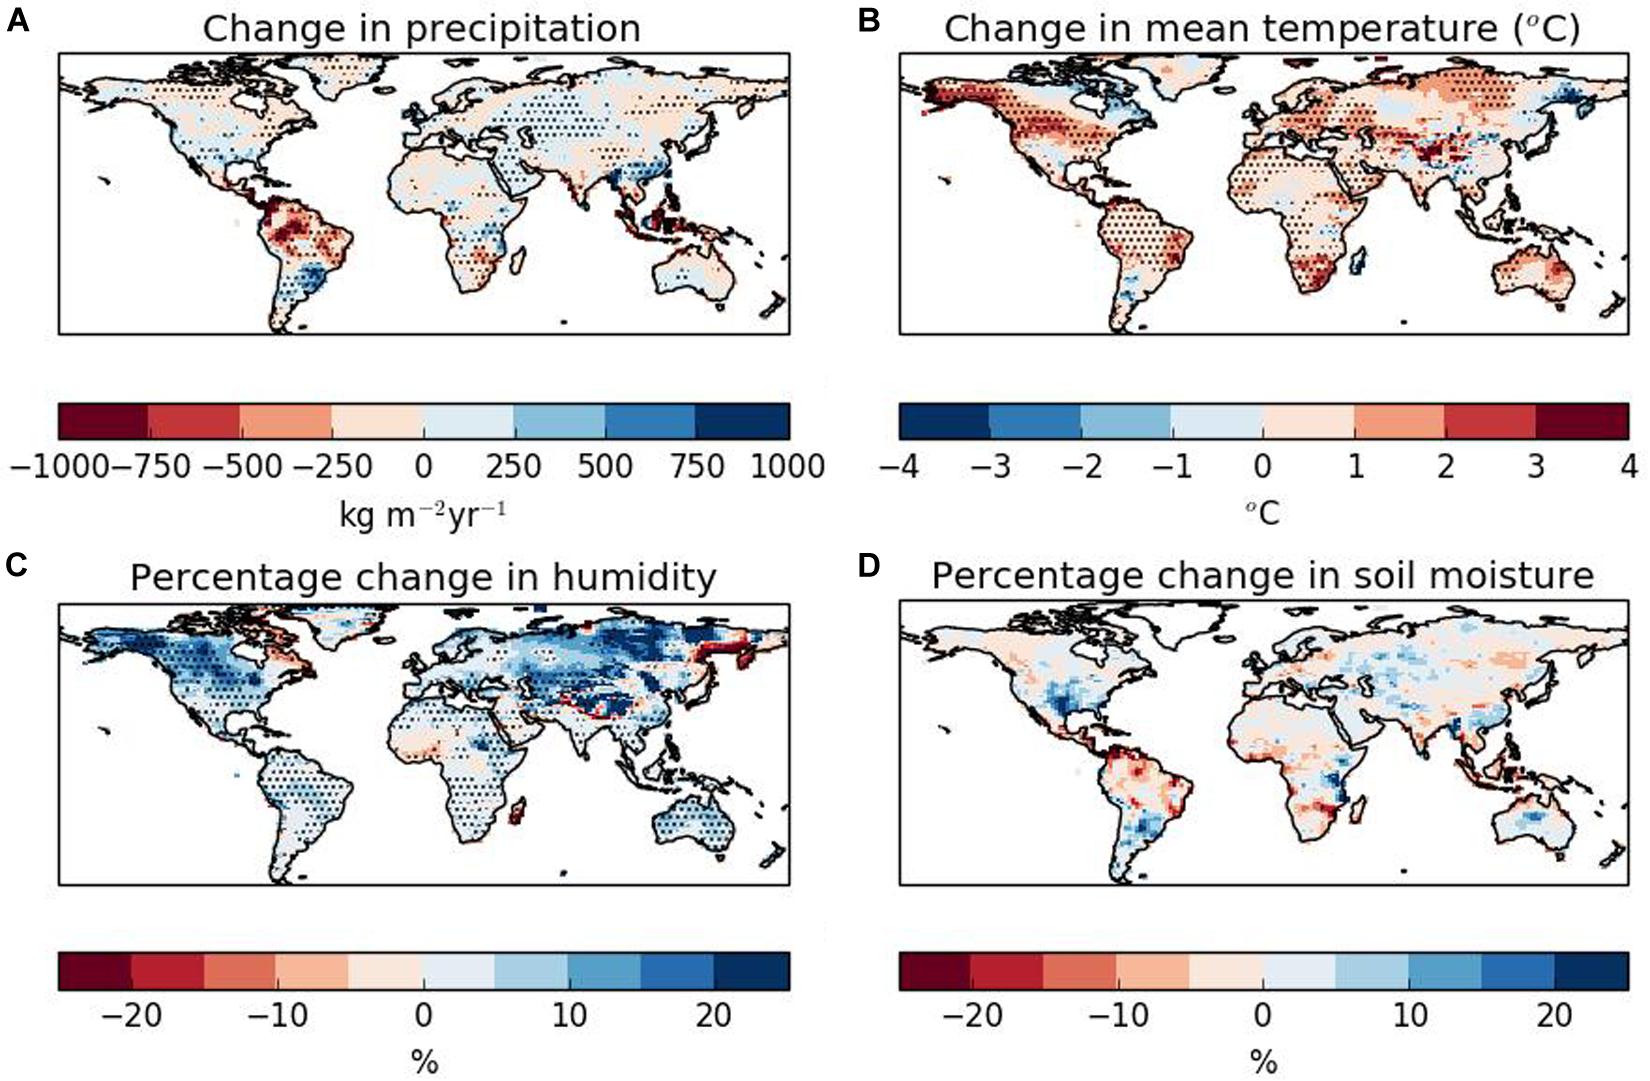
Figure 6. Drivers of burned area with El Niño, July 2015–June 2016. From CRU-NCEP driving data: Percentage change in annual precipitation (A), change in mean temperature (B), and percentage change in specific humidity (C). Stippling indicates where the change is large compared to natural variability across 2005–2014 (greater than two standard deviations). Modeled by JULES: percentage change in soil moisture (D).
There is a corresponding decrease in flammability of grasses across this region of Southern Africa (Figure 7). The meteorological conditions do not seem to be a major driver in this region (Figure 6), indicating a decline in fuel availability in the form of fraction of grasses may be driving the decrease in burned area. This is an area of semi-desert, so fuel is an important factor in burned area here. A similar decrease is seen in NPP and NBP (see section “Terrestrial carbon sink”), which supports this. A signal of the opposite sign is observable in Australia, indicating an increase in fuel corresponding to an increase in precipitation.

Figure 7. Change in flammability due to El Niño for trees (A) and grasses (B) simulated by JULES-INFERNO.
To understand whether temperature or precipitation is the largest driver of burned area, we perform two new simulations using only the precipitation and only the temperature associated with observed El Niño together with the mean climatology for other climatic variables, referred to as “ENSO-Precip” and “ENSO-Temp,” respectively. We consider the results globally, and for South America as the region with the largest change in burnt area (Table 1) and a major net source of carbon in the 2015/16 El Niño (Rödenbeck et al., 2018).
Temperature is a larger driver of burned area than precipitation in this experiment both globally and for South America (Figure 8), which is also supported by observational studies of increases in fire (Silva et al., 2019). Considering South America, temperature is an important driver of burned area during the peak fire season August-October, but toward the end of the El Niño period over February-June this changes to precipitation being the more important driver. This coincides with the wet season in central Brazil, indicating that reduction in precipitation in the wet season is a more important driver of fire than in the dry season where it is already hot, dry and fire-prone. Humphrey et al. (2018) identify soil moisture as a dominant driver, however, Jung et al. (2017) show that on a local scale, precipitation is an important driver of changes in GPP and Net Ecosystem Exchange, whereas at larger spatial scales temperature is a more important driver. Their results indicate that water availability increases both GPP and respiration; therefore on a local scale water availability is the primary driver of carbon fluxes, but the two anomalies compensate on a larger scale and so temperature emerges as the stronger driver. The results here showing temperature as the dominant driver on large spatial scales may be reflective of this principle.
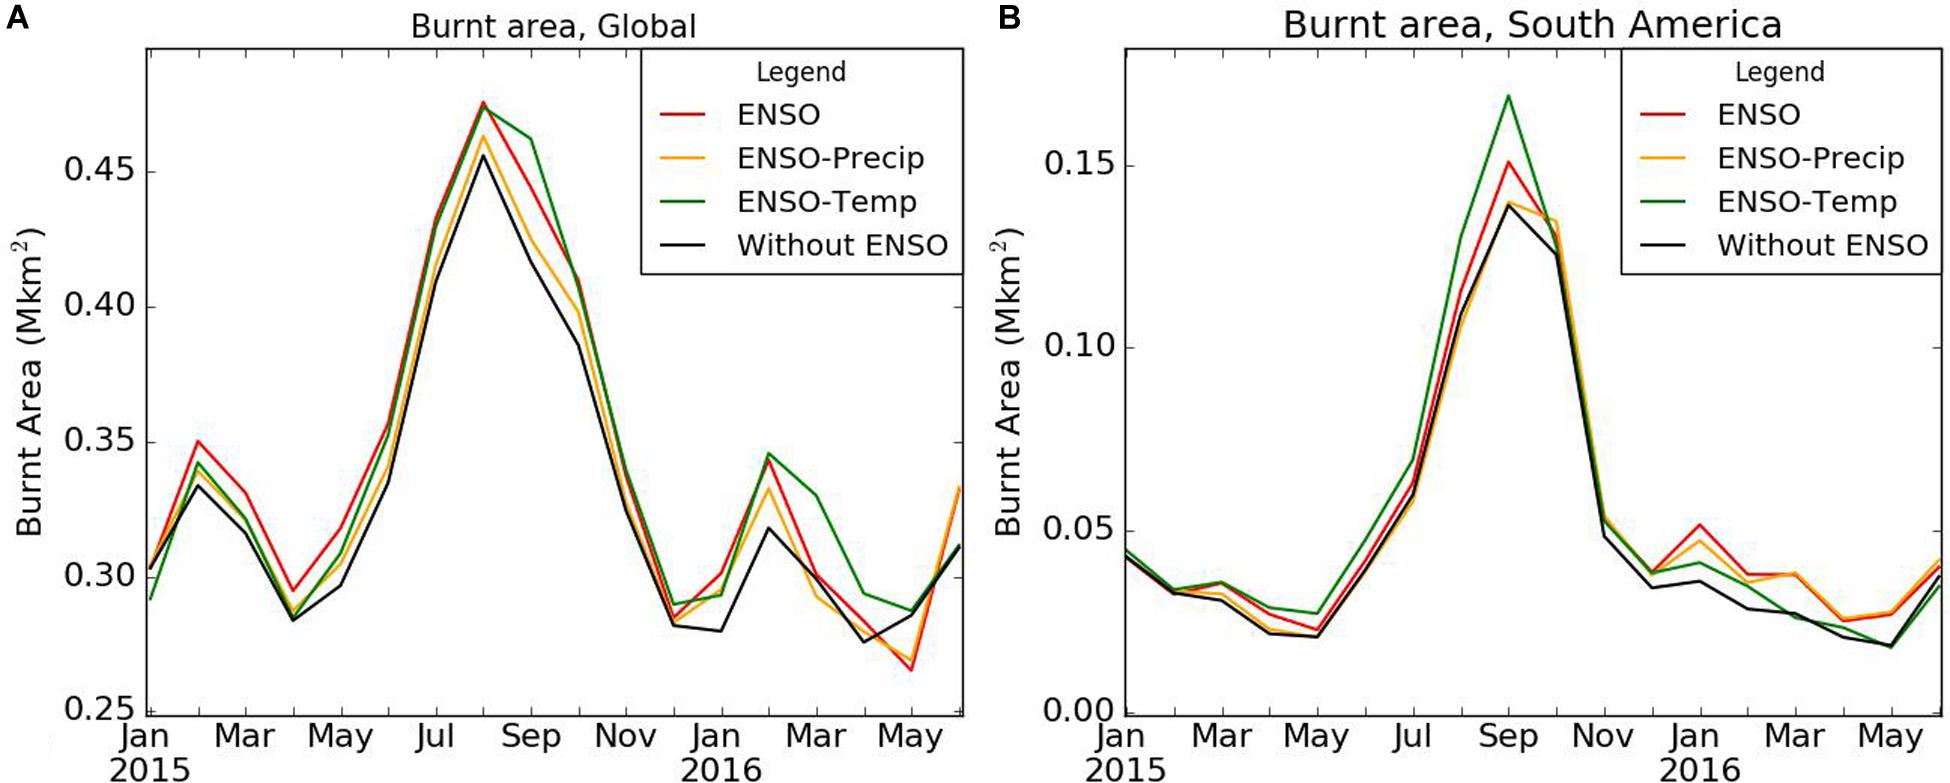
Figure 8. Drivers of burned area globally (A) and for South America (B) from January 2015–June 2016 simulated by JULES-INFERNO.
Typically during an El Niño, carbon uptake in the terrestrial system is decreased due to lower GPP, increased respiration, and increased fire activity (Liu et al., 2017). Here we use NBP to assess the impact of the 2015/16 El Niño on the carbon cycle. NBP is a measure of the net carbon accumulated in an ecosystem and can therefore be a useful indicator of the change in the carbon sink. A negative NBP indicates that an ecosystem is a net emitter of carbon, which can happen under conditions such as large El Niño events where carbon uptake is reduced because of higher temperatures negatively impacting photosynthesis, and due to higher fire occurrence.
Negative NBP is seen particularly in the southern hemisphere, including South America, Southern Africa, India, Australia, and also over central Europe, while North America and across Russia show mainly positive NBP (Figure 9A). The main losses of carbon as indicated by reduction in NBP are seen across South America and southern Africa, with other areas of loss including Western Europe, Asia, and northern Australia (Figure 9B).

Figure 9. Global Net Biome Productivity (NBP) July 2015–June 2016 (A), and change in NBP due to El Niño (B) simulated by JULES-INFERNO.
The drivers of the reduction in NBP are spatially heterogeneous (Figure 10). While there are reductions in respiration (Figure 10B) as well as NPP (Figure 10C) in some areas, the reductions in NPP are stronger and dominate the signal of NBP decrease. Fire emissions, while smaller, also contribute to the signal (Figures 10A,D) (see Supplementary Material for actual values of change). Table 2 shows the total NBP globally and by region with and without the El Niño, as well as the total change. There is an overall decrease in NBP with the El Niño, and out of the regions analyzed the decrease is the strongest in South America.

Table 2. Total and change in NBP Globally and by region, with and without El Niño simulated by JULES-INFERNO.
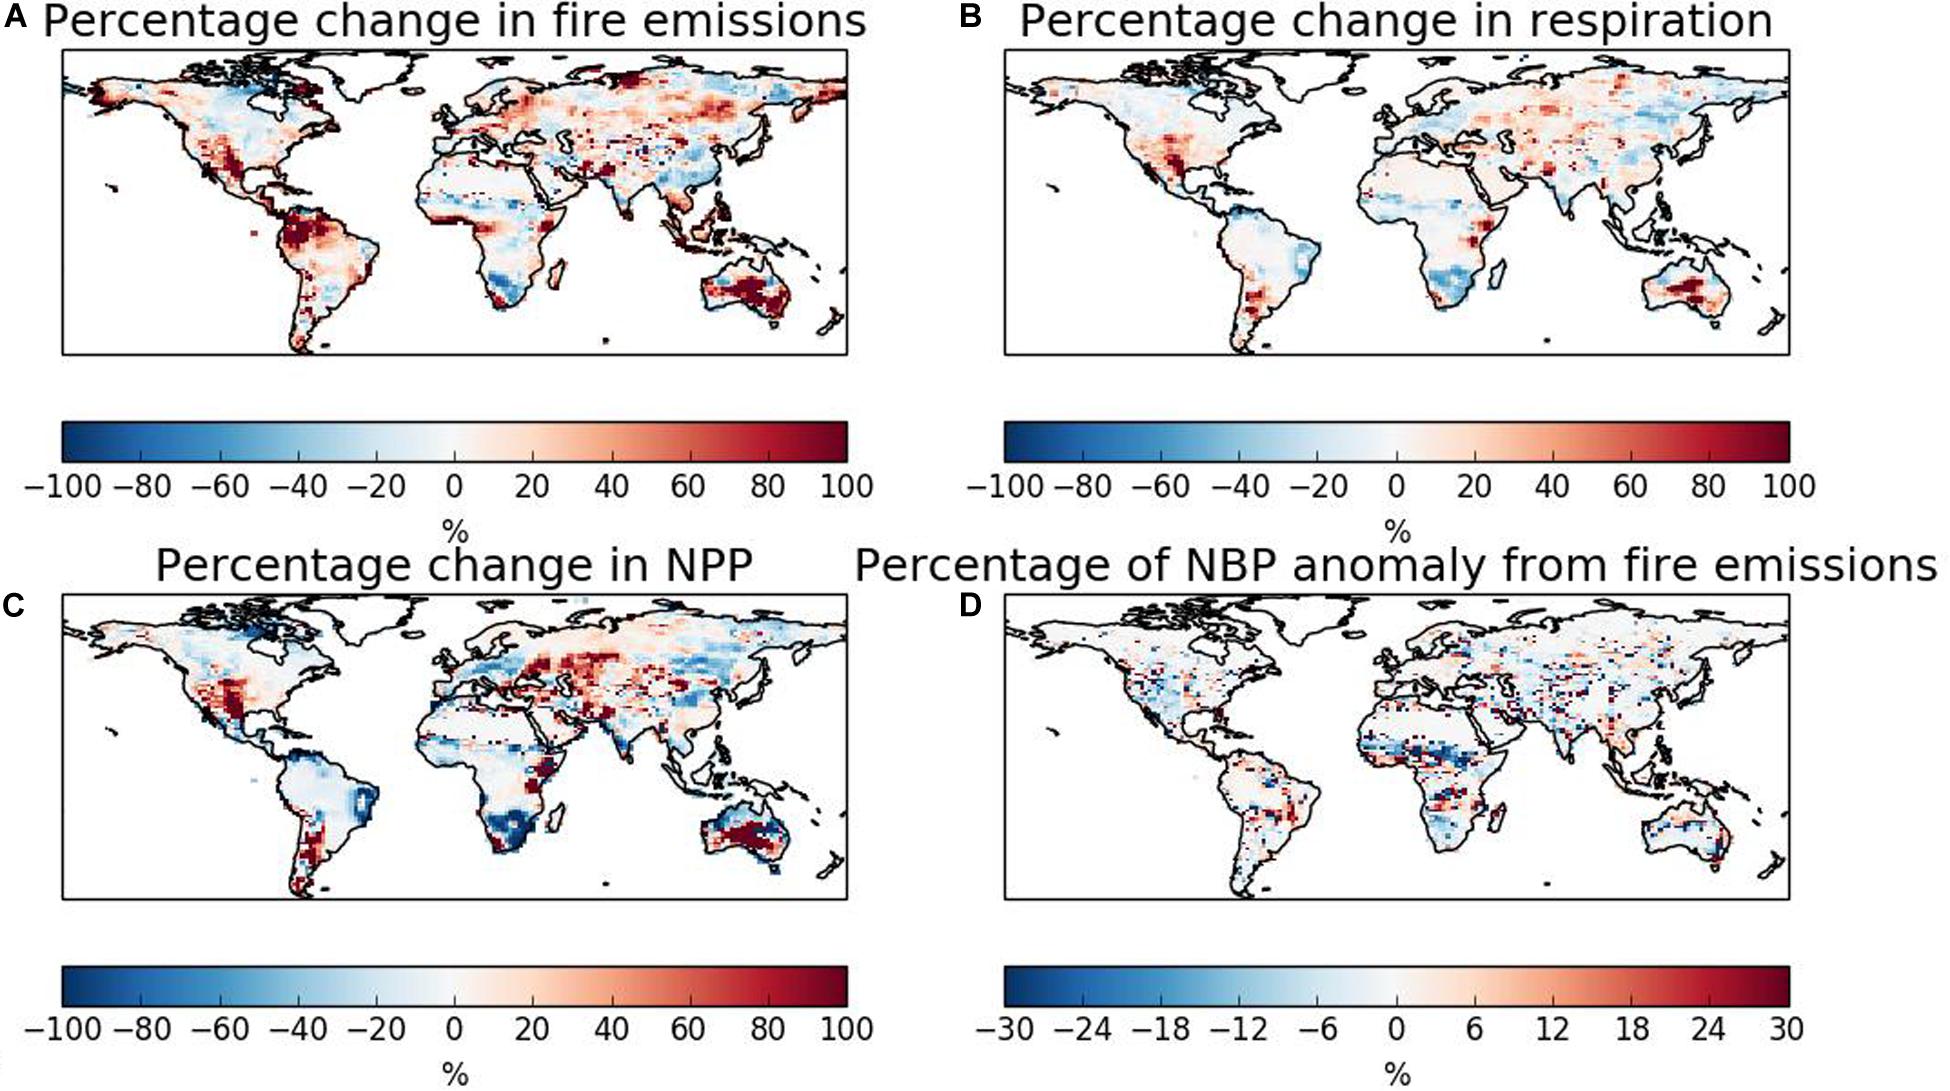
Figure 10. Drivers of change in NBP. Percentage change due to El Niño July 2015–June 2016 for annual emitted carbon from fire (A), respiration (vegetation and soil; B), and NPP (C) simulated by JULES-INFERNO. Panel (D) shows the percentage of the NBP anomaly that is due to fire emissions.
Table 3 shows the percentage contribution of fire, respiration and NPP to the change in NBP. An increase in fire emissions results in a global reduction in NBP, and the contribution is strongest in South America. In Africa, fire emissions are reduced with the El Niño, resulting in a negative contribution. An increase in respiration also contributes to a decline in NBP, which is seen in Asia, but in other regions and globally there is a decrease in respiration. NPP has the opposite sign, where a decline in NPP results in a reduction in NBP. In all three regions and globally there is an overall decline in NPP, with the strongest signal in Asia and South America.
Here, we use the last 10 years of data to explore whether the NBP in 2015/16 was unusual. We include the previous large El Niño, 1997/98, as a comparison (Figure 11). Years 2015/16 had the lowest NBP of any year in the series in the second half of 2015, but from March 2016 had the second lowest with 1998 having a lower NBP. The 1997/8 El Niño conditions were focused more in the Central Pacific, whereas the 2015/16 were more focused in the East Pacific (Chylek et al., 2018), which is a likely reason why the lowest NBP occurred at different times in each case. This reduction has also been found in observationally based estimates of the terrestrial carbon sink, where estimates for 2015 were 1.2 GtC below the 2006–2015 average due to El Niño conditions (Le Quéré et al., 2016).
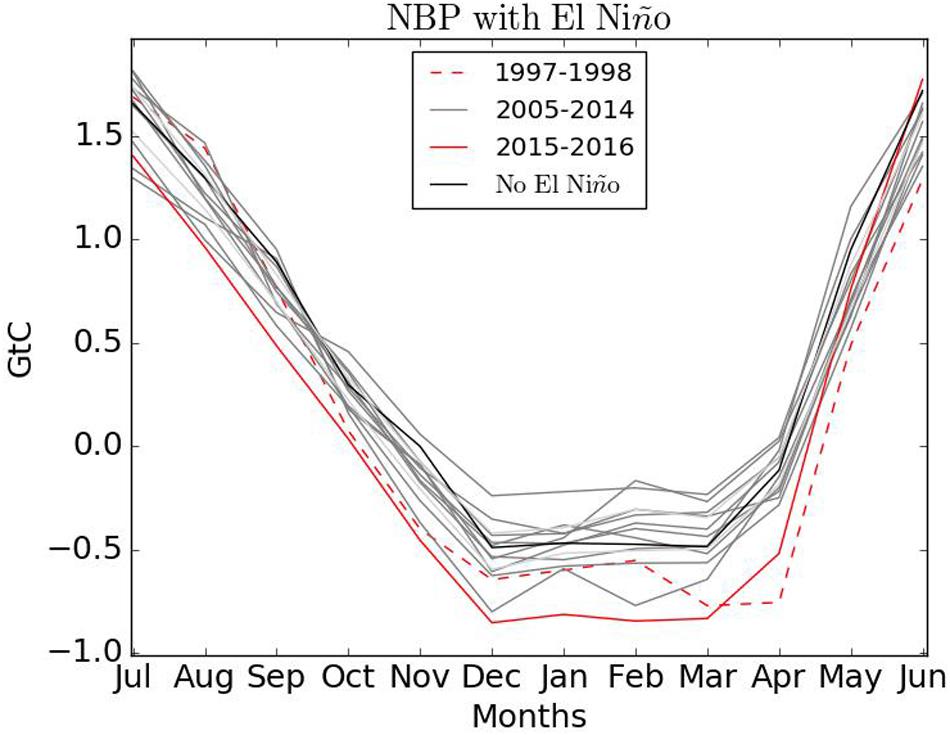
Figure 11. Global terrestrial (GtC/month) NBP for time series of 10 years from July–June. 2005–2014 shown in gray, large El Niño years shown in red (1997/98 dashed; 2015/16 solid), “No El Niño” shown in black.
Here we have considered the impact of the 2015/16 El Niño on fire, compared to a mean climatology. The results suggest that there was an impact on fire, and this varied spatially and temporally. It is well known that the impacts of El Niño conditions vary, causing drought across Asia, some parts of Africa and northern South America, and wetter conditions across central-east Africa and western America (NOAA). Both the 1997/98 (Page et al., 2002) and the recent 2015/16 (Aragão et al., 2018) El Niño events have been associated with an increase in fire, and the results here have shown that in some regions fire did increase with the 2015/16 El Niño compared to a “No El Niño” scenario. The largest signal of increased burned area was in South America, where there is an overall warming and drying of the region, with temperature being the more important driver. It is a well-known feature of El Niño conditions that there is a drying over the Amazon region, which is associated with a weakening of the land carbon sink and thus higher rates of CO2 growth (Humphrey et al., 2018).
In the three regions studied here, both the NPP and the respiration decreased with El Niño in all cases. However, looking at the overall impact of these changes showed that the decrease in NPP was larger than the decrease in respiration, leading to an overall decline in the uptake of carbon in all regions, exacerbated by the additional emissions from fire. The modeled carbon emissions are in agreement with GFED observations, producing a similar order of magnitude of emissions. However, it should also be noted that there are uncertainties in the observational data, and there can be large differences between different burned area products (Jain, 2007). GFED data for example have been found to underestimate burned area and emissions from the 2015/16 El Niño in Amazonia (Withey et al., 2018). The seasonality in burned area is dominated by high burned area in Africa, which is currently not well captured in the model. In many African savannah regions, burning coincides with crop timings rather than in the peak dry season (Laris et al., 2016), whereas human ignition datasets used in modeling are typically based on population on an annual to decadal timescale. Therefore, this may not be a model deficiency, but rather a current inability to capture seasonality of human trends in fire use.
A reduction in NBP was seen in the simulations with El Niño, and the drivers of the reduction were spatially varying. Fire and a reduction in NPP drive the decrease in NBP across South America, whereas a reduction in NPP drives carbon loss across southern Africa. All three inputs of fire, respiration and reduced NPP drive carbon loss in Asia (Figure 10 and Table 3). This supports other research by Liu et al. (2017) showing that carbon losses due to the 2015/16 El Niño vary regionally, although the drivers here differ; Liu et al. concluded that the main cause of carbon losses was reduction in GPP in South America, an increase in fire in tropical Asia, and respiration increase in Africa. Here the JULES-INFERNO model shows that out of all the regions, fire has the largest impact on NBP in South America, NPP has the largest impact in Asia, and respiration also makes the largest contribution to NBP decline in Asia. The previous large El Niño of 1997/98 showed a large spike in carbon emissions, as shown in the GFED observations. A significant part of this was due to emissions from peatlands across Indonesia (Page et al., 2002). The same peak in emissions was not seen in the JULES-INFERNO model, and this points to an important development for the model to be able to represent peatland fires in future iterations.
The period of 2005–2014 used for this study was chosen to ensure conditions are as similar as possible to 2015/16 in terms of climate and CO2 levels, while 10 years was chosen to reduce the effects of inter-annual variability. However, this period does include the weak El Niño years of 2004–2005, 2006–2007, and 2009–2010, meaning some of the impacts of the 2015/16 El Niño may look weaker than if compared only to La Niña or neutral years. It should also be noted that this experiment cannot be defined strictly as an attribution study for El Niño impacts, as other modes of variability may have driven changes during 2015/16. For a more complete attribution study to be conducted, El Niño events could be isolated from the historical period and compared to standard years, however, this is complicated by the relatively few occurrences of El Niño events, and large range in strengths across numerous indexes that make it difficult to compare each event. We can define the 2015/16 meteorological conditions as dominated by a significant El Niño in this case, and using a coupled fire-vegetation model we are able to compare the impacts against a 10-year mean climatology which gives us greater insight into the causes and impacts of the El Niño event on fire and terrestrial carbon.
Here, we have assessed the impact of the 2015/16 El Niño on fire and on the terrestrial carbon cycle by using the JULES-INFERNO model with an experiment comparing the observed 2015/16 El Niño to an average climatology from the previous 10 years. Burned area was impacted by the El Niño, with some areas showing an increase in burned area (south United States, South America, and central Australia), and others showing a decrease (Africa, East Asia). This also affected emissions in the same way. Globally burned area was higher with the El Niño in the last half of 2015, and emissions were higher for most of the period July 2015–June 2016. We compared observations from GFED4.1s to simulated burned area and emissions annually from JULES-INFERNO, and showed that the magnitude of burned area and emissions are well modeled, but the seasonal variability in emissions is less well captured from February – June across a year. Three regions were considered in the study: Asia, Africa, and South America; out of these regions South America showed the largest change in burned area and fire emissions (13% increase) with the El Niño, driven by increased temperature and reduction in moisture availability. Africa showed a negative change driven by higher moisture (humidity and precipitation) and lower fuel availability. Overall, the impact of the 2015/16 El Niño on fire varied by region. Using exclusion experiments for temperature and precipitation, we found that temperature was a larger driver of burned area, both globally and for South America where the change in burned area was largest.
Finally, we used NBP to understand the change in carbon uptake and found that the year 2015/16 had the lowest NBP in the series of 10 years, and lower for most of the year than the previous largest El Niño in 1997/98.
In conclusion, this paper has shown that although 2015/16 was not a peak year for global total burned area or fire emissions, the El Niño had an impact on fire which varied regionally, with the highest change in South America. This led to an overall increase in burned area and emissions compared to a “No El Niño” scenario for 2015/16, and contributed to a reduction in the terrestrial carbon sink.
This manuscript is based on work completed as part of CB’s Ph.D. thesis, which is available here: https://ore.exeter.ac.uk/repository/handle/10871/36801.
The JULES code used in these experiments is freely available on the JULES trunk from version 5.4 onward. The rose suite used for these experiments is u-bh074. Both the suite and the JULES code are available on the JULES FCM repository: https://code.metoffice.gov.uk/trac/jules (registration required). The raw data supporting the conclusions of this article will be made available by the authors, without undue reservation, to any qualified researcher upon request.
CB, RB, CJ, and TF conceptualized the study. CB performed the simulations, model analysis, and wrote the first draft of the text. CB, RB, CJ, TF, MC, and LA contributed to the text and figure revisions and the final manuscript.
This work and its contributors (CB, RB, and CJ) were supported by the Newton Fund through the Met Office Climate Science for Service Partnership Brazil (CSSP Brazil). TF was supported by NERC grant NE/N011570/1/. MC acknowledges the support from the São Paulo Research Foundation (FAPESP, Process 2015/50122-0), and the Brazilian National Council for Scientific and Technological Development (CNPq, Process 314016/2009-0). LA acknowledges the support from the São Paulo Research Foundation (FAPESP, Process 2016/02018-2), the Brazilian National Council for Scientific and Technological Development (CNPq, Process 442650/2018-3, and 309247/2016-0), and Inter-American Institute for Global Change Research (IAI), process: SGP-HW 016.
The authors declare that the research was conducted in the absence of any commercial or financial relationships that could be construed as a potential conflict of interest.
We would like to thank Nicolas Viovy and Philippe Ciais for making available their CRU-NCEP forcing data, and for their kind permission for its use in these model runs.
The Supplementary Material for this article can be found online at: https://www.frontiersin.org/articles/10.3389/feart.2020.00199/full#supplementary-material
Andela, N., Morton, D. C., Giglio, L., Chen, Y., van der Werf, G., Kasibhatla, P., et al. (2017). A human-driven decline in global burned area. Science 356, 1356–1361.
Anderson, L. O., Ribeiro Neto, G., Cunha, A. P., Fonseca, M. G., Mendes de Moura, Y., Dalagnol, R., et al. (2018). Vulnerability of Amazonian forests to repeated droughts. Philos. Trans. R. Soc. Lond. B Biol. Sci. 373:20170411. doi: 10.1098/rstb.2017.0411
Aragão, L. E. O. C., Anderson, L. O., Fonseca, M. G., Rosan, T. M., Vedovato, L. B., Wagner, F. H., et al. (2018). 21st Century drought-related fires counteract the decline of Amazon deforestation carbon emissions. Nat. Commun. 9:536.
Bastos, A., Friedlingstein, P., Sitch, S., Chen, C., Mialon, A., Wigneron, J. P., et al. (2018). Impact of the 2015/2016 El Niño on the terrestrial carbon cycle constrained by bottom-up and top-down approaches. Philos. Trans. R. Soc. Lond. B Biol. Sci. 373:20170304. doi: 10.1098/rstb.2017.0304
Betts, R. A., Jones, C. D., Knight, J. R., Keeling, R. F., Kennedy, J. J., Wiltshire, A. J., et al. (2018). A successful prediction of the record CO2 rise associated with the 2015/16 El Niño. Philos. Trans. R. Soc. Lond. B. Biol. Sci. 373:20170301. doi: 10.1098/rstb.2017.0301
Betts, R. C., Jones, C. D., Knight, J. R., Keeling, R. F., and Kennedy, J. J. (2016). El Niño and a record CO2 rise. Nat. Clim. Chang. 6, 806–810.
Burton, C., Betts, R., Cardoso, M., Feldpausch, T. R., Harper, A., Jones, C. D., et al. (2019). Representation of fire, land-use change and vegetation dynamics in the joint UK land environment simulator vn4.9 (JULES). Geosci. Model Dev. 12, 179–193. doi: 10.5194/gmd-12-179-2019
Chen, Y., Morton, D. C., Andela, N., van der Werf, G. R., Giglio, L., and Randerson, J. T. (2017). A pan-tropical cascade of fire driven by El Niño/Southern Oscillation. Nat. Clim. Chang. 7, 906–911. doi: 10.1038/s41558-017-0014-8
Christian, H. J., Blakeslee, R. J., Boccippio, D. J., Boeck, W. L., Buechler, D. E., Driscoll, K. T., et al. (2003). Global frequency and distribution of lightning as observed from space by the Optical Transient Detector. J. Geophys. Res. Atmos. 108:4005. doi: 10.1029/2002JD002347
Chylek, P., Tans, P., Christy, J., and Dubey, M. K. (2018). The carbon cycle response to two El Nino types: an observational study. Environ. Res. Lett. 13:024001. doi: 10.1088/1748-9326/aa9c5b
Clark, D., Mercado, L., Sitch, S., Jones, C., Gedney, N., Best, M., et al. (2011). The joint UK land environment simulator (JULES), model description – part 2: carbon fluxes and vegetation dynamics. Geosci. Model Dev. 4, 701–722. doi: 10.5194/gmd-4-701-2011
Cox, P., Pearson, D., Booth, B., Friedlingstein, P., Huntingford, C., Jones, C., et al. (2013). Sensitivity of tropical carbon to climate change constrained by carbon dioxide variability. Nature 494, 341–344. doi: 10.1038/nature11882
Eldering, A., Wennberg, P. O., Crisp, D., Schimel, D., Gunson, M., Chatterjee, A., et al. (2017). The orbiting carbon observatory-2 early science investigations of regional carbon dioxide fluxes. Science 358, eaam5745. doi: 10.1126/science.aam5745
Feldpausch, T. R., Phillips, O. L., Brienen, R. J. W., Gloor, E., Lloyd, J., Lopez-Gonzalez, G., et al. (2016). Amazon forest response to repeated droughts. Glob. Biogeochem. Cycles 30, 964–982.
Foley, J. A., Botta, A., Coe, M. T., and Costa, M. H. (2002). El Niño–Southern oscillation and the climate, ecosystems and rivers of Amazonia. Glob. Biogeochem. Cycles 16:1132. doi: 10.1029/2002GB001872
Grimm, A. M. (2003). The El Niño impact on the summer monsoon in Brazil: regional processes versus remote influences. J. Clim. 16, 263–280. doi: 10.1175/1520-04422003016<0263:TENIOT<2.0.CO;2
Harris, I., Jones, P. D., Osborn, T. J., and Lister, D. H. (2014). Updated high-resolution grids of monthly climatic observations – the CRU TS3.10 Dataset. Int. J. Climatol. 34, 623–642. doi: 10.1002/joc.3711
Humphrey, V., Zscheischler, J., Ciais, P., Gudmundsson, L., Sitch, S., and Senevirantne, S. (2018). Sensitivity of atmospheric CO2 growth rate to observed changes in terrestrial water storage. Nature 560, 628–631. doi: 10.1038/s41586-018-0424-4
Hurtt, G., Chini, L., Frolking, S., Betts, R., Feddema, J., Fischer, G., et al. (2011). Harmonization of land-use scenarios for the period 1500-2100: 600 years of global gridded annual land-use transitions, wood harvest, and resulting secondary lands. Clim. Chang. 109, 117–161. doi: 10.1007/s10584-011-0153-2
Jain, A. K. (2007). Global estimation of CO emissions using three sets of satellite data for burned area. Atmos. Environ. 41, 6931–6940. doi: 10.1016/j.atmosenv.2006.10.021
Jung, M., Reichstein, M., Schwalm, C. R., Huntingford, C., Sitch, S., Ahlström, A., et al. (2017). Compensatory water effects link yearly global land CO2 sink changes to temperature. Nature 541, 516–520. doi: 10.1038/nature20780
Kirchhoff, V. W. J. H., and Escada, P. A. S. (1998). O Megaincêndio do Século – The Wildfire of the Century, 1998. São José dos Campos: Transtec Editorial.
Klein Goldewijk, K., Beusen, A., Doelman, J., and Stehfest, E. (2017). Anthropogenic land use estimates for the Holocene – HYDE 3.2. Earth Syst. Sci. Data 9, 927–953. doi: 10.5194/essd9-927-2017
Laris, P., Kone, M., Dadashi, S., and Dembele, F. (2016). The early/late dichotomy: time for a reassessment of Aubreville’s savanna fire experiments. Prog. Phys. Geogr. Earth Environ. 41, 68–94. doi: 10.1177/0309133316665570
Larkin, N. K., and Harrison, D. E. (2005). Global seasonal temperature and precipitation anomalies during El Niño autumn and winter. Geophys. Res. Lett. 32:L16705. doi: 10.1029/2005GL022860
Le Quéré, C., Andrew, R. M., Canadell, J. G., Sitch, S., Korsbakken, J. I., Peters, G. P., et al. (2016). Global carbon budget 2016. Earth Syst. Sci. Data 8, 605–649. doi: 10.5194/essd-8-605-2016
Le Quéré, C., Andrew, R. M., Friedlingstein, P., Sitch, S., Pongratz, J., Manning, A. C., et al. (2018). Global carbon budget 2017. Earth Syst. Sci. Data 10, 405–448. doi: 10.5194/essd-10-405-2018
L’Heureux, M. (2016). “The 2015-16 El Niño’. Science and technology infusion climate bulletin NOAA’s national weather service,” in Proceedings of the 41st NOAA Annual Climate. Diagnostics and Prediction Workshop, 3–6 October 2016, Orono, ME.
Liu, J., Bowman, K. W., Schimel, D., Parazoo, N., Jiang, Z., Lee, M., et al. (2017). Contrasting carbon cycle responses of the tropical continents to the 2015-2016 El Niño. Science 358:eaam5690. doi: 10.1126/science.aam5690
Lohberger, S., Stängel, M., Atwood, E. C., and Siegert, F. (2018). Spatial evaluation of Indonesia’s 2015 fire-affected area and estimated carbon emissions using Sentinel-1. Glob. Change Biol. 24, 644–654. doi: 10.1111/gcb.13841
Luo, X., Keenan, T. F., Fisher, J. B., Jiménez-Muñoz, J. C., Chen, J. M., Jiang, C., et al. (2018). The impact of the 2015/2016 El Niño on global photosynthesis using satellite remote sensing. Philos. Trans. R. Soc. Lond. B Biol. Sci. 373:20170409. doi: 10.1098/rstb.2017.0409
Malhi, Y., Rowland, L., Aragão, L. O. C., and Fisher, R. A. (2018). New insights into the variability of the tropical land carbon cycle from the El Niño of 2015/2016373. Philos. Trans. R. Soc. Lond. B Biol. Sci. 373, 20170298. doi: 10.1098/rstb.2017.0298
Mangeon, S., Voulgarakis, A., Gilham, R., Harper, A., Sitch, S., and Folberth, G. (2016). INFERNO: a fire and emissions scheme for the UK Met Office’s Unified Model. Geosci. Model Dev. 9, 2685–2700. doi: 10.5194/gmd-9-2685-2016
Page, S. E., Siegert, F., Rieley, J. O., Boehm, H. D., Jaya, A., and Limin, S. (2002). The amount of carbon released from peat and forest fires in Indonesia during 1997. Nature 420, 61–65. doi: 10.1038/nature01131
Rifai, S. W., Girardin, C. A. J., Berenguer, E., del Aguila-Pasquel, J., Dahlsjö, C. A. L., et al. (2018). ENSO drives interannual variation of forest woody growth across the tropics. Philos. Trans. R. Soc. Lond. B Biol. Sci. 373:20170410. doi: 10.1098/rstb.2017.0410)
Rödenbeck, C., Zaehle, S., Keeling, R., and Heimann, M. (2018). History of El Niño impacts on the global carbon cycle 1957–2017: a quantification from atmospheric CO2 data. Philos. Trans. R. Soc. Lond. B Biol. Sci. 373:20170303.
Santos, V., Ferreira, M., Rodrigues, J., Garcia, M., Ceron, J., Nelson, B. W., et al. (2018). Causes of reduced leaf-level photosynthesis during strong El Niño drought in a Central Amazon forest. Glob. Change Biol. 24, 4266–4279. doi: 10.1111/gcb.14293
Silva, C. H. L. Jr., Anderson, L. O., Silva, A. L., Almeida, C. T., Dalagnol, R., Pletsch, M. A. J. S., et al. (2019). Fire responses to the 2010 and 2015/2016 Amazonian droughts. Front. Earth Sci. 7:97. doi: 10.3389/feart.2019.00097
Silva, C. V. J., Aragão, L. E. O. C., Barlow, J., Espirito-Santo, F., Young, P. J., Anderson, L. O., et al. (2018). Drought-induced Amazonian wildfires instigate a decadal-scale disruption of forest carbon dynamics. Philos. Trans. R. Soc. Lond. B Biol. Sci. 373:20180043. doi: 10.1098/rstb.2018.0043
Stauffer, C. (2015). ‘El Niño Seen Bringing Drought to Brazil’s North, Heavy Rains to South’: Environment, 2015. Canary Wharf: Reuters.
van der Werf, G. R., Randerson, J. T., Giglio, L., Leeuwen, T., Chen, Y., Rogers, B. M., et al. (2017). Global fire emissions estimates during 1997–2016. Earth Syst. Sci. Data 9, 697–720. doi: 10.5194/essd-9-697-2017
van der Werf, G. R., Randerson, J. T., Collatz, G. J., Giglio, L., Kasibhatla, P. S., Arellano, A. F. Jr., et al. (2004). Continental-scale partitioning of fire emissions during the 1997 to 2001 El Niño/La Niña period. Science 303, 73–76. doi: 10.1126/science.1090753
Viovy, N. (2018). CRUNCEP Version 7 – Atmospheric Forcing Data for the Community Land Model. Research Data Archive at the National Center for Atmospheric Research, Computational and Information Systems Laboratory. Available online at: https://doi.org/10.5065/PZ8F-F017 (accessed July 11, 2018).
Withey, K., Berenguer, E., Palmeira, A. F., Espírito-Santo, F. D. B., Lennox, G. D., Silva, C. V. J., et al. (2018). Quantifying the immediate carbon emissions from El Niño-mediated wildfires in humid tropical forests. Philos. Trans. R. Soc. Lond. B Biol. Sci. 373:20170312. doi: 10.1098/rstb.2017.0312
Keywords: El Niño, fire, burned area, emissions, carbon sink
Citation: Burton C, Betts RA, Jones CD, Feldpausch TR, Cardoso M and Anderson LO (2020) El Niño Driven Changes in Global Fire 2015/16. Front. Earth Sci. 8:199. doi: 10.3389/feart.2020.00199
Received: 16 January 2020; Accepted: 18 May 2020;
Published: 10 June 2020.
Edited by:
Samuel Abiven, University of Zurich, SwitzerlandReviewed by:
Eric Guilyardi, Institut Pierre Simon Laplace (IPSL), FranceCopyright © 2020 Burton, Betts, Jones, Feldpausch, Cardoso and Anderson. This is an open-access article distributed under the terms of the Creative Commons Attribution License (CC BY). The use, distribution or reproduction in other forums is permitted, provided the original author(s) and the copyright owner(s) are credited and that the original publication in this journal is cited, in accordance with accepted academic practice. No use, distribution or reproduction is permitted which does not comply with these terms.
*Correspondence: Chantelle Burton, Y2hhbnRlbGxlLmJ1cnRvbkBtZXRvZmZpY2UuZ292LnVr
†ORCID: Chantelle Burton, orcid.org/0000-0003-0201-5727; Richard A. Betts, orcid.org/0000-0002-4929-0307; Chris D. Jones, orcid.org/0000-0002-7141-9285; Ted R. Feldpausch, orcid.org/0000-0002-6631-7962; Manoel Cardoso, orcid.org/0000-0003-2447-6882; Liana O. Anderson, orcid.org/0000-0001-9545-5136
Disclaimer: All claims expressed in this article are solely those of the authors and do not necessarily represent those of their affiliated organizations, or those of the publisher, the editors and the reviewers. Any product that may be evaluated in this article or claim that may be made by its manufacturer is not guaranteed or endorsed by the publisher.
Research integrity at Frontiers

Learn more about the work of our research integrity team to safeguard the quality of each article we publish.