 Tadashi Ishikawa
 Yusuke Yokota
 Shun-ichi Watanabe
 Yuto Nakamura1
95% of researchers rate our articles as excellent or good
Learn more about the work of our research integrity team to safeguard the quality of each article we publish.
Find out more
MINI REVIEW article
Front. Earth Sci. , 15 May 2020
Sec. Solid Earth Geophysics
Volume 8 - 2020 | https://doi.org/10.3389/feart.2020.00150
This article is part of the Research Topic Frontiers in Seafloor Geodesy View all 21 articles
The Global Navigation Satellite System-Acoustic ranging combination technique (GNSS-A) is a seafloor geodetic technique that enables precise global seafloor positioning to detect subseafloor geophysical phenomena. The technique requires a sea surface observation platform that combines GNSS positioning and acoustic ranging. Currently, a survey vessel is used as the platform, which entails substantial financial and human resources costs, which makes increasing observation frequency difficult. It is possible to detect long-term average seafloor movement at the centimeter level, but it is difficult to detect short-term variation due to the insufficiency of observation frequency. The terrestrial GNSS observation network has detected temporal changes in crustal deformation fields. These precise observations provide useful information on the megathrust seismogenic zone. To detect such phenomena on the seafloor, the temporal resolution of the GNSS-A observation needs to be improved. Advances in vessel equipment technology are crucial for increasing observation frequency. In this paper, we review the historical development of the Japan Coast Guard’s GNSS-A observation system, focusing on technological developments of on-board equipment installed on a sea surface platform, and explain how such improvements have increased observation frequency over time. In the present, ranging frequency has improved from 40–60 s to 15–20 s by the introduction of the multiple ranging system, resulting in more frequent observations up to five times per year for an individual site.
Space geodetic techniques have been used to monitor crustal deformation. In particular, Global Navigation Satellite System (GNSS) observation networks have been used to reveal detailed information from terrestrial crustal deformation fields and discover various geophysical phenomena. However, to elucidate the physical processes of huge earthquakes that occur around tectonic subduction zones, it is important to observe crustal deformation on the seafloor just above the focal region. The GNSS-Acoustic ranging combination technique (GNSS-A) was proposed and developed to extend the GNSS to the seafloor (Spiess, 1985; Asada and Yabuki, 2001; Fujita et al., 2006). This seafloor geodetic technique has been used to detect various subseafloor geophysical phenomena that cannot be detected using terrestrial observation and has been providing fruitful knowledge for geophysics, especially for seismology.
The GNSS-A technique has a shortcoming in terms of temporal resolution. Although on-line continuous observation has been achieved using the GNSS, the GNSS-A can observe only several times a year in general. Increasing the observation frequency of the GNSS-A is difficult because a sea surface platform that combines GNSS positioning and acoustic ranging is required. At present, a vessel is used as the platform, which encompasses substantial operating expenses and human resources. One of the most important findings from the study of GNSS-A is the detection of huge co-seismic seafloor displacements due to the 2011 Tohoku-Oki earthquake in Japan (Sato et al., 2011; Kido et al., 2011). However, because that observation was conducted several weeks after the earthquake, it is difficult to separate the co- and post-seismic contribution from the observed displacements. Another important finding from a more recent study is the estimation of the coupling condition of the plate boundary along the Nankai Trough from GNSS-A-derived inter-seismic seafloor movement (Yokota et al., 2016). Because the observation is conducted several times a year, it takes several years to accumulate the data necessary to achieve sufficient accuracy. Therefore, the plate coupling condition estimated from GNSS-A data is currently only a long-term average value. Although the terrestrial GNSS network reveals temporal changes in plate coupling (e.g., Ochi, 2015), it is difficult to detect such phenomena using the GNSS-A. To monitor various geophysical phenomena more accurately, it is essential to improve the temporal resolution of the GNSS-A.
In the last two decades, various slow earthquakes that have the potential to cause huge megathrust earthquakes have been detected around subduction zones. The relationship between slow earthquakes and huge earthquakes is an important research topic in the present seismology (e.g., Obara and Kato, 2016). The terrestrial GNSS network has detected long-term slow earthquakes lasting months or years called slow slip events (SSEs). Recently, GNSS-A has been used to detect SSEs in offshore regions (Yokota and Ishikawa, 2020). However, GNSS-A lacks the capability to accurately determine the duration of such events, due to the insufficiency of observation frequency.
The ideal solution to improve the temporal resolution of the GNSS-A is continuous observation using an unmanned sea surface platform instead of a vessel. An unmanned sea surface platform has been developed by some research groups (Takahashi et al., 2014; Chadwell, 2016; Kato et al., 2018; Tadokoro et al., 2020), but it has not yet been put into use for stable observation. It is therefore now important to develop a technology that increases the frequency of vessel-based observation, which is limited by the high costs associated with using a ship, including vessel operation time.
Advancements in vessel equipment and acoustic ranging technology are indispensable to increase the observation frequency of the GNSS-A. Since the mid-1990s, we, the Japan Coast Guard research group, have been developing observation technology to increase the observation frequency and positioning accuracy. This paper briefly reviews the historical development of the Japan Coast Guard’s observation system.
Figure 1A shows a schematic of the GNSS-A observation system. It consists of a sea surface unit and a seafloor unit. The on-board equipment consists of a GNSS positioning system, an acoustic transducer, and a dynamic motion sensor set on a surface vehicle. At each site that is surveyed, the seafloor unit usually consists of four acoustic mirror transponders that are arranged on a rough circle with its radius equal to the depth of the transponders’ placement.
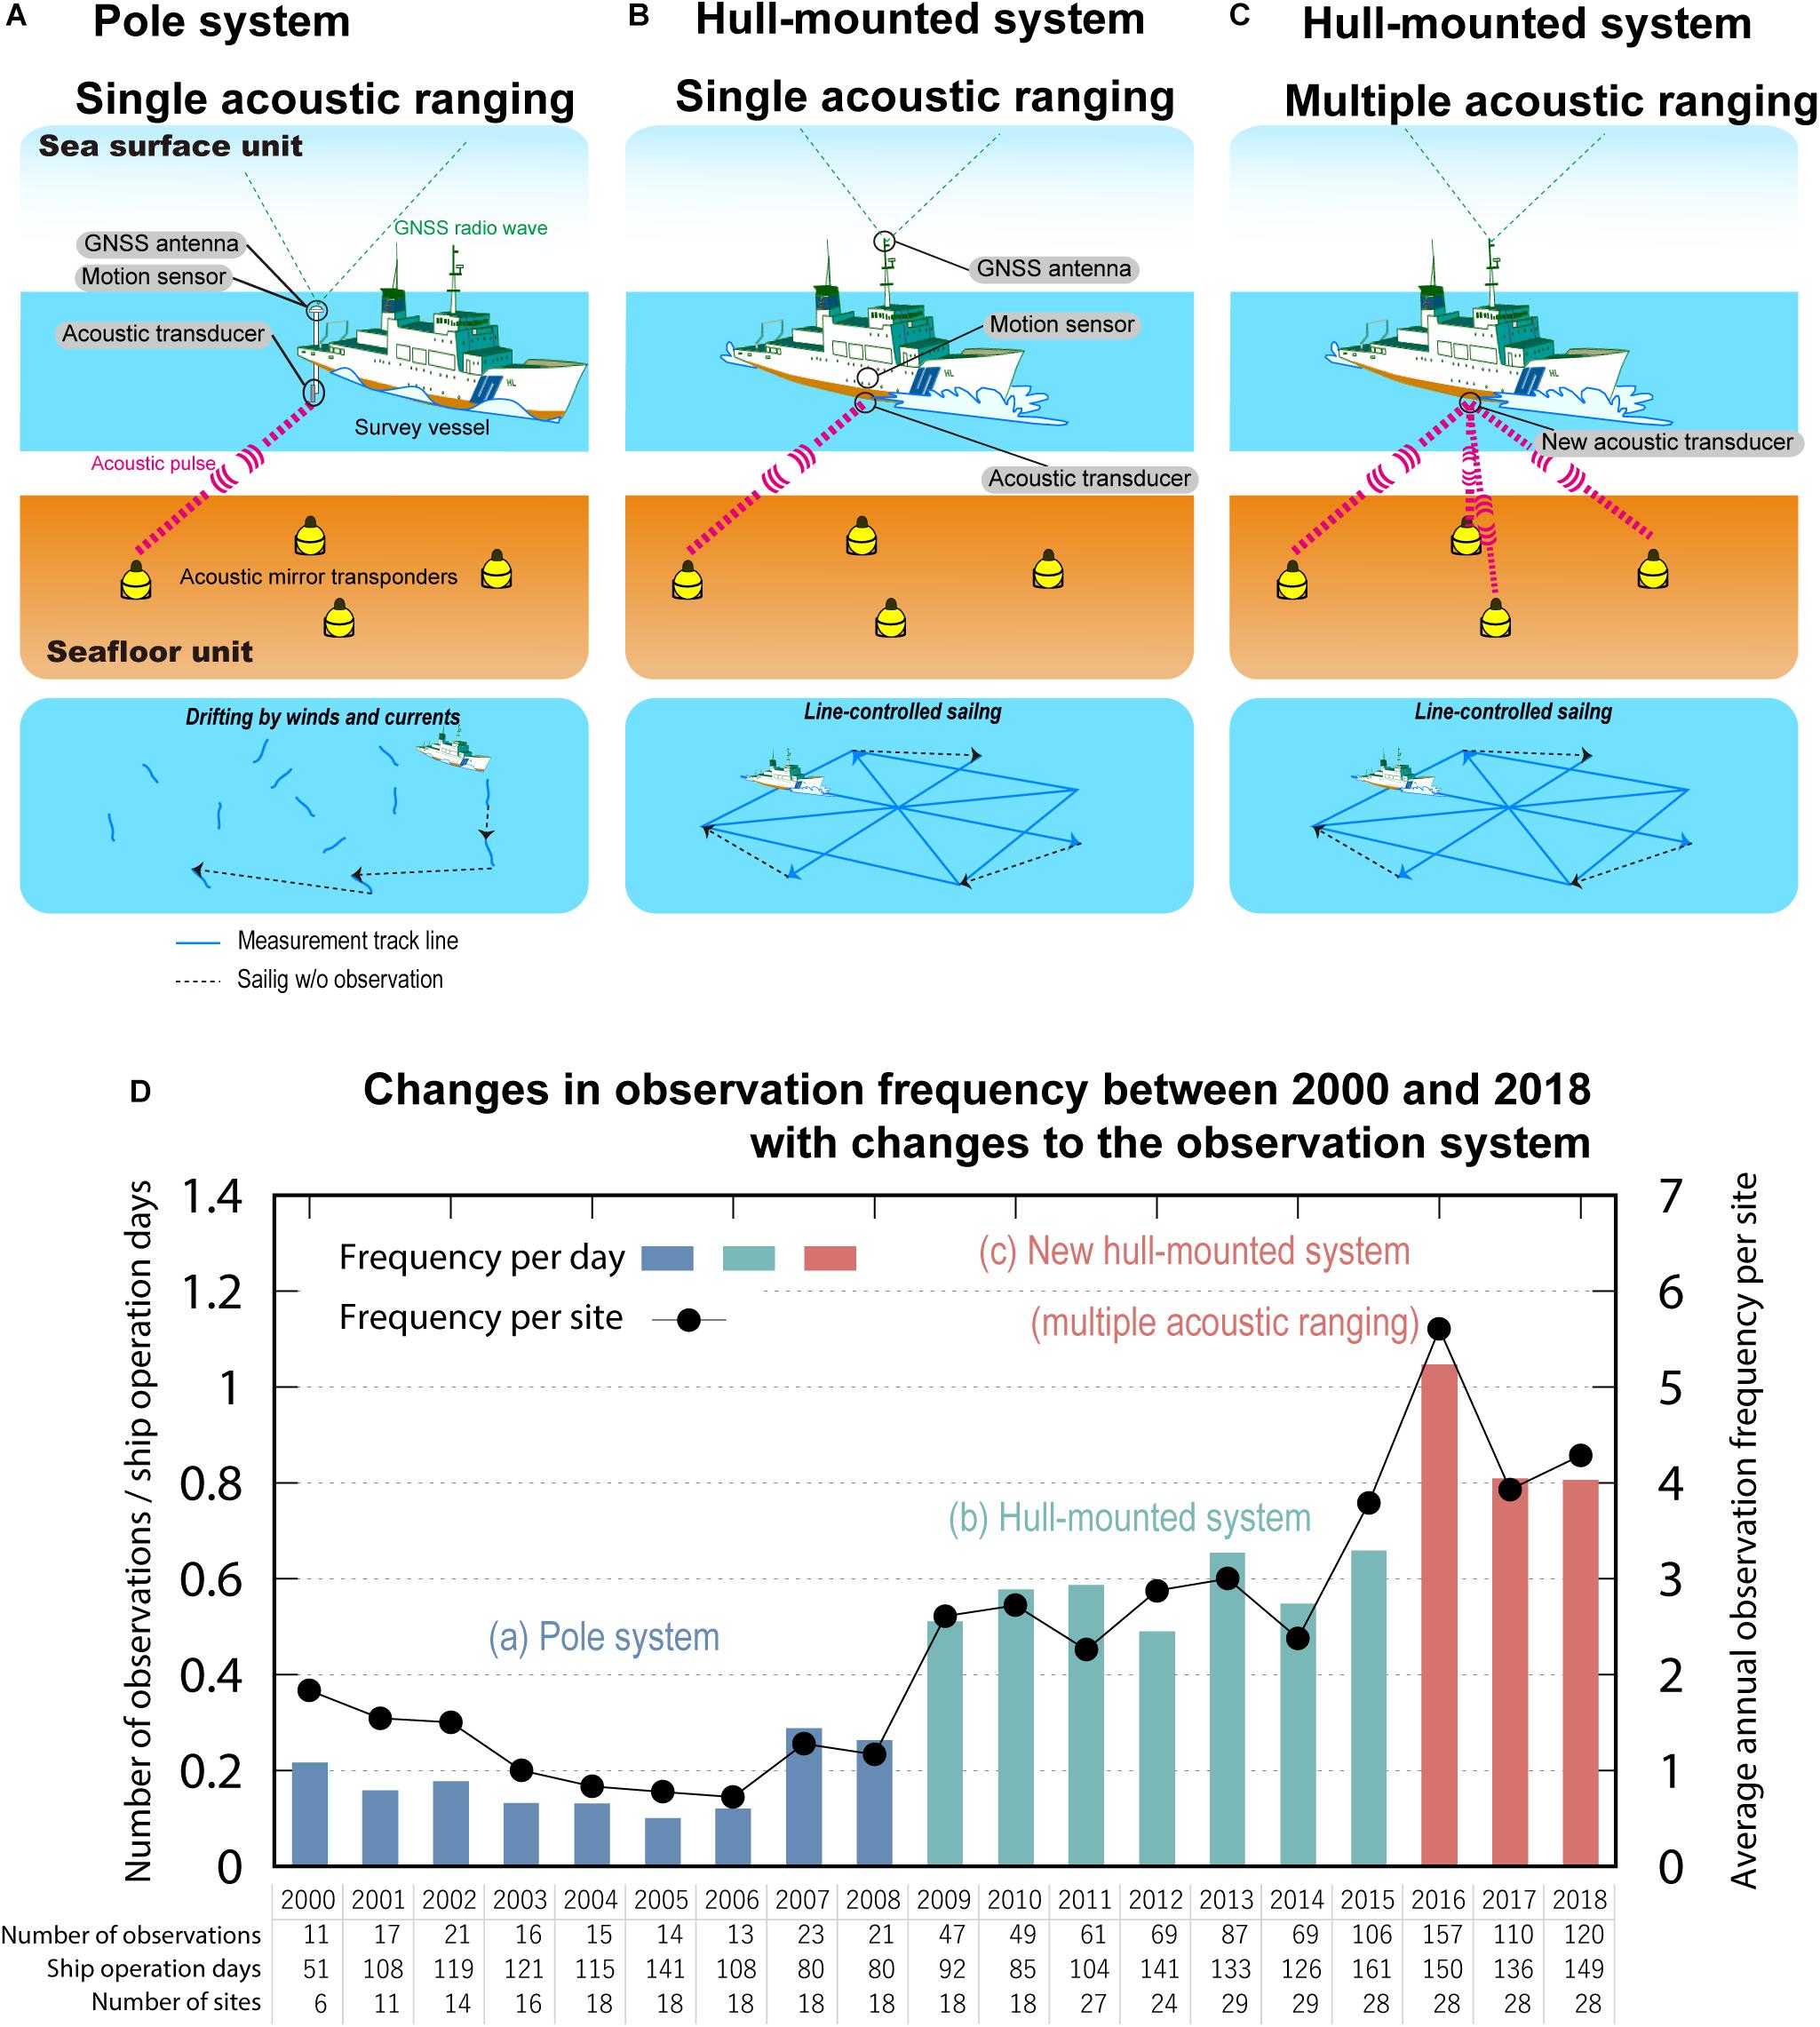
Figure 1. History of the Japan Coast Guard’s Global Navigation Satellite System-Acoustic ranging combination technique (GNSS-A) observation system. (A) Schematic of the GNSS-A pole system. (B) Schematic of the GNSS-A hull-mounted system. (C) Schematic of the GNSS-A hull-mounted system with a new transducer for multiple acoustic ranging. (D) Changes in observation frequency between 2000 and 2018 with changes to the observation system.
The observation system measures the global position of the seafloor transponders according to the International Terrestrial Reference Frame (ITRF). The position of the GNSS antenna is determined by baseline kinematic GNSS analysis. In addition to the GNSS positioning, the dynamic motion sensor records the vessel’s attitude. By combining the information on the position of the GNSS antenna and the vessel’s attitude, we can determine the global position of the on-board acoustic transducer according to the ITRF. The distance between the on-board transducer and the seafloor transponders are measured by acoustic ranging. Each transponder receives the acoustic signal and then sends it back to the on-board transducer. The positions of the seafloor transponders are determined by combining the information on the position of the on-board transducer and the acoustic signal travel time. In this process, each travel time is converted to distance using an underwater sound speed profile that is acquired every few hours using temperature and salinity profilers.
Acoustic ranging is performed to precisely determine the relative position between the on-board transducer and the seafloor acoustic mirror transponders. As mentioned above, the transponders act as signal re-transmitters that receive and then return acoustic signals that were sent from the on-board transducer. In the positioning analysis, correction of underwater sound speed is a key to achieve centimeter accuracy (Fujita et al., 2006; Yokota et al., 2018). Thus, the installation of multiple transponders is necessary to accurately estimate perturbations of underwater sound speed (Kido, 2007).
The on-board transducer transmits two bi-phase modulation acoustic signals at a carrier wave frequency of 10 kHz. The first signal is used to identify each transponder and the second is used for ranging. The sequence code of the modulation used in the system is the maximum length sequence (M-sequence) code. The 8th and 9th order M-sequence codes are used for the identification and ranging signals, respectively. One bit of the code consists of four cycles of the carrier wave. Four phases are repeated 255 times for the identification signal and 511 times for the ranging signal, with each signal lasting 102.0 and 204.4 ms, respectively, with 102.0 ms separation (Figure 2A). The total time for one signal including the interval is about 400 ms.
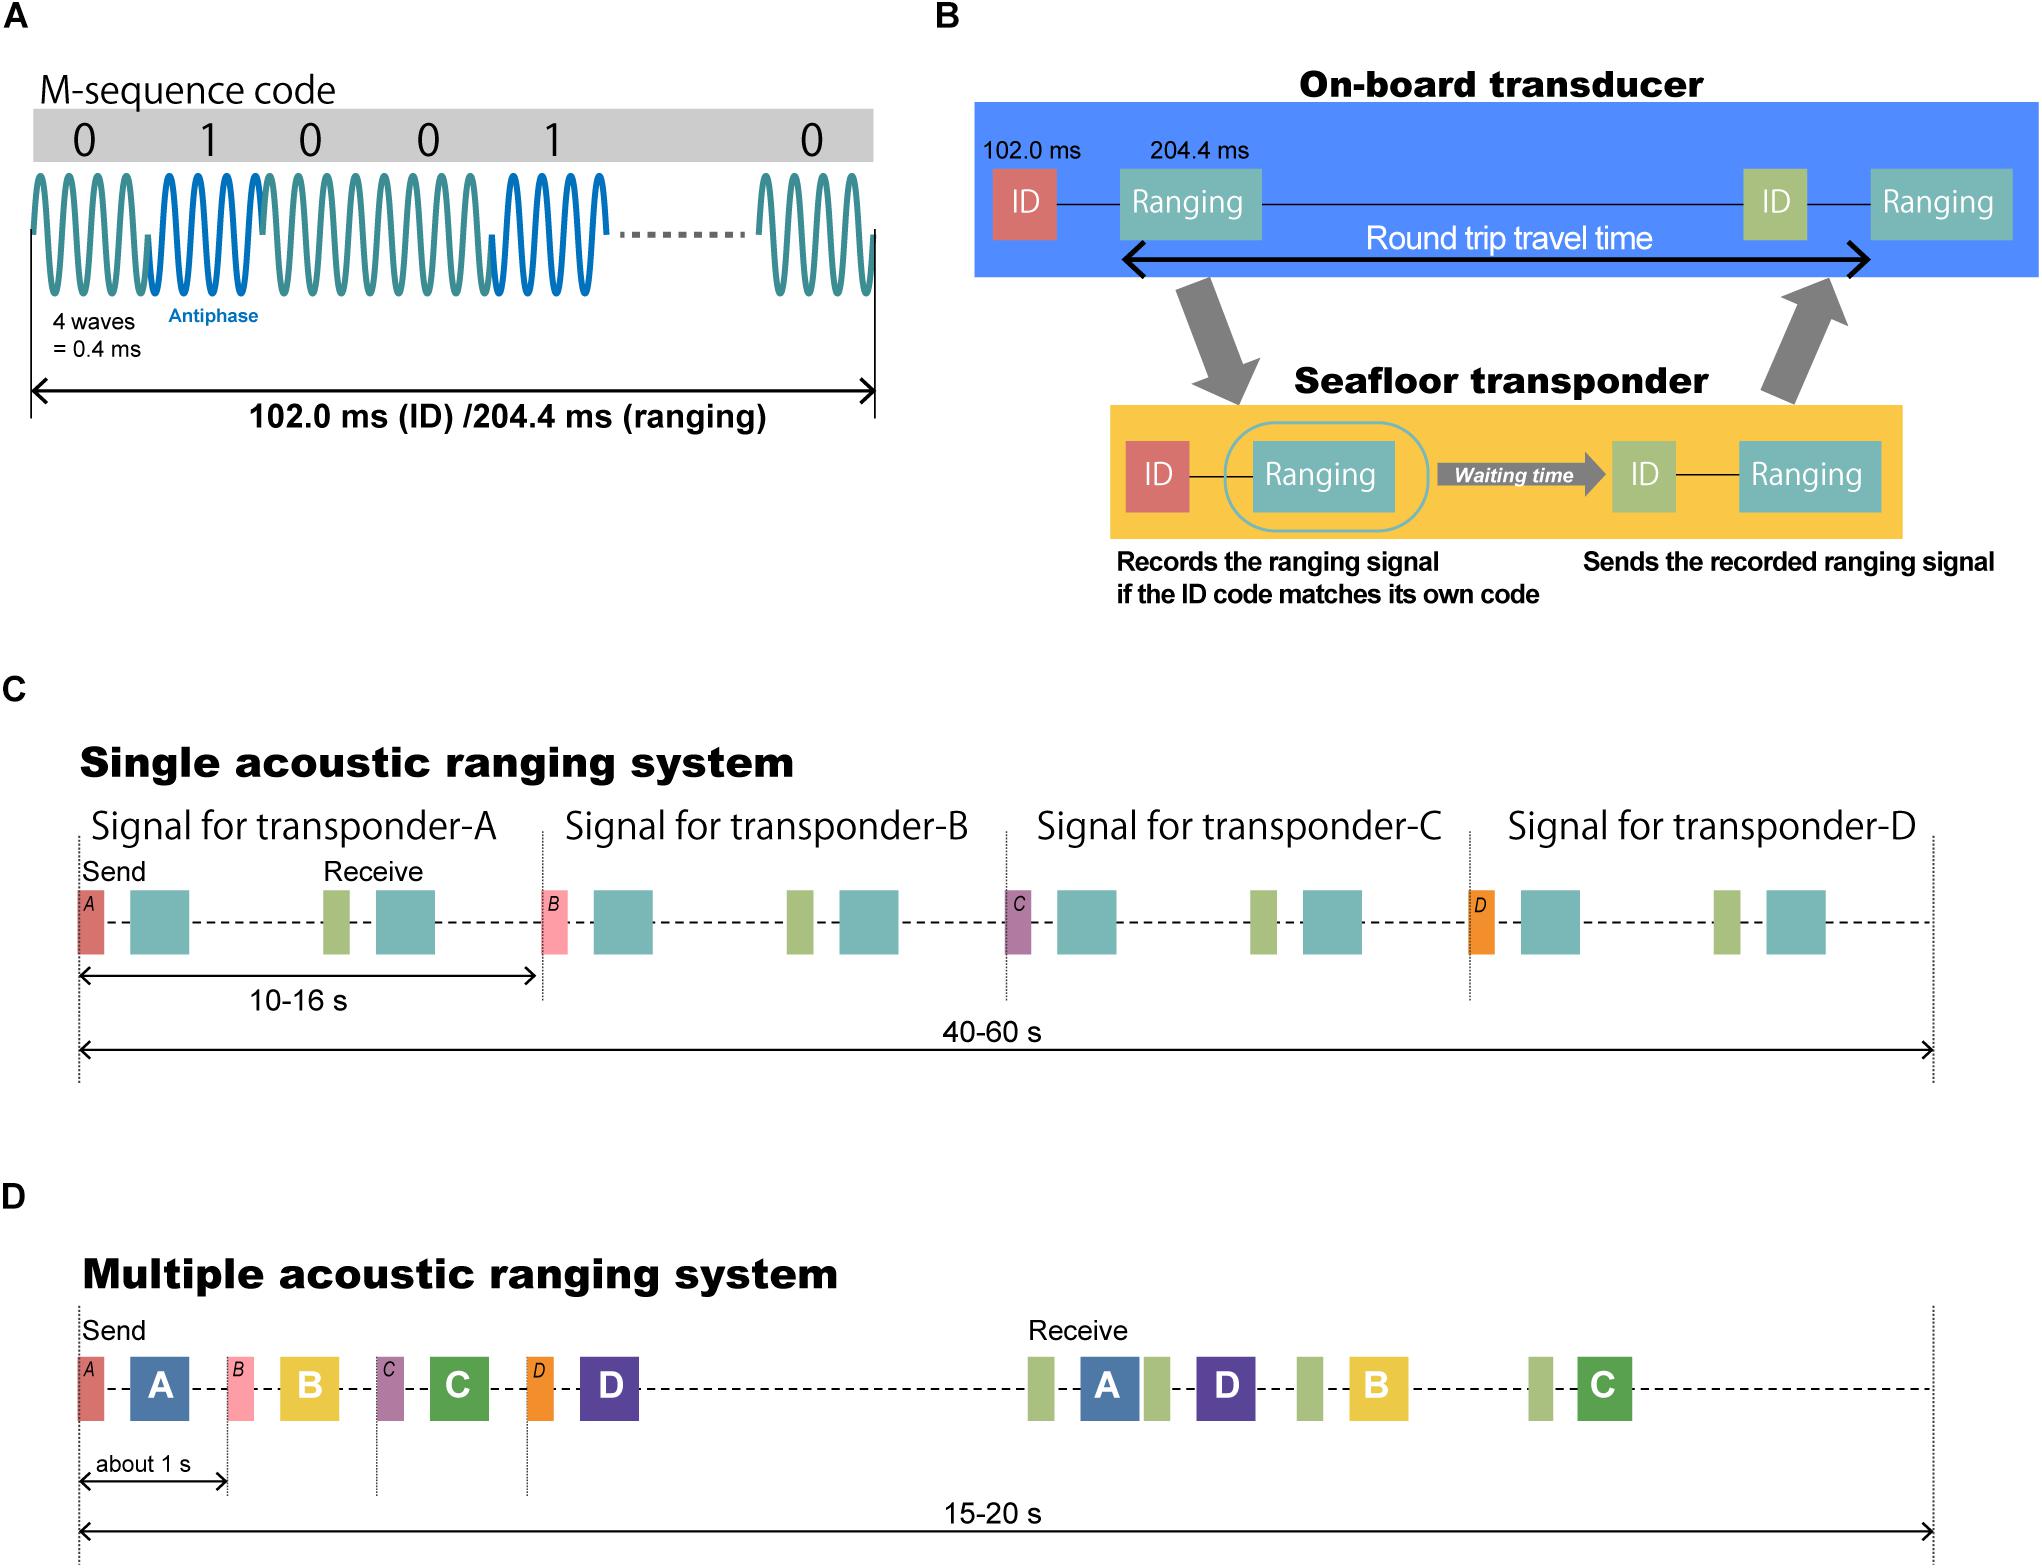
Figure 2. Outline of the acoustic ranging system. (A) Acoustic waves coded by four-wave M-sequence signals. (B) Flowchart of transmission and reception of acoustic signals. Comparison of transmission and reception sequences in (C) the single acoustic ranging system (pole system and hull-mounted system) and (D) the multiple acoustic ranging system (new hull-mounted system). ID, identification signal.
As explained above, the seafloor transponder receives the acoustic signals. If the identification signal code matches that of the transponder, the transponder records the succeeding ranging signal. After a prescribed interval time set for each transponder, the transponder returns the recoded ranging signal together with a new identification signal to the sea surface.
During the acoustic ranging, the sea surface transducer digitally records both the signals that were transmitted and received at a sampling frequency of 200 kHz. The precise round-trip travel time is calculated by cross-correlation between the syntheticsignal and the received ranging signal (Asada and Yabuki, 2001). The onset of the received signal can be identified as the maximum peak in the correlogram, taking advantage of the characteristics of the M-sequence code. The flow of the acoustic ranging process is shown in Figure 2B.
A schematic of the GNSS-A pole system is shown in Figure 1A. This early system was used from 2000 (the first year of our observations) to 2008. The on-board equipment was mounted on a rigid 8-m-long pole attached to the stern of the vessel. A GNSS antenna and a motion sensor was attached to the top of the pole, and an acoustic transducer was attached to the bottom of the pole. The pole was not a permanent fixture and therefore had to be installed for each observation campaign. During acoustic measurement, it was necessary to have the bottom of the pole to which the transducer was attached extend into the sea. To avoid noise caused by propellers and deformation of the pole due to excessive load in the water, acoustic measurement was only possible when the vessel was drifting. We initially used an aluminum alloy pole, but in July 2002 we changed to a stiffer stainless steel pole to decrease the effects of pole deformation.
There were substantial problems with the pole system. The first problem was the difficulty of moving the vessel along an ideally balanced line over the transponders. The GNSS-A positioning technique is an underwater analog of GNSS positioning, and the vessel plays the role of the satellite in the GNSS. As with the dilution of precision (DOP) of the GNSS positioning due to bad satellite geometry, the vessel’s track line has a large effect on the accuracy of seafloor positioning. An example of the survey line is shown in Figure 1A. If the entire region above the transponders can be covered in a well-balanced manner, then accuracy is maintained, but the data density varies by location because the vessel’s position during the survey is not well-controlled.
Another problem was that observation was inefficient. The time required to transfer the vessel between the track lines was almost equal to that required for acoustic measurements (Figure 1A). In addition, human operations on the deck were necessary to move the acoustic transducer up and down for vessel transfers. To ensure that deck operations were carried out safely, measurements were restricted during the night, and even during the day, measurements were often canceled because of bad weather. Thus, observation took up a lot of ship time in addition to the time required to conduct acoustic measurements.
Errors in the GNSS-A are mainly caused by variation in the atmosphere/ionosphere along the path of the GNSS radio wave and by underwater temperature/salinity along the path of the acoustic wave. Because the underwater perturbation has larger spatial and temporal scale than the GNSS-A observation time, i.e., several kilometers and hours, it tends to cause systematic bias error for positioning. Therefore, developing an analysis method for estimating the underwater conditions in detail is an important research target for GNSS-A observation. The method for decreasing systematic bias error by estimating the sound speed structure analytically has been developed (e.g., Fujita et al., 2006; Ikuta et al., 2008; Yokota et al., 2019). In these models, sufficiently distributed acoustic travel time data are needed for sound speed estimation. Specifically, adding the data to decrease random noise errors, several hundreds of acoustic travel time data for each transponder are required. As such, the number of acoustic signals that the four transponders were to receive using the pole system was empirically set at around 5,000. To obtain a sufficient amount of data, 2–4 days were spent at one site. Because a single observation took several days, weather pose problems. Therefore, it was not always possible to obtain a sufficient amount of data.
From 2009, the on-board equipment was permanently mounted on the vessel. In this hull-mounted system, the acoustic transducer is attached to the hull and the GNSS antenna is attached to the top of the main mast (Figure 1B). When the vessel is dry-docked, the relative position between the GNSS antenna and the transducer is determined by total stations and GNSS used in terrestrial survey. The attitude of the vessel is measured by a dynamic motion sensor and used to determine the coordinates of the transducer relative to those of the GNSS antenna.
Measurements are conducted while the vessel moves along an ideal well-balanced track line. In addition, measurement is possible during both day and night because human operations on the deck are no longer necessary and there are less interruptions to measurements due to vessel transfer between track lines compared with the pole system. Thus, measurement accuracy is improved over that of the pole system (Sato et al., 2013b) and the observation time for a single site is decreased from 2–4 days to 16–24 h.
The required number of acoustic signals was set to about 5,000, as was empirically determined in the pole system era. However, the hull-mounted system requires less signals because of high efficiency in obtaining well-balanced data. In 2015, we investigated data collected using the hull-mounted system and concluded that about 3,500 acoustic signals are enough to take measurements. Thus, the observation time is decreased to about three quarters.
As mentioned above, the on-board transducer transmits two acoustic signals: an identification signal and a ranging signal. Each transponder has an identification code to distinguish each other and operates only when receiving the same identification code. Acoustic ranging is conducted by sequentially transmitting the two signals to four seafloor transponders, with the identification signal changed to match that of each transponder with each successive attempt (i.e., each cycle). Figure 2C shows one cycle of acoustic ranging for four transponders. The signal transmission interval, which depends on the depth of the transponders, is 10–16 s. Therefore, it takes 40–60 s to complete one cycle measurement for the transponder array.
To increase the observation frequency, it is necessary to decrease the observation time. Thus, a new transducer called multiple acoustic ranging has been developed that enables multiple transmissions and receptions in one sequence (Figure 1C; Yokota and Okumura, 2015; Yokota et al., 2017). This new transducer transmits acoustic signals successively without waiting to receive each reply signal from the seafloor transponders but instead receives all the reply signals at one time (Figure 2D). In the conventional system, the ranging signals are all coded using the same M-sequence code. In the new multiple acoustic ranging system, the ranging signal is coded using different M-sequence codes for each transponder to avoid crosstalk between receiving signals. Because the ranging signals that are received have different codes, overlapping signals can be separated by cross-correlation processing.
The signal transmission length for one transponder is about 0.4 s and transmission intervals are set to 1 s to protect the internal electric circuit. The length of the transmission sequence takes roughly the number of transponders multiplied by 1 s. Because the first returned signal arrives before the transmission of the last signal in the case of shallow transponder depth, the possible number of transmitted signals depends on the transponder depth. Because the receiving sequence requires a time length that is enough to receive signals from the farthest transponder, it is set to about 10–16 s depending on the transponder depth. The entire process takes 15–20 s, which is much shorter than that of the conventional system, which takes 40–60 s. By measuring the signals from the four transponders simultaneously in one sequence, the observation is completed in about 3–4 h, which is a quarter of that of the conventional system.
Figure 1D shows the time series of the ratio of number of observations to ship operation days and the average annual observation frequency for each observation system per site. Although there is variability due to the effects of weather and equipment failure, the graph roughly shows the evolution of system ability to increase observation frequency.
In 2008 and earlier, the pole system era, the ratio was 0.1–0.3 and the observation frequency was about one time annually per site. This is insufficient to measure crustal deformations at the centimeter level. In this era, we increased the observation frequency for seismologically important sites, but decreased the observation frequency for other sites. In this manner, we succeeded in obtaining the first seafloor movement velocity at a site off Miyagi where an M7-class earthquake has repeatedly occurred. Fujita et al. (2006) revealed a high degree of interplate locking offshore Miyagi from the data of 7 GNSS-A measurements taken during a 3-year period (2002–2005). Matsumoto et al. (2008) suggested low interplate locking offshore Fukushima.
From 2009, the hull-mounted system era, the ratio was improved to 0.5–0.6 and the annual observation frequency was increased to 2–3 times. By optimizing the number of acoustic signals from 5,000 to 3,500 in 2015, the observation frequency exceeded three times as much as that of the pole system annually per site. Because this frequency is sufficient to measure long-term (4–5 years) movement rate (i.e., mean velocity) at the centimeter level, it is possible to make observations at the same frequency for almost all sites. Thus, the spatial heterogeneity of seafloor crustal deformation has been revealed from wide-area measurement data along the Japan Trench (Sato et al., 2013a) and along the Nankai Trough (Yokota et al., 2015, 2016).
After the installation of the new hull-mounted multi-acoustic ranging system in 2016, the ratio exceeds 1.0 and the observation frequency is now over five times annually per site. In 2017, the frequency decreased due to electrical failure of the transducer. In the present day, considering the importance of disaster prevention in the Nankai Trough, we have set the observation frequency for each site along the Japan Trench and the Nankai Trough to 3 times per year and 4–8 times per year, respectively. High-frequency observation along the Nankai Trough might disclose temporal changes of inter-seismic coupling on a yearly basis.
In response to seismological demand, short-term geodetic phenomena such as SSEs need to be detected with certainty. Therefore, increasing the observation frequency of affected sites is essential, and the development of a new sea surface platform rather than a vessel is required. There are already studies on a GNSS buoy (Takahashi et al., 2014; Kato et al., 2018; Tadokoro et al., 2020) and an automated vehicle (Chadwell, 2016), but the feasibility of such a system needs to be examined, considering both operation safety and costs. Also, examination of various possibilities in sea surface platform engineering will continue to be essential.
TI designed the study. YY, TI, and SW led the development of the observation system to increase observation frequency. TI and YY wrote this manuscript. YY, TI, SW, and YN participated in discussion about the observation system and made comments to improve the manuscript.
The submission of the manuscript was funded by the Japan Coast Guard.
The authors declare that the research was conducted in the absence of any commercial or financial relationships that could be construed as a potential conflict of interest.
We thank the reviewers for their helpful comments and suggestions. We thank the many staff members from the Hydrographic and Oceanographic Department, Japan Coast Guard, including the crew of the survey vessels Takuyo, Shoyo, Meiyo, and Kaiyo for their support in our observations and technological developments. We especially thank the active senior staff members from the Geodesy and Geophysics Office, Hydrographic and Oceanographic Department, Japan Coast Guard, for their devoted maintenance and management of the equipment.
Asada, A., and Yabuki, T. (2001). Centimeter-level positioning on the seafloor. Proc. Jpn. Acad. Ser. B 77, 7–12. doi: 10.2183/pjab.77.7
Chadwell, C. D. (2016). “Campaign-style GPS-Acoustic with wave gliders and permanent seafloor benchmarks,” in Proceedings of the Subduction Zone Observatory Workshop, Boise Center, Boise, ID, Sep. 29 – Oct. 1 2016, Boise, ID.
Fujita, M., Ishikawa, T., Mochizuki, M., Sato, M., Toyama, S.-I., Katayama, M., et al. (2006). GPS/acoustic seafloor geodetic observation: method of data analysis and its application. Earth Planets Space 58, 265–275. doi: 10.1007/s00190-013-0649-9
Ikuta, R., Tadokoro, K., Ando, M., Okuda, T., Sugimoto, S., Takatani, K., et al. (2008). A new GPS-acoustic method for measuring ocean floor crustal deformation: application to the Nankai Trough. J. Geophys. Res. 113:B02401. doi: 10.1029/2006JB004875
Kato, T., Terada, Y., Tadokoro, K., Kinugasa, N., Futamura, A., Toyoshima, M., et al. (2018). Development of GNSS buoy for a synthetic geohazard monitoring system. J. Disaster Res. 13, 460–471. doi: 10.20965/jdr.2018.p0460
Kido, M. (2007). Detecting horizontal gradient of sound speed in ocean. Earth Planets Space 59, e33–e36. doi: 10.1186/BF03352027
Kido, M., Osada, Y., Fujimoto, H., Hino, R., and Ito, Y. (2011). Trench-normal variation in observed seafloor displacements associated with the 2011 Tohoku-oki earthquake. Geophys. Res. Lett. 38:L24303. doi: 10.1029/2011GL050057
Matsumoto, Y., Ishikawa, T., Fujita, M., Sato, M., Saito, H., Mochizuki, M., et al. (2008). Weak interplate coupling beneath the subduction zone off Fukushima, NE Japan, inferred from GPS/acoustic seafloor geodetic observation. Earth Planets Space 60, e9–e12. doi: 10.1186/BF03353114
Obara, K., and Kato, A. (2016). Connecting slow earthquakes to huge earthquakes. Science 353, 253–257. doi: 10.1126/science.aaf1512
Ochi, T. (2015). Temporal change in plate coupling and long-term slow slip events in southwestern Japan. Earth. Planet. Sci. Lett. 431, 8–14. doi: 10.1016/j.epsl.2015.09.012
Sato, M., Fujita, M., Matsumoto, Y., Ishikawa, T., Saito, H., Mochizuki, M., et al. (2013a). Interplate coupling off northeastern Japan before the 2011 Tohoku-oki earthquake, inferred from seafloor geodetic data. J. Geophys. Res. Solid Earth 118, 3860–3869. doi: 10.1002/jgrb.50275
Sato, M., Fujita, M., Matsumoto, Y., Saito, H., Ishikawa, T., and Asakura, T. (2013b). Improvement of GPS/acoustic seafloor positioning precision through controlling the ship’s track line. J. Geod. 118, 1–10. doi: 10.1007/s00190-013-0649-9
Sato, M., Ishikawa, T., Ujihara, N., Yoshida, S., Fujita, M., Mochizuki, M., et al. (2011). Displacement above the hypocenter of the 2011 Tohoku-oki earthquake. Science 332:1395. doi: 10.1126/science.1207401
Spiess, F. N. (1985). Suboceanic geodetic measurements. IEEE Trans. Geosci. Remote Sens. 23, 502–510.
Tadokoro, K., Kinugasa, N., Kato, T., Terada, Y., and Matsuhiro, K. (2020). A Marine-buoy-mounted system for continuous and real-time measurment of seafloor crustal deformation. Front. Earth Sci. 8:123. doi: 10.3389/feart.2020.00123
Takahashi, N., Ishihara, Y., Ochi, H., Fukuda, T., Tahara, J., Maeda, Y., et al. (2014). New buoy observation system for tsunami and crustal deformation. Mar. Geophys. Res. 35, 243–253. doi: 10.1007/s11001-014-9235-7
Yokota, Y., and Ishikawa, T. (2020). Shallow slow slip events along the Nankai Trough detected by GNSS-A. Sci. Adv. 6:eaay5786. doi: 10.1126/sciadv.aay5786
Yokota, Y., Ishikawa, T., Sato, M., Watanabe, S.-I., Saito, H., Ujihara, N., et al. (2015). Heterogeneous interplate coupling along the Nankai Trough, Japan, detected by GPS-acoustic seafloor geodetic observation. Progr. Earth Planet. Sci. 2:10. doi: 10.1186/s40645-015-0040-y
Yokota, Y., Ishikawa, T., and Watanabe, S. (2018). Seafloor crustal deformation data along the subduction zones around Japan obtained by GNSS-A observations. Sci. Data 5:180182. doi: 10.1038/sdata.2018.182
Yokota, Y., Ishikawa, T., and Watanabe, S. (2019). Gradient field of undersea sound speed structure extracted from the GNSS-A oceanography. Mar. Geophys. Res. 40, 493–504. doi: 10.1007/s11001-018-9362-7
Yokota, Y., Ishikawa, T., Watanabe, S., Tashiro, T., and Asada, A. (2016). Seafloor geodetic constraints on interplate coupling of the Nankai Trough megathrust zone. Nature 534, 374–377. doi: 10.1038/nature17632
Yokota, Y., and Okumura, M. (2015). Study for improving efficiency in seafloor geodetic observation by means of multi-acoustic ranging. Rep. Hydro. Ocean Res. 52, 79–87.
Keywords: GNSS-A, underwater acoustics, seafloor geodesy, subduction zone, megathrust earthquake
Citation: Ishikawa T, Yokota Y, Watanabe S and Nakamura Y (2020) History of On-Board Equipment Improvement for GNSS-A Observation With Focus on Observation Frequency. Front. Earth Sci. 8:150. doi: 10.3389/feart.2020.00150
Received: 07 February 2020; Accepted: 21 April 2020;
Published: 15 May 2020.
Edited by:
Keiichi Tadokoro, Nagoya University, JapanReviewed by:
Motoyuki Kido, Tohoku University, JapanCopyright © 2020 Ishikawa, Yokota, Watanabe and Nakamura. This is an open-access article distributed under the terms of the Creative Commons Attribution License (CC BY). The use, distribution or reproduction in other forums is permitted, provided the original author(s) and the copyright owner(s) are credited and that the original publication in this journal is cited, in accordance with accepted academic practice. No use, distribution or reproduction is permitted which does not comply with these terms.
*Correspondence: Tadashi Ishikawa, aXNoaWthd2FAam9kYy5nby5qcA==; Yusuke Yokota, eXlva290YUBpaXMudS10b2t5by5hYy5qcA==
Disclaimer: All claims expressed in this article are solely those of the authors and do not necessarily represent those of their affiliated organizations, or those of the publisher, the editors and the reviewers. Any product that may be evaluated in this article or claim that may be made by its manufacturer is not guaranteed or endorsed by the publisher.
Research integrity at Frontiers
Learn more about the work of our research integrity team to safeguard the quality of each article we publish.