 Keiichi Tadokoro
 Natsuki Kinugasa
 Teruyuki Kato2
- 1Earthquake and Volcano Research Center, Graduate School of Environmental Studies, Nagoya University, Nagoya, Japan
- 2Hot Springs Research Institute of Kanagawa Prefecture, Odawara, Japan
- 3National Institute of Technology, Kochi College, Nankoku, Japan
- 4Technical Center, Nagoya University, Nagoya, Japan
In this paper, we describe the development of a continuous real-time system capable of measuring seafloor crustal deformation using the global satellite navigation system (GNSS)/Acoustic technique and a moored buoy. A program developed was implemented on the buoy to automatically distinguish the onset of a direct acoustic wave even if that wave had been contaminated with reflected waves and to detect the true travel-times by onboard processing rather transferring raw waveforms to the ground base station. This onboard procedure contributed to reduce the data size over a satellite communication. We conducted an operations test for a total of 106 days and found that the acoustic ranging and data transmissions were frequently interrupted by an unstable power supply, resulting in only 21% of the transmitted data being received at the ground base station. Nevertheless, we did not find any problem with continuous acoustic ranging measurement except for the above-mentioned power supply failure.
Introduction
A system for seafloor crustal deformation measurement using the global satellite navigation system (GNSS) and acoustic techniques has been developed over the last 20 years (e.g., Spiess et al., 1998; Fujimoto, 2006; Fujita et al., 2006; Tadokoro et al., 2006; Ikuta et al., 2008). The system measures seafloor crustal deformations by making repeated measurements of the positions of several acoustic transponders placed on the seafloor. The system has contributed much to the understanding of various geophysical and seismological phenomena, such as the motions of plates or blocks (Spiess et al., 1998; Chadwell and Spiess, 2008; Yasuda et al., 2017; Chen et al., 2018), plate convergence and interplate coupling (Gagnon et al., 2005; Fujita et al., 2006, Matsumoto et al., 2008; Tadokoro et al., 2012, 2018; Watanabe et al., 2014, 2018; Yasuda et al., 2014; Yokota et al., 2015, 2016; Nishimura et al., 2018; Kimura et al., 2019), co-seismic displacements (Kido et al., 2006, 2011; Tadokoro et al., 2006; Sato et al., 2011a; Iinuma et al., 2012), and post-seismic deformations (Matsumoto et al., 2006; Sato et al., 2011b; Tomita et al., 2015, 2017; Iinuma et al., 2016).
The next objective is to add continuous real-time measurement capability to the system to detect transient events, such as slow slips, and to provide quick response for geodetical events. As currently implemented, the GNSS/Acoustic measurements are performed using research vessels, which restricts observations during a campaign to long time intervals of more than several months. Recently, the Japan Coast Guard made a significant effort to obtain high frequency measurements with vessels, and successfully detected an off-shore slow slip event with seafloor displacements of about 5–10 cm (Yokota and Ishikawa, 2020). Nevertheless, the observation frequency was still limited to 6–8 times a year. Thus, to achieve the above stated objective, it is essential to develop techniques using alternative sea-surface platforms instead of vessels. Kido et al. (2015, 2018) and Imano et al. (2019) reported the development and operational tests of a GNSS/Acoustic measurement system using a small moored buoy and an autonomous surface vehicle. Other researchers have evaluated the use of the Wave Glider (Liquid Robotics, Inc.) as a novel platform for GNSS/Acoustic measurements (Chadwell, 2013; Sathiakumar et al., 2016).
Our research group was tasked with developing a system capable of continuous real-time measurement of seafloor crustal deformations using the GNSS/Acoustic technique. In this development, a moored buoy was employed as a sea-surface platform as the plan is to eventually integrate the developed system into existing GNSS buoys to enhance their function (Kato et al., 2018). The GNSS buoy system was developed in around 1997 for tsunami early warning purposes, and the particular GNSS buoys under successfully recorded tsunamis generated by the 2001 Peru earthquake, the 2003 Tokachi-Oki earthquake in Japan (Kato et al., 2001), and an earthquake that occurred off the southern coast of Japan in 2004 (Kato et al., 2005). The developed GNSS buoy system has been employed in the nationwide ocean wave information network for ports and harbors (NOWPHAS) wave monitoring system installed along the Japanese coast from approximately 2008. The NOWPHAS provided real-time records of the tsunamis after the Mw 9.0 Tohoku-oki earthquake, which were used to significantly upgrade the tsunami warning level after the earthquake (Ozaki, 2011).
In this paper, we describe the developed observation system that was installed on a moored buoy and report the results of acoustic ranging tests.
Buoy-Mounted Acoustic Ranging System
The buoy-mounted system for the GNSS/Acoustic measurement is composed of the following five components (Figure 1): (1) an acoustic ranging controller (developed by Kaiyo Denshi Co., Ltd.) and an acoustic transducer; (2) a signal processing computer (PC Engines alix3d3) running a Linux OS; (3) a GNSS receiver (Hitachi Zosen) equipped with a network solution module (RTNet, GPS Solutions Inc.; Rocken et al., 2004) that employs the precise point positioning with ambiguity resolution (PPP-AR) algorithm (Mervart et al., 2008); (4) a gyroscope (SBG Systems Ellipse-N); and 5) a satellite communications modem. The signal processing computer, GNSS receiver, gyroscope data storage, and satellite modem are all connected in a single Ethernet network via a switching hub and all the data are transmitted in real-time to a ground base station via a satellite link.
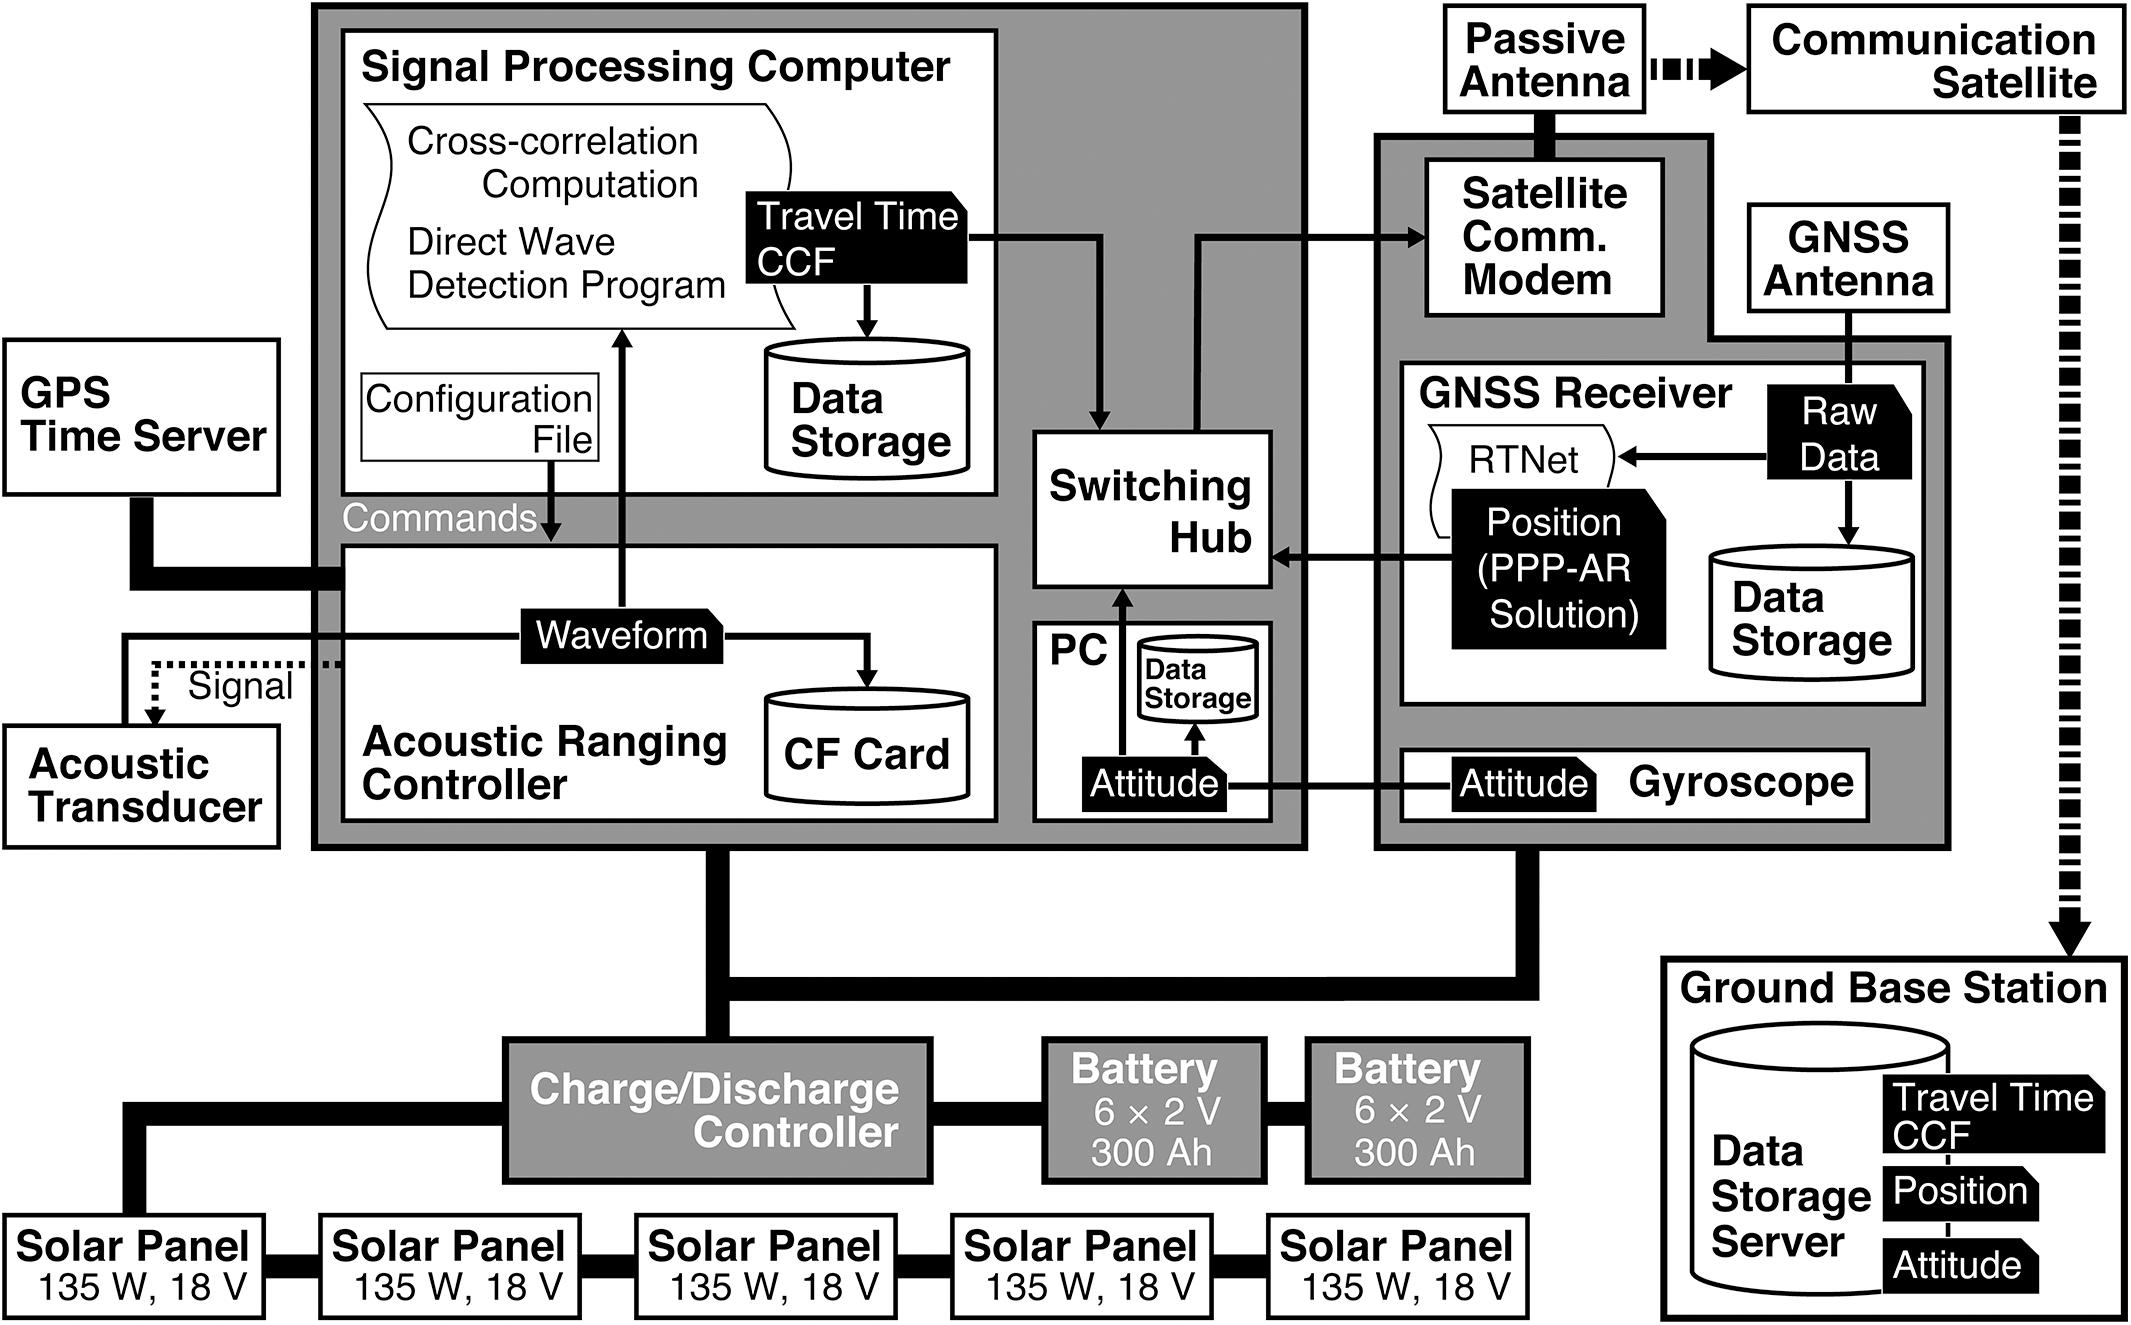
Figure 1. Diagram showing system configuration of buoy-mounted components and data flow. Frames painted gray indicate the waterproof boxes.
The acoustic ranging controller transmits an ultrasonic wave with a signal length of 14.322 ms in the form of a fifth-order M-sequence wave with six-cycle carrier waves per unit digit on carrier wave frequency of 12.987 kHz (Tadokoro et al., 2006). The signal timing is synchronized to the 1 PPS (Pulse Per Second) signal and the National Marine Electronics Association (NMEA) recommended minimum (RMC) sentence from a GPS time server (Garmin GPS 19x HVS). The acoustic ranging controller works by receiving commands from the signal processing computer. Once the acoustic ranging controller has received a wake-up command, it starts and automatically continues signal transmission with a fixed interval written in a configuration file in the signal processing computer. It is possible in principle to remotely manage the acoustic ranging controller, including the pinging interval, by modifying the configuration file via satellite communication. The signal processing computer can automatically restart the acoustic ranging controller in the event the power has been temporarily interrupted. The transmitted acoustic signal is received at a pre-installed seafloor transponder. The transponder once records the acoustic signal and returns it to the buoy-mounted acoustic ranging controller after a turn-around-time of 1.024 s to avoid reverberations in the sea. The acoustic ranging controller samples the received signal at 16-bits at a frequency of 500 kHz, then stores the waveform for 64.512 ms before sending the associated data to the USB 2.0 connected signal processing computer at 230,400 bps. After the computer receives the signal, it automatically detects the onset of the returned acoustic signal within about 20 ms using our original programing code described later. The position of the buoy is computed as per the PPP-AR algorithm once per second in real-time by the network module in the GNSS receiver. Note that the PPP-AR positioning in the system relies on precise orbits and clock correction parameters obtained from the regional data of the GNSS Earth Observation Network System (GEONET) operated by the Geospatial Information Authority of Japan (Kato et al., 2017). When tested, the accuracy of our PPP-AR positioning is within a few centimeters for all dimensions including the vertical component in the presence of fixed carrier phase ambiguity (Terada et al., 2015; Kato et al., 2018). As we are more interested in the position of the acoustic transducer rather than that of the GNSS antenna itself, the attitude of buoy is measured using the gyroscope (SBG Systems Ellipse-N) once per second.
The buoy-mounted system was installed on a moored buoy which is anchored 32 km off Cape Ashizuri, Japan (Figure 2), on March 28, 2018 for an operational test. The water depth is about 800 m. The buoy, named Kuroshio-Bokujyo No. 18 (Figure 3), is operated by the Kochi Prefecture as a floating fish aggregation device and had a diameter of 8 m and a height of more than 8 m above sea level. The system components were installed in waterproof boxes and affixed to the deck of the buoy. The necessary power was generated using five 135-Watt 18-Volt solar panels connected in a series and is stored in 24 V (12 × 2 V) valve-regulated stationary lead-acid batteries with a capacity of 300 Ah (10-h rate). The acoustic ranging controller and GPS time server operated at 24 VDC while the other instruments operated at 12 VDC, converted from 24 V using a DC/DC converter. Antennas for the GNSS, Trimble Zephyr 2 Geodetic, and satellite communications were mounted on the top of the buoy. The precise relative position between the acoustic transducer and GNSS antenna was 9.98 m vertically and 4.18 m horizontally in the coordinate system fixed on the buoy.
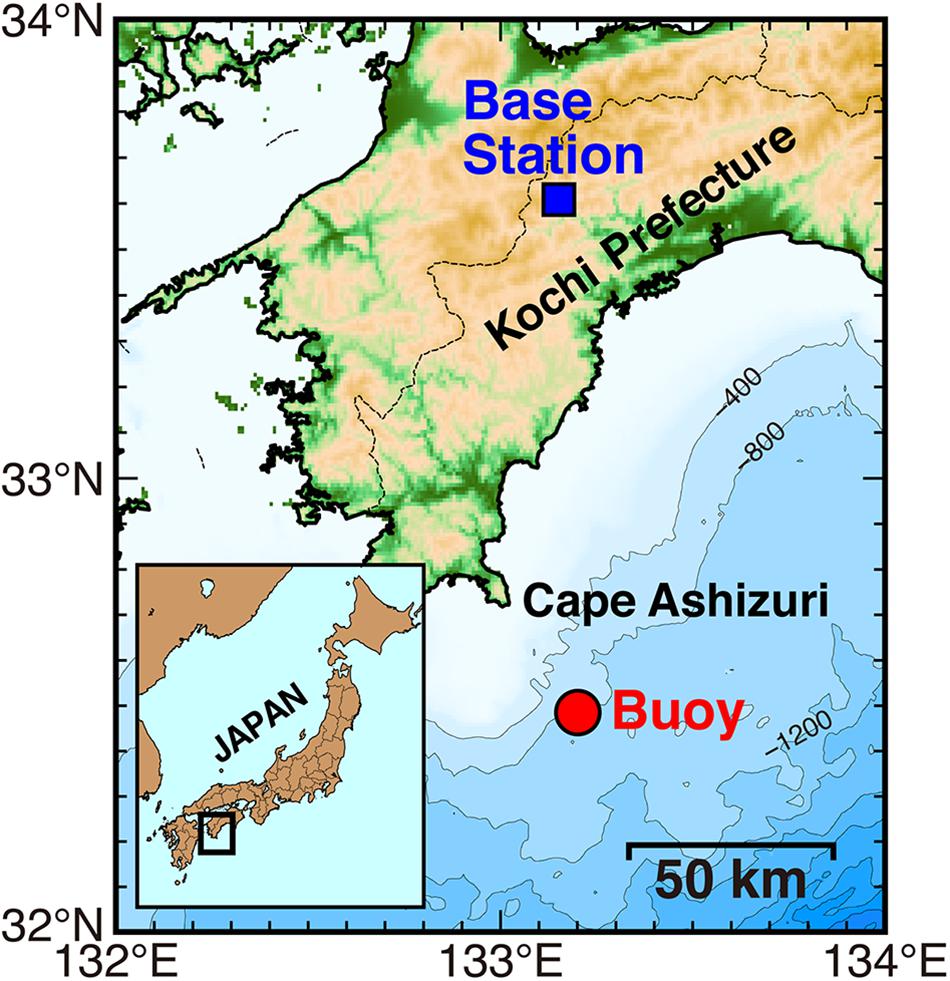
Figure 2. Locations of test site, Kuroshio-Bokujyo No. 18 buoy (red solid circle) and ground base station (blue solid square). Topography and bathymetry data are provided from SRTM30_PLUS (Becker et al., 2009).
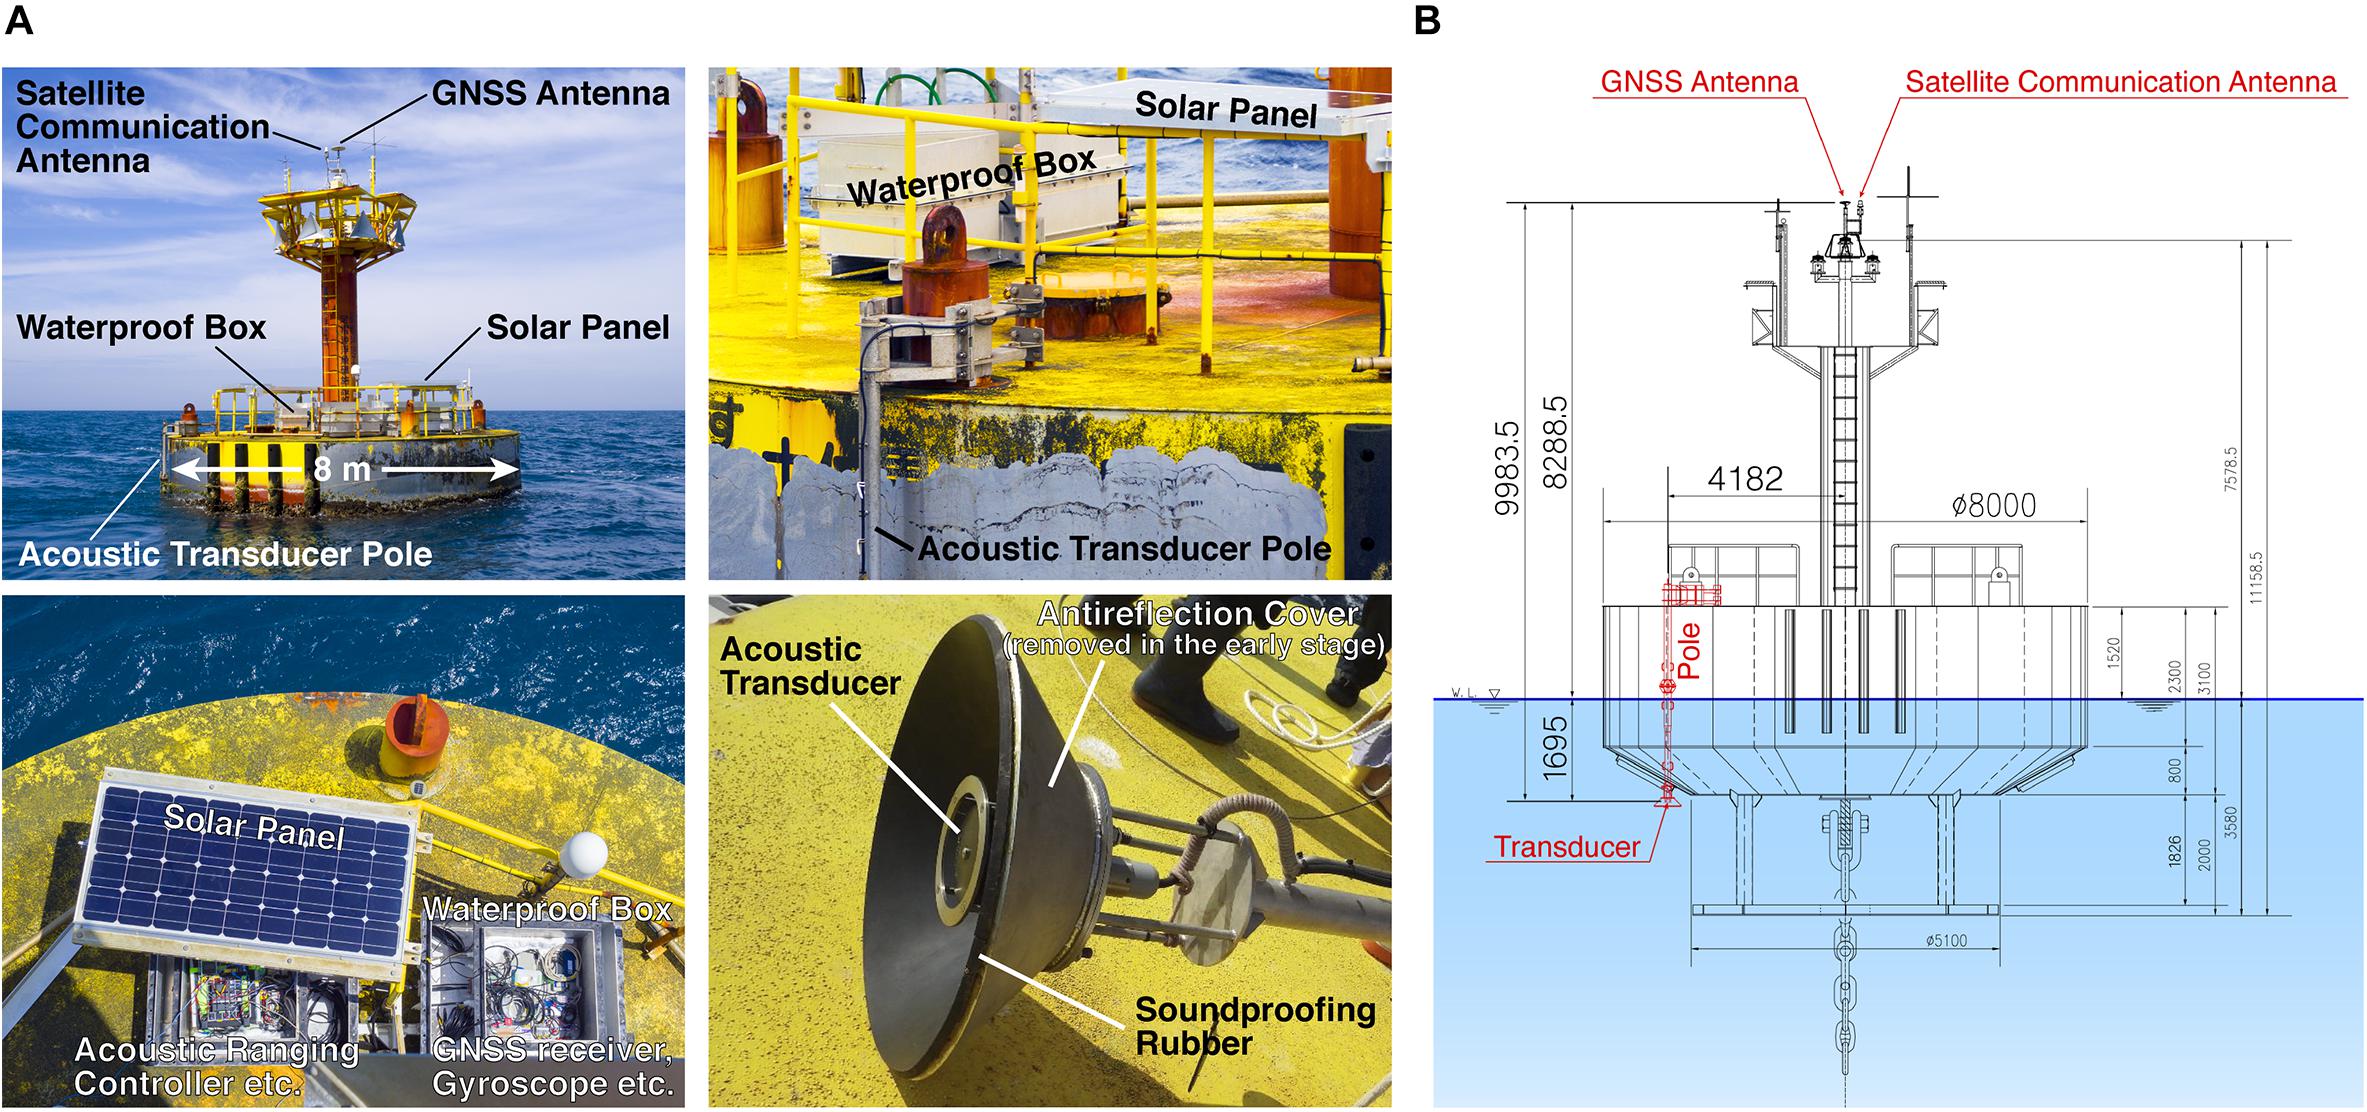
Figure 3. (A) Kuroshio-Bokujyo No. 18 buoy equipped with our system. The antireflection cover around the acoustic transducer has been removed. (B) Side view of the design drawing of the buoy.
The acoustic transducer was mounted at about 1.7 m below sea level with a stainless pole rigidly attached to the buoy (Figure 3B). To eliminate interference from acoustic waves reflected from the surface of the sea, the acoustic transducer was initially installed in a conical antireflection cover with soundproofing rubber. However, even with these precautions, multiple reflections inside of the cover were frequently detected because the soundproofing rubber became detached probably due to wave vibrations, and this made it difficult to distinguish the onset of the direct wave. To overcome this, the antireflective cover was removed as it was found to significantly reduce the confusion effects of the multiple reflections. The travel-time differences between the direct and sea-surface reflected waves were estimated to be almost 1.3–1.8 ms, which was sufficient to ensure that the direct wave could be easily distinguished even if the acoustic wave was contaminated by sea-surface reflections.
The data recorded on the buoy were transmitted to a ground base station through a commercial communications satellite operated by Thuraya Telecommunications Company where it was stored in a data storage server. The ground base station was in the inland town of Niyodogawa, Kochi Prefecture (Figure 2), which is 30 km from the southern coast of Japan and is therefore unlikely to be affected in the event of a tsunami due to a major subduction earthquake. The original acoustic waveform, raw GNSS, and gyroscope measurement data were also stored on-board for quality check and postprocess.
The ocean bottom acoustic transponders (Figure 4) were equipped with batteries with a planned life span of 5 years and electronic circuit boards mounted in a 17-inch diameter glass sphere along with an acoustic transducer. The seafloor benchmark, which consisted of three ocean bottom acoustic transponders, was installed on June 5, 2017 by the vessel Yuge Maru of the National Institute of Technology, Yuge College. The triangular configuration of the three transponders covered the area under the drifting sea surface buoy (Figure 5A). The locations of the transponders were selected based on the anchoring point of the buoy, the mooring chain length, and the dominant direction of the ocean current.
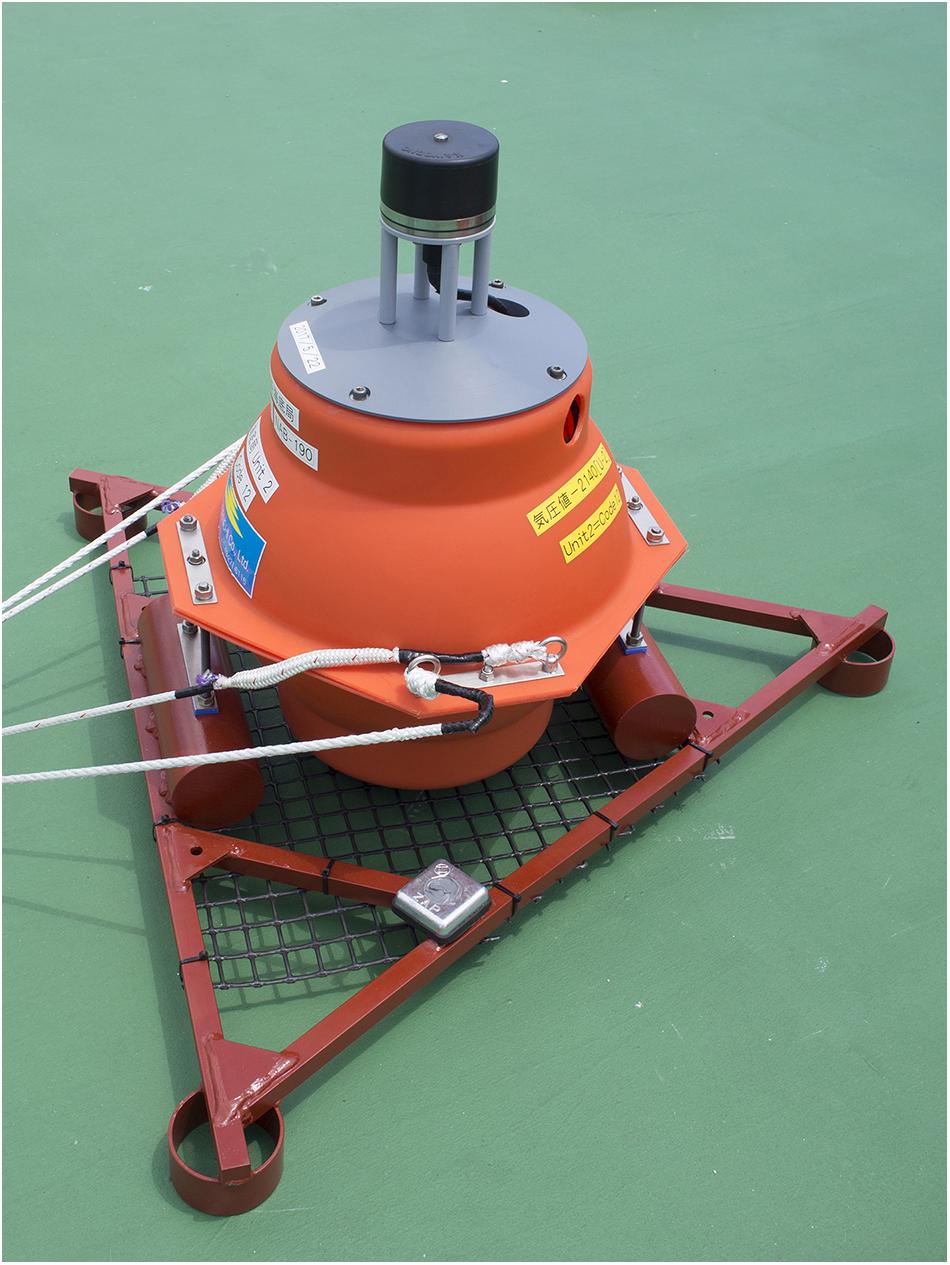
Figure 4. Photo of an ocean bottom acoustic transponder installed in the test site. The black device fixed on the top is the acoustic transducer.
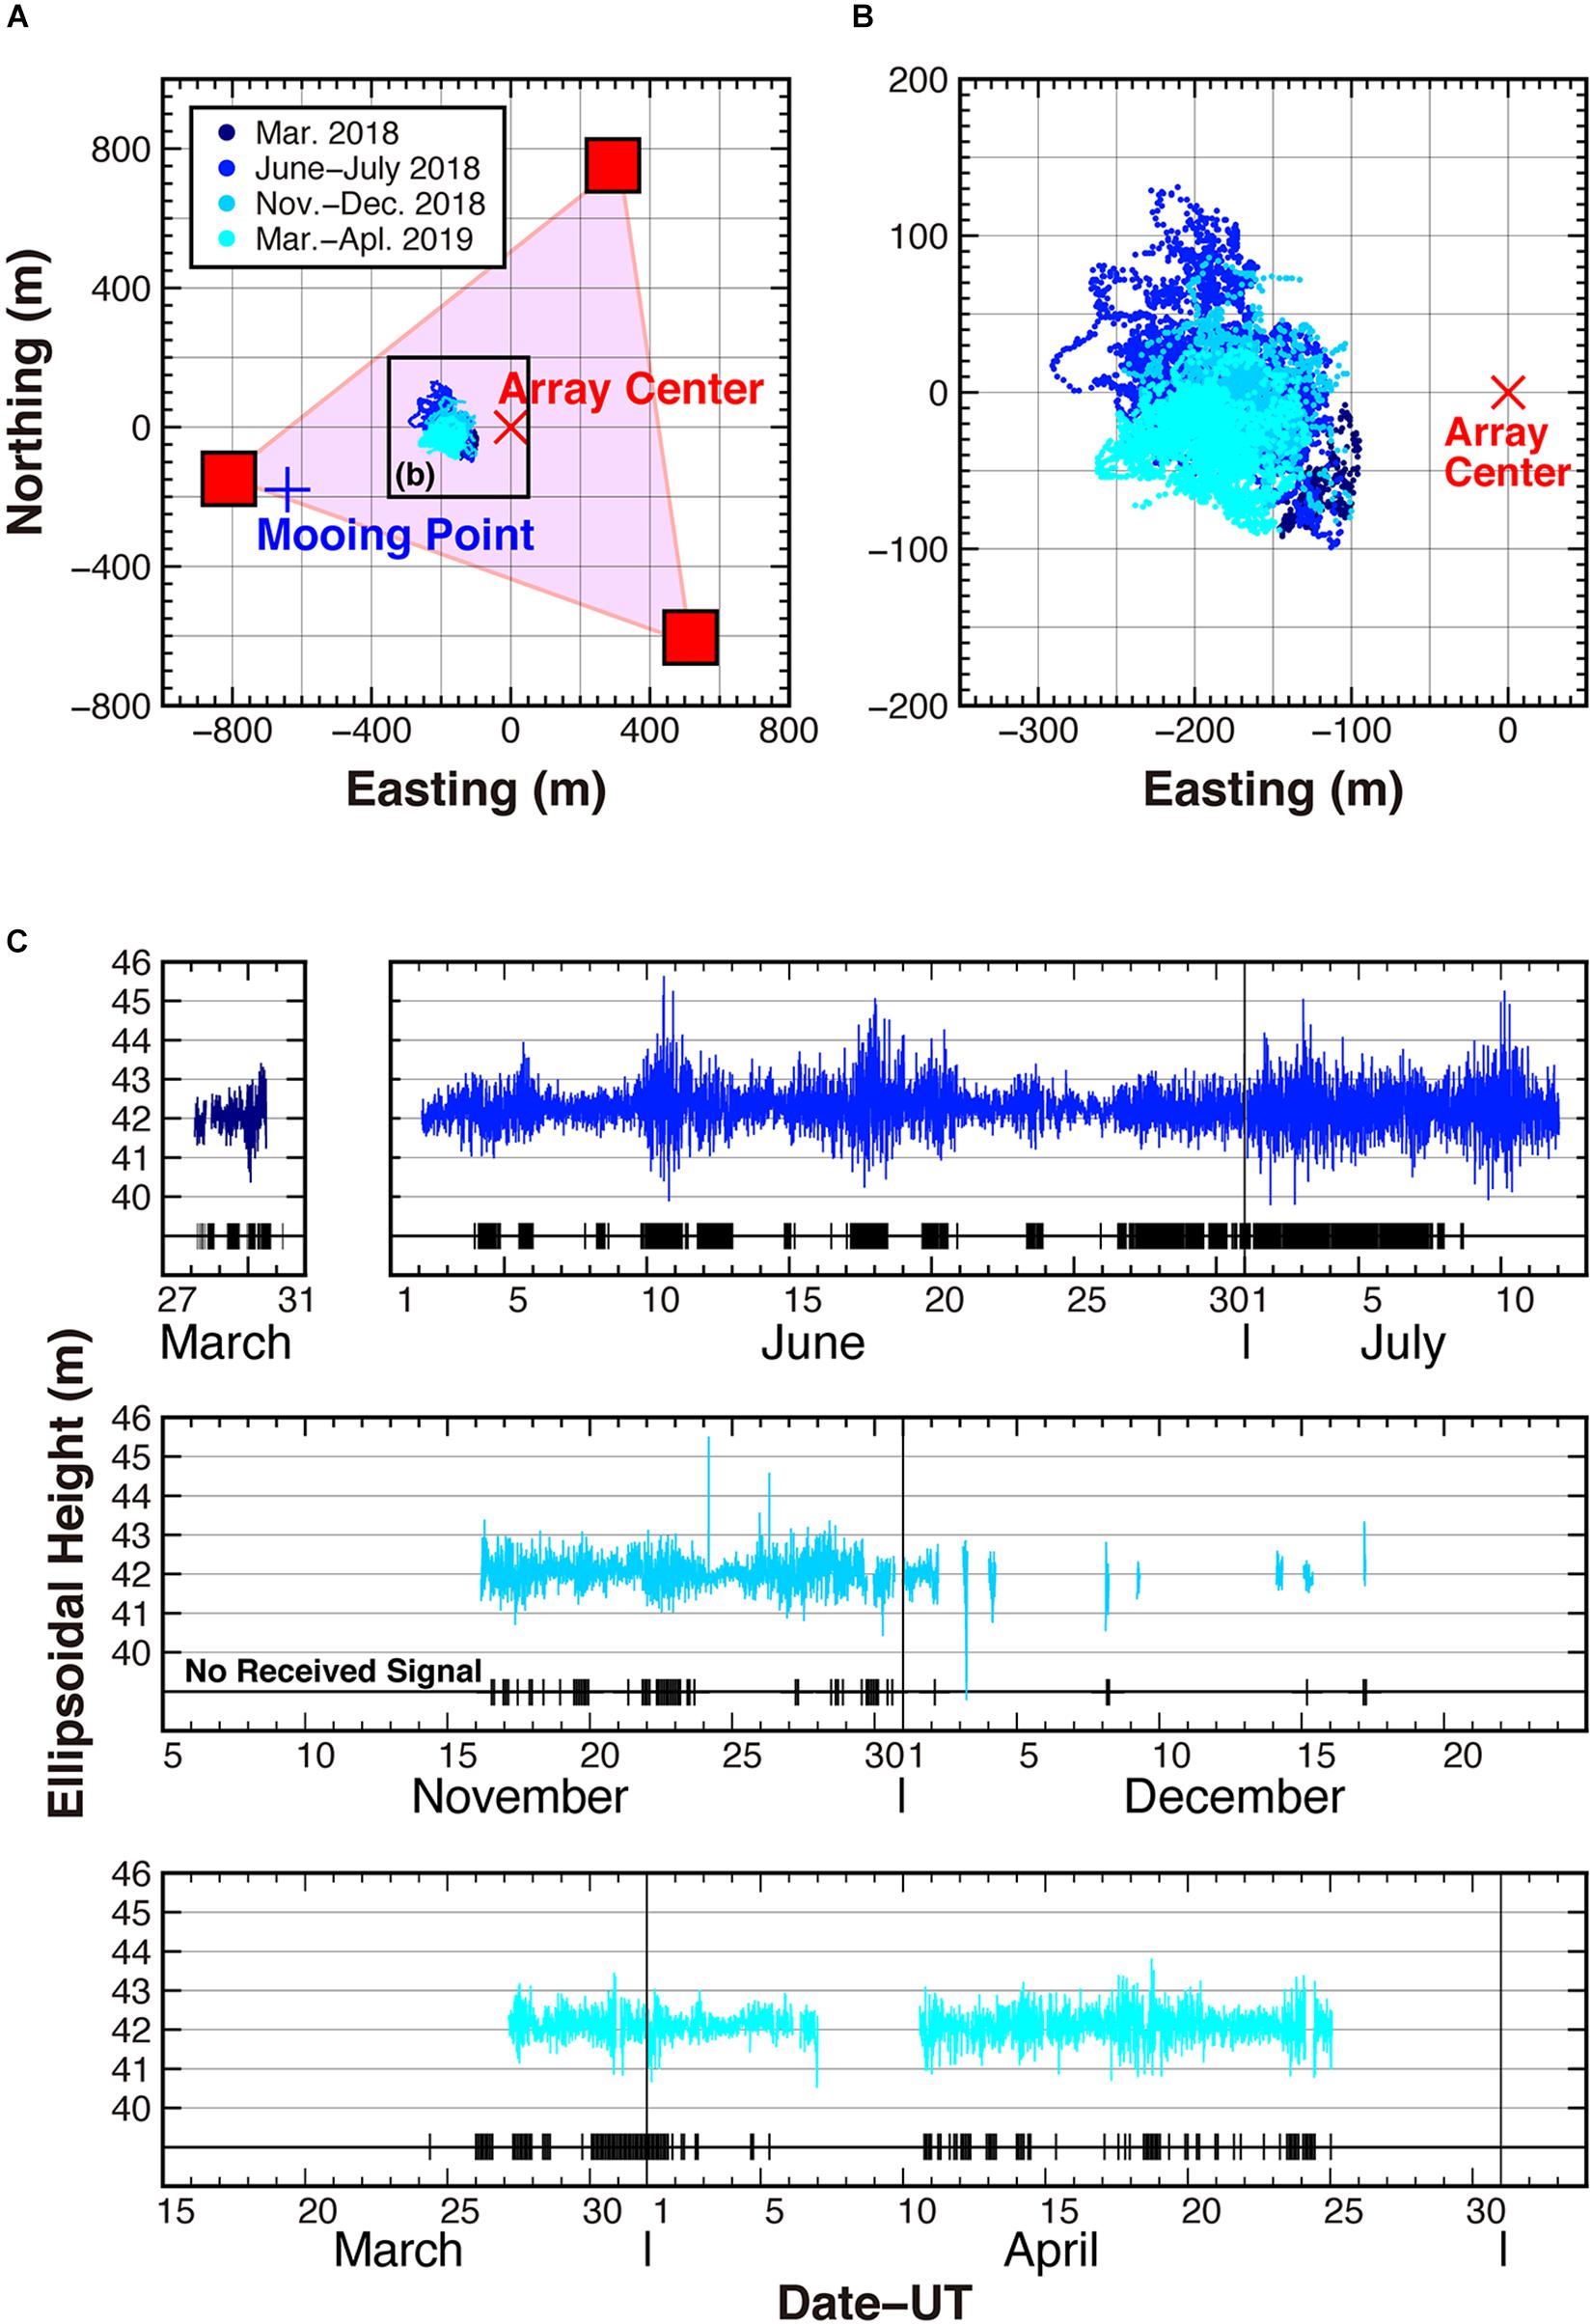
Figure 5. Positions of the buoy-mounted GNSS antenna during the operational test period determined by post-processed PPP (until July) and PPP-AR (after November). (A) and (B) Horizontal positions (small dots). Different colors indicate differences in period shown by the legend in (A). Red squares, red cross, and blue plus indicate the positions of ocean bottom acoustic transponders, center of the triangular transponder array, and anchored point of the buoy, respectively. (C) Ellipsoidal height after the tidal correction on the basis of NAO.99b model (Matsumoto et al., 2000). Black ticks indicate timings of no acoustic signal is recorded at the buoy-mounted acoustic ranging controller.
Continuous Acoustic Ranging Tests
Continuous acoustic ranging tests were performed for a total of 106 days during the following four periods: March 28–31, June 2–July 12, and November 16–December 17 in 2018; and March 24–April 25, 2019. The buoy position (i.e., the positions of the buoy-mounted GNSS antenna) every 10 min is shown in Figure 5. Note that the positions from March to July, 2018 were obtained via a post-processed PPP analysis conducted using commercial software (GrafNav of NovAtel, Inc.) as PPP-AR solutions from the system on the buoy were intermittently unavailable during this period. The positions after November, 2018 were computed by the PPP-AR algorithm on the buoy. The fluctuations in the ellipsoidal height due to the ocean tide were corrected using the NAO.99b model (Matsumoto et al., 2000). The test site was in an area of the strong east-northeastward Kuroshio ocean current, and the buoy drifted in the east-northeast direction from the anchored point and remained there for the entire period. The buoy drifted almost 100–250 m to the west of the array center, that is, the center of the triangle formed by the three ocean bottom acoustic transponders, which was the desired buoy position relative to the transponder formation (Kido et al., 2018; Imano et al., 2019). As the buoy well followed the movement of the sea-surface, the effects of heavy waves and/or swells due to cold and stagnant fronts (March 30 and July 5–7, 2018), low pressures (June 6, 18–21, and 24, 2018), and severe tropical storms or typhoons (June 11, July 2–4, and July 9–11, 2018) can all be seen in the time series of the ellipsoidal height.
It is known that temporal variations in the speed of sound in the ocean directly affect the accuracy of acoustic ranging, and short-period internal waves are one of the phenomena contributing to temporal variations in the speed of sound. In addition, the time scale of internal waves is known to be tens of minutes at a minimum (e.g., Ali, 1993). Matsui et al. (2019) reported that short-period, less than 1 h, internal waves arises fluctuations of sound-speed in the shallow layer causing large uncertainty of seafloor position. With this in mind, acoustic signals were transmitted sequentially to the three ocean bottom transponders at 3-min intervals; thus, each transponder received a signal every 9 min. This interval was chosen to balance the power consumption and keeping up the temporal variation in the sound speed associated with the internal wave.
A number of problems were encountered during the time the test was underway. The test unexpectedly terminated on March 28, 2018 when the circuit breaker in the battery charge controller forced to cut the power. The data transfer to the ground base station stopped on June 10, 2018 when the satellite modem disconnected. To prevent future occurrences of these situations, we implemented disconnection monitoring and a self-rebooting algorithm to the satellite modem. The data storage on the buoy terminated on June 13, 2018, probably due to high CPU load in the buoy-mounted server along with a communication port error. After this time, the devices handling the acoustic ranging data were no longer connected to the satellite communication modem, and no acoustic data were sent to the ground base station from November to December, 2018. Also, after November 29 or so, the acoustic ranging was frequently interrupted by unstable power, which was thought to be due to the lack of sunshine in the winter season.
In the original configuration installed on the buoy in 2018, the signal processing computer was connected to the GNSS receiver as a temporary data server via an RS-232C communication interface. However, in an attempt to resolve the above issues and improve system reliability before restarting the test on March 24, 2019, the data flow and connections between components were reconfigured to use Ethernet. Although the test was restarted on March 24, 2019, the power supply continued to be a problem that affected the data transfer to the ground base station until it finally terminated on April 11. The acoustic ranging was interrupted from April 6 to April 10, 2019.
The results from the continuous acoustic ranging test are shown in Figure 6. The acoustic ranging itself successfully continued throughout the test period as long as power was supplied to the system, as indicated by the red bars in Figure 6, although data transfer to the ground base station was intermittent. A total of 41,083 acoustic signals were transmitted from the buoy while the buoy-mounted acoustic ranging controller successfully received a total of 35,316 waveforms (86%) from the ocean bottom transponders. Nothing was recorded in the remaining 5767 files (14%), as indicated by the black bars in Figure 6, due to failures in automatic header detection by the acoustic ranging controller (Figure 5C). The ocean bottom transponders transmit a header signal prior to the main signal for the acoustic ranging to notify the buoy-mounted acoustic ranging controller the signal transmission. The acoustic ranging controller start the waveform recording after detecting the header signal. If the acoustic ranging controller fails to detect the header signal, nothing is recorded in the file. After the waveform data was manually reviewed, no clear returned signal was recognized in 1073 additional waveforms. A total of only 7553 signals (21% of the total number of successfully recorded signals) were transmitted to the ground base station through the satellite link, as indicated by the blue bars in Figure 6. Examples of acoustic ranging data received at the ground base station over the period of an hour are shown in Figure 7. The transmission time stamps of the acoustic signal transmissions are shown in the second column in Figure 7. In this example, the acoustic ranging data was successively transferred to the ground base station at 3-min intervals.
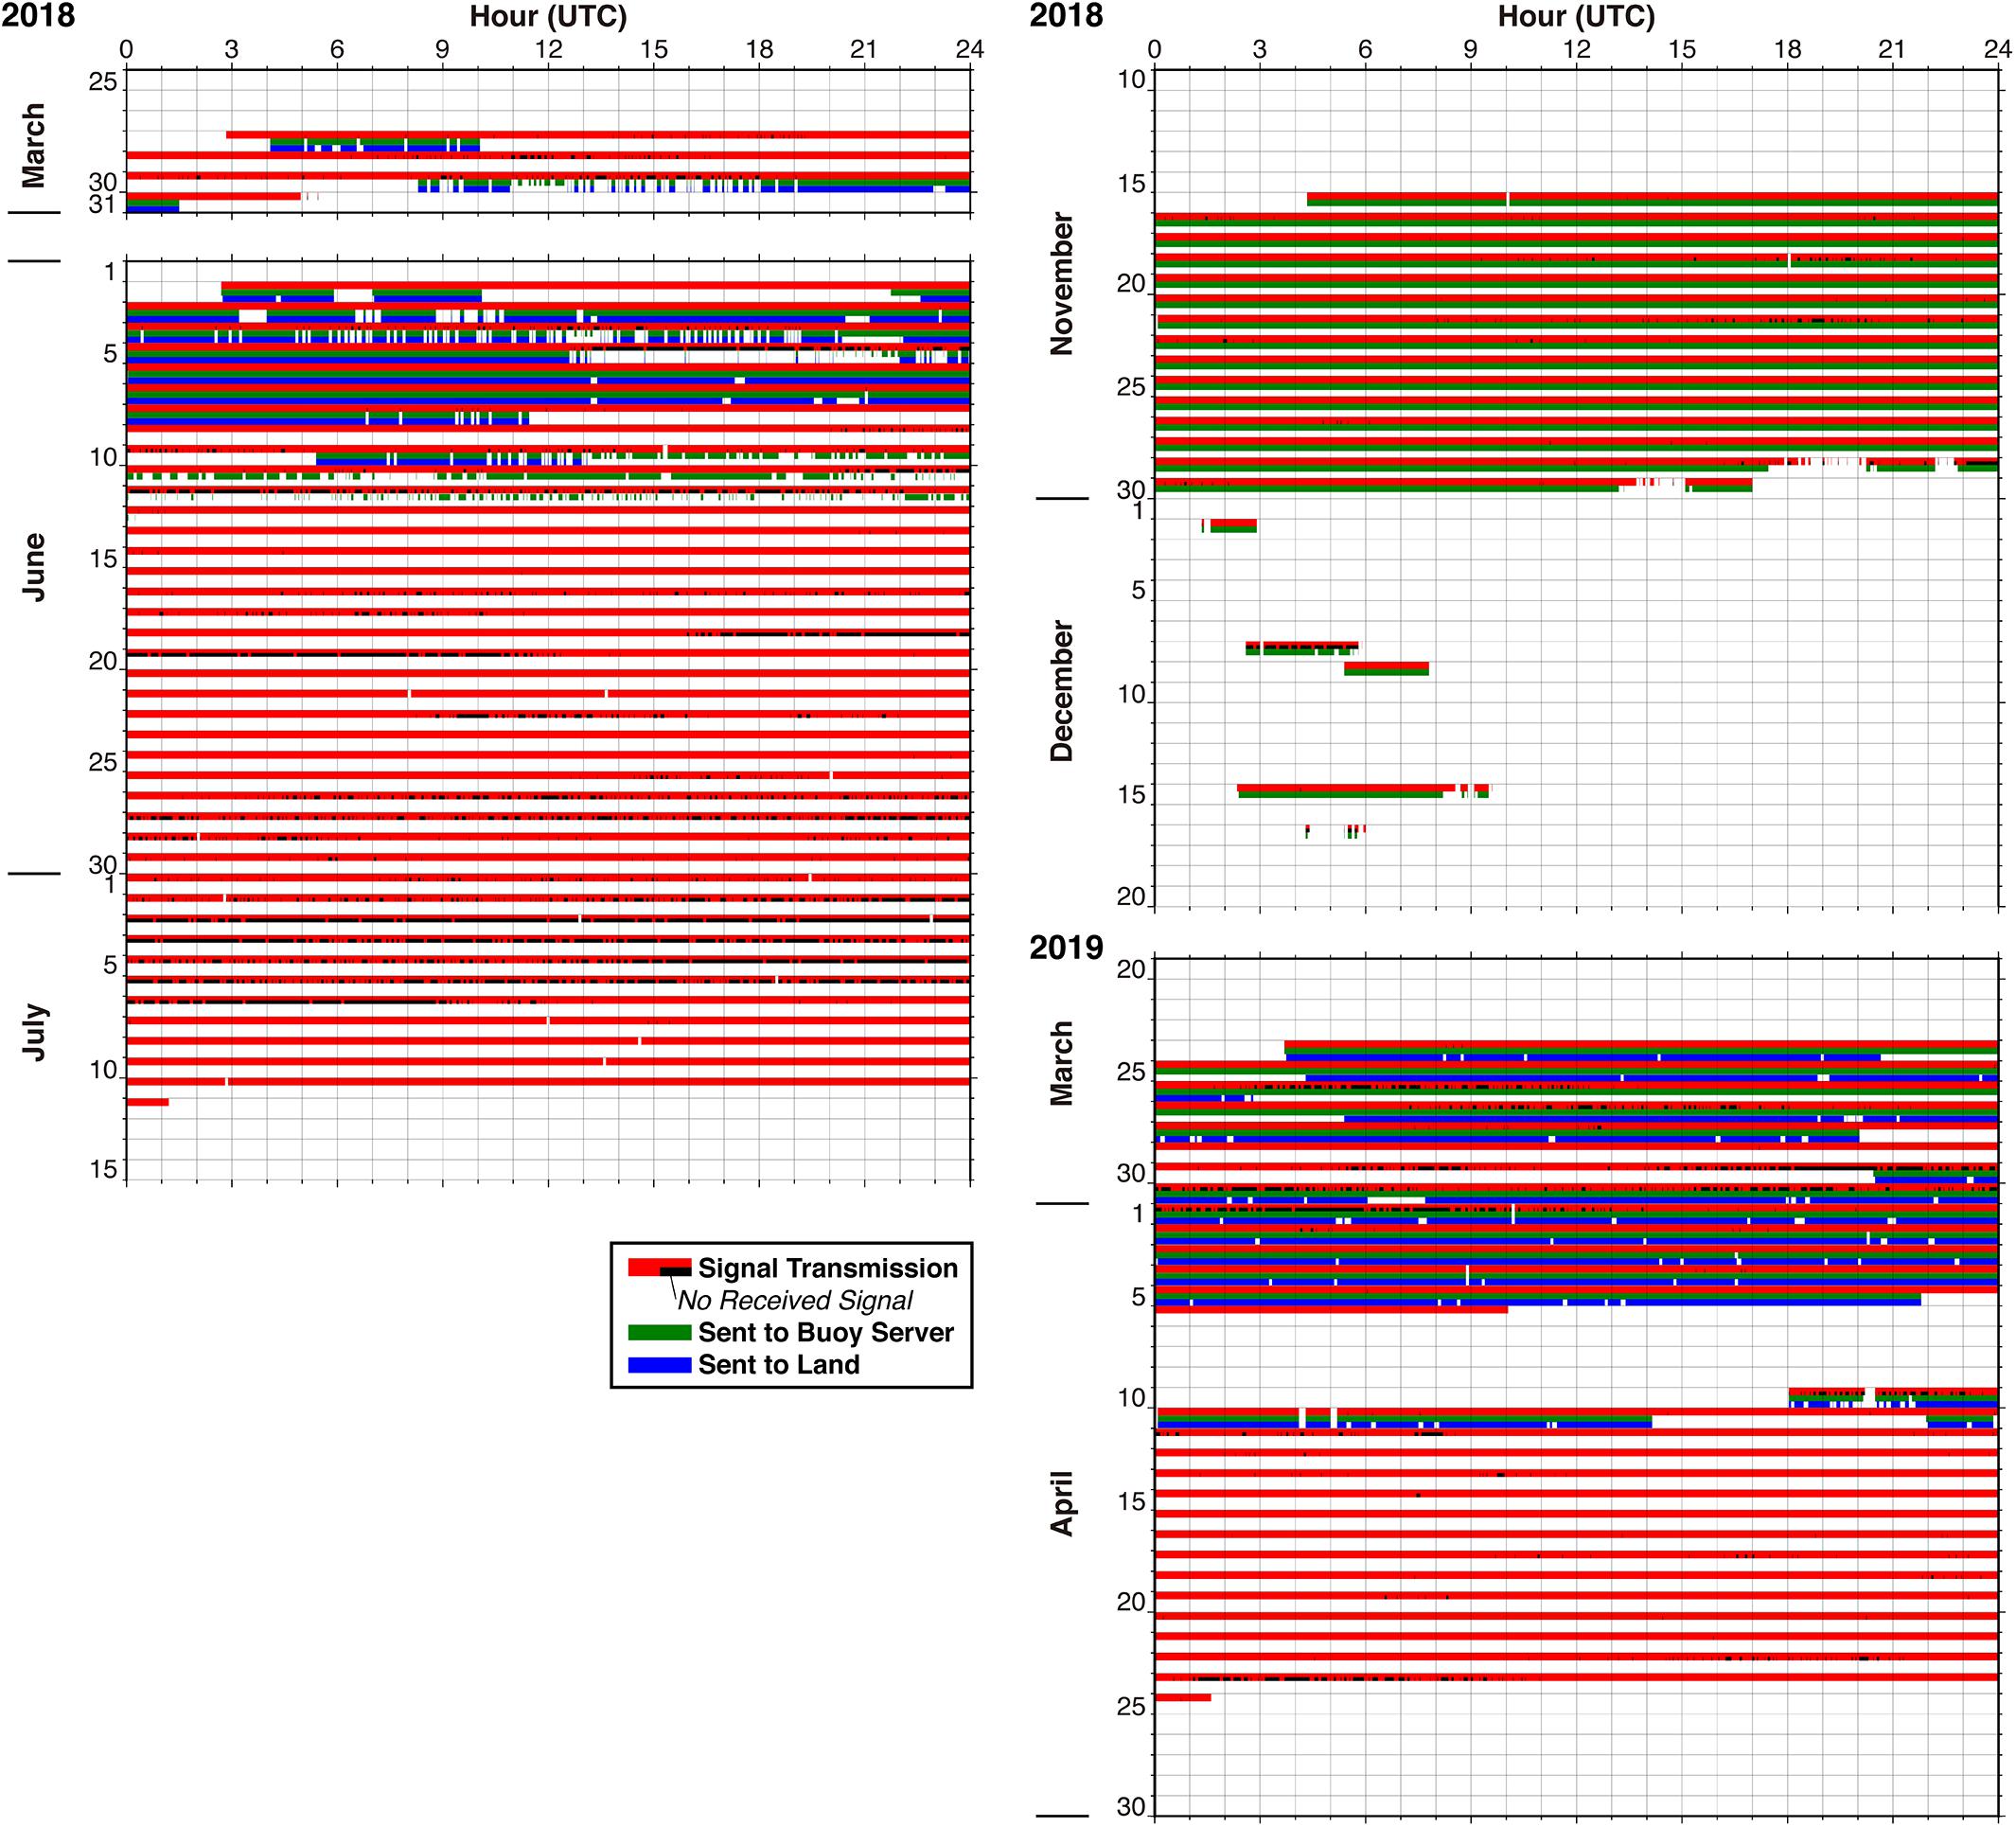
Figure 6. Diagram showing the status of acoustic ranging test. Red: buoy-mounted acoustic ranging controller transmitted the acoustic signal to the ocean bottom transponder, black: nothing was recorded at the acoustic ranging controller (the signal receiving was failed), green: the acoustic waveform was sent to the signal processing computer, blue: the acoustic waveform was sent to the data storage server at the ground base station via the satellite communication.
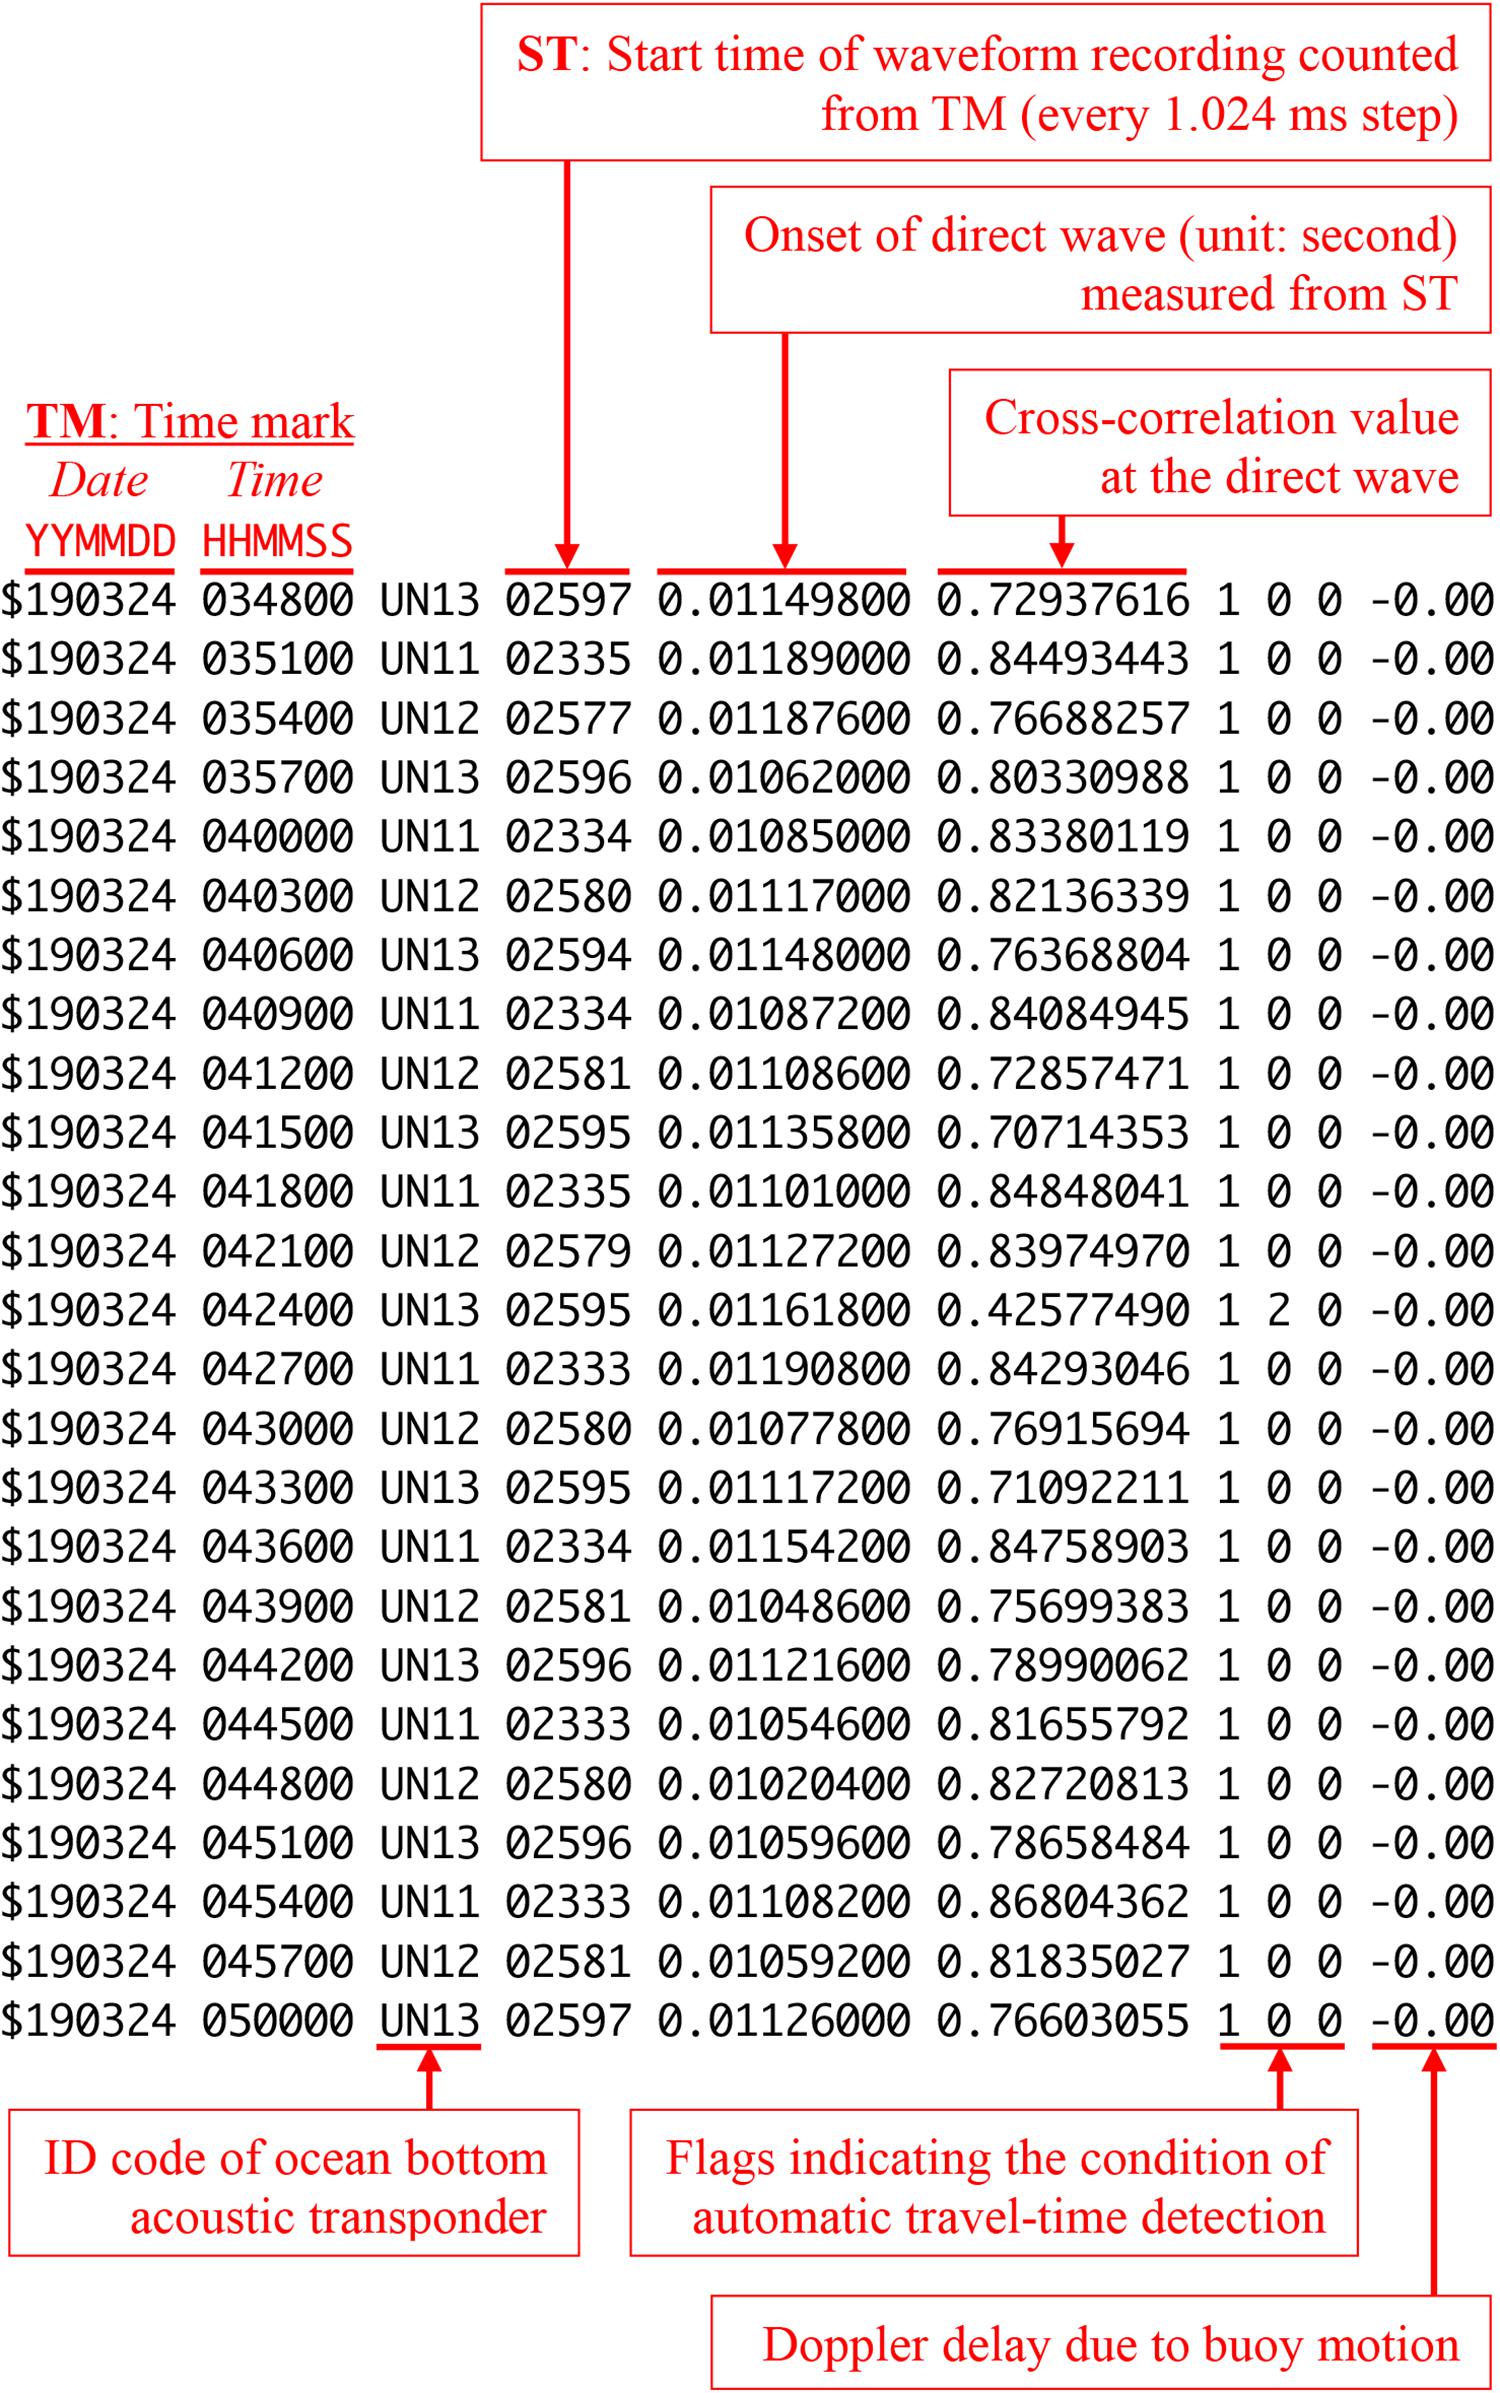
Figure 7. Example of acoustic ranging data received at the ground base station.
Examples of the acoustic waveform recorded in the buoy-mounted acoustic ranging controller are shown in Figure 8, where it can be seen that the buoy-based acoustic ranging system provided high quality waveforms based on the high maximum value of the absolute cross-correlation function (CCF) between the received and transmitted (reference) signals (Figure 9). This situation is different from those of conventional observations made using moving vessels with acoustic transducers mounted on a rod.
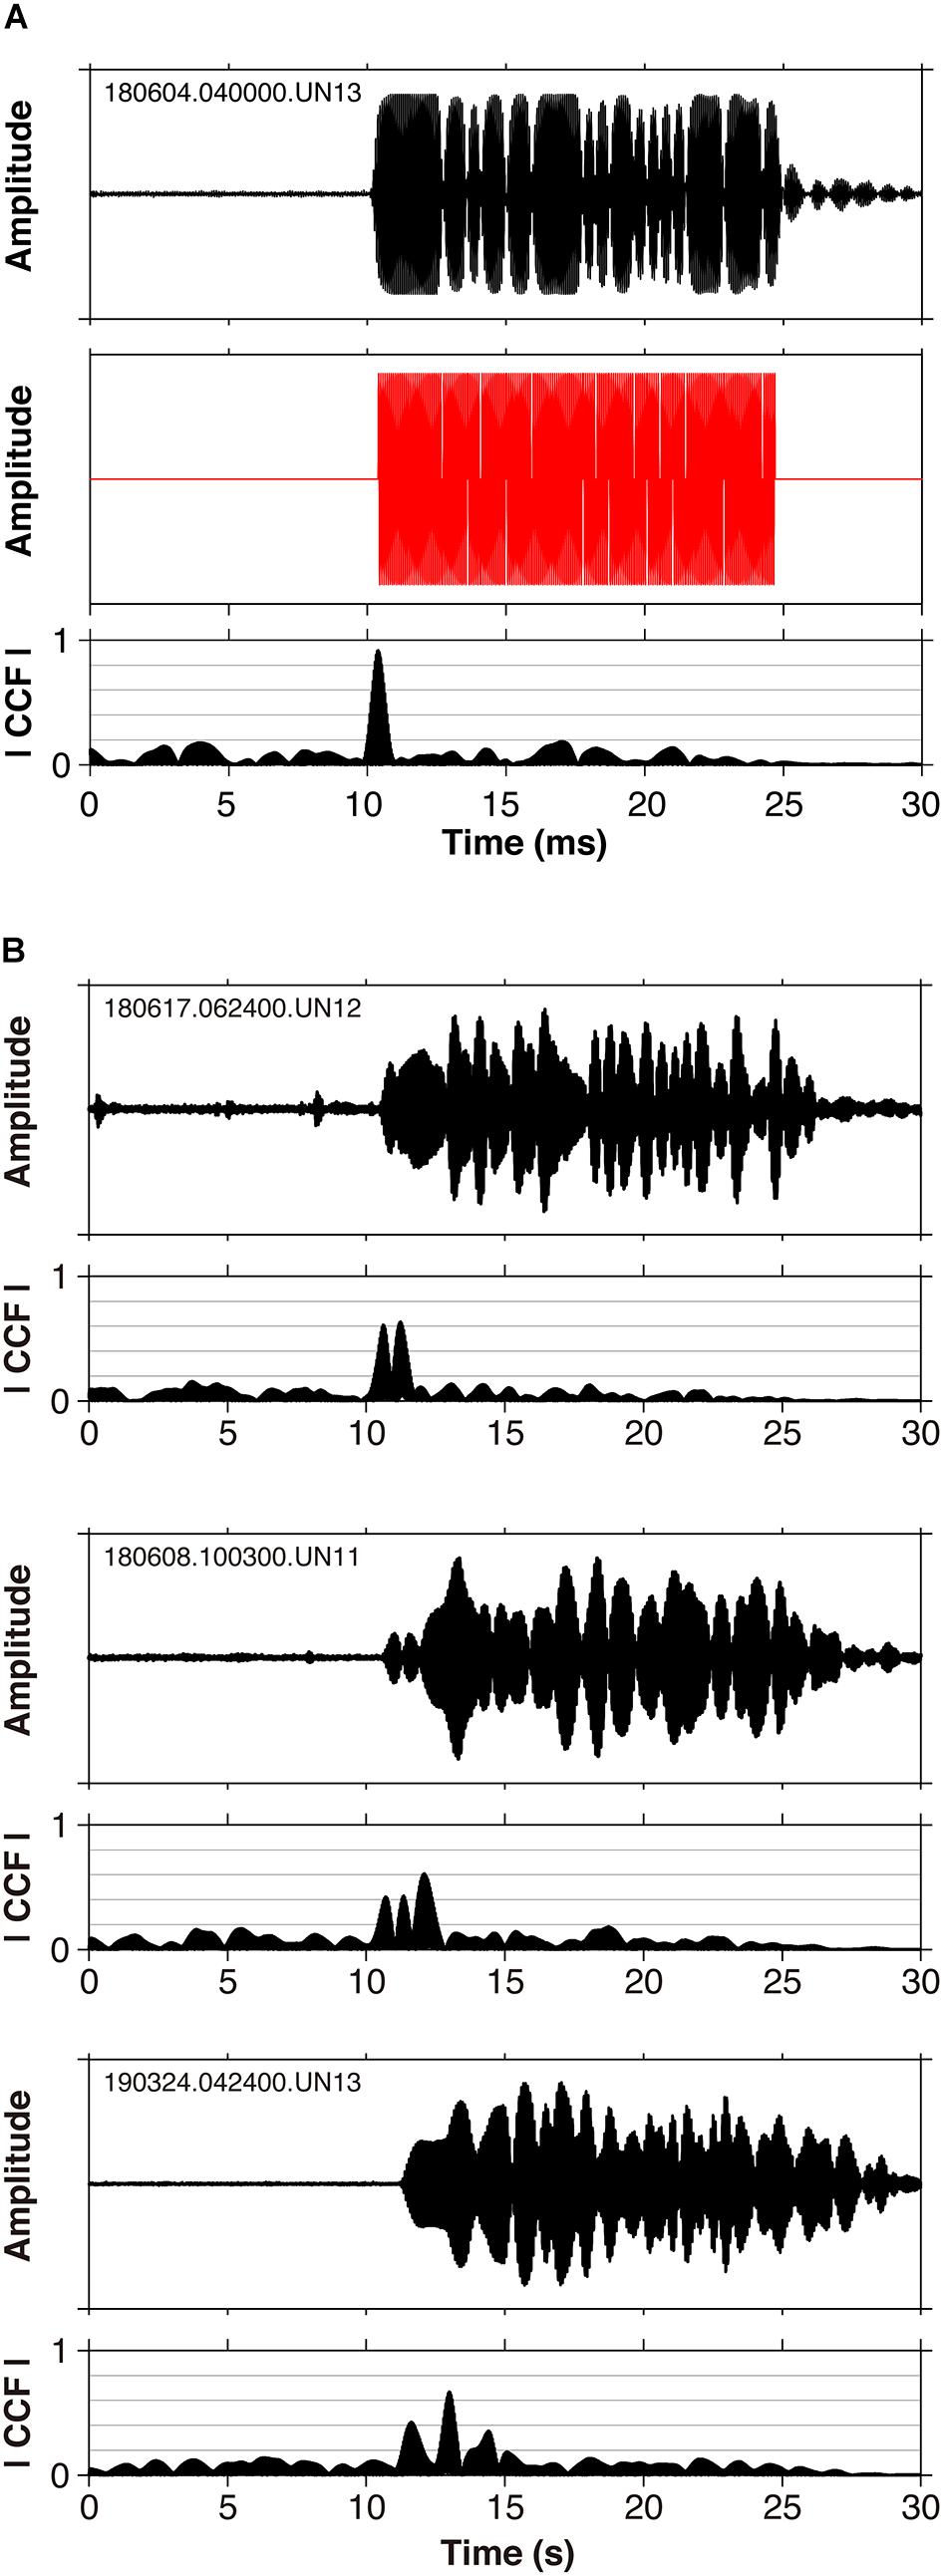
Figure 8. Examples of received acoustic waveform on the buoy-mounted acoustic ranging controller. (A) Waveform with high signal-to-noise ratio. Top: received waveform middle: theoretical transmitted signal from the buoy mounted acoustic transducer, bottom: absolute cross-correlation function (CCF) between the received and transmitted (reference) signals. The maximum value of the cross-correlation function is 0.92. (B) Waveforms with obvious reflected waves. Each noticeable peak of CCF corresponds to the onset of the direct or the reflected waves. Top and middle: reflected waves from the buoy body or the sea bottom are included, bottom: reflected waves from the sea surface are included.

Figure 9. Histogram of the maximum value of CCF. The white bars show the frequency distribution for the waveforms without significant acoustic ranging signal.
Reduction of Acoustic Ranging Data Size
The raw acoustic ranging waveform data from the developed system was 64 KB (=64.512 ms × 500 kHz × 2 byte + 1024 byte of header information and spare areas) in size. If this were to be transmitted without modification over a satellite link, it would cost more than $200,000 USD per year. Thus, we reduced the data down to a final size of 60 bytes, which is less than 1/1000 the size of the raw data. The data transferred to the ground base station only contained information related to the travel time of the direct wave as shown in Figure 7.
It is necessary to use the travel time of direct wave for the accurate acoustic ranging. The recorded waveforms were frequently contaminated by waves reflected from the sea-surface, buoy body, and seafloor (Figure 8B), which was also reported by Imano et al. (2015). The onset of a direct wave is determined based on the timing of the maximum CCF value. However, it has been empirically known that reflected waves exhibit multiple CCF peaks, and that the maximum CCF value is sometimes attained during the onset of the subsequent reflected wave (Figure 8B), resulting in the direct wave onset being misrecognized (Tadokoro et al., 2012). In this study, it was found that the maximum CCF value was attained at the time of the reflected wave onset for 1250 of the total 35,316 waveforms over the course of the entire test period.
To address this, the energy ratio (ER) was introduced to aid in identifying the correct direct wave onset. The ER is defined as the average wave energy within the time window just after a target time relative to that just before the same target time as follows (e.g., Han et al., 2008):
where γi is the energy ratio at the i-th sample, sj is the amplitude of the acoustic wave at the j-th sample (j ≥ 1), d (≥ 1) is the time shift, and Wa (≥1) and Wb (≥1) are the lengths of the following and preceding windows at the target sample, respectively. Originally, the two windows Wa and Wb were defined as having the same length. Here, the windows had a length of 195 samples (0.390 ms), which corresponded to 5 cycles of the acoustic signal. Because the wave sample started at j = 1, Wb was reset at i – d – 1 for the case of i – d – Wb < 1. The time shift d was set at 117 (0.234 ms), which corresponded to three cycles, to avoid the transitional vibration of the element inside the acoustic transducer. The direct wave onset could then be detected from a relatively high CCF peak accompanied by a high ER value.
An algorithm was developed to automatically recognize the correct direct wave onset in the buoy-mounted signal processing computer. First, the CCF peak with the maximum value throughout the waveform was identified as Peak-3. Next, Peak-2, the highest peak in the second largest envelope of CCF prior to Peak-3 and Peak-1, the highest peak in the third largest envelope of CCF prior to Peak-2 were identified as each are candidates for the direct wave onset. Finally, the algorithm evaluates whether or not each peak corresponds to the direct wave in order of the peak number on the basis of thresholds set using the CCF and ER values. In essence, relatively high CCF peaks are unconditionally identified as indicators of the direct wave onset. In contrast, low CCF peaks indicate no direct wave is present. If none of the three identified CCF peaks exceed the thresholds, the waveform is rejected as containing no clear return. However, if a CCF value is somewhat below the maximum, the CCF peak can still be recognized as indicating a direct wave onset if the ER value is large enough at the peak (Figure 10). Note that the CCF values are rounded to two decimal places in our programing code, and the plots in Figure 10 are discretely distributed. The algorithm was successful and only misrecognized direct wave onsets in 136 waveforms or 0.39% of the data (Table 1), which was equivalent to less than twice a day. Most of these cases (112 data) were misrecognized as direct wave onsets due to the extremely small path difference between the direct and reflected waves, which caused an overlap of the CCF peak corresponding to the reflected wave on the direct wave peak. This was identified as a limitation of the present algorithm.
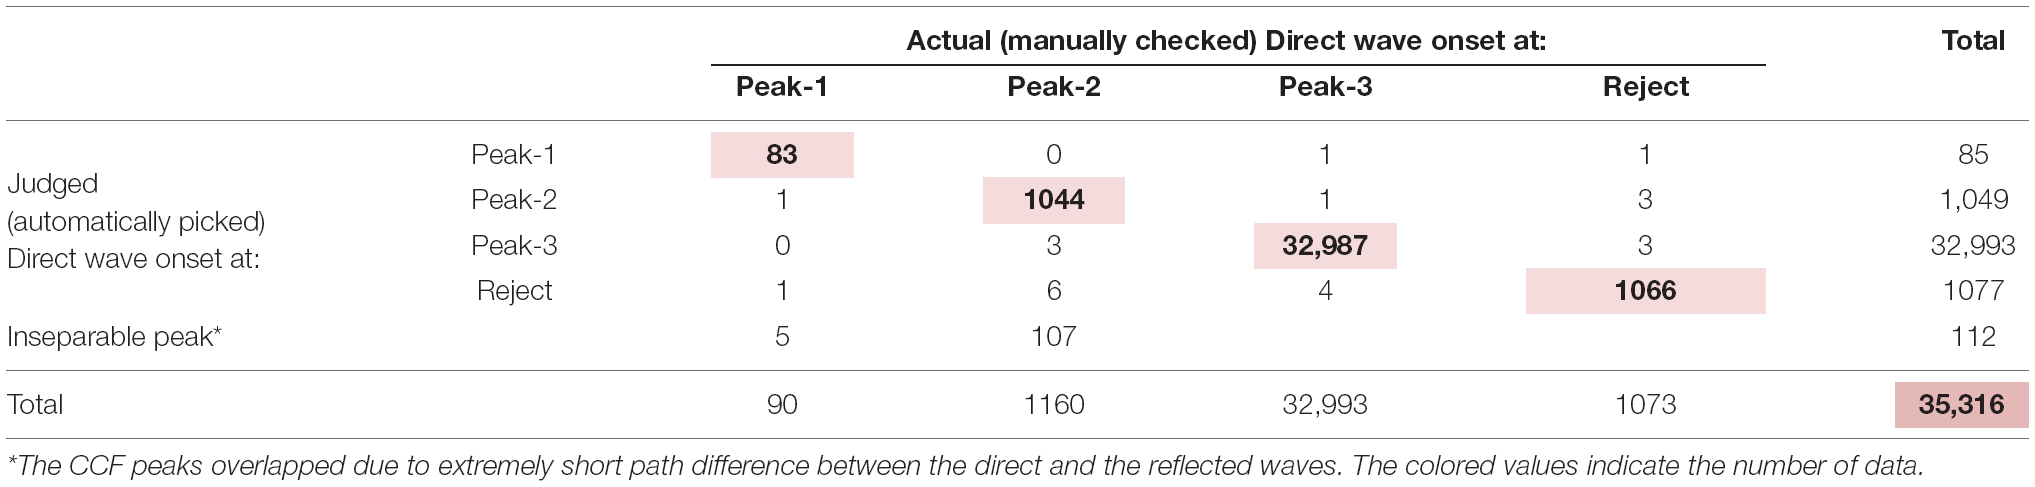
Table 1. Result of the automatic recognition of the direct wave onset.
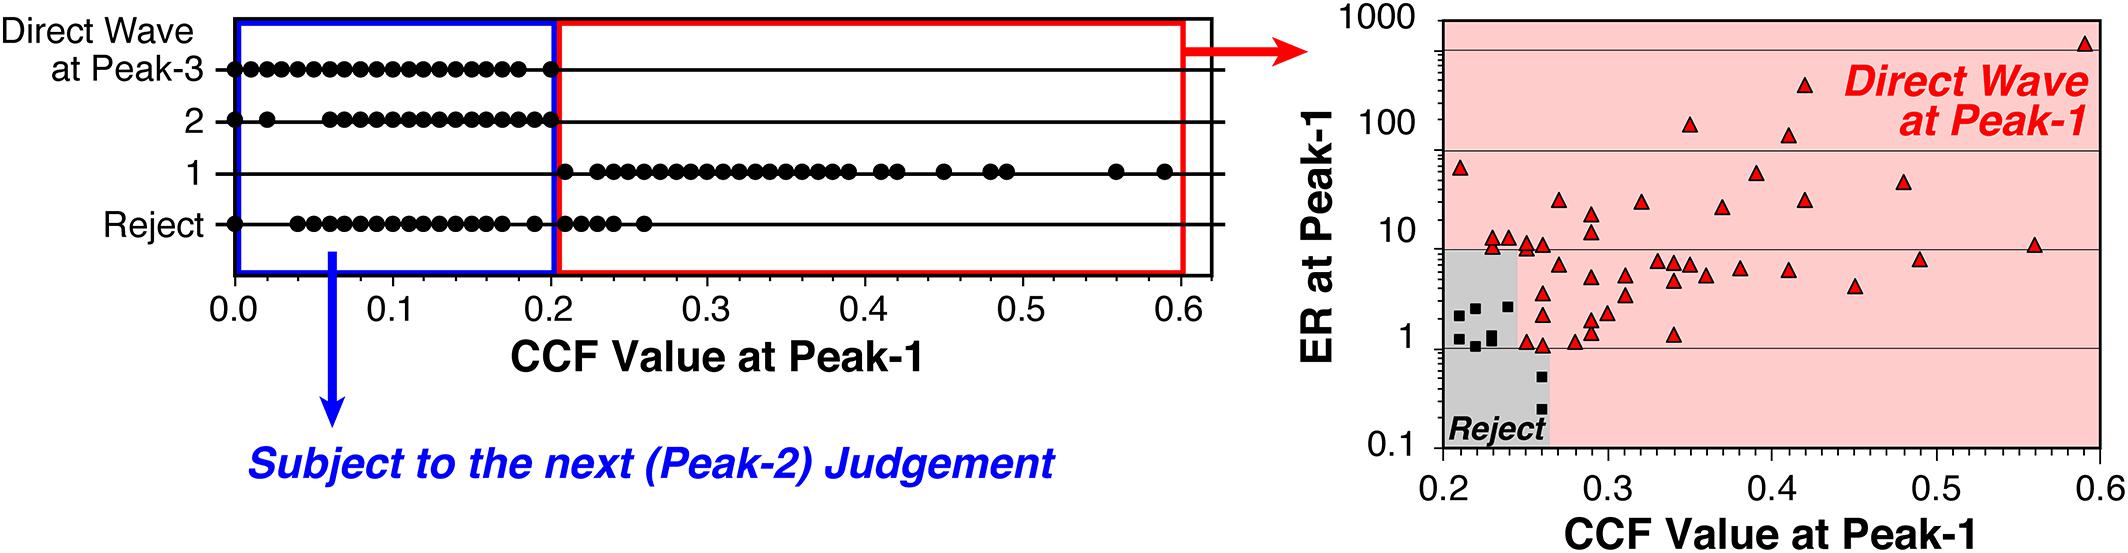
Figure 10. Example of thresholds to recognize the direct wave onset on the basis of the CCF and ER values. Graphs displayed here are for the judgment at Peak-1 among the waveform data recorded on the buoy from March 28 to July 12, 2018. For this case, the peaks with CCF values >0.20 (red square frame in the left panel) are judged whether they correspond to the direct wave onset (red shadow in the right panel) or Reject (gray shadow in the right panel). The peaks with CCF values ≥0.27 unconditionally correspond to the direct wave onset. The peaks with CCF values >0.20 and <0.27 are judged to be the direct wave onset or Reject depending on both their CCF and ER values. The remaining data (blue square frame in the left panel) are subjected to the judgment at Peak-2.
Discussion
In general, our primary purpose was achieved as the acoustic ranging every 3 min continued successfully throughout the test periods. However, the acoustic ranging controller frequently experienced power failures, especially during the winter season. The power delivery for satellite communications did not fully recover even in April, and completely stopped on April 11 (Figure 6). The total electric power consumption amounted to 624 Wh (=26 W × 24 h) per day for all components on the buoy, and theoretically, the buoy-mounted system continued to work for an assumed non-sunshine period of about 11.5 days (=300 Ah × 24 V/624 Wh). The power supply system on the buoy was conservatively designed to operate for 5 days without any sunshine. Approximately 5–6 days were required to recover the power. Thus, it is assumed that chronic power delivery shortages caused excess electric power consumption relative to the charging power even when there was enough sunshine until the batteries were fully depleted.
This is thought to have occurred for the following reasons. A center pillar with a diameter of 8 m and a height of more than 4 m was constructed on the deck of the buoy (Figure 3), and a structure with an area of 2.4 m × 2.4 m was positioned on the top of the center pillar. As the solar panels were mounted 1 m above the deck and connected in series (Figure 1), it is likely that some portion of the solar panel modules fell into the shadow of the above-mentioned objects. When this happened, the designed power-generation voltage may have not been acquired even under daylight conditions because of the series connection. The power problems are a critical issue that must be resolved for continuous operation. In the future, we plan to redesign the system so that the solar panels are connected in parallel to ensure adequate power delivery. In addition, the power supply lines for the 12 VDC and 24 VDC systems will be separated.
All electronic components and batteries were stored in five waterproof boxes mounted on the deck of the buoy. The boxes were 102 cm (W) × 74 cm (D) × 50 cm (H) size and weighted 85 kg in aggregate. The present buoy has enough space (8 m in diameter) and buoyancy force (1.45 × 10⁶ N) to support the installation of this equipment. However, when this system is applied in practical applications, it is not realistic to deploy many huge platforms similar to the current setup. Thus, it will be necessary to reduce the size and weight of the equipment to allow installation on platforms with limited payload capacity. To accomplish this, it will be necessary to reduce the power consumption of each electronic component in order to reduce the size of the batteries and solar charge/discharge controller, which occupy three waterproof boxes in total (Figure 1). In other words, more than half of the boxes are used to store electric power supply components. Reducing the power consumption will also contribute to solving the insufficient power delivery problem. In the present system, three independent processors were used to process the acoustic ranging data, gyroscope measurement data, and PPP-AR positioning of GNSS data. In the future, this could be reduced by using a single compact PC with multiple functions, which would also simplify the signal transmission lines and wiring.
The purpose of our system is seafloor positioning. Our system is still in the testing phase, and we are developing a positioning algorithm for point survey specific to the present buoy measurement. It is desirable to measure the sound speed profile continuously because temporal and spatial variations in sound speed also directly affects the accuracy of seafloor positioning. Nevertheless, the continuous measurement of sound speed has not been realized in our system. Instead, we plan to estimate variations in sound speed, that appear in the time series of acoustic travel time (e.g., Kido et al., 2008), together with the seafloor positions as demonstrated in previous studies (Fujita et al., 2006; Ikuta et al., 2008; Honsho and Kido, 2017). Average sound speed profiles should be measured with research vessel at some time interval, once a year for our case. Imano et al. (2019) reported accuracy of seafloor positioning from a smaller buoy than ours in the ocean with a depth of about 3000 m. Their buoy was slackly moored, and it drifted within a circle of 4000 m radius due to the strong Kuroshio ocean current. The extreme drifting effect caused decrease in positioning accuracy down to about 1 m. In contrast, the large and heavy buoy we used was moored more tightly. The buoy, therefore, drifted within the area of about only 150–200 m even under the strong Kuroshio current (Figure 5). We should demonstrate an advantage of our tightly-moored buoy on the basis of the seafloor positioning accuracy with the positioning algorithm that we are developing now.
Conclusion
In this study, we developed a system capable of continuous and real-time measurement to measure seafloor crustal deformation using the GNSS/Acoustic technique. The following summarizes our findings after conducting operational tests using a moored buoy for 106 days:
1. If sufficient electrical power is supplied, the developed system can continuously transmit acoustic ranging to the on-land station via the satellite link;
2. The system on the buoy was able to acquire high-quality acoustic waveforms;
3. More than 99% of the direct acoustic wave onsets at the buoy were correctly distinguished based on the energy ratio factor as well as the cross-correlation value even if those waveforms had been corrupted with reflected waves; and
4. The system on the buoy successfully contributed to reduce the data size over a satellite communication.
In terms of future work, we plan to resolve the identified problems in the electrical system so that the project can advance to the operational stage.
Data Availability Statement
The datasets generated for this study are available on request to the corresponding author. We are preparing a website distributing the archived data at http://www.tsunamigps.com.
Author Contributions
KT designed the entire system, coded the programs that implemented the cross-correlation computation and automatic detection of the onset of direct the acoustic wave, analyzed the acoustic ranging data, and conducted GNSS positioning. NK contributed by revising the system and programs, testing the system prior to installation, retrieving the data, and organizing the database. TK and YT conceived and promoted this study. KM provided technical support and advice on the configuration of the system, and fabricated the metal parts.
Funding
KT, NK, TK, and YT acknowledge financial support from JSPS KAKENHI Grant Number JP16H06310: “A challenge to develop GNSS buoy system for high-functional tsunami monitoring and continuous observation of ocean-bottom crustal movements.”
Conflict of Interest
The authors declare that the research was conducted in the absence of any commercial or financial relationships that could be construed as a potential conflict of interest.
Acknowledgments
The authors would like to thank reviewers for their constructive comments. We thank Kochi Prefecture, Japan, for allowing us to use one of their fishery buoys for this study. We are grateful to the captain and crew of the vessel Yuge Maru of the National Institute of Technology, Yuge College, for their support during the installation of the ocean bottom acoustic transponders.
References
Ali, H. B. (1993). Oceanic variability in shallow-water acoustics and the dual role of the sea bottom. IEEE J. Ocean Eng. 18, 31–41. doi: 10.1109/48.211498
Becker, J. J., Sandwell, D. T., Smith, W. H. F., Braud, J., Binder, B., Depner, J., et al. (2009). Global bathymetry and elevation data at 30 arc seconds resolution: SRTM30_PLUS. Mar. Geodesy 32, 355–371. doi: 10.1080/01490410903297766
Chadwell, C. D. (2013). “GPS-acoustic seafloor geodesy using a wave glider,” in Proceedings of the Abstract G14A-01 presented at 2013 Fall Meeting, (San Francisco, CA: AGU).
Chadwell, C. D., and Spiess, F. N. (2008). Plate motion at the ridge-transform boundary of the south Cleft segment of the Juan de Fuca Ridge from GPS-Acoustic data. J. Geophys. Res. 113:B04415. doi: 10.1029/2007JB004936
Chen, H.-Y., Ikuta, R., Lin, C.-H., Hsu, Y.-J., Kohmi, T., Wang, C.-C., et al. (2018). Back-arc opening in the western end of the Okinawa Trough revealed from GNSS/Acoustic Measurements. Geophys. Res. Lett. 45, 137–145. doi: 10.1002/2017GL075724
Fujimoto, H. (2006). Ocean bottom crustal movement observation using GPS/Acoustic system by universities in Japan. J. Geod. Soc. Jpn. 52, 265–272. doi: 10.11366/sokuchi1954.52.265
Fujita, M., Ishikawa, T., Mochizuki, M., Sato, M., Toyama, S., Katayama, M., et al., (2006). GPS/Acoustic seafloor geodetic observation: method of data analysis and its application. Earth Planet. Space 58, 265–275. doi: 10.1186/BF03351923
Gagnon, K., Chadwell, C. D., and Norabuena, E. (2005). Measuring the onset of locking in the Peru-Chile trench with GPS and acoustic measurements. Nature 434, 205–208. doi: 10.1038/nature03412
Han, L., Wong, J., Bancroft, J. C., and Stewart, R. R. (2008). Automatic time picking and velocity determination on full waveform sonic well logs. CREWES Res. Rep. 20:5.1–5.13.
Honsho, C., and Kido, M. (2017). Comprehensive analysis of traveltime data collected through GPS-acoustic observation of seafloor crustal movements. J. Geophys. Res. 122, 8583–8599. doi: 10.1002/2017JB014733
Iinuma, T., Hino, R., Kido, M., Inazu, D., Osada, Y., Ito, Y., et al. (2012). Coseismic slip distribution of the 2011 off the Pacific Coast of Tohoku Earthquake (M9.0) refined by means of seafloor geodetic data. J. Geophys. Res. 117:B07409. doi: 10.1029/2012JB009186
Iinuma, T., Hino, R., Uchida, N., Nakamura, W., Kido, M., Osada, Y., et al. (2016). Seafloor observations indicate spatial separation of coseismic and postseismic slips in the 2011 Tohoku earthquake. Nat. Commun. 7:13506. doi: 10.1038/ncomms13506
Ikuta, R., Tadokoro, K., Ando, M., Okuda, T., Sugimoto, S., Takatani, K., et al. (2008). A new GPS-Acoustic method for measuring ocean floor crustal deformation: application to the Nankai Trough. J. Geophys. Res. 113:B02401. doi: 10.1029/2006JB004875
Imano, M., Kido, M., Honsho, C., Ohta, Y., Takahashi, N., Fukuda, T., et al. (2019). Assessment of directional accuracy of GNSS-Acoustic measurement using a slackly moored buoy. Prog. Earth Planet. Sci. 6:56. doi: 10.1186/s40645-019-0302-1
Imano, M., Kido, M., Ohta, Y., Fukuda, T., Ochi, H., Takahashi, N., et al. (2015). “Improvement in the accuracy of real-time GPS/Acoustic measurements using a multi-purpose moored buoy system by removal of acoustic multipath,” in Proceedings of the International Symposium on Geodesy for Earthquake and Natural Hazards (GENAH), IAG Symposia 145, ed. M. Hashimoto (Berlin: Springer), 105–114. doi: 10.1007/1345_2015_192
Kato, T., Terada, Y., Ito, K., Hattori, R., Abe, T., Miyake, T., et al. (2005). Tsunami due to the 2004 September 5th off the Kii peninsula earthquake. Japan, recorded by a new GPS buoy. Earth Planet. Space 57, 297–301. doi: 10.1186/BF03352566
Kato, T., Terada, Y., Kinoshita, M., Kakimoto, H., Issiki, H., Moriguchi, T., et al. (2001). “A new tsunami monitoring system using RTK-GPS,” in Proceedings of International Tsunami Symposium 2001 (ITS 2001), Seattle, WA, 645–651.
Kato, T., Terada, Y., Tadokoro, K., Futamura, A., Toyoshima, M., Yamamoto, S., et al. (2017). “GNSS buoy array in the ocean for a synthetic geohazards monitoring system,” in Proceedings of The 27th International Ocean and Polar Engineering Conference, San Francisco, CA.
Kato, T., Terada, Y., Tadokoro, K., Kinugasa, N., Futamura, A., Toyoshima, M., et al. (2018). Development of GNSS buoy for a synthetic geohazard monitoring system. J. Disaster Res. 13, 460–471. doi: 10.20965/jdr.2018.p0460
Kido, M., Fujimoto, H., Hino, R., Ohta, Y., Osada, Y., Iinuma, T., et al. (2015). “Progress in the project for development of GPS/Acoustic technique over the Last 4 years,” in Prceeding of the International Symposium on Geodesy for Earthquake and Natural Hazards (GENAH), International Association of Geodesy Symposia, Vol. 145, ed. M. Hashimoto (Cham: Springer), 3–10. doi: 10.1007/1345_2015_127
Kido, M., Fujimoto, H., Miura, S., Osada, Y., Tsuka, K., and Tabei, T. (2006). Seafloor displacement at Kumano-nada caused by the 2004 off Kii Peninsula earthquakes, detected through repeated GPS/Acoustic surveys. Earth Planet. Space 58, 911–915. doi: 10.1186/BF03351996
Kido, M., Imano, M., Ohta, Y., Fukuda, T., Takahashi, N., Tsubone, S., et al. (2018). Onboard realtime processing of GPS-acoustic data for moored buoy-based observation. J. Disaster Res. 13, 472–488. doi: 10.20965/jdr.2018.p0472
Kido, M., Osada, Y., and Fujimoto, H. (2008). Temporal variation of sound speed in ocean: a comparison between GPS/acoustic and in situ measurements. Earth Planet. Space 60, 229–234. doi: 10.1186/BF03352785
Kido, M., Osada, Y., Fujimoto, H., Hino, R., and Ito, Y. (2011). Trench-normal variation in observed seafloor displacements associated with the 2011 Tohoku-Oki earthquake. Geophys. Res. Lett. 38:L24303. doi: 10.1029/2011GL050057
Kimura, H., Tadokoro, K., and Ito, T. (2019). Interplate coupling distribution along the Nankai Trough in southwest Japan estimated from the block motion model based on onshore GNSS and seafloor GNSS/A observations. J. Geophys. Res. 124, 6140–6164. doi: 10.1029/2018JB016159
Matsui, R., Kido, M., Niwa, Y., and Honsho, C. (2019). Effects of disturbance of seawater excited by internal wave on GNSS-acoustic positioning. Mar. Geophys. Res. 40, 541–555. doi: 10.1007/s11001-019-09394-6
Matsumoto, K., Takanezawa, T., and Ooe, M. (2000). Ocean tide models developed by assimilating TOPEX/POSEIDON altimeter data into hydrodynamical model: a global model and a regional model around Japan. J. Oceanogr. 56, 567–581. doi: 10.1023/A:1011157212596
Matsumoto, Y., Fujita, M., Ishikawa, T., Mochizuki, M., Yabuki, T., and Asada, A. (2006). Undersea co-seismic crustal movements associated with the 2005 Off Miyagi Prefecture Earthquake detected by GPS/acoustic seafloor geodetic observation. Earth Planet. Space 58, 1573–1576. doi: 10.1186/BF03352663
Matsumoto, Y., Ishikawa, T., Fujita, M., Sato, M., Saito, H., Mochizuki, M., et al. (2008). Weak interplate coupling beneath the subduction zone off Fukushima, NE Japan, inferred from GPS/acoustic seafloor geodetic observation. Earth Planet. Space 60:e9–e12. doi: 10.1186/BF03353114
Mervart, L., Lukes, Z., Rocken, C., and Iwabuchi, T. (2008). “Precise point positioning with ambiguity resolution in real-time,” in Proceedings of 21st International Technical Meeting of the Satellite Division of The Institute of Navigation (ION GNSS 2008), Savannah, GA, 397–405.
Nishimura, T., Yokota, Y., Tadokoro, K., and Ochi, T. (2018). Strain partitioning and interplate coupling along the northern margin of the Philippine Sea plate, estimated from Global Navigation Satellite System and Global Positioning System-Acoustic data. Geosphere 14, 535–551. doi: 10.1130/GES01529.1
Ozaki, T. (2011). Outline of the 2011 off the Pacific coast of Tohoku Earthquake (Mw 9.0): Tsunami warnings/advisories and observations. Earth Planet. Space 63, 827–830. doi: 10.5047/eps.2011.06.029
Rocken, C., Mervart, L., Lukes, Z., Johnson, J., Kanzaki, H., Kakimoto, M., et al. (2004). “Testing a new network RTK software system,” in Proceedings of 17th International Technical Meeting of the Satellite Division of The Institute of Navigation (ION GNSS 2004), Long Beach, CA, 2831–2839.
Sathiakumar, S., Barbot, S., Hill, E., Peng, D., Zerucha, J., Suhaimee, S., et al. (2016). “Seafloor geodesy using wave gliders to study earthquake and tsunami hazards at subduction zones,” in Proceedings of the Abstract G31A-1046 presented at 2016 Fall Meeting, (San Francisco, CA: AGU).
Sato, M., Ishikawa, T., Ujihara, N., Yoshida, S., Fujita, M., Mochizuki, M., et al. (2011a). Displacement above the hypocenter of the 2011 Tohoku-oki earthquake. Science 332:1395. doi: 10.1126/science.1207401
Sato, M., Saito, H., Ishikawa, T., Matsumoto, Y., Fujita, M., Mochizuki, M., et al. (2011b). Restoration of interplate locking after the 2005 Off-Miyagi Prefecture earthquake, detected by GPS/acoustic seafloor geodetic observation. Geophys. Res. Lett. 38:L01312. doi: 10.1029/2010GL045689
Spiess, F. N., Chadwell, C. D., Hildebrand, J. A., Young, L. E., Purcell, G. H. Jr., and Dragert, H. (1998). Precise GPS/Acoustic positioning of seafloor reference points for tectonic studies. Phys. Earth Planet. Inter. 108, 101–112. doi: 10.1016/S0031-9201(98)00089-2
Tadokoro, K., Ando, M., Ikuta, R., Okuda, T., Besana, G. M., Sugimoto, S., et al. (2006). Observation of coseismic seafloor crustal deformation due to M7 class offshore earthquakes. Geophys. Res. Lett. 33:L23306. doi: 10.1029/2006GL026742
Tadokoro, K., Ikuta, R., Watanabe, T., Ando, M., Okuda, T., Nagai, S., et al. (2012). Interseismic seafloor crustal deformation immediately above the source region of anticipated megathrust earthquake along the Nankai Trough. Japan. Geophys. Res. Lett. 39:L10306. doi: 10.1029/2012GL051696
Tadokoro, K., Nakamura, M., Ando, M., Kimura, H., Watanabe, T., and Matsuhiro, K. (2018). Interplate coupling state at the Nansei-Shoto (Ryukyu) Trench, Japan, deduced from seafloor crustal deformation measurements. Geophys. Res. Lett. 45, 6869–6877. doi: 10.1029/2018GL078655
Terada, Y., Kato, T., Nagai, T., Koshimura, S., Imada, N., Sakaue, H., et al. (2015). “Recent developments of GPS tsunami meter for a far offshore observations,” in Proceedings of the International Symposium on Geodesy for Earthquake and Natural Hazards (GENAH), International Association of Geodesy Symposia, Vol. 145, ed. M. Hashimoto (Cham: Springer), 145–153. doi: 10.1007/1345_2015_151
Tomita, F., Kido, M., Ohta, Y., Iinuma, T., and Hino, R. (2017). Along-trench variation in seafloor displacements after the 2011 Tohoku earthquake. Sci. Adv. 3:e1700113. doi: 10.1126/sciadv.1700113
Tomita, F., Kido, M., Osada, Y., Hino, R., Ohta, Y., and Iinuma, T. (2015). First measurement of the displacement rate of the Pacific Plate near the Japan Trench after the 2011 Tohoku-Oki earthquake using GPS/acoustic technique. Geophys. Res. Lett. 42, 8391–8397. doi: 10.1002/2015GL065746
Watanabe, S., Bock, Y., Melgar, D., and Tadokoro, K. (2018). Tsunami scenarios based on interseismic models along the Nankai trough, Japan, from seafloor and onshore geodesy. J. Geophys. Res. 123, 2448–2461. doi: 10.1002/2017JB014799
Watanabe, S., Sato, M., Fujita, M., Ishikawa, T., Yokota, Y., Ujihara, N., et al. (2014). Evidence of viscoelastic deformation following the 2011 Tohoku-Oki earthquake revealed from seafloor geodetic observation. Geophys. Res. Lett. 41, 5789–5796. doi: 10.1002/2014GL061134
Yasuda, K., Tadokoro, K., Ikuta, R., Watanabe, T., Nagai, S., Okuda, T., et al. (2014). Interplate locking condition derived from seafloor geodetic data at the northernmost part of the Suruga Trough. Japan. Geophys. Res. Lett. 41, 5806–5812. doi: 10.1002/2014GL060945
Yasuda, K., Tadokoro, K., Taniguchi, S., Kimura, H., and Matsuhiro, K. (2017). Interplate locking condition derived from seafloor geodetic observation in the shallowest subduction segment at the Central Nankai Trough. Japan. Geophys. Res. Lett. 44, 3572–3579. doi: 10.1002/2017GL072918
Yokota, Y., and Ishikawa, T. (2020). Shallow slow slip events along the Nankai Trough detected by GNSS-A. Sci. Adv. 6:aay5786. doi: 10.1126/sciadv.aay5786
Yokota, Y., Ishikawa, T., Sato, M., Watanabe, S., Saito, H., Ujihara, N., et al. (2015). Heterogeneous interplate coupling along the Nankai Trough. Japan, detected by GPS-acoustic seafloor geodetic observation. Prog. Earth Planet. Sci. 2:10. doi: 10.1186/s40645-015-0040-y
Keywords: GNSS buoy, GNSS/Acoustic, seafloor crustal deformation, acoustic ranging, technical development
Citation: Tadokoro K, Kinugasa N, Kato T, Terada Y and Matsuhiro K (2020) A Marine-Buoy-Mounted System for Continuous and Real-Time Measurment of Seafloor Crustal Deformation. Front. Earth Sci. 8:123. doi: 10.3389/feart.2020.00123
Received: 12 February 2020; Accepted: 31 March 2020;
Published: 30 April 2020.
Edited by:
Takashi Nakagawa, The University of Hong Kong, Hong KongReviewed by:
Motoyuki Kido, Tohoku University, JapanPierre Sakic, GFZ German Research Centre for Geosciences, Germany
Copyright © 2020 Tadokoro, Kinugasa, Kato, Terada and Matsuhiro. This is an open-access article distributed under the terms of the Creative Commons Attribution License (CC BY). The use, distribution or reproduction in other forums is permitted, provided the original author(s) and the copyright owner(s) are credited and that the original publication in this journal is cited, in accordance with accepted academic practice. No use, distribution or reproduction is permitted which does not comply with these terms.
*Correspondence: Keiichi Tadokoro, tad@seis.nagoya-u.ac.jp