 Isabel Peinke1
 Pascal Hagenmuller
 Edward Andò
 Guillaume Chambon
 Frederic Flin
94% of researchers rate our articles as excellent or good
Learn more about the work of our research integrity team to safeguard the quality of each article we publish.
Find out more
ORIGINAL RESEARCH article
Front. Earth Sci. , 19 March 2020
Sec. Cryospheric Sciences
Volume 8 - 2020 | https://doi.org/10.3389/feart.2020.00063
This article is part of the Research Topic About the Relevance of Snow Microstructure Study in Cryospheric Sciences View all 10 articles
The cone penetration test is widely used to determine the mechanical properties of snow and to delineate snow stratigraphy. Precise knowledge of the snow stratigraphy is essential for many applications such as avalanche forecasting or estimating the snowpack energy budget. With the development of sophisticated, high-resolution digital penetrometers such as the SnowMicroPenetrometer, the cone penetration test remains one of the only objective methods to measure snow stratigraphy. An accurate interpretation of the measured hardness profiles requires to understand the interaction between the cone tip and the snow material. In this study, we measured the displacement induced by the penetration of a conic tip with a radius of 2.5 mm in eight different snow samples using X-ray tomography. The experiments were conducted at a temperature of −10°C. To recover the full three-dimensional displacements between the tomographic images measured before and after the test, we specifically designed a tracking algorithm which exploits the unique shape of each snow grain. The tracking algorithm enables to recover most of the granular displacements and accurately captures the volumetric strain directly derived from density changes. The measured displacements are shown to be oriented downwards below the tip apex, upwards close to the snow surface, and nearly only radially in between. We observed and quantified the development of a compaction around and below the tip. Surprisingly, we also observed dilation of the snow material close to the snow and tip surfaces in very high-density samples. The radial extent of the compaction zone ranged between 1.6 and 2.3 times the tip radius. These results were compared to existing interpretative models. Although limited to relatively small samples and short penetration depths, these results provide new insights on snow deformation during a cone penetration test, and the validity of these models.
The cone penetration test (CPT) is widely used to determine the geotechnical engineering properties of soils and to delineate soil stratigraphy. This test consists of driving an instrumented tube with a conic tip into the ground and recording the forces required for penetration. In general, the recorded forces can include cone penetration resistance, sleeve friction and pore pressure (e.g., Schmertmann, 1978; Mayne, 2007). Many investigations aimed to establish a frame to interpret CPT results. Most of them are based on empirical relations (Mayne, 2007). For instance, Robertson (2009) developed soil classification charts using the cone resistance and friction ratio based on empirical relations. Theoretical approaches have also been proposed and provided a useful framework of understanding. In particular, Bishop et al. (1945) introduced the cavity expansion model to retrieve the material properties of clay and sand from a CPT. Many of the current CPT inversion models in soil mechanics derive from this initial model, due to its ease of implementation and capability of describing elastic and plastic material deformation during CPT (e.g., Yu and Mitchell, 1998; Ruiz et al., 2016). However, Baligh (1986) showed that the cavity expansion model does not correctly account for the strain paths followed by soil elements, which could lead to inconsistencies in the subsequent test interpretation. Many studies have thus investigated the strain and stress paths at specific locations in a soil around a penetrating tip (e.g., White and Bolton, 2004). More recently, a full three-dimensional analysis of the deformation field was proposed by Paniagua et al. (2013) using X-ray tomography and digital image correlation.
The CPT, widely used and studied in geomechanics, was first adapted to snow with the ramsonde in the 1930's (Bader et al., 1939; Gubler, 1975). The ramsonde is a very simple and robust probe driven into the snow by mechanical hammer blows on its top. It is commonly used, e.g., by the observers of avalanche warning services to record snow hardness profiles. Ramsonde profiles provide an overall indication of snowpack structure, which can be used, for instance, to classify the snowpack as either potentially stable or potentially unstable with respect to avalanche release (Schweizer and Wiesinger, 2001). Several digital snow penetrometers have been developed to overcome the limited resolution of the ramsonde, e.g., the SnowMicroPenetrometer (SMP, Schneebeli and Johnson, 1998), the SABRE penetrometer (Mackenzie and Payten, 2002), or the SP2 (Avatech, see Hagenmuller et al., 2018). In addition, digital penetrometers initially designed for soils were also directly used to characterize the snowpack stratigraphy in Antarctica (McCallum, 2014). These instruments accurately determine the penetration resistance of thin layers and are able to capture numerous stratigraphic features of the snow cover (e.g., Pielmeier and Schneebeli, 2003). They can generally detect the presence of a weak layer of snow below a cohesive slab (Hagenmuller et al., 2018), which is an avalanche prone configuration (Schweizer et al., 2003). Reuter et al. (2015) derived promising quantitative indicators of snowpack stability directly from a SMP profile. Proksch et al. (2015) estimated the main snow structural parameters, namely density, correlation length, and specific surface area (SSA), solely from SMP profiles.
Snow differs from typical soils in two main aspects. Firstly, compared to soils, snow is a very fragile and porous material with a void ratio up to 90%. Thanks to the resulting low resistance, the CPT in snow can be performed at a constant speed (driven by a light-weight motor) with a small conic tip. Typically, the size of CPT tip radius in snow is of a few millimeters, and the typical snow grain size is about 0.1–1 mm. The penetration resistance is measured at high resolution in terms of force (around 0.01 N for the SMP) and vertical position (around 4 μm for the SMP) (Schneebeli and Johnson, 1998). The high-frequency fluctuations of penetration force with depth contain valuable information about snow microstructure, as they are directly linked to failure at bond scale (e.g., Löwe and Herwijnen, 2012). Secondly, snow exists on Earth at a high homologous temperature. Its mechanical behavior is therefore highly rate-dependent because of very rapid sintering processes and ice viscosity (e.g., Narita, 1983; Blackford, 2007; Peinke et al., 2019), in contrast to typical soils. In general, CPTs in snow are conducted with a penetration speed of a few centimeters per second. Reuter et al. (2019) estimated the induced strain rate to be about 100 s−1. At this strain rate, snow mechanical behavior can be assumed to be brittle (Narita, 1983; Floyer and Jamieson, 2010) and numerical tests showed that inertial effects can be neglected (Hagenmuller et al., 2015).
Several specific models were proposed to interpret CPTs in snow (e.g., Johnson and Schneebeli, 1999; Marshall and Johnson, 2009). Löwe and Herwijnen (2012) used the framework of Homogeneous Poisson Processes to relate the measured force signal to the mechanical properties of individual bonds between snow grains. In particular, they assumed that the overall penetration force results from the superposition of spatially uncorrelated ruptures. These ruptures are supposed to be elastic brittle and to occur at the contact with the cone tip. This approach was generalized to the case of spatially inhomogeneous rupture intensities by Peinke et al. (2019). Ruiz et al. (2017) applied the cavity expansion model to analyse CPT in snow and to derive the elastic modulus and yield strength of the material.
These two classes of models are based on very different approaches. On the one hand, the cavity expansion model considers snow as a continuum material and describes the cone penetration by the formation of a cavity, with elastic and plastic zones surrounding the cavity. Further, only radial forces acting on the cone tip are considered. The typical cone-to-grain ratio for the SMP in snow is in the range 5–50 (Herwijnen and Miller, 2013), while after Bolton et al. (1993), the continuum media assumption reaches its limit for a ratio lower than 20. On the other hand, the Homogeneous Poisson Process model aims to identify the contribution of individual bond ruptures occurring directly next to the tip. This model accounts for the discrete nature of bond failures. However, experimental studies showed the formation of a significant compaction zone around the cone tip (e.g., Herwijnen, 2013; LeBaron et al., 2014), which challenges the assumptions of the Homogeneous Poisson Process model. In particular, the effective radius of the cone tip is increased by the compaction zone, and the rupture events may be spatially correlated. Knowledge of the strain paths around the penetrating tip are thus essential to interpret the measured force profiles.
Different studies aimed at investigating the displacement of snow grains induced by a CPT. Herwijnen (2013) used particle image velocimetry to quantify the displacement around the tip. With a digital video camera, they recorded images of the front face of a snow box via a viewing window through which the progression of the SMP tip could be observed. They also acquired micro-tomographic images of snow samples after the SMP tests to measure the radial density field from mean pixel intensity. They observed a compaction zone with a radius equal to twice the cone radius, on average. The radius of this zone was shown to increase with snow density. Further, they observed that the size of this zone stabilizes after about 40 mm of penetration. LeBaron et al. (2014) also used particle image velocimetry on two-dimensional images of a split-axis snow micro-penetrometer along a viewing window. They observed a compaction zone diameter of about three times the tip diameter. Its radial cross-section area was estimated to be about 10 times larger than that of the SMP tip. Assuming axial symmetry, the compaction zone volume was estimated to be about 1 cm3, with nearly 50% of the volume ahead of the tip. Floyer and Jamieson (2006, 2010) measured the extension of compaction and deformation zone with particle image velocimetry on a rounded-tip penetrometer. They observed a characteristic spike in the force signal during the initial stage of deformation and showed that this spike corresponds to the development of the compaction zone below the penetrometer tip.
The goal of this study is to quantify the three-dimensional deformation field in snow around the CPT tip, which is critical to interpret the recorded force signals. To this end, we combined micro-tomography and CPT, and developed a novel tracking method based on digital image correlation and matching of grain characteristics. The displacements at grain scale can then be recovered, from which the deformation around the tip is evaluated. The method was applied to samples spanning different snow types, thereby providing new insights and valuable information to assess the consistency of existing models.
We conducted CPT in eight samples of different snow types, and measured the induced deformation through micro-tomography (μCT).
The snow samples were prepared by sieving natural snow into sample holders dedicated to tomography and letting them rest by, at least, 24 h before conducting the measurements. The preparation of the samples and the experiments were performed in a regulated cold room at a constant temperature of −10°C. The samples covered a variety of seasonal snow types, namely rounded grains (RG), large rounded grains (RGlr), depth hoar (DH) and precipitation particles (PP), with bulk densities between 90 and 560 kg m−3 and specific surface areas between 10 and 54 m2 kg−1 (Table 1). The sample holders were aluminum cylinders, which have the advantage of high thermal conductivity and relatively low X-ray absorption. Their size was limited to 2 cm height and 2 cm diameter, in order to enable μCT imaging with a pixel size small enough to resolve snow microstructure.
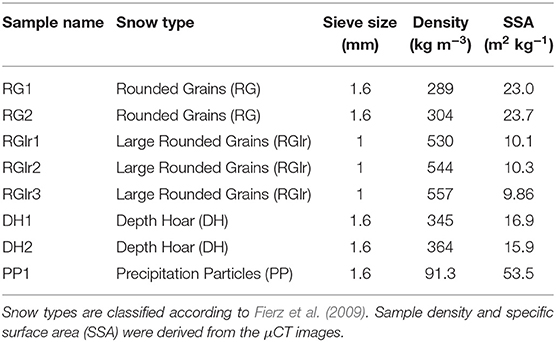
Table 1. Overview of the eight snow sample properties.
Two tomographic images of each sample were acquired: one before (pre-CPT image) and one after (post-CPT image) the CPT. The samples were scanned at a pixel size of 15 μm pix−1 with an X-ray tomograph (RX Solutions). The X-ray tube was powered by a voltage of 80 kV and a current of 100 μA. Each scan consisted of 1,440 radiographs covering a 360° rotation. In order to maintain a constant and uniform temperature of −10°C, a cryogenic cell (CellDyM) was used (Calonne et al., 2015).
The sets of radiographs were reconstructed into three-dimensional grayscale images representing the attenuation coefficients of the different materials composing the samples. Marks on the sample holder permitted us to register the pre- and post-CPT images, and correct unavoidable shifts due to movements of the tomograph elements with a sub-voxel accuracy. The aluminum sample holder was then masked in the images, and the ice was segmented from the air using the energy-based segmentation developed by Hagenmuller et al. (2013). Local density in the pre-CPT image (ρpre) and in the post-CPT image (ρpost) were computed on the binary images by voxel counting. Surface areas were computed on the segmented images by Crofton approach, which showed good accuracy on anisotropic structures (Hagenmuller et al., 2016). The ratio between the area of the air/ice interface and the mass of ice defines the specific surface area (SSA).
The CPTs were conducted by inserting a cylinder of radius R = 2.5 mm with a conic tip of 60° apex angle, into the snow samples (Figures 1A,B). Note that the cylinder radius is the same as the cone maximum radius. The tip used here is thus slightly different from that classically used with the SnowMicroPenetrometer (SMP), for which penetrating cone has a slightly larger diameter than the driving cylinder (see Schneebeli and Johnson, 1998). This cylinder with a conic tip was mounted on the SMP (version 4, Schneebeli and Johnson, 1998) to control the vertical displacement and measure the penetration force. The SMP force sensor (Kistler 9207) measures forces in the range of [0, 40] N with a resolution of 0.01 N. The samples were placed on a micrometric positioning plate, which allowed us to perfectly center the tip in the snow sample (Figure 1C). After the acquisition of the first μCT image of the sample, the cone was inserted vertically at a constant speed of 20 mm s−1. The penetrometer was not removed from the sample directly after the test, to let the loosened snow grains sinter. This waiting time avoided any grain to fall into the cavity created by the cone removal. In our tests, the cone tip reached an average depth of 10–15 mm, corresponding to an approximate distance of 5–10 mm to the sample bottom.
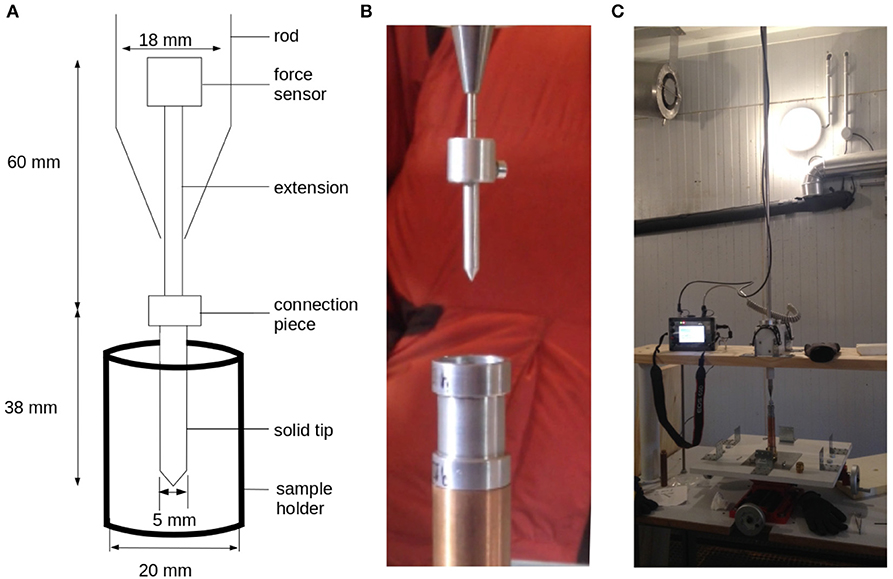
Figure 1. Set-up of cone penetration tests: (A) scheme of the cone tip, (B) photo of the cone tip, and (C) photo of the whole experimental setup with the positioning plate.
Snow mechanical behavior is highly rate-dependent, in particular due to very active sintering between grains. Hence, incremental CPTs followed by μCT, as conducted in sand (e.g., Paniagua et al., 2013), are not suitable for snow. The advantage of incremental CPTs is to have small grain displacements between two successive μCT scans (e.g., Andò et al., 2012). Here, we measured only the initial, intact snow microstructure and its final state after CPT. Characterizing the large grain displacements between these two images is a notoriously challenging task. However, at the considered penetration rate, snow behaves as a brittle material (e.g., Narita, 1983; Floyer and Jamieson, 2010) and can reasonably be considered as a granular assembly, i.e., we can assume that each grain moves as a solid body (Johnson and Hopkins, 2005; Hagenmuller et al., 2015). This feature was exploited to retrieve the displacement fields by combining: (1) tracking of individual grains (ID-track, Andò et al., 2012) based on their geometrical properties to obtain an initial displacement guess, and (2) digital image correlation (DIC) to refine this guess and achieve high accuracy and resolution (Hall et al., 2010).
In order to track individual grains between the pre- and post-CPT images, a first identification of snow grains in the binary images of ice and air is required. Individual grains were segmented by applying a curvature-based algorithm developed by Hagenmuller et al. (2014). This algorithm detects preferential zones of mechanical weakness based on two geometrical criteria: negative minimal principal curvature and low contiguity between the grains. A threshold of κt = 1.0 on normalized curvature was used, as suggested by Hagenmuller et al. (2014). A contiguity parameter of ct = 0.1 was chosen, to limit the number of grains by detecting only the thinnest bonds (see details in Hagenmuller et al., 2014).
The ID-Track follows the approach of Andò et al. (2012). The main idea is to pair grains in the pre- and post-CPT images which have similar geometrical properties and whose derived displacement is consistent. To this end, we considered three criteria on grain geometry: (i) similar grain volume (relative difference less than 50%), (ii) similar grain elongation (relative difference less than 50%), and (iii) large overlap (grains overlapping by at least 70%) between the grains aligned along their principle axis of moment of inertia. In addition, we considered two criteria on the resulting displacement between the paired grains: (i) small distance between the grain centers of mass in the two images (<20 voxels), and (ii) a globally outward displacement vector with respect to the cone center (i.e., the grain moves away from the cone). For each grain in the pre-CPT image, several grains of the post-CPT image may satisfy these five criteria. To select the best candidate out of this grain set, digital image correlation is used (see section 2.2.3).
The digital image correlation method follows the approach of Hall et al. (2010). The main idea is to perform digital image correlation between the pre- and post-CPT grayscale images on numerous analysis windows corresponding to each individual grain of the initial image. Figure 2 shows the main steps of these three-dimensional method in a simplified two-dimensional scheme for one grain. First, an analysis window surrounding the grain of interest is defined (Figure 2A). The window corresponds to the grain volume dilated in the air (but not in neighboring grains) by three voxels. Then, a standard image registration is performed to find the transformation that best matches the pre- and post-CPT images masked on the analysis windows (Figure 2E). The quality of this match is quantified by the cross-correlation between the transformed pre-CPT image and the post-CPT image. The possible transformations were limited to solid displacements (6 degrees of freedom: 3 translations, 3 rotations). If the final value of the registration metric exceeded CCmax = 0.75, the registration was considered successful, i.e., the grain in the pre-CPT image is correctly detected in the post-CPT image. Python package SimpleITK (Yaniv et al., 2018) (module ImageRegistrationMethodv4 with gradient descent optimization and linear interpolation) was used to perform this image registration.
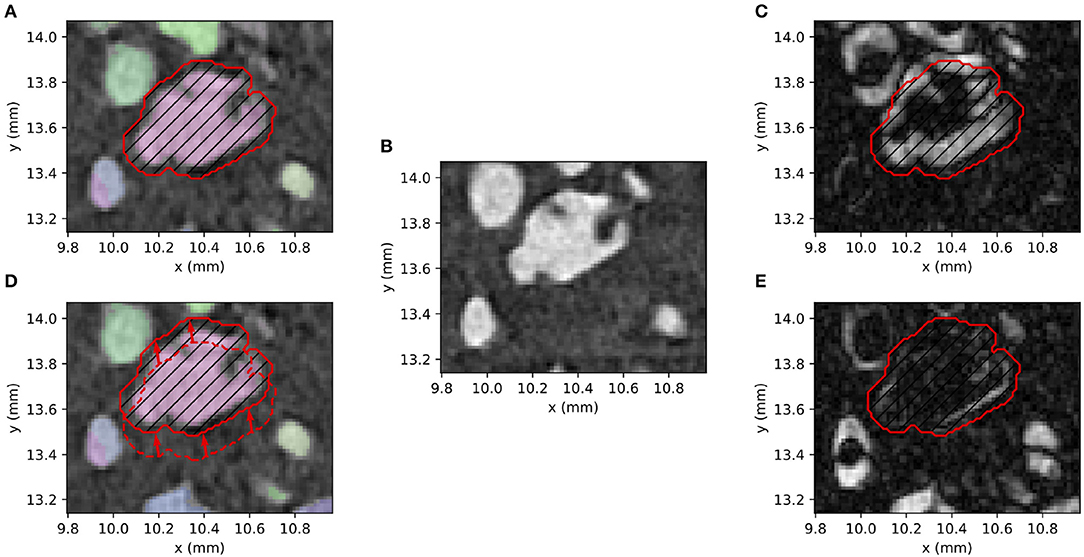
Figure 2. Digital image correlation technique: (A) selection of one grain in the pre-CPT image and associated analysis window (dashed area), (B) post-CPT image, (C) grayscale difference of the pre- and post-CPT images with the analysis windows, (D) displaced pre-CPT image with the displaced (red, solid line) and initial analysis windows (red, dashed line), (E) grayscale difference of the displaced pre-CPT and post-CPT images.
The example presented in Figure 2 shows a grain with a small displacement between the pre- and post-CPT images. In case of larger displacements, the registration optimizer does not necessarily find the optimum of the registration metric in the complex domain of solid transformations. In that case, the displacements estimated by the ID-track method were used to seed the digital image correlation (see section 2.2.4).
To optimize computing costs, ID-track and digital image correlation were combined as follows. First digital image correlation was performed with a null displacement as seed. This first pass detects most of the small displacements under 10 voxels magnitude (corresponding to about 80% of the total grains). The successfully matched grains in the pre- and the post-CPT images are then masked before applying the ID-track, which significantly reduces the computing cost. ID-track is then used with relatively restrictive criteria to detect potential pairs of grains and the associated displacement seeds. Finally, digital image correlation is applied with these seeds to find the best image of the moved grains, and refine the displacement seeds to sub-voxel accuracy. If the best result (quantified by the coefficient of correlation between the grayscale images) exceeds the threshold of CCmax = 0.75, the grain is assumed to be successfully matched. In addition, a last method was applied to the remaining unmatched grains. We used the idea that a grain most likely moves like its neighbors, and seeded the image correlation method for these remaining grains with the displacements of the seven closest grains whose displacements were already detected.
The proposed methodology provides the full 3D displacement field u(r, θ, z) at grain scale during a CPT in snow. However, some grains may not be successfully tracked between the pre- and post-CPT images, and variability at the grain scale might hide the overall behavior. Therefore, in addition to the 3D displacement at grain scale, we computed averaged displacements in the (r, z) plane and along the radial position (Figure 3). To this end, we defined a grid with a vertical step dz = 0.6 mm and radial step dr = 0.45 mm. Assuming that the displacement is invariant with rotation around the cone axis, we defined the average vertical and radial displacements (, ) as the averages of uz and ur over all azimuthal positions, respectively. The radial profiles and , were defined as vertical averages of and over the cylindric part of the penetrometer and up to a height equal to tip radius (Figure 3).
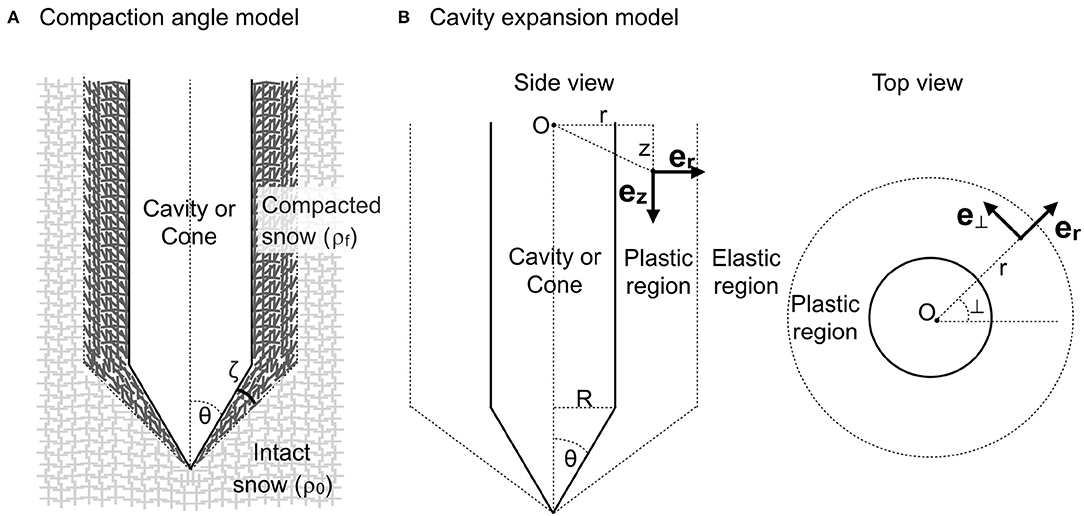
Figure 3. (A) Compaction angle model and (B) different regions and coordinate system used in the cavity expansion model.
The evolution of density next to the cone can be directly derived from the tomographic images (see section 2.1.2) but also from the displacement field. With the assumption of small strain and axial symmetry, the density in the post-image ρpost,disp can be related to the density in the initial image ρpre via the volumetric strain (defined as the trace of the strain tensor, here expressed in cylindrical coordinates) as:
Finally, we defined the deformation zone as the zone where displacement magnitude is larger than 30 μm (about 20% of typical grain size, see Table 1) and the compaction zone as the zone where density change is larger than 5%, i.e., 0.95 < ρ post/ρpre < 1.05. The deformation zone is thus defined from the tracking results and the compaction zone solely from the local densities directly derived from the pre- and post-CPT images.
In this section, we present two existing, mechanically-based, interpretation models for CPT: the first is based on the angle of compaction around a penetrating cone, and the second is based on the cavity expansion model.
Johnson (2003) defines the angle of compaction ζ as the angle of the compaction zone relative to the cone surface (Figure 3A). The model assumes that grains inside the compaction zone have the same size and microstructural properties as outside the zone. It is also assumed that grain bonds can only fail at the interface between the compaction zone and intact snow. Before failure is reached, the snow grains deform elastically in a direction normal to the penetrometer surface. After failure, the grains compact until they lock up, also in normal direction (Figure 3A). Johnson (2003) showed that the angle of compaction ζ depends on the half cone angle θ of the penetrometer tip, the initial density ρ0 and the density ρf in the compaction zone as follows:
where β is defined as the average volumetric strain in the compacted zone, i.e., β = (1 − ρ0/ρf). Equation (2) is easily applicable to our measurements, as density is directly measured on the tomographic images. The value of ρ0 and ρf were computed in the area close to the cone tip, namely for radial positions in the range [1, 1.5]R (with R the cone radius, see Figure 3B), on the pre- and post-CPT images, respectively.
Bishop et al. (1945) first pointed out the possibility to compute an approximate value for the load required to force a cone deep into an elasto-plastic continuum material. We consider here a cylindrical (given the shape of the tip) cavity expansion model in an infinite medium, with a zero initial cavity radius. Snow is described as a cohesive-frictional material with a non-associated Mohr-Coulomb model. The analytical approximate solution of the cavity expansion problem proposed by Yu and Carter (2002) is used.
The Mohr-Coulomb model for snow involves the following material parameters: Young's modulus E, Poisson's ratio ν, angle of friction ϕ, angle of dilation ψ, and cohesion C. Typical values for these parameters were chosen according to Mellor (1975) (Table 2). The boundary conditions far from the cavity are characterized by a hydro-static pressure p0, that was here set to 0. Similarly to Ruiz et al. (2017), an interfacial friction coefficient μ = 0.5 between the tip and the snow was considered.
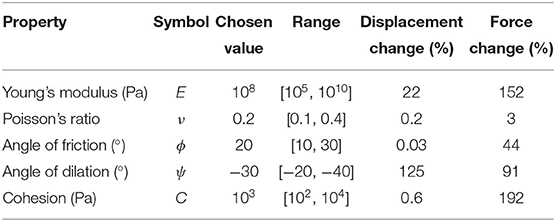
Table 2. Material parameters describing snow as a Mohr-Coulomb material, and results of sensitivity analysis on force and displacement computed by the cavity expansion model.
The cavity expansion model distinguishes three zones: the cavity (position of the penetrating cone), a surrounding plastic zone, and an outer elastic zone (Figure 3B). Yu and Carter (2002) showed that the radial and orthoradial normal stress components σr and σ⊥ in the elastic region can be obtained from the equilibrium equation and elastic stress-strain relations as follows:
where r is the radial coordinate (Figure 3B) and B is a constant of integration (see Equation 54 in Yu and Carter, 2002). In the plastic region, Yu and Carter (2002) found that the stress components satisfying the equilibrium equation and the yield condition are:
where is the yield stress, , and A is a constant of integration (see Equation 53 in Yu and Carter, 2002). The resulting penetration force Fp acting on the cone is computed similarly to Ruiz et al. (2017). The radial force acting on the conical tip is given by:
where R is the maximal cone radius. The resulting axial force required for cone penetration is, in the frictionless case:
By adding frictional effects, the resulting total penetration force is:
The model prescribes a purely radial displacement field. The displacement in the elastic zone is given by:
with δ and c depending on the material parameters (see Equations 40 and 55 in Yu and Carter, 2002). The displacement in the plastic zone depends on the plastic flow rule. With a non-associated Mohr-Coulomb flow rule, the explicit expression of the radial displacement is complex. Displacement in this zone was computed by numerically integrating the so-called incremental velocity V (derivative of radial displacement with respect to cavity radius expansion), whose analytical expression is:
where β and γ are constants defined in Equations (39) and (74) in Yu and Carter (2002).
Figure 4 shows the displacement field computed for the parameter values indicated in Table 2, as well as the corresponding density changes (computed from Equation 1) and force profile. Most of the displacement and density changes take place in a region of about 1.5R (Figures 4A,B). The force profile shows a parabolic increase with depth until the conical part of the tip has completely penetrated the snow material, followed by a linear increase with depth due to friction (Figure 4C).
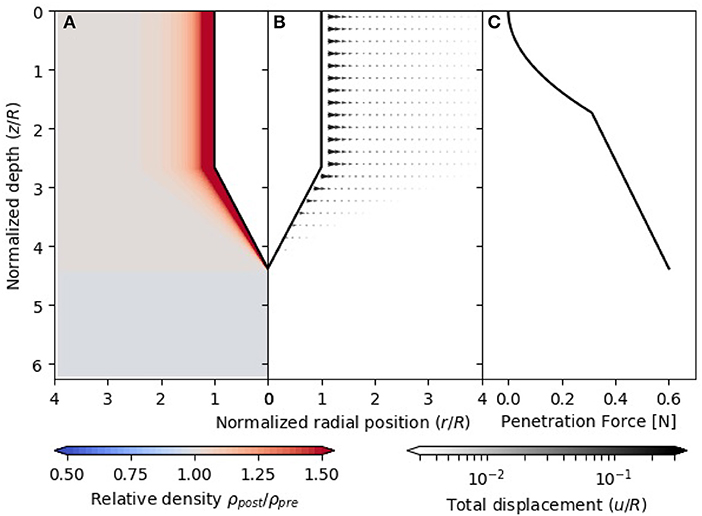
Figure 4. Analytical solution of the cavity expansion model by Yu and Carter (2002): (A) relative density change, (B) displacement field normalized by tip radius R, and (C) penetration force profile. The relative density change is defined as the ratio between the density ρpost after the CPT and the density ρpre before the CPT.
We evaluated the sensitivity of the computed displacements and forces on the material parameters (Table 2). To this end, each parameter was varied in a realistic range (see column “range” in Table 2), while the other parameters were kept constant (see column “chosen value” in Table 2). The impact of the parameter values was evaluated on the radial force at the interface between the plastic and the cavity regions, and on the mean displacement for radial positions in the range [1, 4]R. In both cases, Table 2 reports relative differences with respect to values obtained with the “chosen value” of the parameter. Results show that the displacement field is almost only controlled by the angle of dilation ψ. In contrast, the force mainly depends on the cohesion C, Young's modulus E, and angle of dilation ψ.
In this section, we first evaluate the performance of the tracking algorithm on the experimental data. The CPT-induced displacement field and compaction zone are then analyzed. Finally, the measured displacement and force are compared to the predictions of the mechanical models presented in section 2.3.
Figure 5 displays the grains in the pre-CPT image and the displacements induced by cone penetration for sample RG1. Similar figures for other samples can be found in Figure S2. We observe significant displacements in a region of about twice the cone radius. In general, movements are directed outwards and downwards, but also upwards close to snow surface. Note that displacements are here plotted as straight lines between the initial and final positions, which might not correspond to the exact grain trajectory, especially for large displacements.
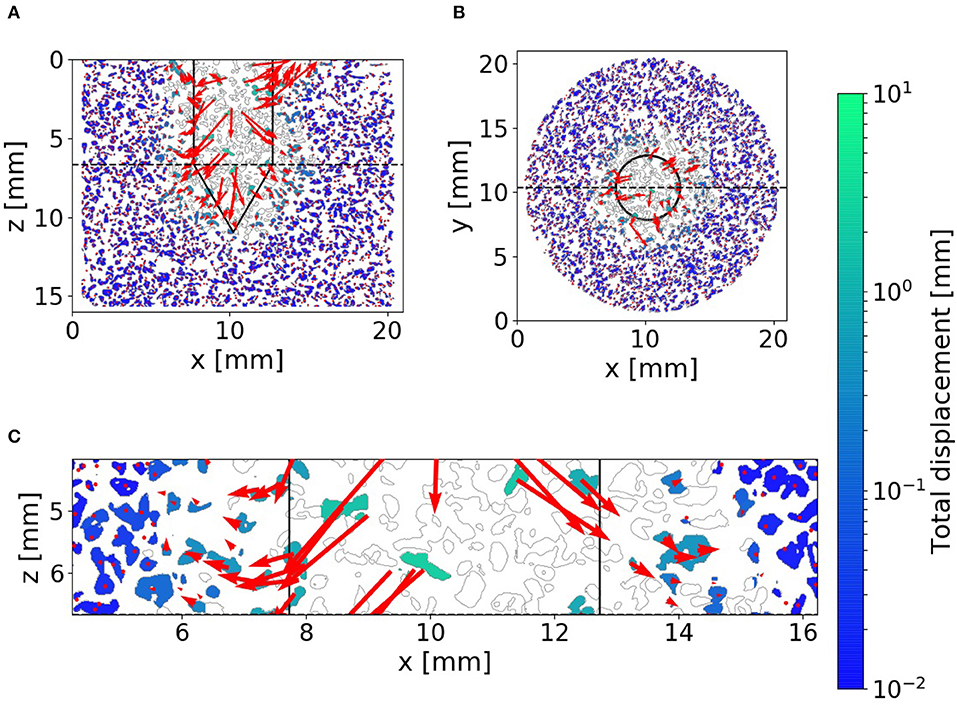
Figure 5. Tracked displacement field for sample RG1 shown on (A) a vertical slice, (B) a horizontal slice, and (C) a zoom on the vertical slice. The dotted line in the vertical slice shows the position of the horizontal slice and vice versa. The contours of the grains in the pre-CPT image are shown in gray. Colors indicate the absolute displacement, and arrows show displacement components in the slice plane.
The tracking algorithm fails to recover the displacement of all grains (see white grains in Figure 5). Nevertheless, as shown in Table 3, 90% of the grains, at least, were successfully tracked. Most of grains did hardly move, and were thus easy to track. However, in the zone of radius 2R where the largest displacements are observed, about 40–80% of the grains were still successfully tracked. If we only consider the grains initially located in the cavity, i.e., the zone occupied by the cone tip after the CPT, about 10–50% of the grains were successfully tracked.
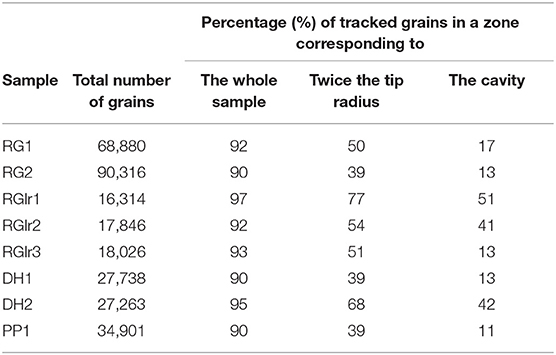
Table 3. Total number of grains and percentage of tracked grains in the different snow samples.
The percentage of tracked grains depends on snow type. The algorithm detects the largest percentage of grains in samples composed of large rounded grains (RGlr), followed by depth hoar (DH) and rounded grains (RG). The lowest percentage of detection is obtained for samples composed of precipitation particles (PP). The grains composing the RGlr and DH samples are large and exhibit relatively unique shapes (see Figure S1), which makes the ID-track particularly efficient. Additionally, the tracking method also relies on the consistency of the grain segmentation. Grains can be efficiently tracked only if they are segmented in the same way in pre- and post-CPT image, without over- or under-segmentation. On RGlr or DH snow types, individual grains can generally be unambiguously identified, whereas the definition of grains in the PP type strongly depends on the chosen segmentation thresholds and can be affected by potential noise at the ice-air interface (Hagenmuller et al., 2014).
Accuracy of the computed displacement field was evaluated through two different approaches. Let us first recall that a grain is considered as successfully tracked when a correlation coefficient larger than CCmax = 0.75 is obtained between the pre- and post-CPT images (see sections 2.2.3 and 2.2.4). While this threshold indicates that the associated grains are similar, it does not guarantee that the association is physically correct. Hence, we checked visually the computed displacements on some selected grains, which appeared to be correct according to the displacements of the neighboring grains (Figure 5). More quantitatively, the obtained displacements were used to compute the density ρpost,disp in the post-CPT image (see Equation 1), which can be compared to the density directly measured on the post-CPT image ρpost. This calculation provides a quantitative evaluation of the tracking method accuracy. In details, volumetric strain was computed only in regions with small displacements (radial and vertical displacements smaller than 30 voxels, i.e., 0.45 mm), so that the assumption of infinitesimal strain remains valid. As shown in Figure 6, values of ρpost,displ and ρpost generally follow the 1:1 line, which indicates the consistency of the computed displacement field. The deviations tend to increase with the total displacement, which indicates that their might partially be due to the small strain assumption used for density calculation from the displacement field. Small deviations may also originate from segmentation errors of the ice, which can cause variations of the density of up to 5% according to Hagenmuller et al. (2016). Finally, some outliers can be observed, especially for DH and RGlr snow types, which exhibit the lowest relative compaction.
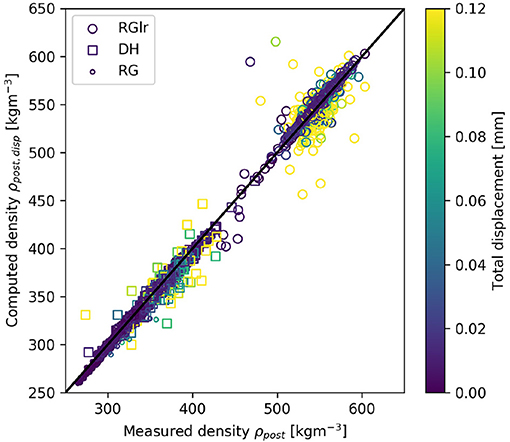
Figure 6. Comparison between the post-CPT density computed from the displacement field ρpost,disp and the post-CPT density directly measured on the tomographic image ρpost for the seven snow samples of type RG, RGlr and DH. Snow type is distinguished by point symbol. The points are colored according to their total displacement. Computed density is considered as representative, and shown on the figure, only if more than 30% of the grains are successfully tracked in the considered sub-volume.
Figure 7 shows density changes and averaged displacement fields in the (r, z) plane for samples RG1 and DH2 (corresponding plots for the other samples are provided in Figure S2). Both radial and vertical displacements are observed. Vertical displacements are oriented upwards close to the surface, and tend to be downwards close to the tip apex. Upward movements close to snow surface tend to be more pronounced for snow types RGlr and DH, whereas downward movements close to the apex are more pronounced for snow type RG. The displacement field generally varies with both r and z, precluding the existence of solid blocks of compacted snow moving downwards or radially with the tip. The deformed zone rather progressively forms and evolves with cone penetration. Cone penetration is associated to compaction next to the tip in moderately dense samples (samples RG1, RG2, PP), but to dilation in denser samples (samples RGlr1, RGlr2, RGlr3, DH1, DH2).
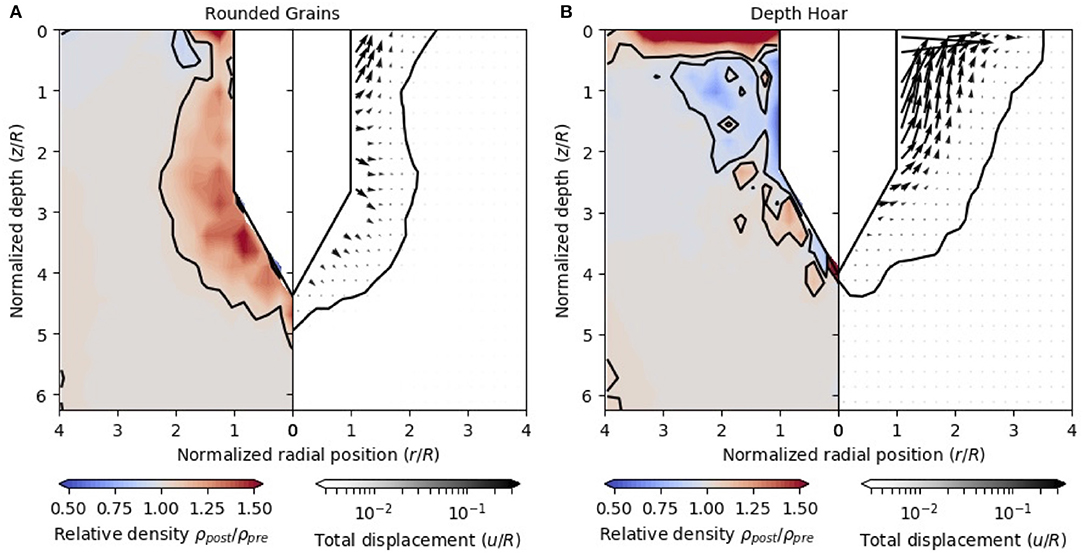
Figure 7. Averaged density change (left side) and displacement field normalized by tip radius R (right side) around cone tip for two snow types: (A) RG (sample RG1), (B) DH (sample DH2). Contours show the compaction and deformation zones around the tip. Displacements are plotted only if more than 30% of the grains in the corresponding sub-volume are successfully tracked.
Figure 7 shows (black contour) the deformation zone and the compaction zone for two samples. Recall that these zones are based on thresholds on the volumetric deformation and absolute density change, respectively (see section 2.2.5). The radial and vertical extents of these two zones depend on the considered sample. Table 4 summarizes the average values obtained for all samples. For sample PP1, we did not track enough grains to derive the deformation zone. Sample RGlr2 showed an upward movement in the whole cylinder, probably due to the deformation zone reaching sample bottom. In this case, no relevant deformation zone can be determined. In general, the radial extent of this zone varies between 1.8−2.7R, with the highest values for snow type DH, followed by RGlr and RG (Table 4). The radial size of the deformation and compaction zones are similar for RG samples, while the compaction zone is slightly smaller than the deformation zone for RGlr and DH samples. Lastly, RG and PP samples show compaction zones of similar radial extents (about 2R). The vertical extents of the deformation and compaction zones are similar, and smaller or equal than 1R, for all samples.
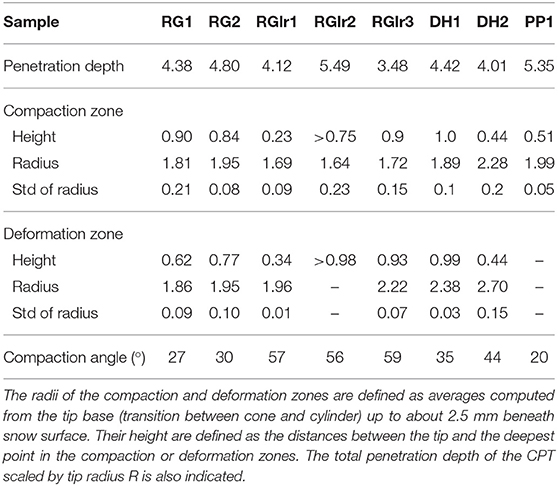
Table 4. Size of the compaction and deformation zones normalized by tip radius R and compaction angle according to the model of Johnson (2003), for all samples.
A fast decay of the vertical and radial displacements with the radial position is observed for the different samples (Figure 8). The definition of the deformation zone (see section 2.2.5) is thus not very sensitive to the chosen displacement threshold. The vertical displacements are the smallest for RG samples, and the largest for RGlr and DH samples. They are positive (downwards) for RG samples and negative (upwards) for the other snow types. Radial displacements are of the same magnitude for all snow types.
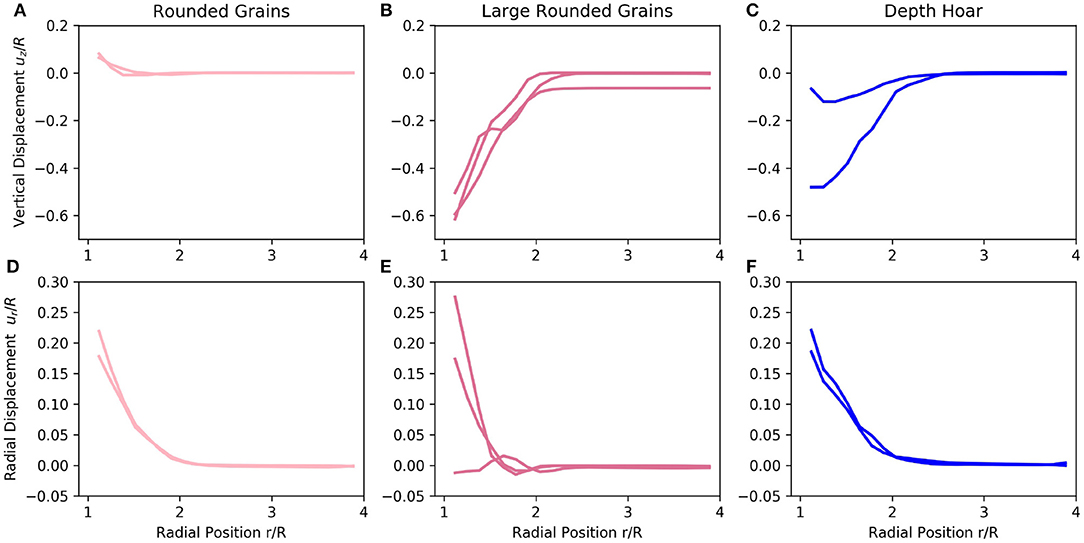
Figure 8. Radial profiles of vertical (A–C) and radial displacement (D–F) normalized by tip radius R for RG (A,D), RGlr (B,E), and DH (C,F) snow types. In all plots, the different profiles correspond to the different samples for each snow type.
Density change profiles (Figure 9) clearly show that compaction or dilation is located in a zone whose radius is about 2.5R. As expected, largest density changes are observed close to the cone tip. Clear compaction is observed for snow types RG and PP, with maximal compaction values between 1.4 and 1.5. In addition, the strongest relative compaction is observed for the less dense samples. For samples with larger initial densities (DH and RGlr), dilation next to the tip is observed. However, DH samples, which are less dense than RGlr samples, show less dilation and even slight compaction in one case. RGlr samples show maximal dilation values (0.6).
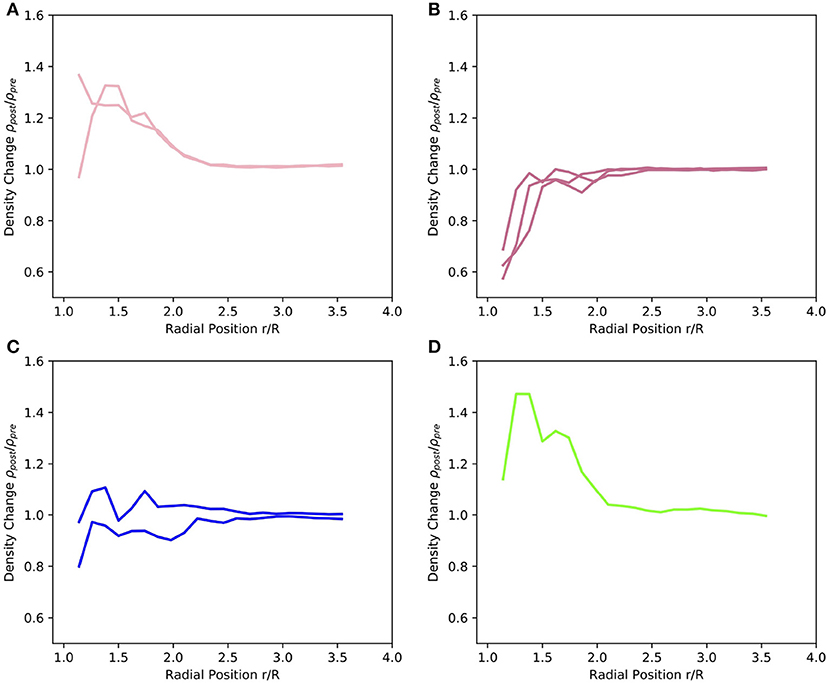
Figure 9. Radial profiles of density changes for RG (A), RGlr (B), DH (C), and PP (D) snow types. In all plots, the different profiles correspond to the different samples for each snow type.
Table 4 presents the theoretical compaction angle computed from Equation (2) on all samples. We recall that the compaction angle model also provides the radial extent of the compaction zone as the transition between the theoretically uniform compacted snow and the intact snow. The derived radial extent is smaller than the size of the sample (less 4R) for only four samples. The smallest radial extent (2.1R) is obtained for PP, followed by RG (2.8R) and DH (4.0R). The extent of the compaction zone derived from the model is in agreement with the measured values for sample PP1 (see Table 4), but is over-estimated for the other snow types. Indeed, Johnson (2003)'s compaction model assumes an abrupt transition between intact snow and snow compacted to its critical density, which is not observed in our experiments (Figure 9). The samples either exhibit dilation next to the tip, or progressive compaction from the intact snow to the interface of the cone.
Figure 10 compares the measured radial displacement profiles and the displacements predicted by the cavity expansion model. We recall that the model predicts null vertical displacements, while all tested samples (besides PP, for which we were not able to retrieve a displacement field) display a vertical displacement component (Figures 8A–C). The radial displacements (Figure 10) for the RG and DH snow types show relatively good agreement with the model. Best agreement was obtained for ψ = −30o, with values of R2 > 0.9. However, no value of the dilation angle ψ enabled to fit the model over the whole range of r values. For radial positions in [1, 1.5]R, the best fit is obtained with ψ ∈ [−25, −30]°, but the faster displacement decay for larger r is better captured with ψ = −35°. For RGlr snow type, radial displacements decay to zero much faster than the model regardless of the considered value of ψ, and for one sample (RGlr3) there is almost no radial displacement observed.
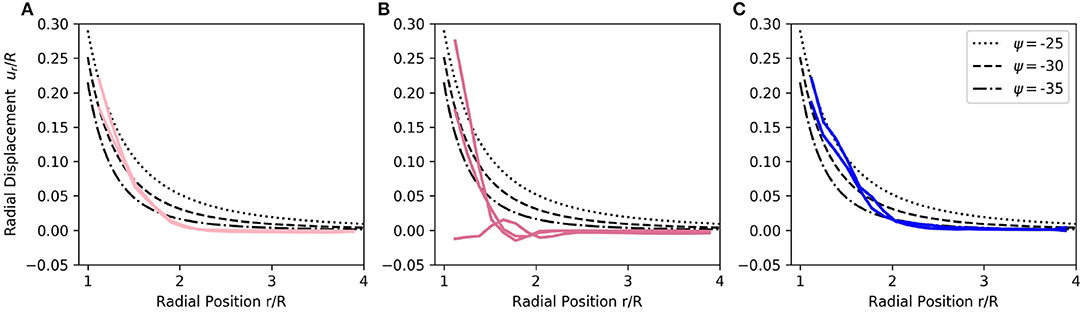
Figure 10. Comparison between measured radial displacement profiles and predictions of cavity expansion model for different snow types: (A) RG, (B) RGlr, (C) DH. Predicted profiles are shown for three different dilation angles ψ, which is the only material parameter that significantly affects the computed displacements (Table 2).
Figure 11 compares the force measured during the CPT to the solutions of the cavity expansion model. All material properties of the model, except for cohesion, were chosen according to typical snow properties (Table 1). Cohesion C was varied between 500 and 1,500 Pa. The general shape (parabolic) of the force profile appears to be well reproduced by the model. Obviously the cavity expansion model, which is based on the assumption of a continuum material, fails to reproduce the discrete nature of bond failures resulting in force fluctuations with depth. The recorded force profiles for the RG, RGlr, and DH snow samples agree with theoretical estimates obtained for cohesion values in the range [250, 1,500] Pa, while the force recorded for the PP sample appears to correspond to a lower cohesion.
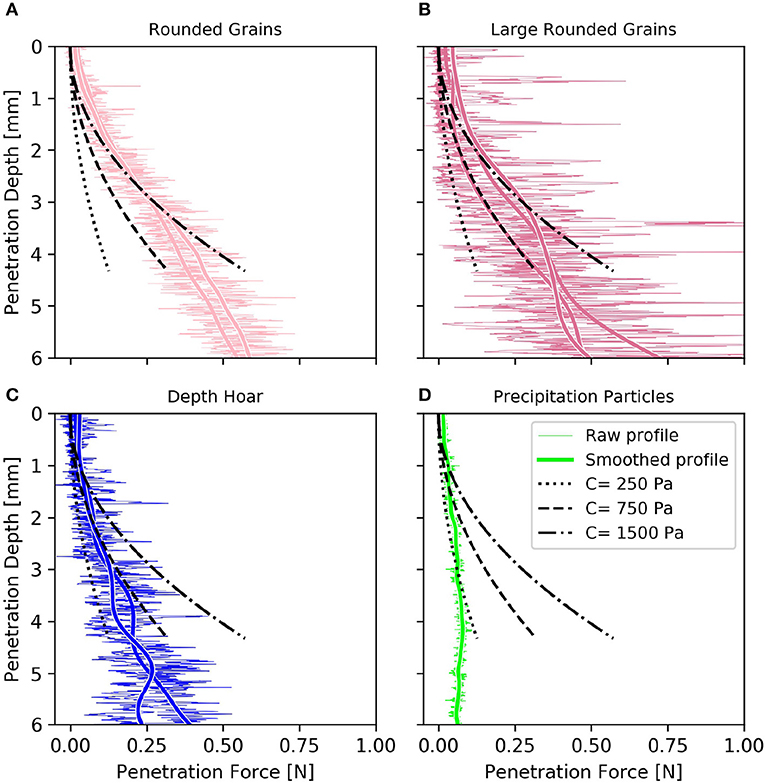
Figure 11. Measured and computed CPT force profiles for the different snow types: (A) RG, (B) RGlr, (C) DH, (D) PP. The measured profiles are smoothed with a Gaussian filter of standard deviation equal to twice the equivalent optical radius (see Table 1). Computed profiles are obtained from Equation (3) with different values of cohesion C.
A novel method for three-dimensional tracking of individual grains around a CPT in granular materials was presented. It was applied to μCT images of eight snow samples, covering four different snow types. For each sample, two images were measured, one before and one after the CPT. The main challenge consisted in identifying the large displacements. Indeed, the highly rate-dependent mechanical behavior of snow did not allow us to conduct incremental CPT. However, compared to previous experimental studies of CPT in sand or soils (e.g., Paniagua et al., 2013; Silva et al., 2015), the relatively unique shape of each snow grain renders tracking applicable on such large displacements.
Our study provides the first observation of the full 3D displacement field at grain scale during a CPT in snow. Some grains could not be successfully tracked between the pre- and post-CPT images (Figure 5). However, assuming invariance of the displacement with rotation around the cone axis, we were able to reconstruct the displacement field everywhere outside the cavity (Figure 7). While direct validation of the tracking algorithm is out of reach, due to the absence of reference, the chosen methodology (high threshold on correlation coefficient to consider a successful tracking) and indirect validation on the density field (Figure 6) provide good confidence in the obtained results.
The use of X-Ray tomography at a resolution of 15 μm inherently limited the size of the snow samples. The samples were cylinders of diameter and height of 20 mm (4R), confined in aluminum holders. Cone penetration reached an average depth of 10 mm, corresponding to an approximate distance of 7 mm (≈2.5R) to sample bottom. Herwijnen (2013) showed that a steady-state penetration behavior is reached on average after 40 mm of penetration depth in homogeneous snow samples. In this study, this steady-state regime could not be reached and we clearly observed different displacements close to snow surface, in comparison to larger depths (Figure 7 and Figure S2). However, on samples RG or PP (Figure 9 and Table 4), we did not observe any evidence of an increase or decrease of compaction zone radius with depth below the snow surface (depth > 1 mm).
For low-density snow, the confinement of the samples is expected to have little influence on the measured displacements and forces. Some tested samples (RGlr1, 2 and 3) do however exhibit a high initial density, up to about 560 kg m−3. In this case, the confinement may affect the CPT, in comparison to a test performed in a infinite medium. This impact was obvious on sample RGlr2, for which the largest penetration depth was reached and an overall upward movement of the sample was observed. Nevertheless, it has to be recalled that previous studies (e.g., Herwijnen, 2013; LeBaron et al., 2014), principally based on 2D imaging of snow samples through a viewing window, may also be affected by some boundary effects. In addition to sample confinement, the removal of the cone before the second tomographic scan may also affect the observed displacement field. Even if the cone was removed after about 2 h of sintering to solidify the cavity, we could observe that some grains were eroded from the sample and deposited on the top surface because of residual friction with the cone, particularly on samples characterized by a high initial density (Figure 7 and Figure S2).
Snow deformation around the cone was analyzed using the displacements retrieved by the tracking algorithm and the density evolution directly computed from the tomographic images. These two techniques are complementary. Tracking provides the full 3D, vectorial displacement field at grain scale, but fails to identify all the grains, especially when displacements are large. Density evolution can be directly computed on the whole volume and is more robust, but it is a scalar value and its resolution is limited to several grains.
In general, downwards movements were observed at tip apex, and upwards movements close to sample surface (e.g., Figure 7). In the literature, similar displacement patterns are reported for granular soils and clays (e.g., Ni et al., 2010; Arshad et al., 2014). Similar displacement patterns were also observed by Jiang et al. (2006) on numerical experiments with a discrete element model. Our experiments showed a dependence of the displacement pattern with snow type. In particular, the vertical displacement component was the smallest for RG samples, and the strongest upward movements were observed for DH and RGlr samples (Figure 8). These two latter snow types are characterized by the largest initial densities, which may be the origin of the upward movement. This interpretation is in agreement with the observed density fields, which show almost no compaction for these samples. Hence the grains, instead of being compacted, are pushed upwards to let the cone penetrate.
Close to the cone tip, we observed compaction for snow types RG and PP and dilation for snow types RGlr and DH. These two groups differ by their initial density (denser RGlr/DH than PP/RG) and grain size (smaller PP/RG than RGlr/DH). These findings are consistent with observations of Riche and Schneebeli (2010), who investigated the perturbation induced by the penetration of a needle probe (1.2 mm diameter) into snow. They observed that samples with small structures develop a densified zone up to 0.2 mm surrounding the needle, while samples with larger structures (e.g., depth hoar) show a marked decrease of the volume fraction up to 0.5 mm from the needle, and a much smaller and less distinct densified zone.
Deformation and compaction zones were defined on the base of thresholds on displacement magnitude and absolute density change. Unlike Floyer (2008), however, we did not observe significant differences between the two zones, i.e., grain displacements were systematically associated to density changes (compaction or dilation). Specifically, we did not observe any solid bulb of snow grains moving with the tip. Instead, the compaction zone appears to continuously reform with depth. The radius of the compaction zone obtained from our experiments appears to be smaller than values found in previous studies (Table 4). LeBaron et al. (2014) reported radii of about 3R. Herwijnen (2013) measured an average ratio of 2 between the compaction zone radius and the tip radius, with values up to 4.7 for dense snow (390 kg m−3). Floyer (2008) obtained a radial extent of the compaction zone of about 2R. Here, we observed values in the range [1.6, 2.3]R (see Table 4), which might be due to a not fully developed compaction zone. Indeed, Herwijnen (2013) (Figure 11 therein) showed a slight increase of the compaction zone radius with depth: from 1.5R for a penetration depth of 15 mm to 2R for a depth of 40 mm.
We used our experimental data to evaluate the displacement field predicted by the compaction angle model of Johnson (2003) and the cavity expansion model (Yu and Carter, 2002; Ruiz et al., 2017). The compaction angle model assumes that the compacted material around the cone tip reaches a uniform critical density. We showed that this assumption is not valid for snow (e.g., Figure 7), and leads to wrong predictions of compaction zone size (Table 4).
The cavity expansion model relies on the assumption of a continuum material. Bolton et al. (1993) showed that the continuum assumption reaches its limit when the ratio of cone penetrometer size to grain size is lower than 20. In our case, this corresponds to a mean grain radius larger than 0.125 mm. Samples of DH and RGlr are clearly above this limit, which may explain deviations from the model. A relatively good agreement was nevertheless observed between the measured and predicted radial displacement profiles for samples of DH. The RG samples are characterized by much smaller grains, and the assumption of a continuum medium is more justified in this case. Accordingly, a good agreement was observed with the model in terms of radial and vertical (null) displacements. For both DH and RG snow types, the best fit was obtained for a dilation angle of −30°. The modeled force reproduced relatively well the parabolic shape of the measured profiles. The values of cohesion (about 1,000 Pa, see Figure 11), required to model the force, are in agreement with literature (Chandel et al., 2014; Reiweger et al., 2015). In our samples, the lowest cohesion is obtained for the PP sample, followed by DH, while the largest values were reported for RG and RGlr samples (see Figure 11).
A reliable interpretation of CPT force profiles requires a correct estimation of the displacement around the cone tip. We measured this displacement on snow with X-ray tomography, and proposed a novel method for recovering large displacements between two μCT scans. The method was applied to our data consisting of pre- and post-CPT tomographic images for eight snow samples. Most of the grains were successfully tracked between the two images. The volumetric strain is correctly reproduced by the tracking algorithm, giving confidence in the accuracy of the presented methodology. Measured displacements were oriented downwards at tip apex, upwards close to sample surface, and nearly radially in between. Displacements were shown to be sensitive to the initial sample density. In particular, upward movements were particularly pronounced for high density samples. CPT generally caused snow compaction around the tip but, surprisingly, dilation was also observed for the highest density (> 350 kg m−3) samples. However, sample confinement and shallow penetration depths might affect this behavior. Extension of these results to larger sample diameters and to penetration depths greater than 10 mm remains to be investigated. The radial extent of the compaction zone ranged between [1.6, 2.3]R, while its vertical extent below the tip ranged between [0.2, 1.0]R. We did not observe a clear variation of the size of the compaction zone with density.
Our results show that the size of the compaction zone cannot be accurately estimated by the simple model of Johnson (2003) for snow, as density progressively increases from intact snow to the snow in contact with cone tip. The cavity expansion model captures this progressive compaction. Moreover, force profiles predicted by the cavity expansion model for relevant material properties are in good agreement with measured profiles. Clearly, however, this model fails to reproduce force fluctuations due to the discrete nature of bond failures, and is unable to capture the vertical movement of snow particles during CPT.
Our results also provide an indirect evaluation of Poisson shot noise models (Löwe and Herwijnen, 2012; Peinke et al., 2019) for CPT. These models assume the force to be the sum of independent elastic brittle failures, and that grains do not contribute to the overall force once their bonds are broken, thus effectively disregarding the existence of the compaction zone. Consistently with Herwijnen (2013) and LeBaron et al. (2014), our measurements show that the compaction zone is not negligible and may play an important role for the force interpretation, even in very low density samples.
The datasets for this study are available upon request to the corresponding author.
IP, PH, and GC wrote the article with contributions of all co-authors. IP and JR conducted the cold-room CPT. IP, FF, PH, JR, and EA performed the tomographic measurements. IP, EA, and PH developed the tracking algorithm.
CNRM/CEN and ETNA were part of LabEX OSUG@2020 (ANR10 LABX56). ETNA was part of LabEX TEC21 (ANR11 LABX30). This work was partly supported by the European Space Agency under ESTEC Contract No. 4000112698/14/NL/LvH.
The authors declare that the research was conducted in the absence of any commercial or financial relationships that could be construed as a potential conflict of interest.
We would like to thank S. Rolland du Roscoat, P. Charrier, L. Pézard, and P. Lapalus for their help with tomographic measurements and experiment design.
The Supplementary Material for this article can be found online at: https://www.frontiersin.org/articles/10.3389/feart.2020.00063/full#supplementary-material
Andò, E., Hall, S. A., Viggiani, G., Desrues, J., and Bésuelle, P. (2012). Grain-scale experimental investigation of localised deformation in sand: a discrete particle tracking approach. Acta Geotech. 7, 1–13. doi: 10.1007/s11440-011-0151-6
Arshad, M., Tehrani, F., Prezzi, M., and Salgado, R. (2014). Experimental study of cone penetration in silica sand using digital image correlation. Géotechnique 64, 551–569. doi: 10.1680/geot.13.P.179
Bader, H., Haefeli, R., Bucher, E., Neher, J., Eckel, O., and Thams, C. (1939). Der Schnee und seine Metamorphose. Beiträge zur Geologie der Schweiz. Schweizerische Schnee- und Lawinenforschungskommission (Snow and its metamorphism). SIPRE Trans. 14:1954.
Baligh, M. (1986). Undrained deep penetration, I: shear stresses. Geotechnique 36, 471–485. doi: 10.1680/geot.1986.36.4.471
Bishop, R. F., Hill, R., and F Mott, N. (1945). The theory of indentation hardness tests. Proc. Phys. Soc. 57:321. doi: 10.1088/0959-5309/57/3/301
Blackford, J. (2007). Sintering and microstructure of ice: a review. J. Phys. D Appl. Phys. 40, R355–R385. doi: 10.1088/0022-3727/40/21/R02
Bolton, M. D., Gui, M. W., and Phillips, R. (1993). “Review of miniature soil probes for model tests,” in Proceedings of the 11th Southeast Asian Geotechnical Conference (Singapore), 85–90.
Calonne, N., Flin, F., Lesaffre, B., Dufour, A., Roulle, J., Puglièse, P., et al. (2015). CellDyM: a room temperature operating cryogenic cell for the dynamic monitoring of snow metamorphism by time-lapse X-ray microtomography. Geophys. Res. Lett. 42, 3911–3918. doi: 10.1002/2015GL063541
Chandel, C., Srivastava, P. K., and Mahajan, P. (2014). Micromechanical analysis of deformation of snow using X-ray tomography. Cold Reg. Sci. Technol. 101, 14–23. doi: 10.1016/j.coldregions.2014.01.005
Fierz, C., Armstrong, R. L., Durand, Y., Etchevers, P., Greene, E., McClung, D. M., et al. (2009). “The international classification for seasonal snow on the ground,” in Tech. Doc. Hydrol. 83 Paris: UNESCO.
Floyer, J. (2008). Layer detection and snowpack stratigraphy characterisation from digital penetrometer signals (Ph.D. thesis). Department of Geoscience, University of Calgary, Calgary, AB, Canada.
Floyer, J., and Jamieson, J. (2010). Rate-effect experiments on round-tipped penetrometer insertion into uniform snow. J. Glaciol. 56, 664–672. doi: 10.3189/002214310793146322
Floyer, J. A., and Jamieson, J. B. (2006). “Empirical analysis of snow deformation below penetrometer tips,” in Proceedings of the International Snow Workshop (Telluride, CO), 555–561.
Hagenmuller, P., Chambon, G., Flin, F., Morin, S., and Naaim, M. (2014). Snow as a granular material: assessment of a new grain segmentation algorithm. Granular Matt. 16, 421–432. doi: 10.1007/s10035-014-0503-7
Hagenmuller, P., Chambon, G., Lesaffre, B., Flin, F., and Naaim, M. (2013). Energy-based binary segmentation of snow microtomographic images. J. Glaciol. 59, 859–873. doi: 10.3189/2013JoG13J035
Hagenmuller, P., Chambon, G., and Naaim, M. (2015). Microstructure-based modeling of snow mechanics: a discrete element approach. Cryosphere 9, 1969–1982. doi: 10.5194/tc-9-1969-2015
Hagenmuller, P., Matzl, M., Chambon, G., and Schneebeli, M. (2016). Sensitivity of snow density and specific surface area measured by microtomography to different image processing algorithms. Cryosphere 10, 1039–1054. doi: 10.5194/tc-10-1039-2016
Hagenmuller, P., van Herwijnen, A., Pielmeier, C., and Marshall, H.-P. (2018). Evaluation of the snow penetrometer avatech SP2. Cold Reg. Sci. Technol. 149, 83–94. doi: 10.1016/j.coldregions.2018.02.006
Hall, S., Bornert, M., Desrues, J., Pannier, Y., Lenoir, N., Viggiani, G., et al. (2010). Discrete and continuum analysis of localised deformation in sand using X-ray CT and volumetric digital image correlation. Géotechnique 60, 315–322. doi: 10.1680/geot.2010.60.5.315
Herwijnen, A., and Miller, D. A. (2013). Experimental and numerical investigation of the sintering rate of snow. J. Glaciol. 59, 1–6. doi: 10.3189/2013JoG12J094
Herwijnen, A. V. (2013). Experimental analysis of snow micropenetrometer (SMP) cone penetration in homogeneous snow layers. Can. Geotech. J. 50, 1044–1054. doi: 10.1139/cgj-2012-0336
Jiang, M., Yu, H.-S., and Harris, D. (2006). Discrete element modelling of deep penetration in granular soils. Int. J. Numer. Anal. Meth. Geomech. 30, 335–361. doi: 10.1002/nag.473
Johnson, J. (2003). A statistical micromechanical theory of cone penetration in granular materials. ERDC/CRREL. Technical Report 03-3. 51, 1–12.
Johnson, J., and Hopkins, M. (2005). Identifying microstructural deformation mechanisms in snow using discrete-element modeling. J. Glaciol. 51, 432–442. doi: 10.3189/172756505781829188
Johnson, J., and Schneebeli, M. (1999). Characterizing the microstructural and micromechanical properties of snow. Cold Reg. Sci. Technol. 30, 91–100. doi: 10.1016/S0165-232X(99)00013-0
LeBaron, A., Miller, D., and van Herwijnen, A. (2014). Measurements of the deformation zone around a split-axis snow micropenetrometer tip. Cold Reg. Sci. Technol. 97, 90–96. doi: 10.1016/j.coldregions.2013.10.008
Löwe, H., and Herwijnen, A. (2012). A Poisson shot noise model for micro-penetration of snow. Cold Reg. Sci. Technol. 70, 62–70. doi: 10.1016/j.coldregions.2011.09.001
Mackenzie, R., and Payten, W. (2002). “A portable, variable-speed, penetrometer for snow pit evaluation,” in Proceedings of the International Snow Workshop (Penticton, BC), 294–300.
Marshall, H.-P., and Johnson, J. (2009). Accurate inversion of high-resolution snow penetrometer signals for microstructural and micromechanical properties. J. Geophys. Res. 114:F04016. doi: 10.1029/2009JF001269
Mayne, P. (2007). In-situ test calibrations for evaluating soil parameters. Characterisat. Eng Propert. Natural Soils 3, 1601–1652. doi: 10.1201/noe0415426916.ch2
McCallum, A. (2014). A brief introduction to cone penetration testing (CPT) in frozen geomaterials. Ann. Glaciol. 55, 7–14. doi: 10.3189/2014AoG68A005
Narita, H. (1983). An experimental study on tensile fracture of snow. Contribut. Inst. Low Temperat. Sci. A32, 1–37.
Ni, Q., Hird, C., and Guymer, I. (2010). Physical modelling of pile penetration in clay using transparent soil and particle image velocimetry. Geotechnique 60:121. doi: 10.1680/geot.8.P.052
Paniagua, P., Andò, E., Silva, M., Emdal, A., Nordal, S., and Viggiani, G. (2013). Soil deformation around a penetrating cone in silt. Géotechnique Lett. 3, 185–191. doi: 10.1680/geolett.13.00067
Peinke, I., Hagenmuller, P., Chambon, G., and Roulle, J. (2019). Investigation of snow sintering at microstructural scale from micro-penetration tests. Cold Reg. Sci. Technol. 162, 43–55. doi: 10.1016/j.coldregions.2019.03.018
Pielmeier, C., and Schneebeli, M. (2003). Stratigraphy and changes in hardness of snow measured by hand, ramsonde and snow micro penetrometer: a comparison with planar sections. Cold Reg. Sci. Technol. 37, 939–405. doi: 10.1016/S0165-232X(03)00079-X
Proksch, M., Löwe, H., and Schneebeli, M. (2015). Density, specific surface area, and correlation length of snow measured by high-resolution penetrometry. J. Geophys. Res. Earth Surf. 120, 346–362. doi: 10.1002/2014JF003266
Reiweger, I., Gaume, J., and Schweizer, J. (2015). A new mixed-mode failure criterion for weak snowpack layers. Geophys. Res. Lett. 42, 1427–1432. doi: 10.1002/2014GL062780
Reuter, B., Proksch, M., Löwe, H., Van Herwijnen, A., and Schweizer, J. (2019). Comparing measurements of snow mechanical properties relevant for slab avalanche release. J. Glaciol. 65, 55–67. doi: 10.1017/jog.2018.93
Reuter, B., Schweizer, J., and van Herwijnen, A. (2015). A process-based approach to estimate point snow instability. Cryosphere 9, 837–847. doi: 10.5194/tc-9-837-2015
Riche, F., and Schneebeli, M. (2010). Microstructural change around a needle probe to measure thermal conductivity of snow. J. Glaciol. 56, 871–876. doi: 10.3189/002214310794457164
Robertson, P. (2009). Interpretation of cone penetration tests - a unified approach. Can. Geotechn. J. 46, 1337–1355. doi: 10.1139/T09-065
Ruiz, S., Capelli, A., van Herwijnen, A., Schneebeli, M., and Or, D. (2017). Continuum cavity expansion and discrete micromechanical models for inferring macroscopic snow mechanical properties from cone penetration data. Geophys. Res. Lett. 44, 8377–8386. doi: 10.1002/2017GL074063
Ruiz, S., Straub, I., Schymanski, S. J., and Or, D. (2016). Experimental evaluation of earthworm and plant root soil penetration-cavity expansion models using cone penetrometer analogs. Vadose Zone J. 15, 1–14. doi: 10.2136/vzj2015.09.0126
Schmertmann, J. (1978). Guidelines for Cone Penetration Test: Performance and Design. Report FHWA-TS-78-209. Washington, DC: Federal Highway Administration, 146.
Schneebeli, M., and Johnson, J. (1998). A constant-speed penetrometer for high-resolution snow stratigraphy. Ann. Glaciol 26, 107–111. doi: 10.3189/1998AoG26-1-107-111
Schweizer, J., Jamieson, J. B., and Schneebeli, M. (2003). Snow avalanche formation. Rev. Geophys. 41:1016. doi: 10.1029/2002RG000123
Schweizer, J., and Wiesinger, T. (2001). Snow profile interpretation for stability evaluation. Cold Reg. Sci. Technol. 33, 179–188. doi: 10.1016/S0165-232X(01)00036-2
Silva, M., Doreau-Malioche, J., and Combe, G. (2015). “Champs cinématiques dans un sable lors de l'enfoncement d'un pieu par tomographie RX: comparaison des corrélations numérique continue et discrète,” in CFM 2015, 22ème Congrès Français de Mécanique (Lyon).
White, D. J., and Bolton, M. D. (2004). Displacement and strain paths during plane-strain model pile installation in sand. Geotechnique 54, 375–397. doi: 10.1680/geot.2004.54.6.375
Yaniv, Z., Lowekamp, B. C., Johnson, H. J., and Beare, R. (2018). Simpleitk image-analysis notebooks: a collaborative environment for education and reproducible research. J. Digit. Imaging 31, 290–303. doi: 10.1007/s10278-017-0037-8
Yu, H. S., and Carter, J. (2002). Rigorous similarity solutions for cavity expansion in cohesive-frictional soils. Int. J. Geomech. 2, 233–258. doi: 10.1061/(ASCE)1532-3641(2002)2:2(233)
Keywords: snow, cone penetration test, CPT, image correlation, grain tracking, X-ray tomography
Citation: Peinke I, Hagenmuller P, Andò E, Chambon G, Flin F and Roulle J (2020) Experimental Study of Cone Penetration in Snow Using X-Ray Tomography. Front. Earth Sci. 8:63. doi: 10.3389/feart.2020.00063
Received: 20 September 2019; Accepted: 20 February 2020;
Published: 19 March 2020.
Edited by:
Michael Lehning, Federal Institute of Technology in Lausanne, SwitzerlandReviewed by:
Juerg Schweizer, WSL Institute for Snow and Avalanche Research SLF, SwitzerlandCopyright © 2020 Peinke, Hagenmuller, Andò, Chambon, Flin and Roulle. This is an open-access article distributed under the terms of the Creative Commons Attribution License (CC BY). The use, distribution or reproduction in other forums is permitted, provided the original author(s) and the copyright owner(s) are credited and that the original publication in this journal is cited, in accordance with accepted academic practice. No use, distribution or reproduction is permitted which does not comply with these terms.
*Correspondence: Pascal Hagenmuller, cGFzY2FsLmhhZ2VubXVsbGVyQG1ldGVvLmZy
Disclaimer: All claims expressed in this article are solely those of the authors and do not necessarily represent those of their affiliated organizations, or those of the publisher, the editors and the reviewers. Any product that may be evaluated in this article or claim that may be made by its manufacturer is not guaranteed or endorsed by the publisher.
Research integrity at Frontiers
Learn more about the work of our research integrity team to safeguard the quality of each article we publish.