
95% of researchers rate our articles as excellent or good
Learn more about the work of our research integrity team to safeguard the quality of each article we publish.
Find out more
ORIGINAL RESEARCH article
Front. Earth Sci. , 07 February 2020
Sec. Petrology
Volume 8 - 2020 | https://doi.org/10.3389/feart.2020.00018
This article is part of the Research Topic Crystal Archives of Magmatic Processes View all 14 articles
The Holuhraun–Bárdarbunga (Iceland) eruption lasted approximately 6 months. Magma propagated laterally through a 40 km long dyke, while Bárdarbunga caldera was collapsing. This event was intensely monitored, providing an opportunity to investigate the relationships between eruption dynamics and erupted products. Whole rock and melt inclusion data do not show chemical variations of magma during the eruption. Nevertheless, zoning patterns in clinopyroxene suggest temporal variations of intensive parameters during crystallization. We investigated the chemical zoning of clinopyroxene using a data driven approach, on major and trace elements analyses from lava flow lobes emplaced during the eruption. We applied hierarchical clustering (HC) to identify compositional groups based on major and trace element chemistry. This analysis identifies five compositional groups, which can be associated with specific petrographic features. One cluster represents the chemistry of hourglass sectors, two constitute the oscillatory zoned mantle of the crystals, one cluster corresponds to a seldom present bright rim (in back scattered electron images) in the outer portions of the crystals, and a last one represents most of the outer rims. HC applied to trace elements also identifies five compositional clusters, which highlight progressively more evolved clinopyroxene compositions from the core to the rim of the crystals. Two of the clusters identified with trace elements corresponds to major element clusters. All together the data suggest that the chemical zoning in the inner portions of the clinopyroxene crystals was generated by crystallization in the magma reservoir and interaction between hot magma propagating through the dyke and unerupted magma cooling within the dyke. The fraction of zones produced by interaction with colder portion of the magma residing within the dyke dropped during the eruption, potentially signaling the thermal maturation of the dyke. Some of the analyses reveal that relatively close to the eruption time (i.e., the outer portions of the crystals) the dyke intercepted a lens of low temperature magma with a chemical composition that is distinguishable from the 2014 to 2015 Bárdarbunga eruption. Our approach can provide insights on the evolution of deep processes occurring during long-lasting eruptions by combining the analysis mineral chemistry of erupted products with multiparametric monitoring signals.
The 2014–2015 Bárdarbunga–Holuhraun (Iceland) eruption lasted for approximately 6 months and the emission of lava occurred in the Holuhraun region, approximately 40 km NE of the Bárdarbunga volcano (Sigmundsson et al., 2014). Lava outflow was accompanied by progressive collapse of the Bárdarbunga caldera, with a striking correspondence between the rate of caldera volume increase and the volume of erupted magma. This suggests that a reservoir associated with the Bárdarbunga plumbing system was progressively drained during the eruption (Gudmundsson et al., 2016). Earthquake swarms tracked the propagation of a horizontally extended sub-vertical dyke through which the magma moved discontinuously first toward the SE and then to the NE from the Bárdarbunga region to the eruptive fracture (Sigmundsson et al., 2014; Gudmundsson et al., 2016; Woods et al., 2019). This eruption was intensely monitored, which makes it an excellent case study to attempt to relate monitoring signals and the chemistry of the erupted products. Petrologic investigations find that the source of magmas might be heterogeneous, but homogenization processes within the magma reservoir masked both source heterogeneity and any potential evolution of magma chemistry during the eruption (Halldórsson et al., 2018; Hartley et al., 2018).
Several previous studies suggest that magma and melt inclusion composition is broadly constant over the course of the eruption (Browning and Gudmundsson, 2015; Gauthier et al., 2016; Geiger et al., 2016; Ruch et al., 2016; Ilyinskaya et al., 2017; Bali et al., 2018; Halldórsson et al., 2018; Hartley et al., 2018; Woods et al., 2019). We focused our analysis on clinopyroxene (cpx), which are characterized by different patterns of sector and concentric oscillatory zoning. We collected samples of lava flow lobes emplaced during the eruption, except for November 2014, for which we did not manage to reach the lobe formed during this period (Figure 1). We present an approach that combines classic petrography and geochemistry with unsupervised learning [Hierarchical clustering (HC)] to identify how chemical zoning in minerals capture the complexity and evolution of the Bárdarbunga–Holuhraun volcanic eruption.
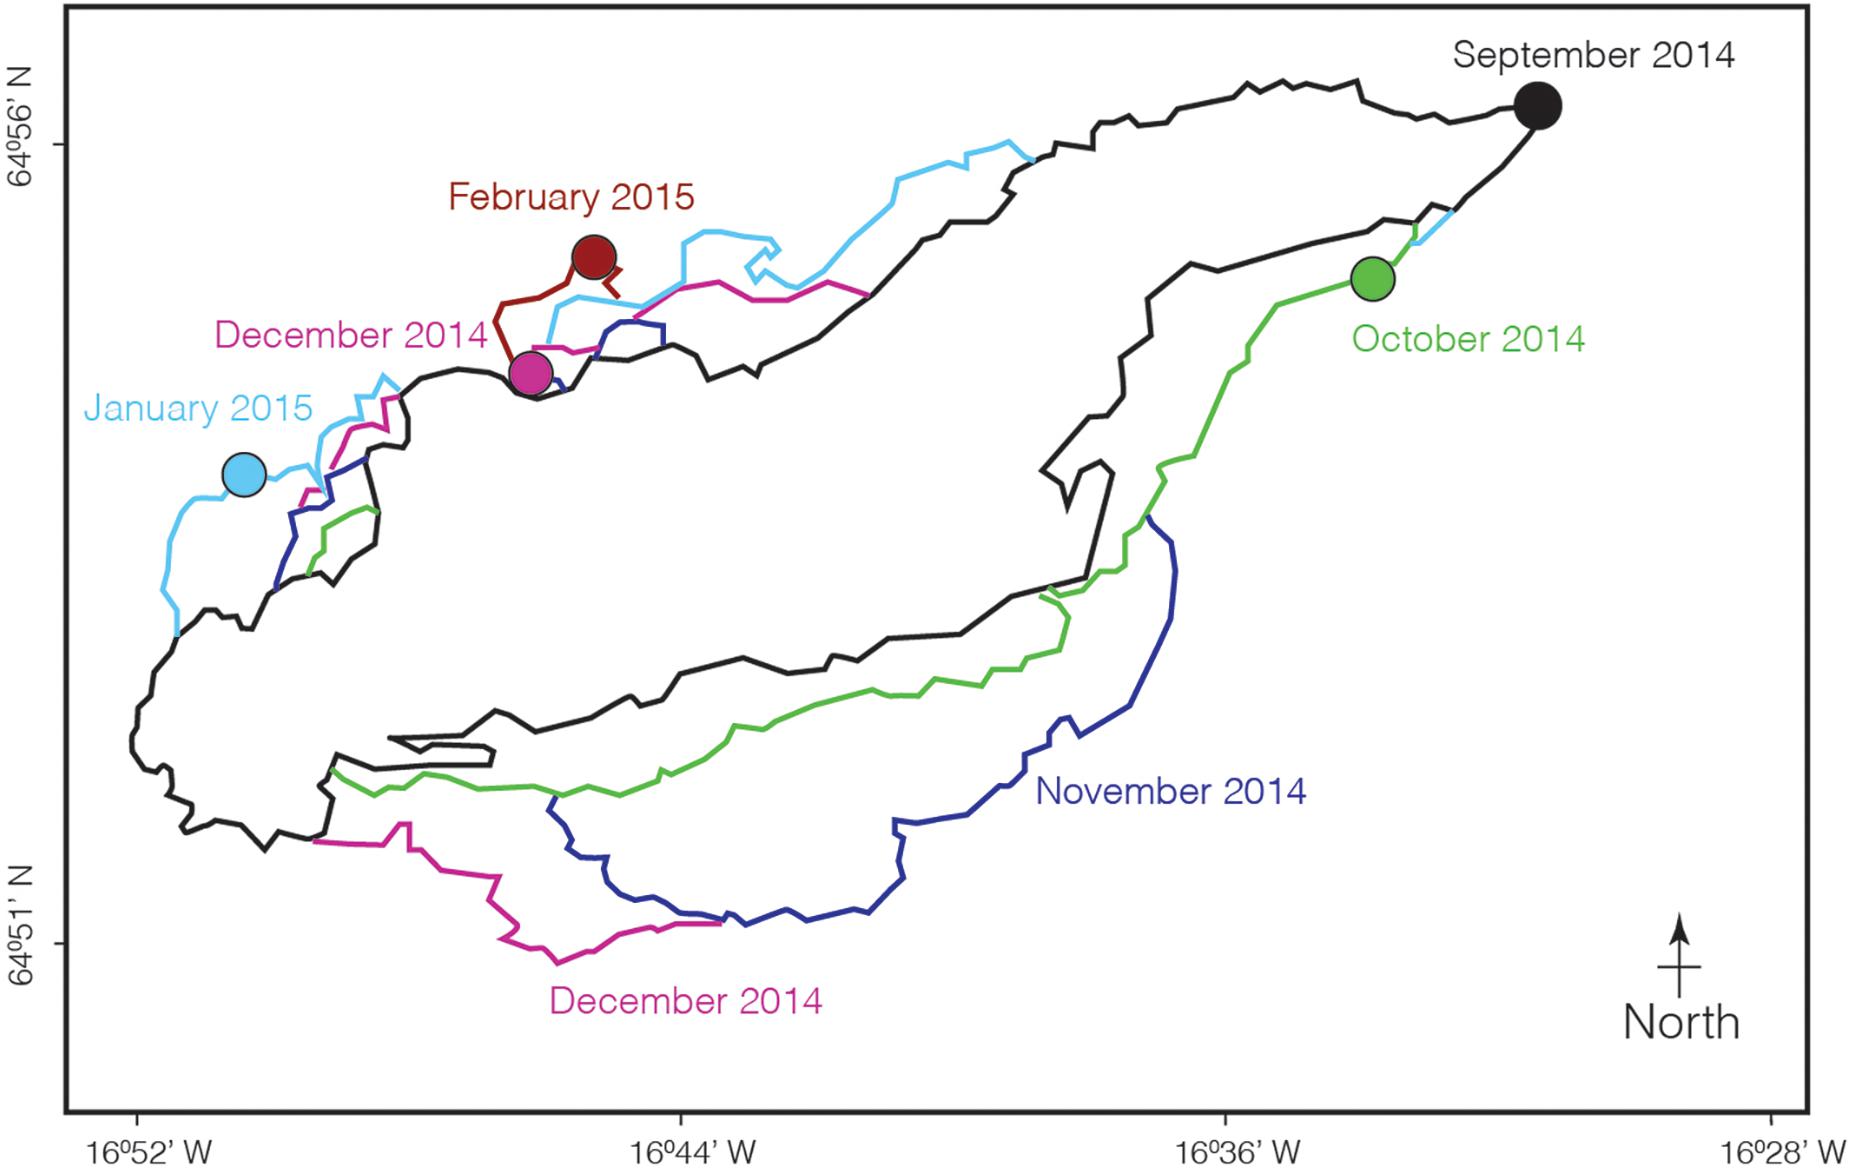
Figure 1. Outlines of the Holuhraun–Bárdarbunga lava flow were drawn on the base of satellite images collected at different times. These images are available on the web-page of the Icelandic Meteorological Office. The circles indicate the sampling locations.
Major element analyses were collected using a JEOL JXA 8200 superprobe at the University of Geneva using 15 keV acceleration voltage, 20 nA beam current and a beam diameter of about 1 micron. Each element was measured acquiring for 30 s on the corresponding wavelength position and 30 s on each of the two background positions located on both sides of the peak. We used forsterite as a standard for Mg and fayalite for Fe, pyrophanite for Mn and Ti, wollastonite for Si and Ca, andradite for Al, Chromium oxide for Cr, and albite for Na. The uncertainty for each element was estimated by measuring the standards as unknowns and accepting only calibrations for each elements for which the ratio between the net counts per second during calibration and measurement was within of ±1%. We additionally performed the peak search for each element every 20 analyses to minimize the impact of any drift during prolonged analytical sessions.
Trace element analyses and high-resolution trace element mapping were performed by laser ablation–inductively coupled plasma–mass spectrometry (LA-ICP-MS) at the Department of Physics and Geology (University of Perugia), utilizing a Teledyne Photon Machine G2 laser ablation system coupled to a Thermo iCAP-Q ICP-MS (Petrelli et al., 2016a, b).
Trace elements analyses were performed on single spots of 25 μm and rasters characterized by widths of 10 μm. Data were collected for Li, Be, P, S, Cl, Sc, Ti, V, Cr, Mn, Co, Ni, Cu, Gd, Rb, Sr, Y, Zr, Nb, Cs, Ba, Hf, Ta, Pb, Th, U, plus Rare Earth Elements (REEs), with a repetition rate and fluence of 8 Hz and 4 J/cm2, respectively. The NIST 610 reference material, Si concentrations determined by EPMA, and USGS BCR2G glass were used as the calibration standard, internal standard, and quality control, respectively. Data Reduction was carried out using the Iolite v.3 software package (Paton et al., 2011). Under the reported analytical conditions, precision and accuracy are typically better than 10% (Petrelli et al., 2016a, b).
Trace elements were imaged following the line rastering technique proposed by Ubide et al. (2015). A spot size of 10 μm, a scan speed of 2 μm/s, a fluence of ∼4 J/cm2 and a repetition rate of 10 Hz were utilized, respectively. When creating crystal maps, the number of analytes was reduced to Sc, Ti, V, Cr, Mn, and Zr to increase the efficiency of the acquisition. Crystal maps and transects were produced using the CellSpace tool (Paul et al., 2012). Finally, compositional zonation relationships were further interpreted using “Images from selections” with Monocle tool (Petrus et al., 2017).
The procedure was performed using the library “cluster” within the freeware software R (R Core Team, 2017). Major element analyses of cpx with totals higher than 98 wt.% (n. 809; but using all 876 analyses did not change the result of the analyses) were first normalized for each element to values between 0 and 1 to give them the same weight and avoid false results. The normalized values were used to calculate the Euclidean distance (dij) between each analytical spot as:
where x to z are all measured elements and i and j are the indexes of all measured points. To identify the clusters of data we use the Ward minimum variance criterion (Ward, 1963), in which pairs of clusters are first identified considering the smallest values of dij and then progressively merged minimizing the within cluster variance after merging. This procedure produces a dendrogram with decreasing number of branches upward. The length of the branches represents the difference in dij required for separated clusters to be merged into one cluster. As the number of clusters is unknown a priori we apply 24 different methods (R package Nbclust; Charrad et al., 2014) that evaluate the potential number of clusters in our dataset and select the number that receive the highest number of votes (five clusters in our case).
The crystals are oscillatory zoned, in most cases show hourglass sector zoning and are generally characterized by an outer rim, which appears relatively bright in Back Scattered Electron images (BSE; Figure 2). Most of the crystals show multiple (2–4) regions of resorption, commonly in either the inner portion of the crystals or immediately before the outer rim (Figure 2a). In a few cases, the outer resorbed rim is also very bright (Figure 2b). Oscillatory zoning is never conspicuous inside the inner resorption zone but, when present, it is continuous through the hourglass sector, which is, in turn, truncated by the outer resorption zone and the outer rim of the crystals. We also observed cpx that partially includes olivine that shows normal zoning and a diffused pattern toward the outer portion of the crystal (Figure 2a). Plagioclase is also included in cpx but is not generally closer to the core than the innermost resorption zone (Figure 2a).
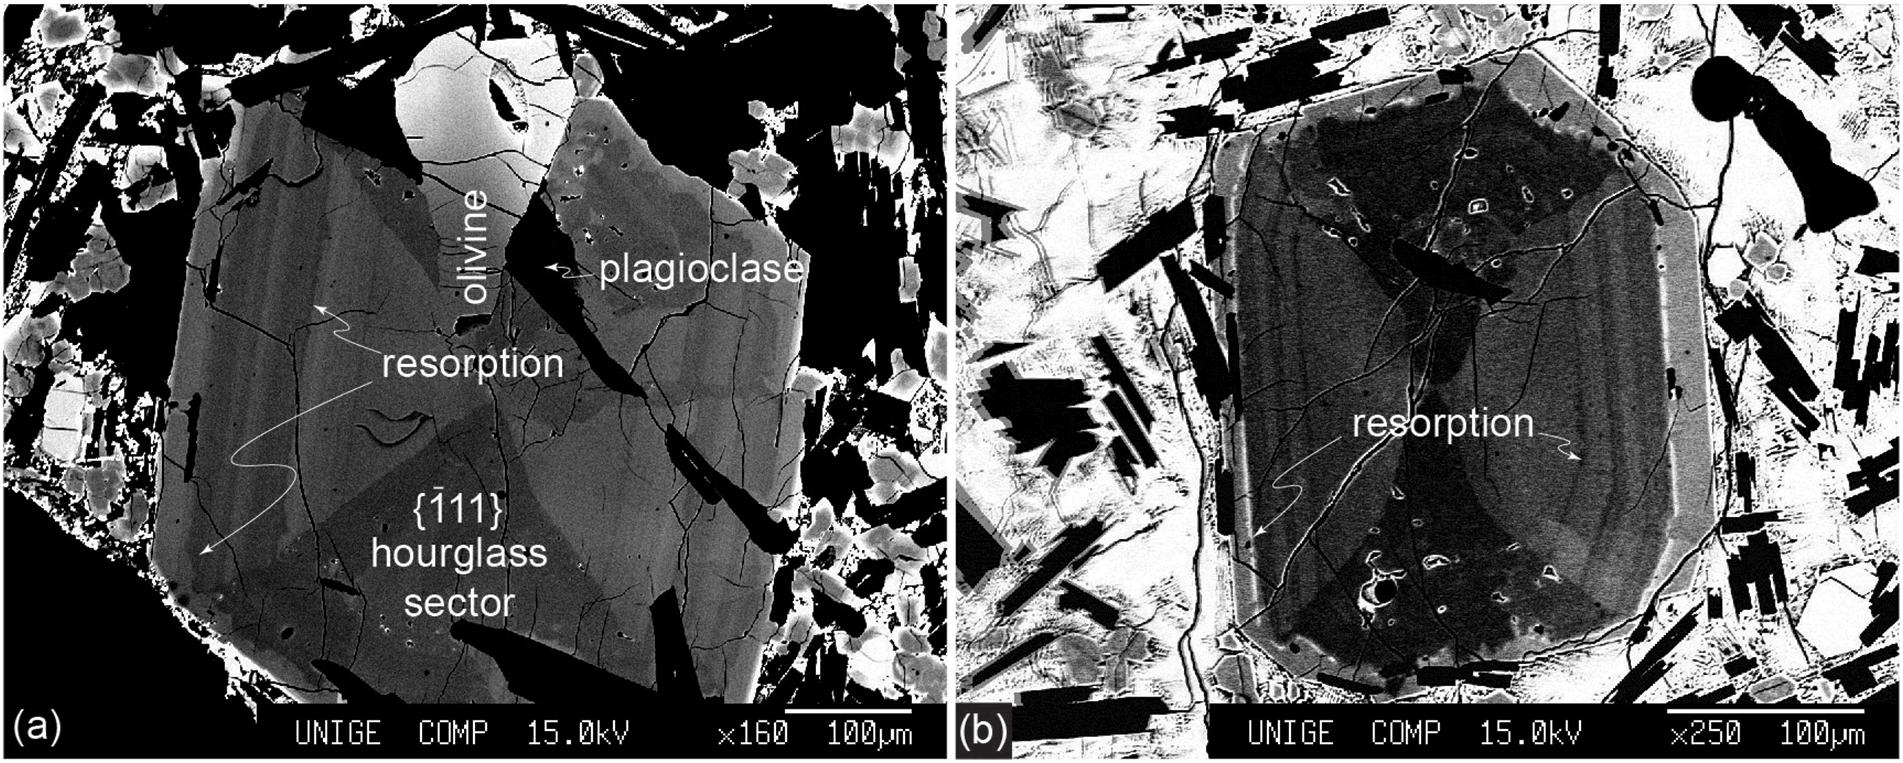
Figure 2. SEM- Backscattered images of two selected clinopyroxenes. Both crystals show hourglass sector zoning, oscillatory zoning (pervasive also through the hourglass zone) and a relatively bright outer rim. (a) The crystals present two main regions of resorption, inclusions of plagioclase and a chemically zoned olivine crystal. (b) This crystal shows an example of a very bright growth region toward the outer portions of the crystal, which we observed in a small proportion of cpx. This rim invariably presents an irregular outer boundary.
Plotting the analyses in Harker diagrams with gray-scale reflecting the month of eruption of the sample, show no chemical trends of the cpx with time (Figure 3), which is consistent with previous observations (Halldórsson et al., 2018). Additionally, the variation of chemistry from the core to the rim of single cpx can span the entire range of chemical variability observed throughout the eruption. A general inspection of these diagrams highlights that no two elements can be used to identify groups of cpx with distinct compositions (Figure 3). In these situations an unsupervised learning approach can be useful (Bergen et al., 2019) to explore more than two chemical dimensions, without any need for an a priori assumption on the mechanisms responsible for the presence of compositional clusters. However, we stress that while this approach always identifies compositional clusters, their validity must be cross-checked with petrography and geochemistry.
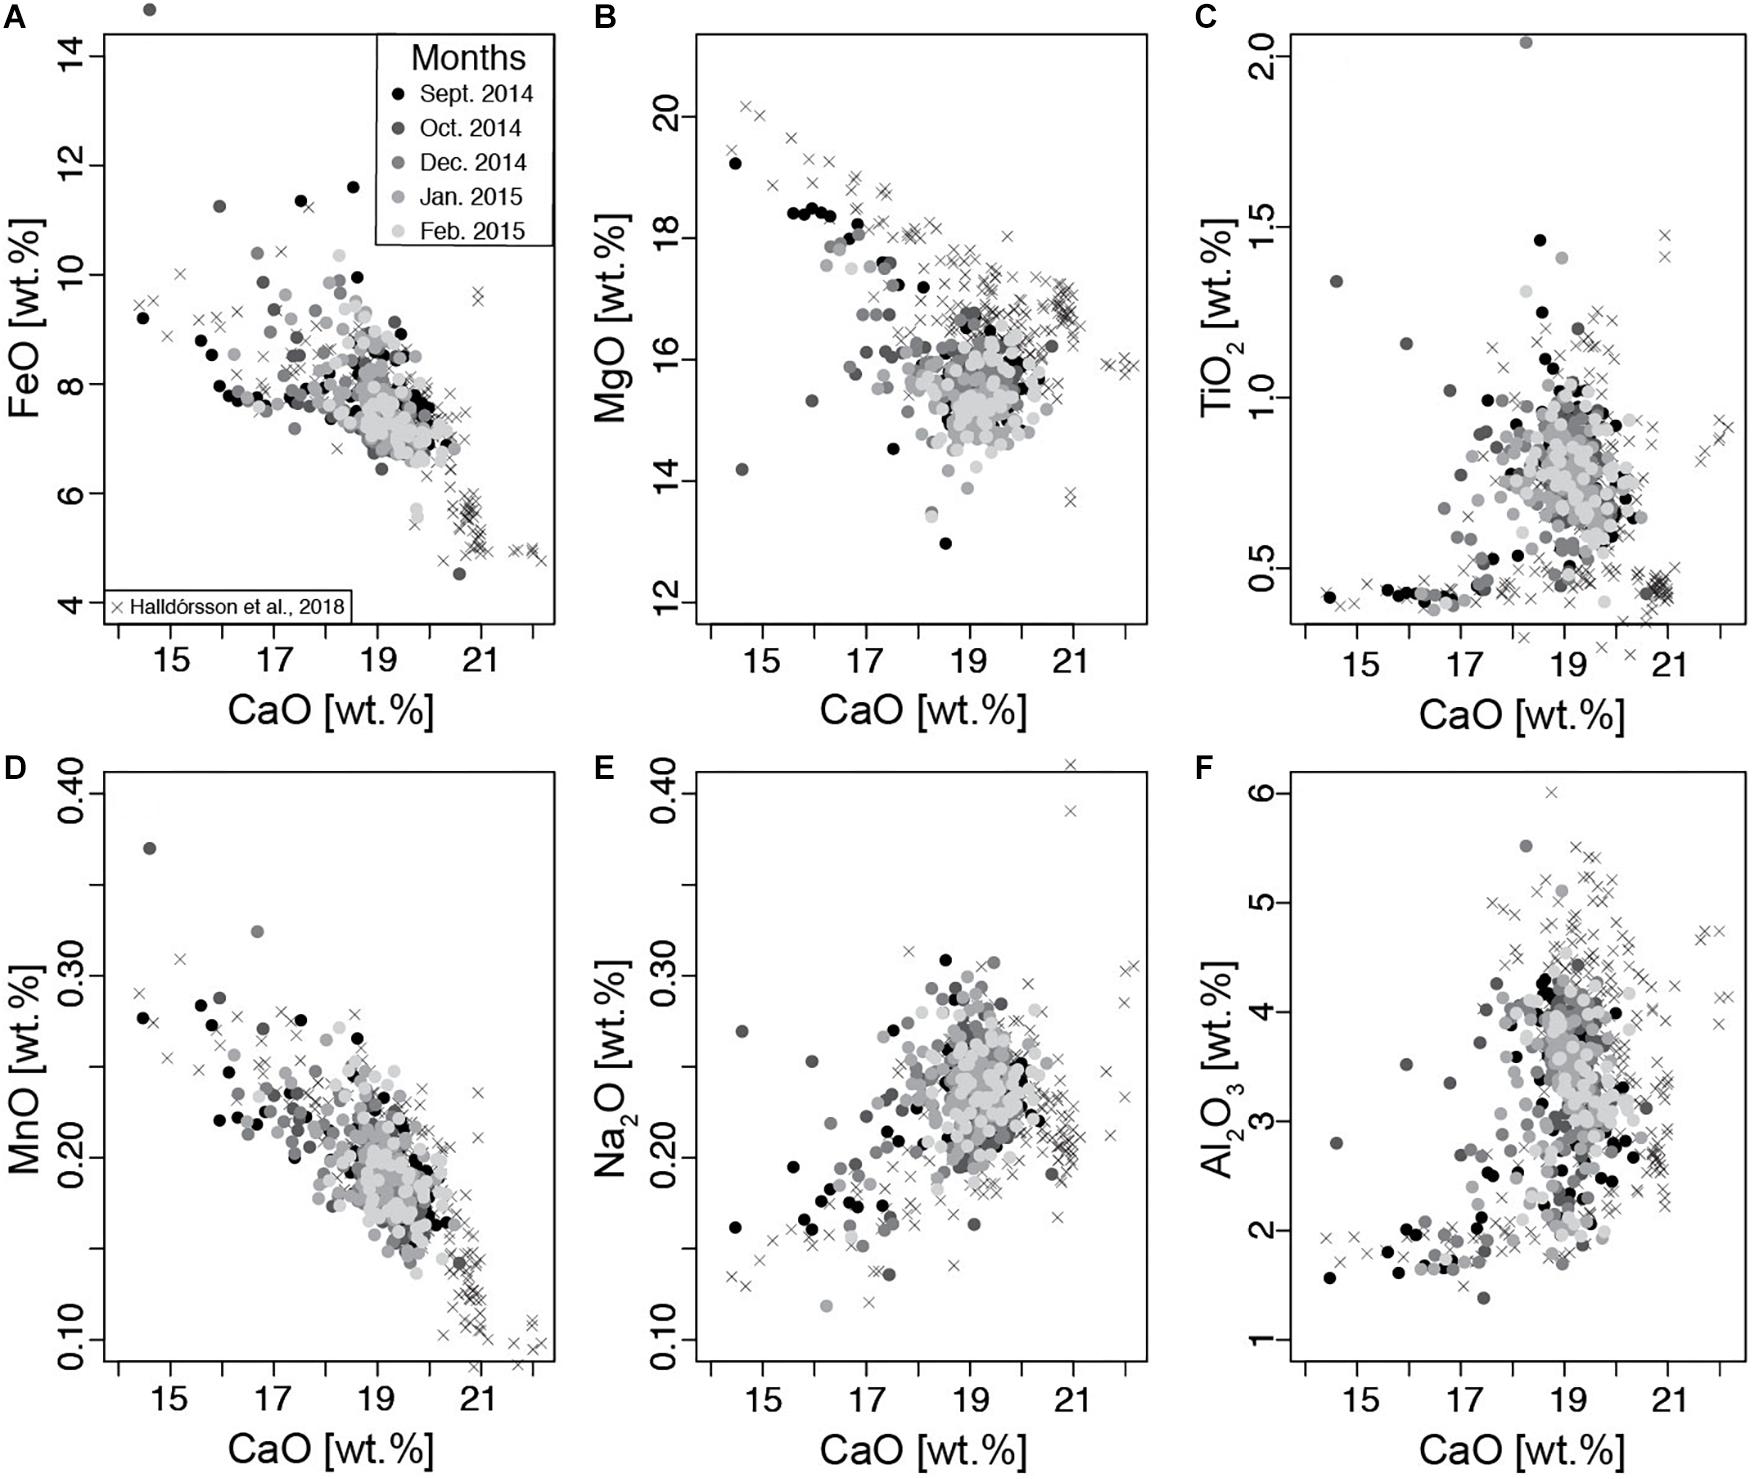
Figure 3. (A–F) Major element clinopyroxene analyses. The gray-scale represents the different periods over which the samples were collected. No obvious relationship is visible between clinopyroxene chemistry and eruption time.
HC was applied to all cpx major element analyses (Supplementary Table 1), with a modal average of 5 clusters present in our dataset (Figure 4A). Considering all elements together, the different clusters are discernible by their chemistry (Figure 5). There is no combination of two elements, however, that could be used to unequivocally distinguish all five clusters, justifying our use of the clustering approach. Considering the dendrogram (Figure 4b), Clusters 1 and 2 are chemically similar, while Cluster 3 and 5 exhibit the largest compositional difference with respect to the other clusters, especially in Al2O3, TiO2, MgO, CaO, and Na2O (Figure 5). Cluster 4 differs from 1 to 2 for its lower Al2O3, CaO, and to a minor extent Na2O content, with higher FeO and MnO (Figure 5).
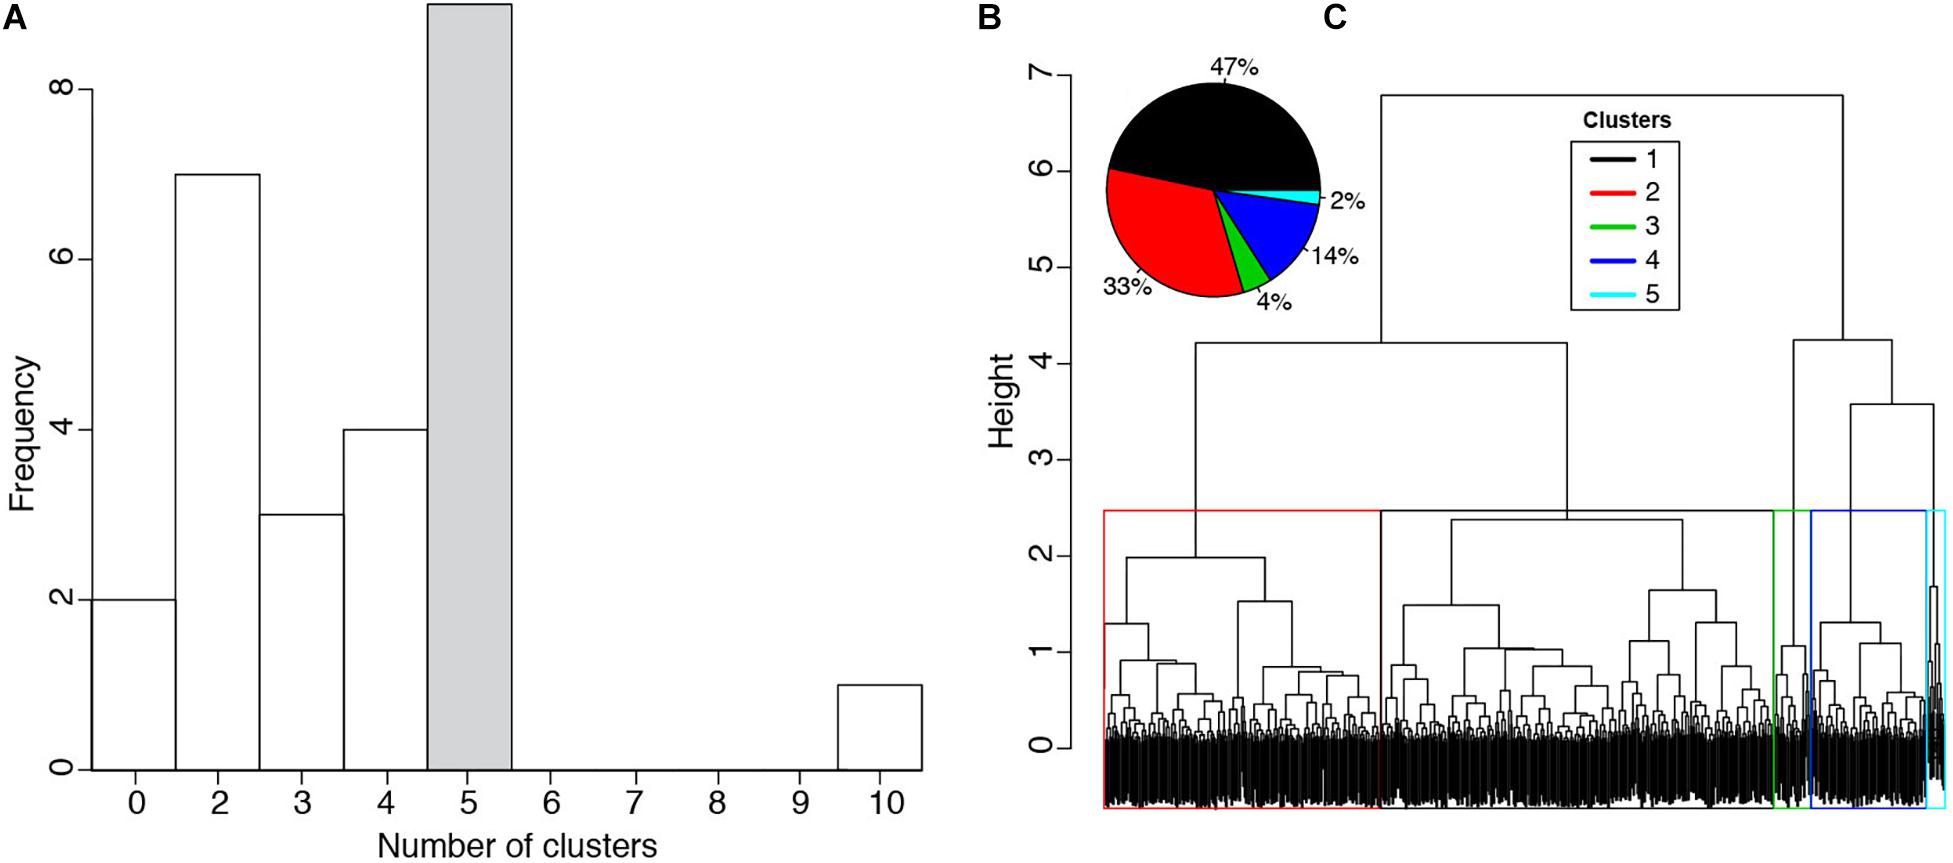
Figure 4. Results of the hierarchical clustering analysis. (A) Frequency of clusters identified considering a total of 24 methods to estimate the number of clusters present in our cpx dataset. The majority of methods indicate that our dataset contains 5 compositional clusters. (B) Dendrogram obtained considering the Euclidean distance and the Ward method (Ward, 1963). The color boxes show the group of analyses associated with the respective cluster. The height represents the compositional difference required to merge clusters. The clusters are arranged horizontally so that the most different are at the two extremes of the dendrogram. (C) Pie chart showing the percentage of each of the five identified clusters.
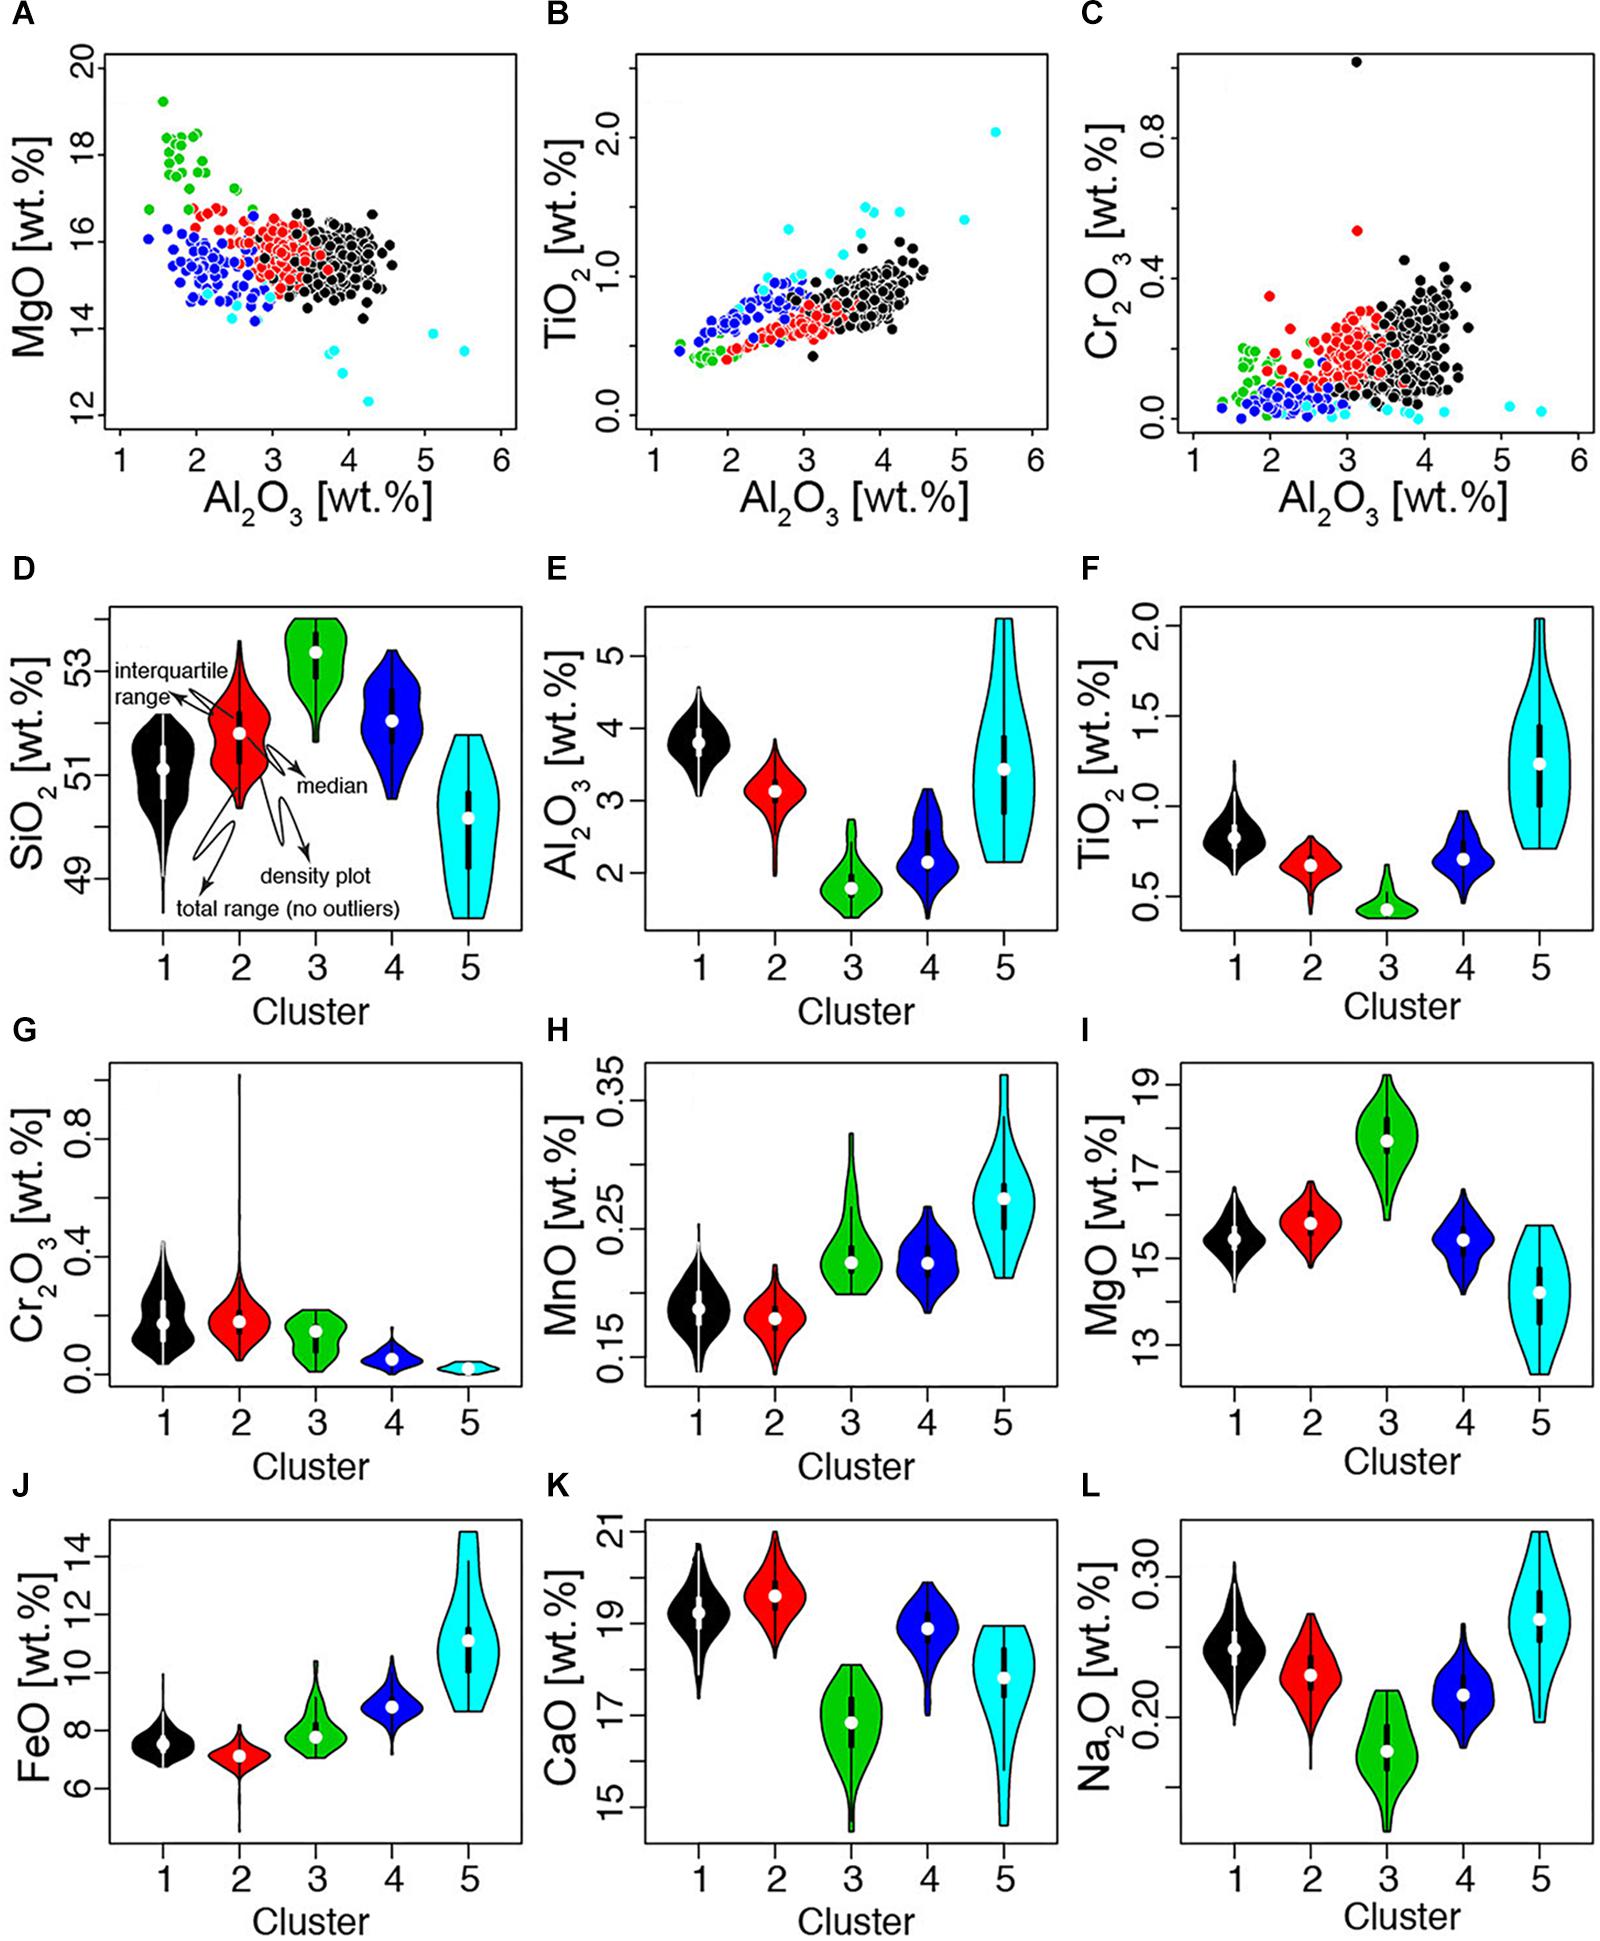
Figure 5. (A–C) Harker diagrams of all analyses with color coding corresponding to the cluster assigned by HC. (D–L) Violin plots showing the density distribution of each oxide of each cluster of cpx chemistry. The violin plot show the density, and other descriptive characteristics of the distribution of each element for each of the compositional clusters.
While no particular temporal trends were observed in cpx chemistry (Figure 3), the compositional clusters occupy specific textural positions, which indicate that most pyroxenes grew following the same sequence of events. Cluster 3 corresponds to the composition of the {−111} hourglass sector of the cpx crystals, which is visible in the majority of crystals (Figures 6a,b,g). Analyses collected in the innermost portions of the cpx crystals belong either to Cluster 3 (dark in BSE and representing portions of the {−111} hourglass sector) or to Cluster 1. Cluster 2 is generally observed in the vicinity of a partly resorbed rim (Figures 6a,c–f). The oscillatory-zoned mantle of the crystals is constituted by an alternation of Cluster 1 and 2. Cluster 4 generally includes analyses of the outer rims of the cpx, although in January and February 2015 it also appears in more internal portions of the crystals (Figure 6g). To test if the appearance of Cluster 4 in the inner portions of crystals was associated with cluster mis-assignment we checked the composition of the analyses closest to the core assigned to Cluster 4 and find that these composition are indeed typical of Cluster 4 as they occupy the mean compositions of Cluster 4 for all elements. Cluster 5 represents only 2% of the analyses (Figure 4c) and corresponds exclusively to the bright and partially resorbed zone just before the outer rims of the cpx. The large chemical variance of this cluster (Figure 5), reflects a thickness for these zones that is at the limit or smaller than the EPMA spatial resolution. Therefore these analyses are of the lowest quality and at least some of the analyses represent mixtures of Cluster 5 composition and the chemistry of the neighboring zones.
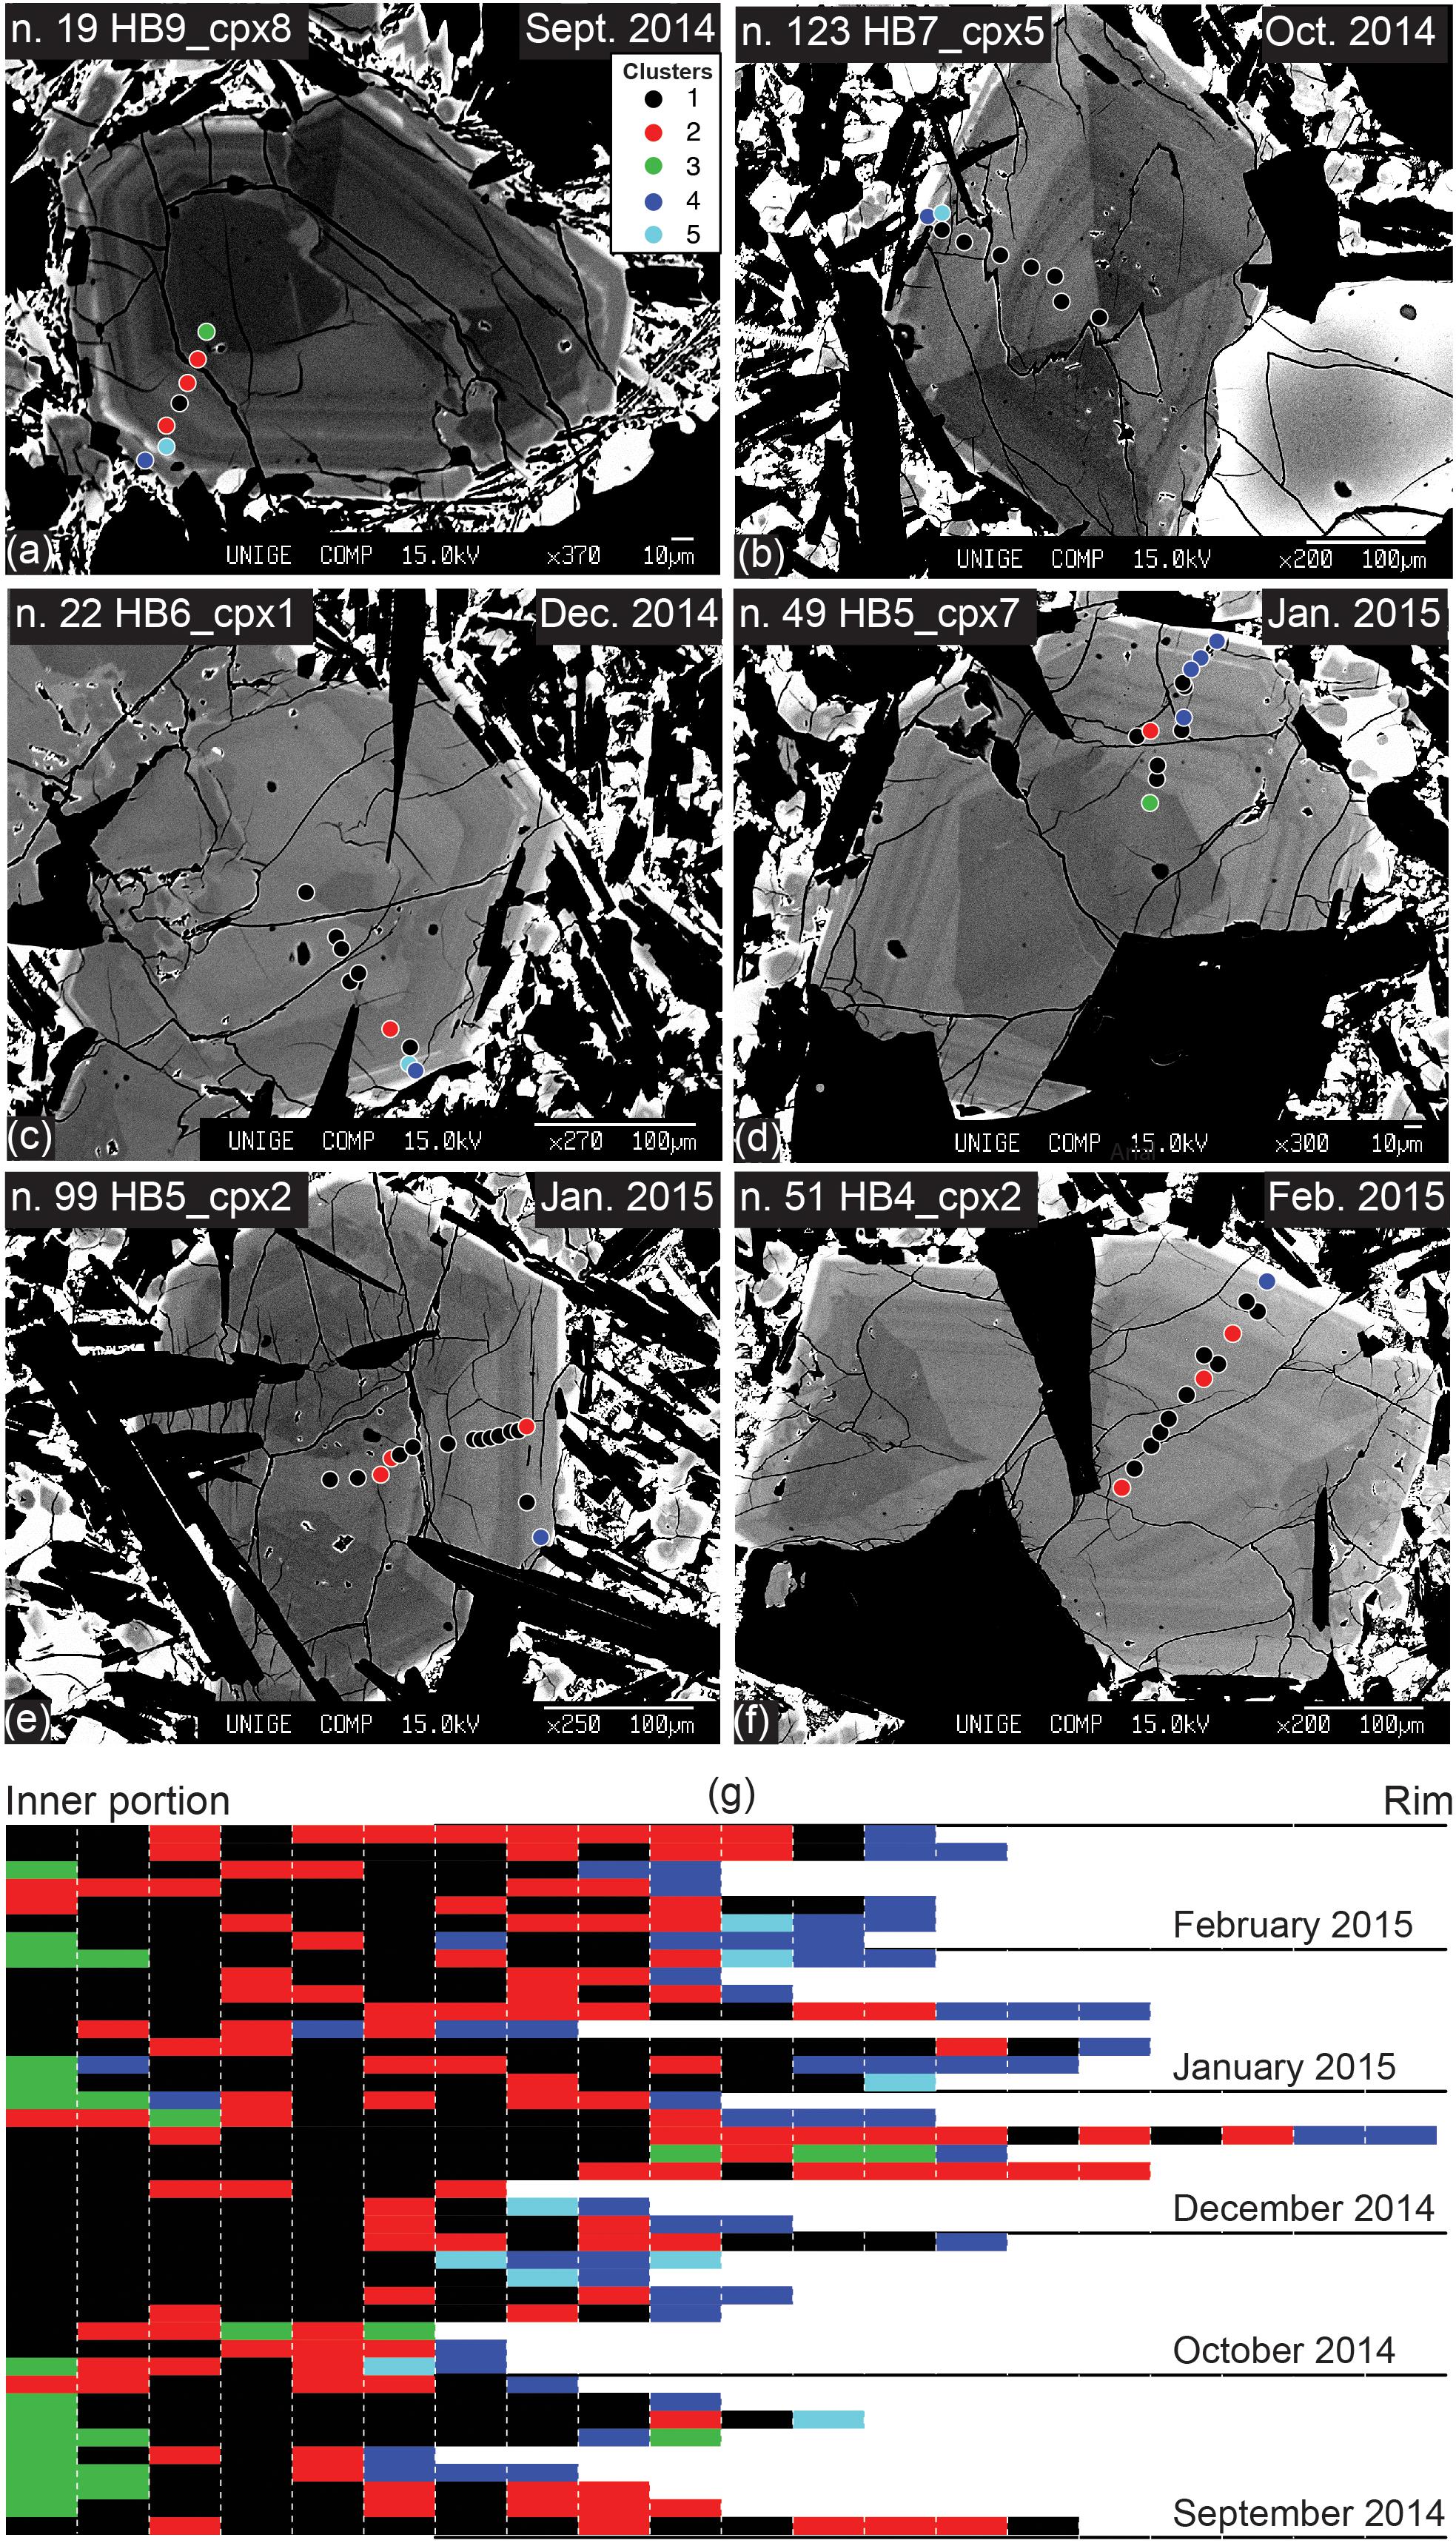
Figure 6. SEM Backscattered images of selected clinopyroxene crystals with location of major and trace element analyses. (a–f) The circles show the location of the EPMA spots with a color corresponding to the associated cluster assignment. (g) Each of the horizontal segments represent a spot and the color refers to the cluster to which each spot was assigned by HC.
The same approach we used for major elements was applied to analyses (no. 128) of selected trace elements present in sufficiently high concentration in cpx (Sc, Ti, V, Cr, Mn, Co, Ni). Including elements in low concentrations only adds noise to the data and complicates the clustering results (Supplementary Table 2). The number of clusters that received the highest amount of votes with the different tests are 2 and 5 (Figure 7k). Harker diagrams of the dataset suggest a better visual partitioning in five clusters with respect to two clusters (Figures 7f–j). The comparison between the textural positions of the clusters identified using major and trace elements (we identify the clusters identified by trace element adding “TE” after the cluster number) reveals some correspondence between the two. As Cluster 3, also Cluster 3TE corresponds to the compositions of the {−111} hourglass sector (Figures 7b,c). Cluster 5TE is identified in the outer portions of the crystals, which corresponds to the textural location of Cluster 4. Cluster 2TE, 4TE, and 1TE, constitute cores and mantles of the crystals and occupy progressively more external positions within the crystals (Figures 7a–e).
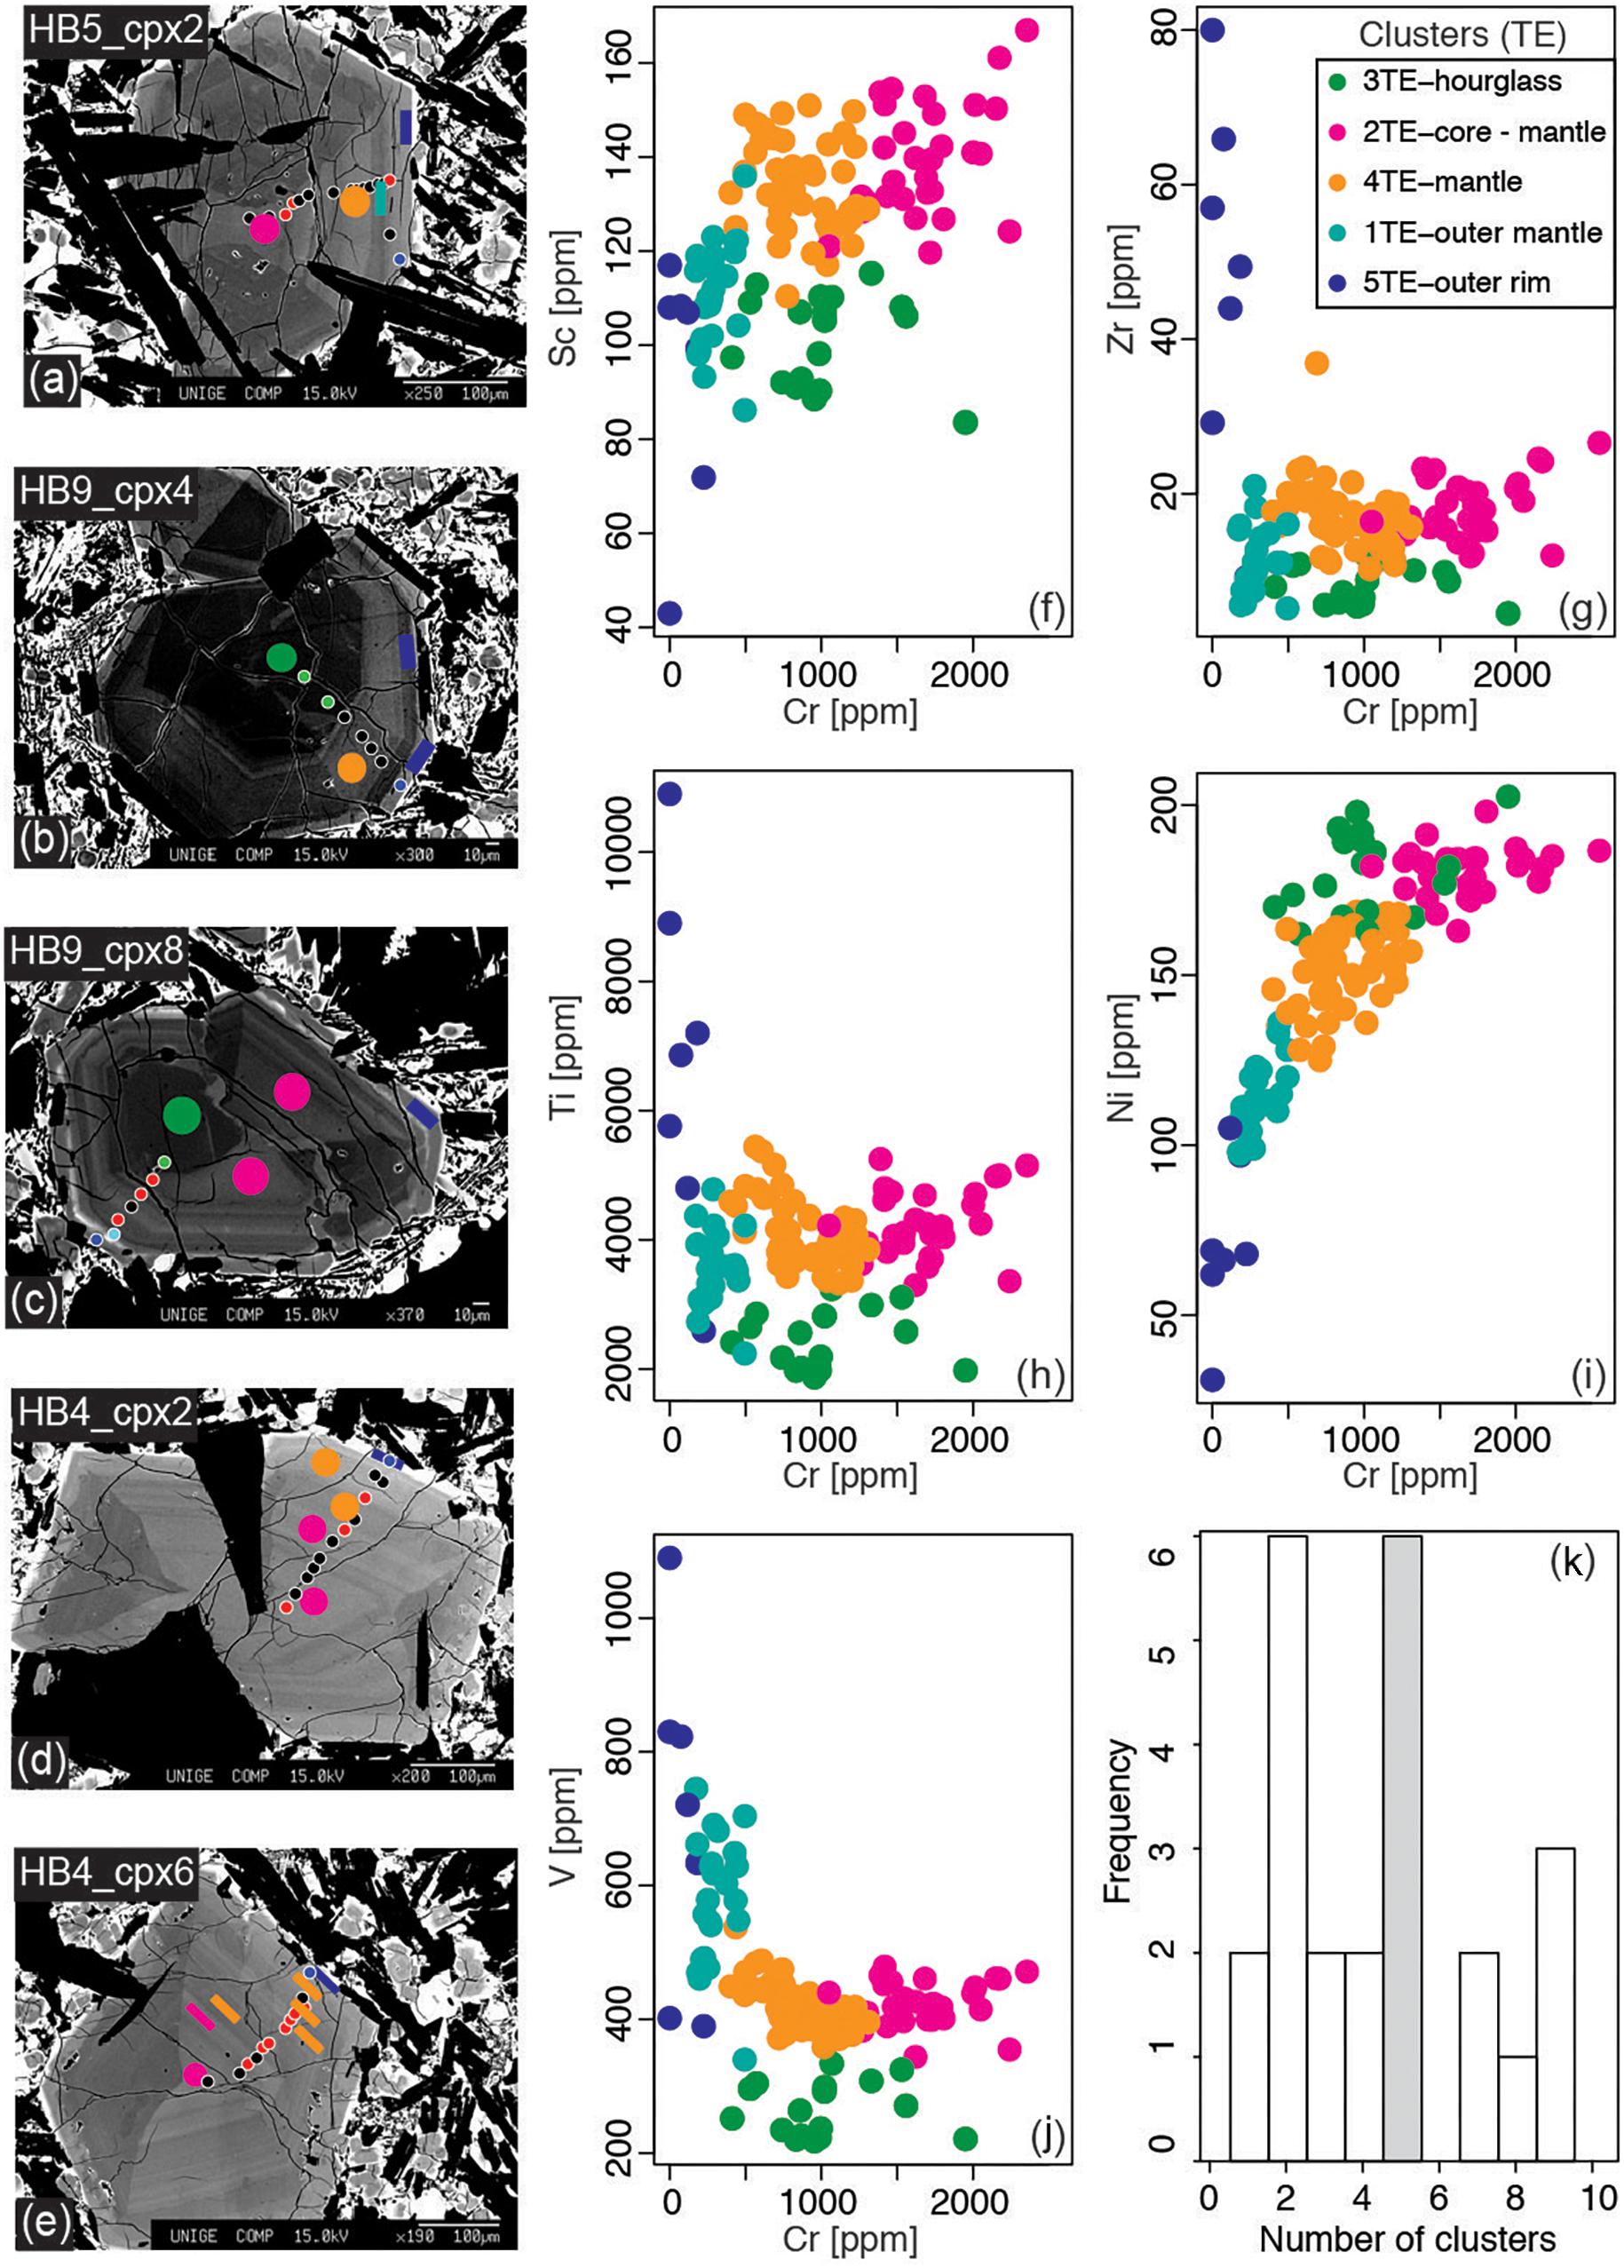
Figure 7. Trace element analyses. (a–e) SEM Back scattered images of some of the cpx crystals selected for trace element analyses. Circles and rectangles provide the location of the spot and their color corresponds to the cluster assigned based on trace element content. Smaller circles are colored according to the cluster assigned applying HC to major elements. (f–j) Harker diagrams for all collected spot analyses with colors corresponding to the clusters assigned on the base of trace elements. (k) Histogram showing the result of the number of clusters determined using 24 different metrics. The gray shading highlights the selected number of clusters.
The application of HC to the major element chemical analyses of cpx of the 2014–2015 Holuhraun–Bárdarbunga eruption allowed the identification of five compositional clusters and their relative position within the crystals. Cluster 1 and 2 constitute most of the inner portions and mantles of the crystals, respectively; Cluster 5 represents a sparsely present bright (in BSE) outer portion of the cpx; the outer rims are part of Cluster 4, and analyses belonging to Cluster 3 are from the {−111} hourglass sectors (Figure 6). In the following we discuss the processes that could be responsible for the chemical variability observed in the cpx crystals and discuss potential relationships between mineral chemistry and the dynamics of magma migration during the eruption.
The cpx crystals we analyzed have core to rim distances between 250 and 500 μm, which, considering experimental growth rates under kinetically controlled growth at temperature typical for basaltic magmas of 5 × 10⁻¹⁰ to 1.5 × 10⁻⁹ m/s (Mollo et al., 2013), imply that they grew over a period of 2–9 days. Using liquid-cpx thermobarometry (Putirka, 2008; Neave and Putirka, 2017) we calculated cpx crystallization pressures to estimate the structure of the plumbing system. We first selected only cpx crystals that were in equilibrium with the melt, following the procedure described in Neave et al. (2019). Considering the aphyric nature of the erupted magmas (Halldórsson et al., 2018) we use whole rock chemistry with H2O content of 0.4wt.% (based on Bali et al., 2018) as an equivalent for the melt in equilibrium with the cpx crystals. Analyses in Clusters 1, 2, 4 passed the equilibrium test while no analyses from Cluster 5 were found to be in equilibrium, and only two analyses from the {−111} hourglass sector (i.e., Cluster 3) passed the equilibrium screening (Figure 8).
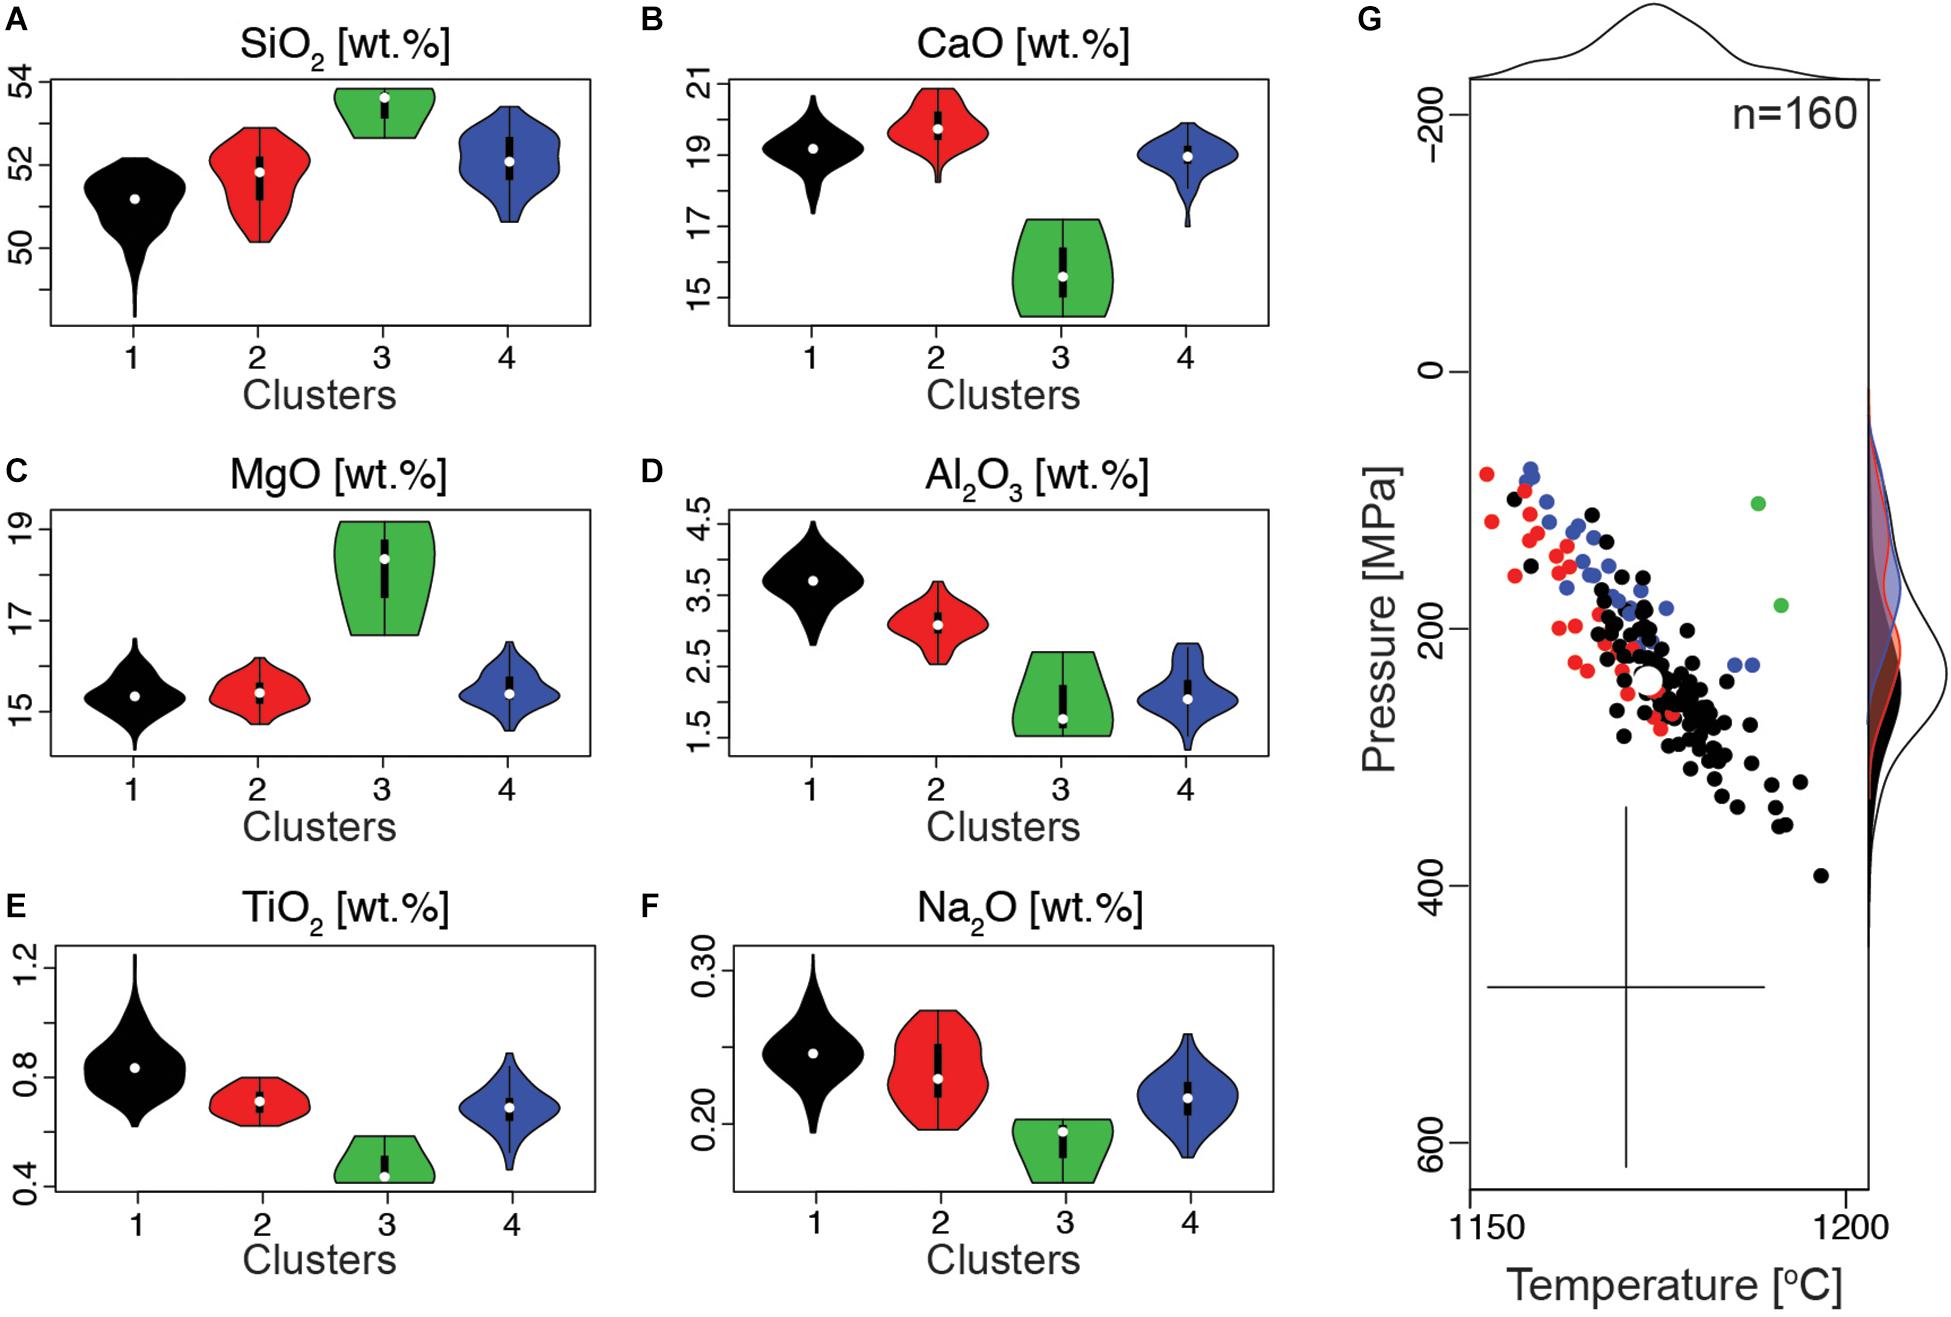
Figure 8. Chemistry of cpx crystals and resulting thermo-barometry calculations. (A–F) Violin plots showing the density distribution of each of the oxides for all cpx analyses with color scheme as in Figure 4. (G) Pressure and temperature for each analysis were calculated using the geobarometer of Neave and Putirka (2017) together with the thermometer (Eq. 33) of Putirka (2008). The white circle provides the average value of pressure and temperature obtained with this approach. The density plots on the side of the diagram show the distribution of pressure and temperature calculations. The cross indicate the error/uncertainty of estimations.
Similarly to previous determinations, the pressure estimates vary between about 100 and 400 MPa with the highest density of estimates around 200 MPa (Neave et al., 2019; Figure 8). The calculated storage pressure progressively decreases from Cluster 1, to 2 and 4, suggesting concurrent magma rise and crystallization. However, as these variations are within the uncertainty of the geobarometer we do not discuss further their bearing on the pre-eruptive crystallization depth (Figure 8G). Nevertheless, the distribution of pressures obtained with cpx-liquid barometry indicate that over the 2–9 days before eruption, magma crystallized mainly at pressures around 200 MPa (i.e., 5–6 km depth), which is close to the depth range over which magma within the dyke has been interpreted to be transported laterally to the to the eruption site (Woods et al., 2019).
Prior to using cpx chemistry to retrieve the conditions of magma storage or the dynamics of magma migration to the surface, it is important to understand whether the chemical variations we have identified are due to variations in pressure (e.g., Nimis, 1995; Nimis and Ulmer, 1998), temperature (e.g., Lindsley, 1983), melt chemistry (e.g., Neave and Putirka, 2017), or growth kinetics (Iezzi et al., 2011; Lanzafame et al., 2013; Mollo et al., 2013, 2012, 2011; Ubide et al., 2019). Additionally, experiments show that cpx zoning resulting from kinetic effects can be produced even under nominally equilibrium conditions (Neave et al., 2019), and crystal can grow rapidly generating skeletal/dendritic structures, which are subsequently filled during growth at lower rate (Hammer et al., 2016; Welsch et al., 2016). All these effects should be taken in consideration before using cpx chemistry to identify storage conditions or processes occurring in the volcanic plumbing system.
The chemical composition of Cluster 3 is in agreement with previously measured cpx {−111} hourglass sectors (Ubide et al., 2019; Figure 6). Cluster 5 and 1 shows enrichment of Al, Ti and depletion of Na and lower Si, Ca, Mg (more extreme for Cluster 5) with respect to Cluster 2 (Figure 5). The chemistry of Cluster 1 and 5, could reflect either growth from magmas of different compositions, or as shown experimentally, be the consequence of more rapid crystal growth at relatively high undercooling with respect to Cluster 2 (Mollo et al., 2013). To test these two hypotheses, we selected cpx crystals with the highest textural complexity and with chemical composition covering all clusters identified with major elements.
Trace element profiles consistently show that Cr decreases from core to rim in a stepwise manner while Zr, Sc, V, Ti, covary (Figures 9d,e; we report only Cr, Zr and Sc in the figure for clarity). The profiles show that Cluster 1 is generally characterized by higher concentrations of Zr and Sc and moderate to no decrease of Cr with respect to Cluster 2 (Figures 9d,e). Zr is incompatible in a bulk crystallizing assembly constituted by olivine, cpx and plagioclase, as is Sc, at least until the relative fraction of cpx in the crystallizing assembly does not reach about 50 wt.% and the bulk partition coefficient becomes larger than 1; partition coefficients from Earthref.org). As Cr is compatible in the crystallizing assemblage, with crystallization the concentrations of Zr and Sc in the residual melt phase (and therefore in the cpx) increases while Cr should decrease. Zr and Cr are inversely correlated in some portions of the profile, as it would be expected if the growth of the cpx zones occurred from magmas at different degrees of crystallinity, while they covary in other regions (Figures 9d,e), as it would be expected if the crystal growth occurred at increasing cooling rates (or undercooling; Mollo et al., 2013). No clear relationship is observable between the clusters identified by major element chemistry and the Cr-Zr variations (Figures 9d,e), nor between Cr-Zr and the trace element clusters (Figure 10). This implies that while variations of undercooling were occurring during crystal growth, they were not the only processes modulating the major element composition of the cpx. Therefore, Cluster 1 zones either (1) crystallized from a magma of similar initial composition but slightly more evolved and potentially cooler than Cluster 2, or (2) these two clusters were formed from magmas with distinct chemistry. Regarding the lack of relationships between Zr-Cr and the trace element clusters, this suggest that the ratio between these two elements is not the most significant factor controlling the trace element clusters. To test if any evidence exist of the interaction between magmas of distinct chemistry, we performed HC on the trace element profile dataset (Supplementary Tables 3–5) and include the LA-ICP-MS spots (Figure 10; clusters recognized on the base of trace element chemistry are identified by TE). Including all data, the result is similar to that obtained considering only the trace element spots data, however, the few analyses associated with Cluster 5TE are not identified as a separated cluster when including all data. Cluster 1 and 2 correspond to Cluster 4TE and Cluster 2TE, respectively and their trace element chemistry suggest that Cluster 1 cpx could crystallized at lower temperature (i.e., in a more fractionated magma) with respect to cpx from Cluster 2.
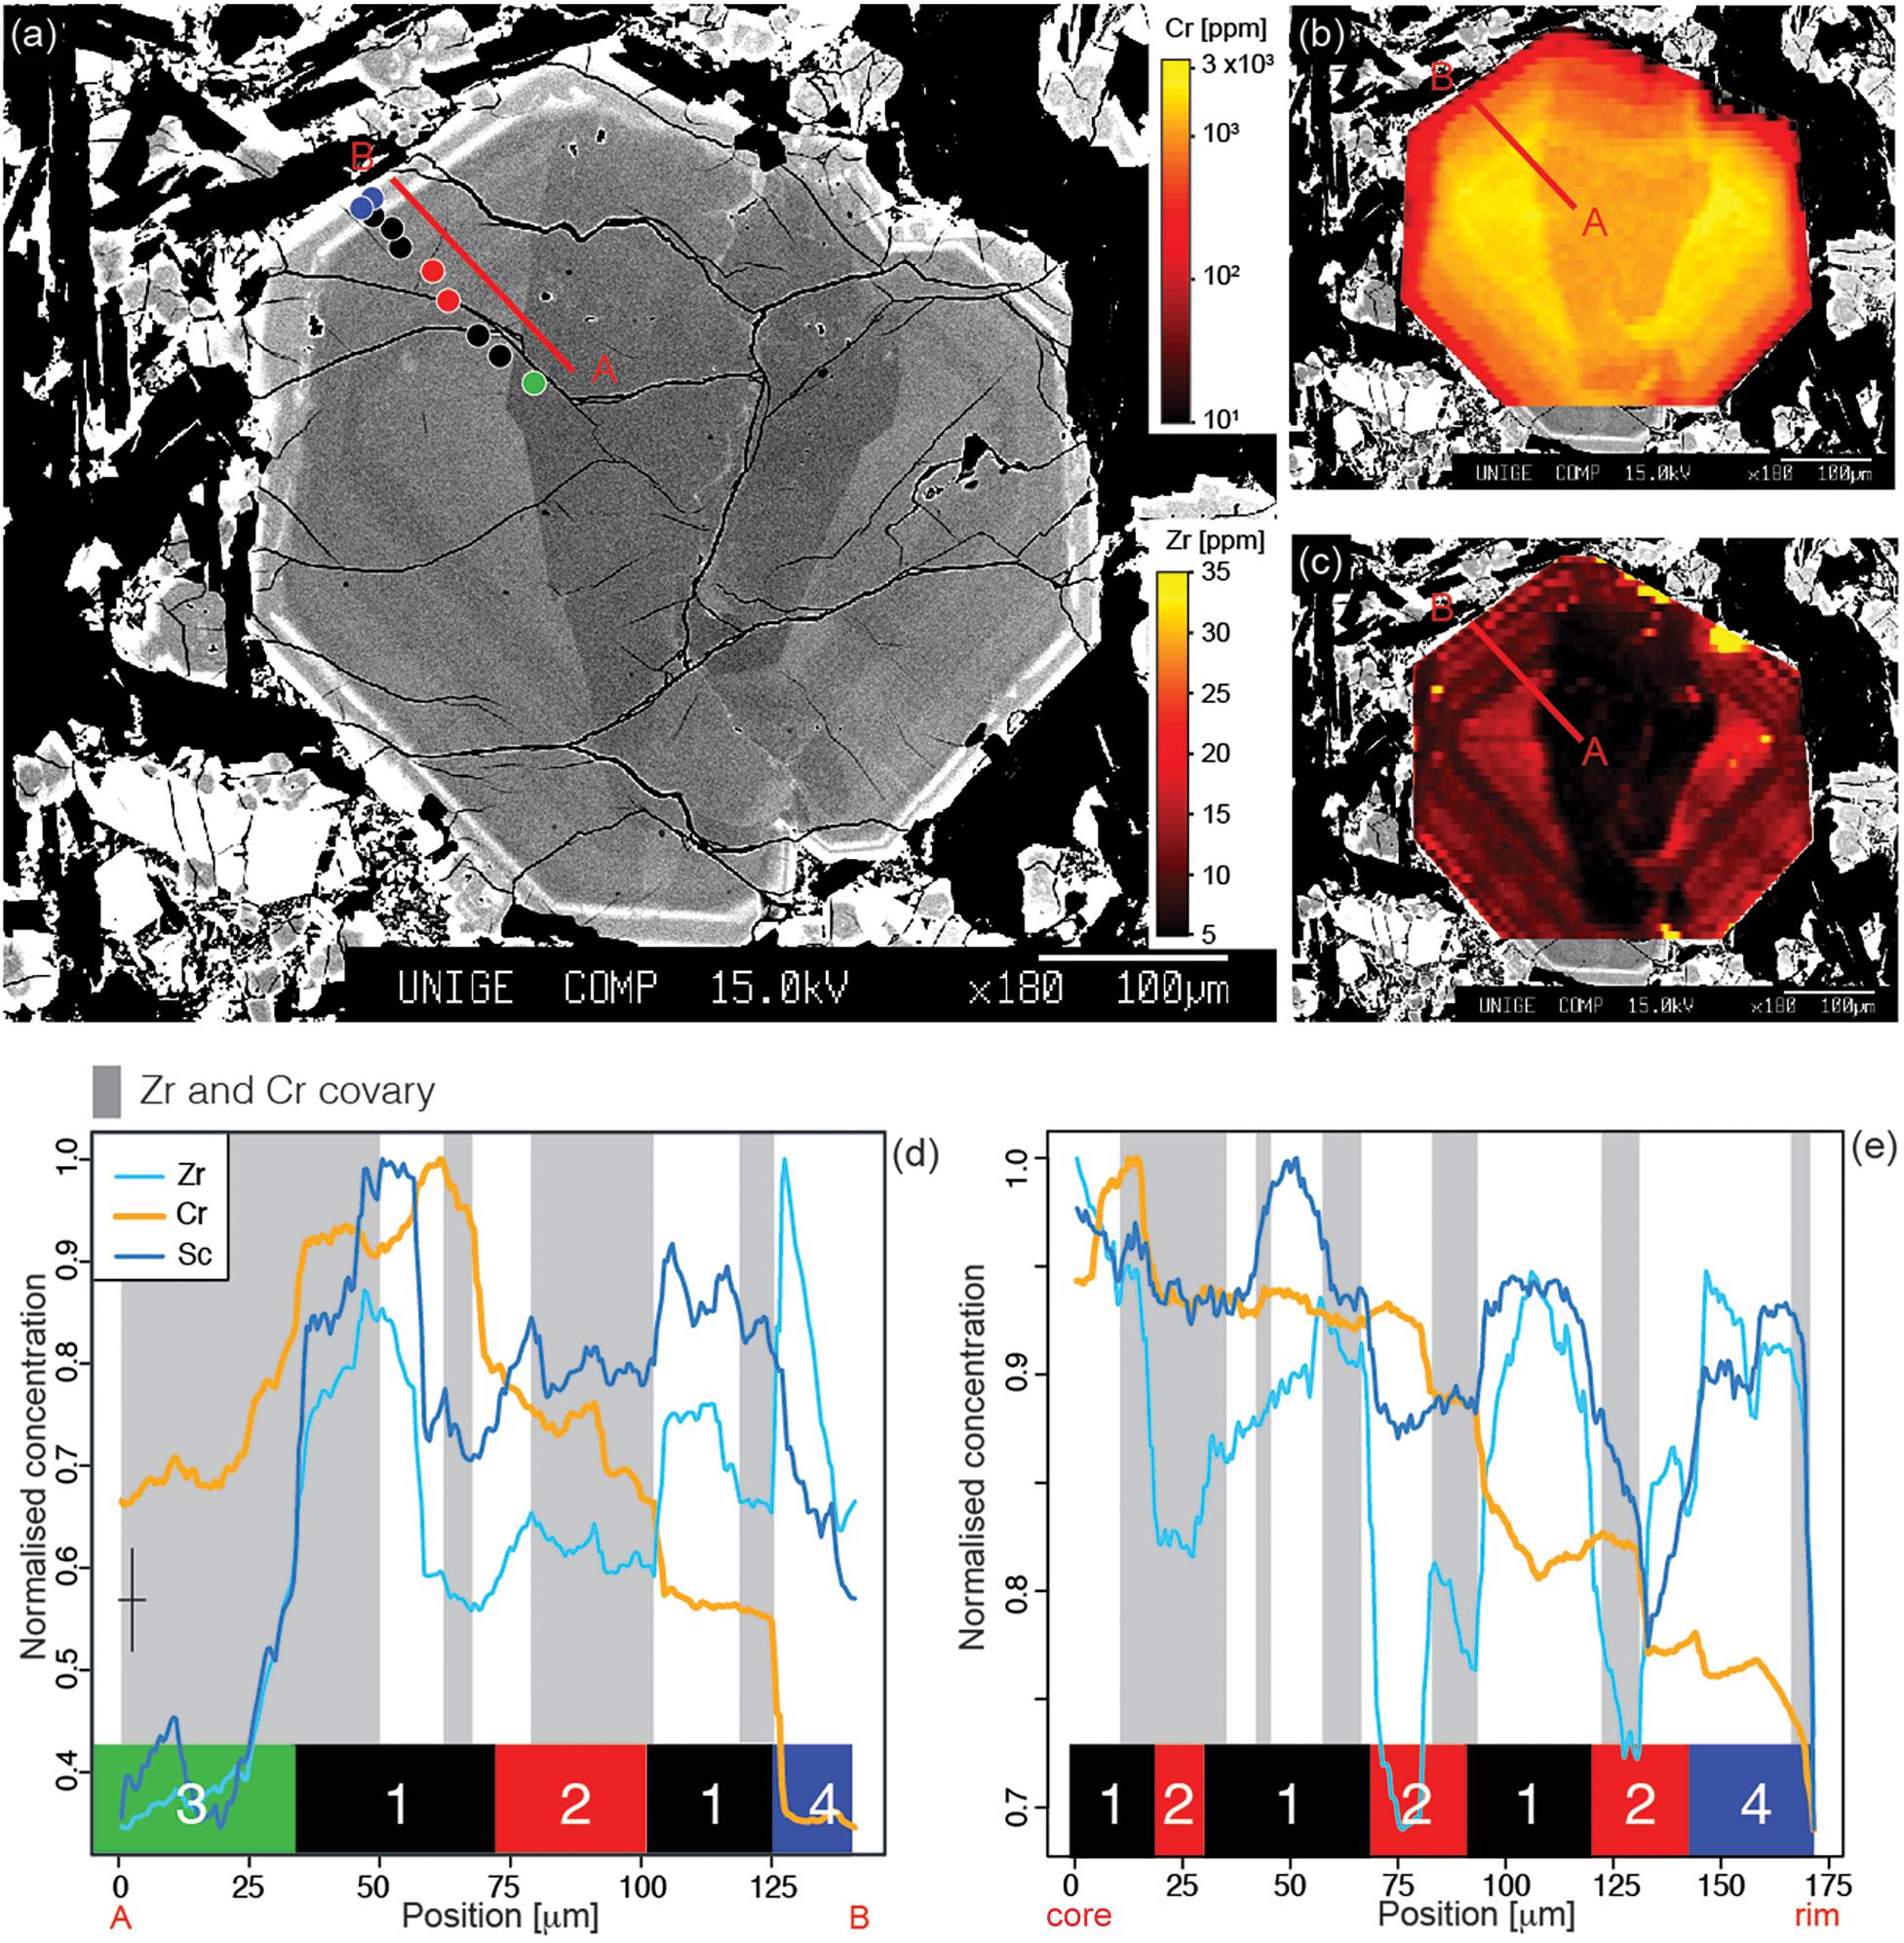
Figure 9. Trace element mapping. (a) BSE image showing the location of the transect over which the trace element content was calculated starting from the elemental maps. The circles indicate the location of the electron microprobe analyses and the color indicates the corresponding cluster identified from major element analyses. (b,c) Maps of Cr and Zr for the crystal in panel (a). (d) Concentrations of Zr, Cr, and Sc normalized to the maximum and minimum values measured in all profiles, for the crystal shown in panels (a–c). The colors (and numbers) indicate the corresponding cluster identified with major elements. Panel (e) same as panel (d) but for another crystal.
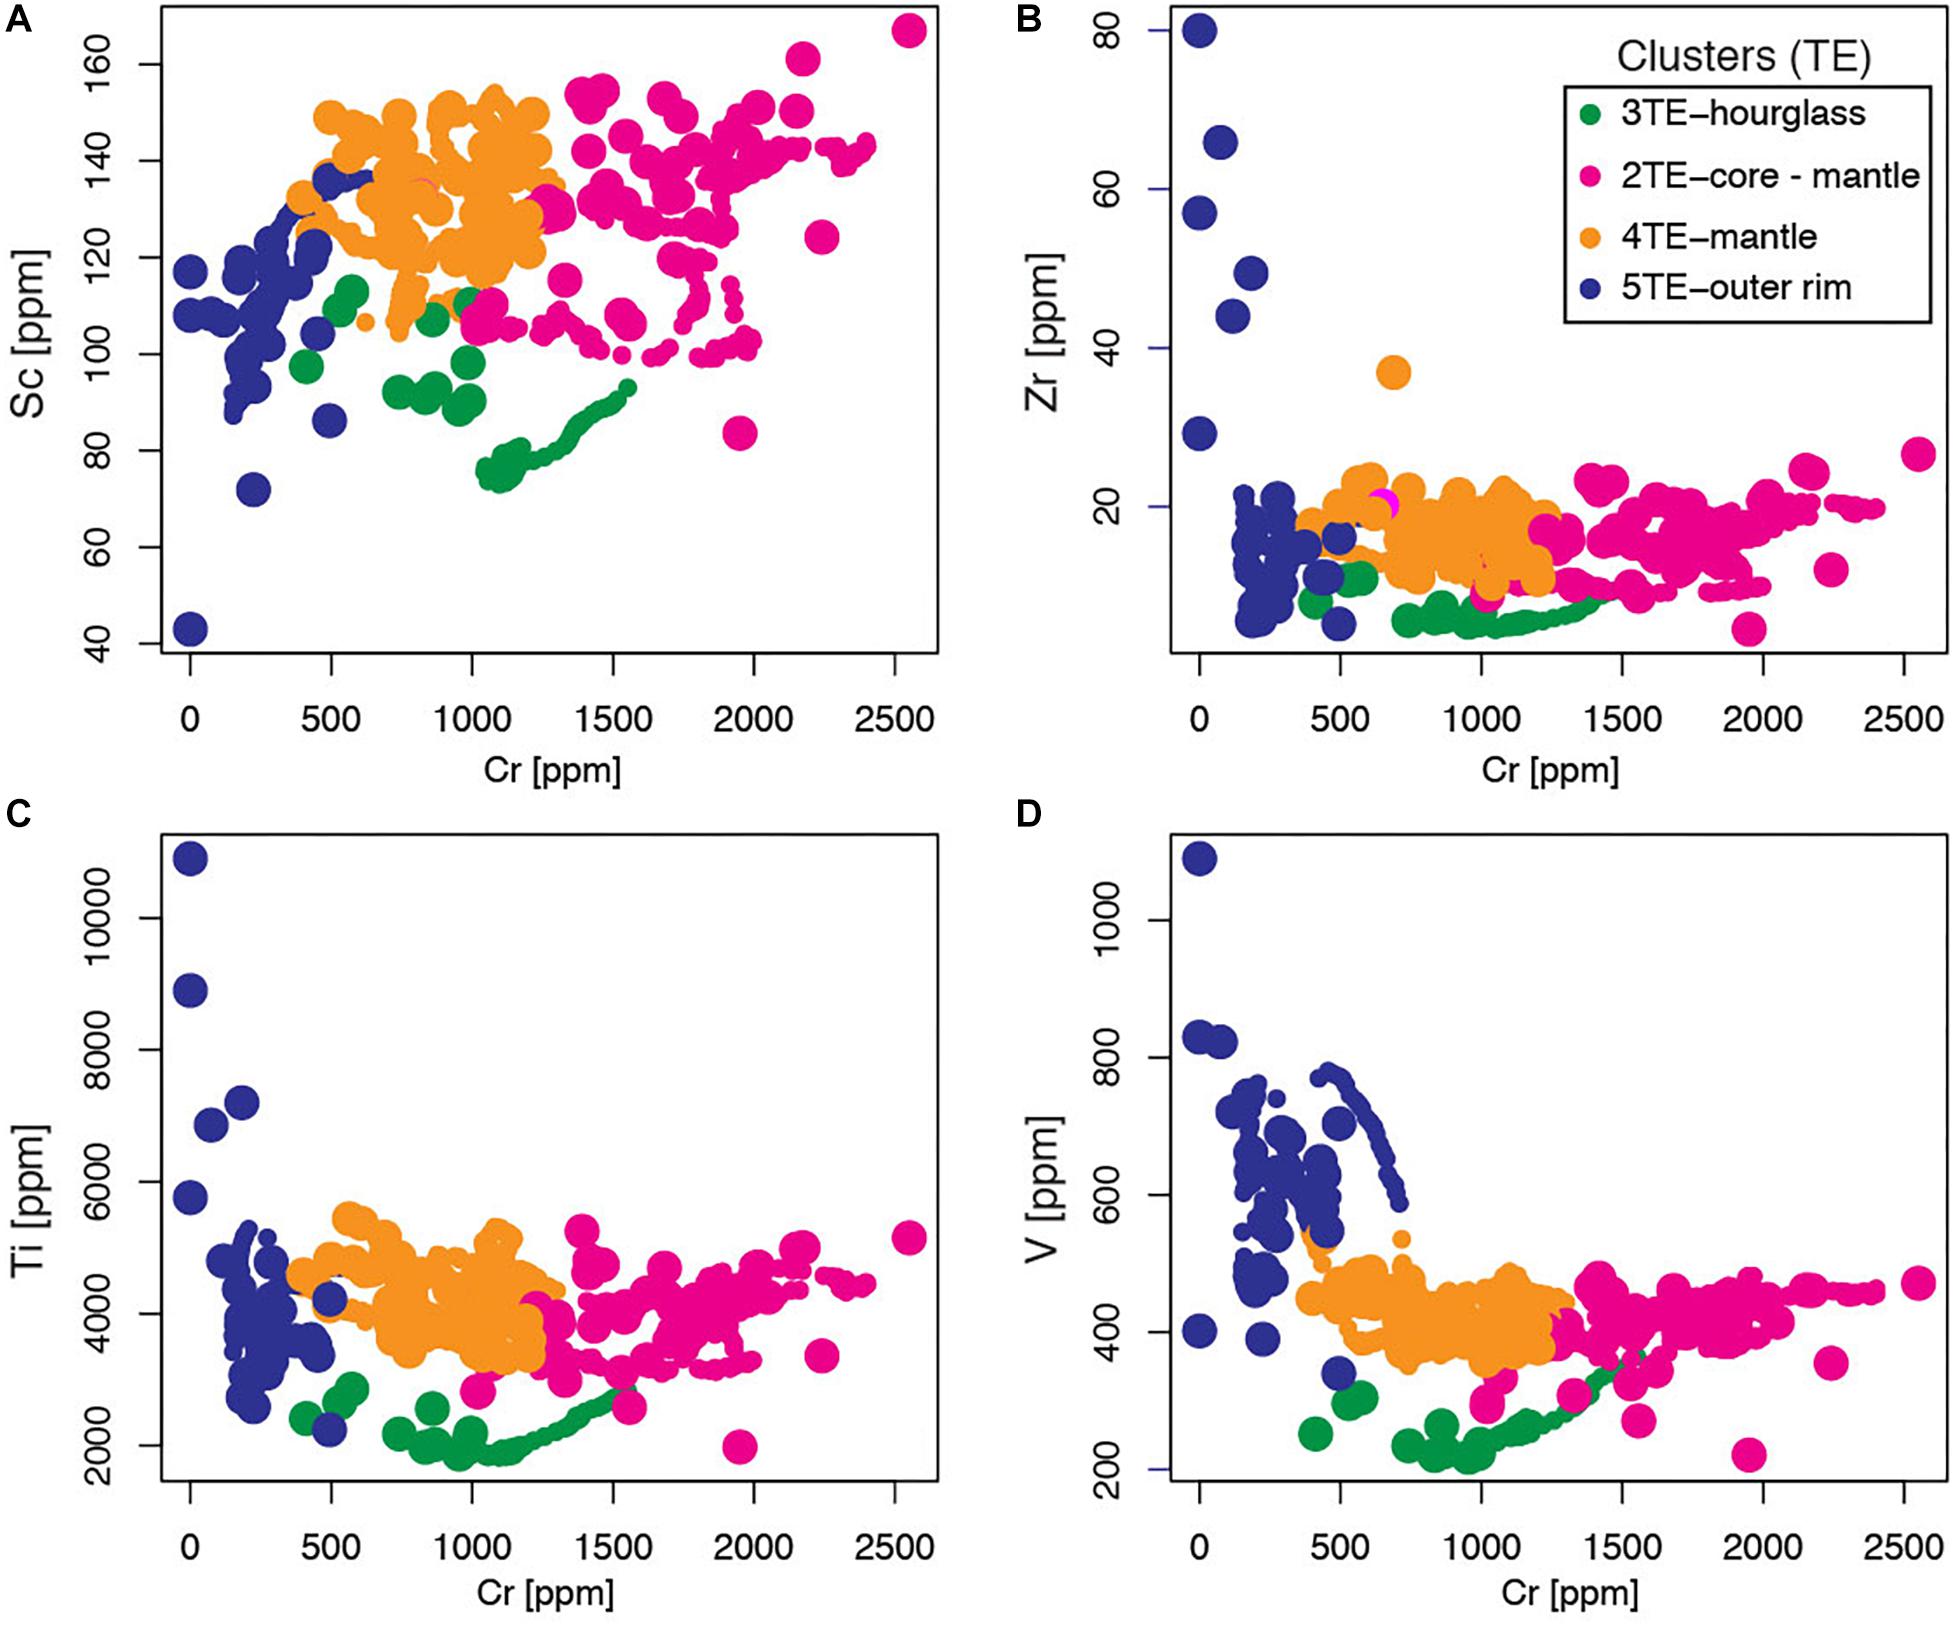
Figure 10. Harker diagrams showing the variation of (A) Sc, (B) Zr, (C) Ti, and (D) V against Cr for LA-ICP-MS spot analyses (large circles) and profiles (small circles). The color coding is the same of Figure 7.
Thus, altogether major and trace element data suggest that Cluster 1 and 2 zones were formed by crystallization from the same magma at lower and higher temperature, respectively (Figures 5, 9, 10). The higher temperature of zones belonging to Cluster 2 is also confirmed by their common growth over resorption surfaces (Figures 6a,c,d–f).
The trace element chemical evolution of cpx crystals from core to rim, can be plausibly explained with their crystallization from the same parental magma but at different temperatures and crystallinities (Figure 10). Few points located in the outer rim (Cluster 5TE), show higher content of incompatible elements such as Zr, Ti, and V and lower content of Sc (Figure 10). These few analyses suggest that some of the outer portions of the cpx crystals crystallize from a distinct melt. This magma does not need to be derived by a different parental magma with respect to the Bárdarbunga–Holuhraun 2014–2015 magma, but could be representing a highly crystalline lens of cold magma left over from previous eruptions. This scenario is in agreement with the major elements chemistry (Figure 5) of the rare bright outer zone (Cluster 5) of some cpx crystals (Figures 7c, 8a), which could indicate crystal growth under rapid cooling conditions (Mollo et al., 2013).
In summary, major and trace elements suggest that Cluster 1 and 2 rims grew from magmas with the same or similar composition but at lower (more chemically evolved melt) and higher temperature (lower concentration of incompatible elements; Figure 9), respectively. As Cluster 1 and 2 constitute the oscillatory zoned inner portions of the crystals, such temperature variations must have occurred repeatedly during the 2–9 days of cpx growth. The entrainment of cpx crystals in a higher temperature magma propagating through the dyke would lead to partial resorption of crystals followed by growth at lower degrees of undercooling and the formation of Cluster 2 growth zones. These distinct variations in temperature could be due to a number of factors, including: (1) thermal variability within the dyke due to non-uniform thermal exchange of magma with the wall rocks (e.g., complex geometry), which would result in high degrees of undercooling and crystallization of cpx marked by higher contents of Al, Ti and Na as observed for Cluster 1 and 5 compositions (Figure 5; Mollo et al., 2013); or (2) the temperature of the magma feeding the eruption was heterogeneous and mingling and mixing occurred within the dyke during transport resulting in the formation of Cluster 1 and 2 cpx zones. The fraction of Cluster 1 progressively decreases with respect to Cluster 2 from October 2014 to the end of the eruption (Figure 11). In the first scenario, this decrease would reflect the thermal maturation of the feeder dyke leading to a decreases of cpx crystallization at high degrees of undercooling. Within the second hypothesis, such decrease of the fraction of Cluster 1 cpx crystals would result from a decrease of the fraction of lower temperature magma feeding the dyke during the eruption (Figure 12).
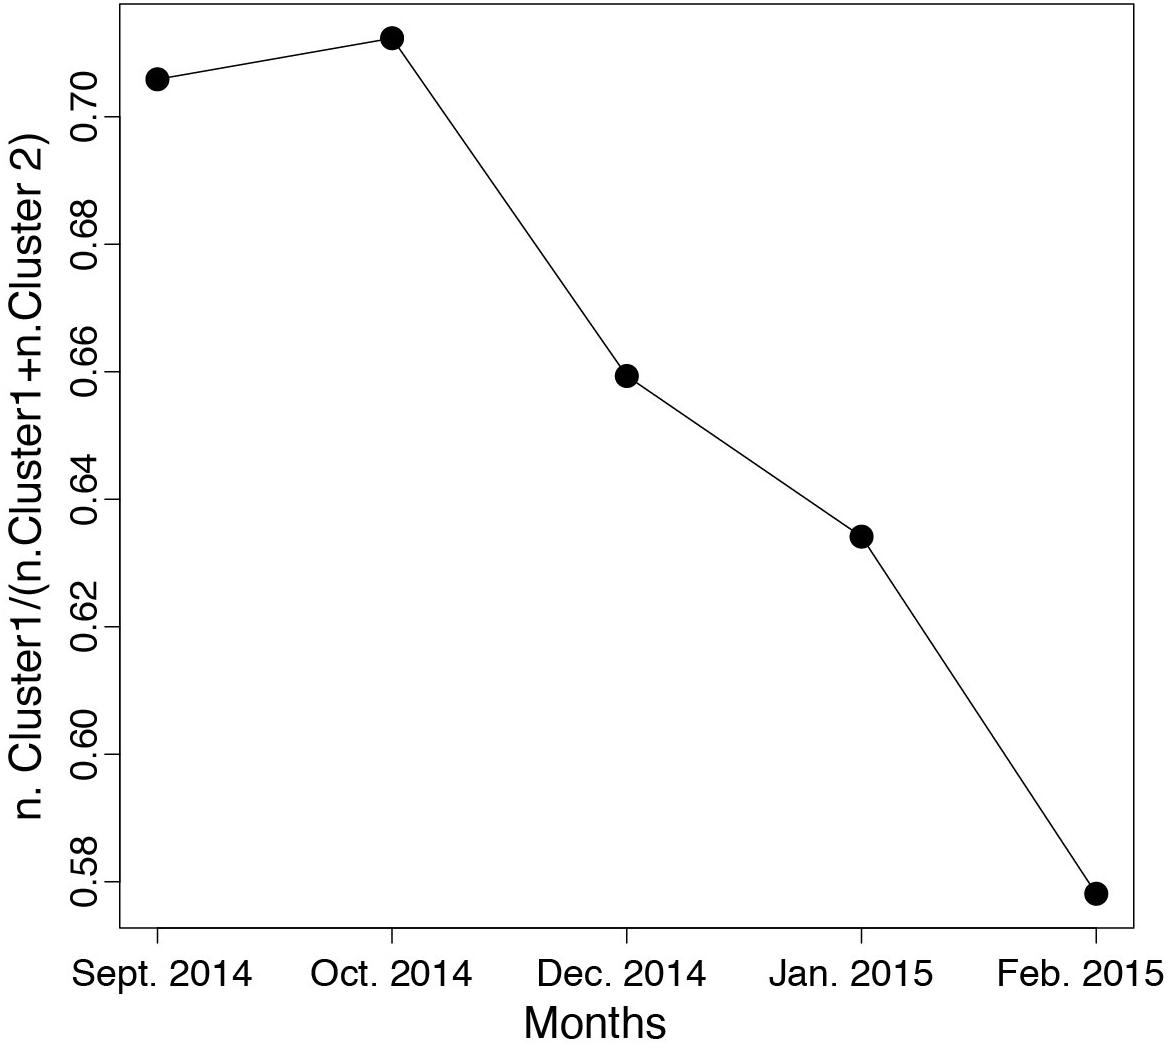
Figure 11. Evolution of the fraction of Cluster 1 relative to Cluster 2. Note that we did not have samples from November 2014.
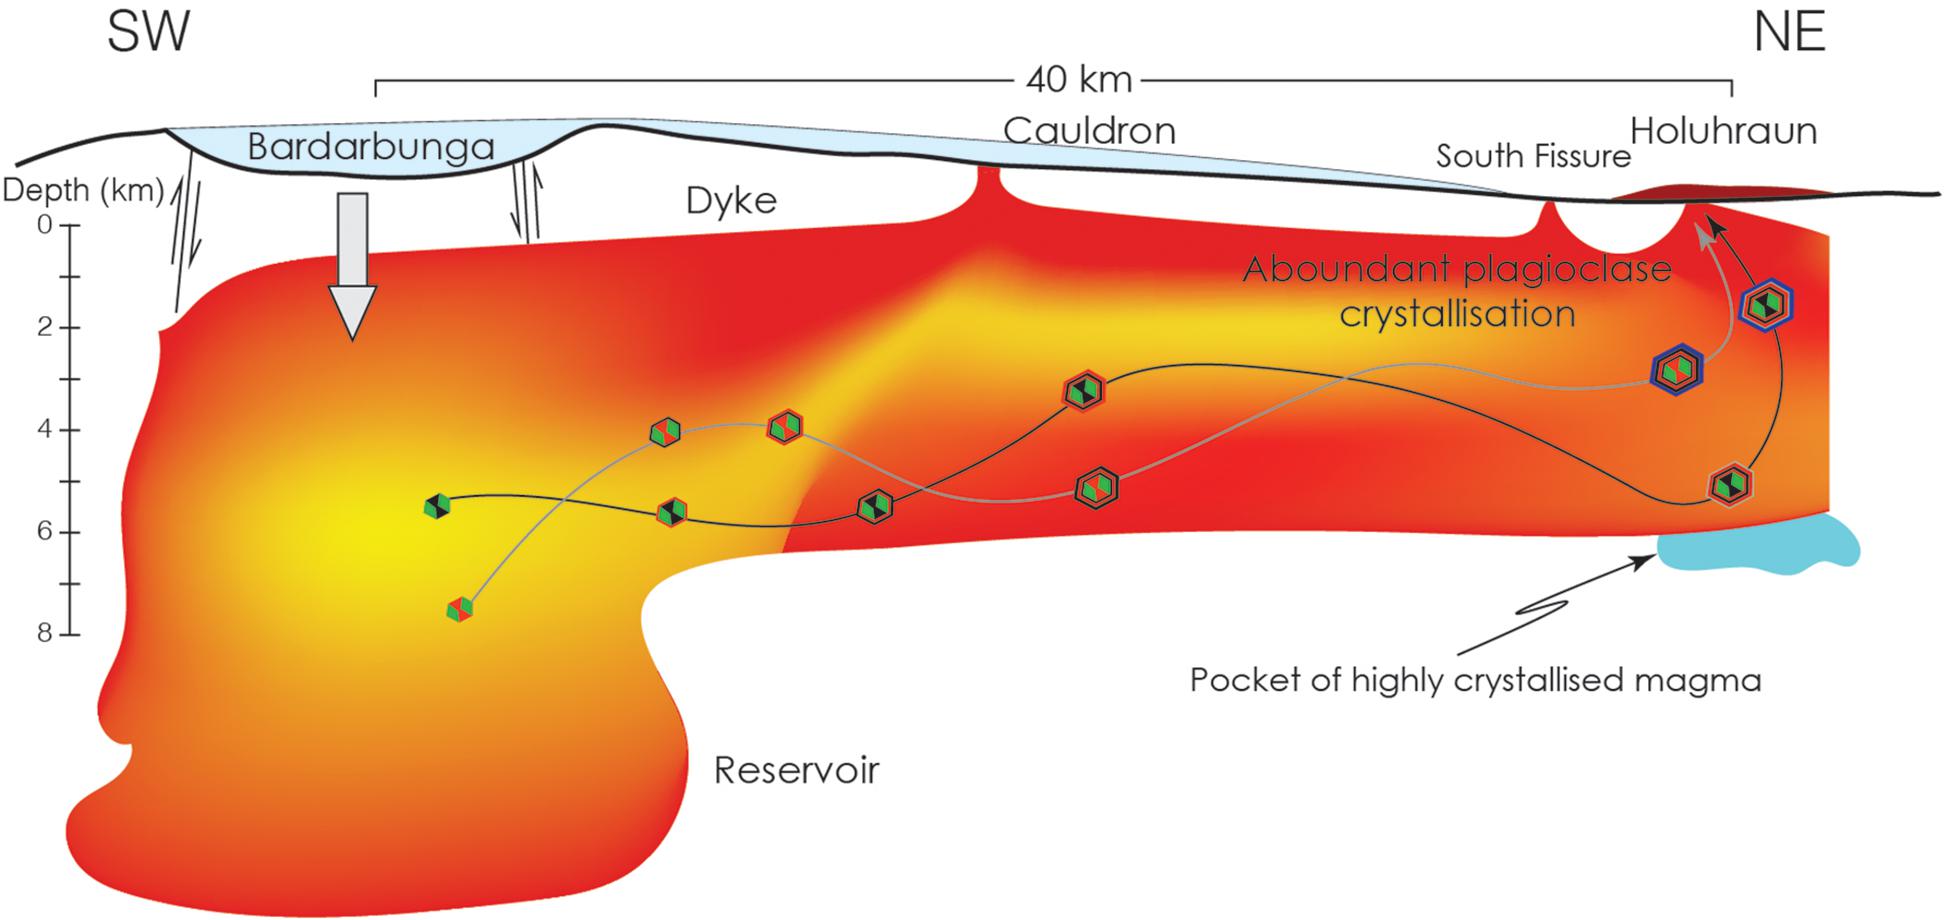
Figure 12. Cartoon (not to scale) showing the potential path followed by two crystals during the 2014–2015 Bárdarbunga–Holuhraun eruption, which would best account for our measurements and calculations. The depths are approximative and based on earthquake locations and reconstruction by Woods et al. (2019). The figure is partly inspired by Gudmundsson et al. (2016), Hartley et al. (2018), Hudson et al. (2017), and Woods et al. (2019).
Major elements suggest that Cluster 5 was formed at the highest degrees of undercooling with respect to the other compositional clusters (Figure 5; Mollo et al., 2013). Because of the limited spatial resolution, the trace element composition of Cluster 5 is difficult to determine with high precision, however, trace element profiles reveal that the presence of the bright rim in the cpx crystals (Figure 9a) likely grew from a magma with distinct chemistry (Figure 10). On the basis of these data we tentatively suggest that Cluster 5 compositions were formed when the magma came into contact with chemically different pocket/s of relatively cold magma while in the proximity of the eruption site (Figure 12), an hypothesis proposed also by Hartley et al. (2018). Finally, the rims (Cluster 4) were formed at shallow depths, but possibly still within the dyke, as this compositional cluster can also be observed in the inner portions of the crystals from January 2015 (Figure 5g).
The Holuhraun–Bárdarbunga eruption lasted for approximately 6 months during which the bulk magma chemistry remained substantially the same (Halldórsson et al., 2018). However, mineral chemistry can gives more resolution on the chemical processes occurring within magmatic systems (Wallace and Bergantz, 2002; Perugini et al., 2005; Kahl et al., 2011; Cheng et al., 2017; Forni et al., 2018; Probst et al., 2018). Using HC we have identified five groups of cpx compositions in major and trace element space that constitute different zones of the crystals. This, together with the petrographic context, allow us to interpret the evolution of the crystallization conditions during the eruption and to identify the different processes responsible for the chemical variability measured in the cpx crystals. Major and trace element analyses suggest that the chemical variability in the inner portions of the cpx crystals is mainly modulated by growth at different temperatures and resulting kinetic effects (Figures 5, 9, 10; Mollo et al., 2013; Ubide et al., 2019). The chemistry of the outer portions of the crystals reflect copious crystallization at shallow depths (Figures 5, 6, 8, 9). The chemistry of Zr-rich rims present in some of the crystals suggest the potential interaction of magma with pockets of cold and crystal-rich magma during the propagation of the magma to the eruption site (Figure 12). Compositional data, after removal of kinetic effects (Neave et al., 2019) suggest pre-eruptive pressure and temperature distributions in agreement with previous estimates (Figure 8; Halldórsson et al., 2018).
Our analysis suggests that the oscillatory zoning in the cpx mantles could be the result of either the interaction between magma propagating to the eruption site and pockets of magma that were cooling within the dyke, or by the mingling-mixing of magmas released from the reservoirs at different temperatures (Figure 12). The fraction of cpx rims generated at higher degrees of undercooling [Cluster 1/(Cluster1 + Cluster2)] progressively decline during the eruption (Figure 11), highlighting either thermal maturation of the dyke during the eruption, or the decrease of the fraction of the cooler magma entering the dyke. We propose that the approach presented here can be used to trace the evolution of long-lasting eruptions and can be useful to link monitoring parameters to magmatic processes occurring at depth.
All datasets generated for this study are included in the article/Supplementary Material.
LC conceived the study, led the fieldwork, and wrote the first draft of the manuscript. GS and LP assisted with the sample collection and data interpretation. MP collected the LA-ICP-MS data and contributed to their interpretation. TS assisted with the unsupervised learning approach and helped with the data interpretation. EB helped to interpreting the geochemical data and shared her expertise on the Holuhraun–Bárdarbunga 2014–2015 eruption. All authors contributed to the final version of the manuscript.
LC, LP, and GS appreciated the support for fieldwork of the Faculty of Science of the University of Geneva and the access provided by the Vatnajökull National Park. LC and TS received funding from the European Research Council (ERC) under the European Union’s Horizon 2020 Research and Innovation Program (grant agreement no. 677493 – FEVER). LC and TS acknowledge the support of the Swiss National Science Foundation (grant no. 200021_184632). MP acknowledge the Università degli Studi di Perugia FRB2019 grant titled “ENGAGE – machinE learNinG Applications for Geological problEms.”
The authors declare that the research was conducted in the absence of any commercial or financial relationships that could be construed as a potential conflict of interest.
We are grateful to Jean-Marie Boccard for the preparation of excellent rock thin sections.
The Supplementary Material for this article can be found online at: https://www.frontiersin.org/articles/10.3389/feart.2020.00018/full#supplementary-material
Bali, E., Hartley, M. E., Halldorsson, S. A., Gudfinnsson, G. H., and Jakobsson, S. (2018). Melt inclusion constraints on volatile systematics and degassing history of the 2014-2015 Holuhraun eruption, Iceland. Contrib. Mineral. Petrol. 173:9.
Bergen, K. J., Johnson, P. A., De Hoop, M. V., and Beroza, G. C. (2019). Machine learning for data-driven discovery in solid Earth geoscience. Science 36:eaau0323. doi: 10.1126/science.aau0323
Browning, J., and Gudmundsson, A. (2015). Surface displacements resulting from magma-chamber roof subsidence, with application to the 2014–2015 Bardarbunga–Holuhraun volcanotectonic episode in Iceland. J. Volcanol. Geotherm. Res. 308, 82–98. doi: 10.1016/j.jvolgeores.2015.10.015
Charrad, M., Ghazzali, N., Boiteau, V., and Niknafs, A. (2014). NbClust: an r package for determining the relevant number of clusters in a data set. J. Stat. Softw. 61:16344.
Cheng, L., Costa, F., and Roberto, C. (2017). Unraveling the presence of multiple plagioclase populations and identification of representative two-dimensional sections using a statistical and numerical approach. Am. Mineral. 102, 1894–1905. doi: 10.2138/am-2017-5929ccbyncnd
Forni, F., Degruyter, W., Bachmann, O., De Astis, G., and Mollo, S. (2018). Long-term magmatic evolution reveals the beginning of a new caldera cycle at Campi Flegrei. Sci. Adv. 4, 1–12. doi: 10.1126/sciadv.aat9401
Gauthier, P. J., Sigmarsson, O., Gouhier, M., Haddadi, B., and Moune, S. (2016). Elevated gas flux and trace metal degassing from the 2014–2015 fissure eruption at the Bárðarbunga volcanic system, Iceland. J. Geophys. Res. 121, 1610–1630. doi: 10.1002/2015jb012111
Geiger, H., Mattsson, T., Deegan, F. M., Troll, V. R., Burchardt, S., Gudmundsson, O., et al. (2016). Magma plumbing for the 2014-2015 Holuhraun eruption, Iceland. Geochem. Geophys. Geosyst. 17, 2953–2968. doi: 10.1002/2016gc006317
Gudmundsson, M. T., Jonsdottir, K., Hooper, A., Holohan, E. P., Halldorsson, S. A., Ofeigsson, B. G., et al. (2016). Gradual caldera collapse at Bardarbunga volcano, Iceland, regulated by lateral magma outflow. Science 353:aaf8988. doi: 10.1126/science.aaf8988
Halldórsson, S. A., Bali, E. O., Hartley, M. E., Neave, D. A., Peate, D. W., Gudhfinnsson, M., et al. (2018). Petrology and geochemistry of the 2014–2015 Holuhraun eruption, central Iceland: compositional and mineralogical characteristics, temporal variability and magma storage. Contrib. Mineral. Petrol. 173:64.
Hammer, J., Jacob, S., Welsch, B., Hellebrand, E., and Sinton, J. (2016). Clinopyroxene in postshield Haleakala ankaramite: 1. Efficacy of thermobarometry. Contrib. Mineral. Petrol. 171, 1–23. doi: 10.1007/s00410-015-1212-x
Hartley, M. E., Bali, E. O., Maclennan, J., Neave, D. A., and Halldorsson, S. A. (2018). Melt inclusion constraints on petrogenesis of the 2014-2015 Holuhraun eruption, Iceland. Contrib. Mineral. Petrol. 173.
Hudson, T. S., White, R. S., Greenfield, T., Ágústsdóttir, T., Brisbourne, A., and Green, R. G. (2017). Deep crustal melt plumbing of Bárðarbunga volcano, Iceland. Geophys. Res. Lett. 44, 8785–8794. doi: 10.1126/sciadv.aat5258
Iezzi, G., Mollo, S., Torresi, G., Ventura, G., Cavallo, A., and Scarlato, P. (2011). Experimental solidification of an andesitic melt by cooling. Chem. Geol. 283, 261–273. doi: 10.1016/j.chemgeo.2011.01.024
Ilyinskaya, E., Schmidt, A., Mather, T. A., Pope, F. D., Witham, C., Baxter, P., et al. (2017). Understanding the environmental impacts of large fissure eruptions: aerosol and gas emissions from the 2014–2015 Holuhraun eruption (Iceland). Earth Planet. Sci. Lett. 472, 309–322. doi: 10.1016/j.epsl.2017.05.025
Kahl, M., Chakraborty, S., Costa, F., and Pompilio, M. (2011). Dynamic plumbing system beneath volcanoes revealed by kinetic modeling, and the connection to monitoring data: an example from Mt. Etna. Earth Planet. Sci. Lett. 308, 11–22. doi: 10.1016/j.epsl.2011.05.008
Lanzafame, G., Mollo, S., Iezzi, G., Ferlito, C., and Ventura, G. (2013). Unraveling the solidification path of a pahoehoe “cicirara” lava from Mount Etna volcano. Bull. Volcanol. 75:703.
Mollo, S., Blundy, J. D., Iezzi, G., Scarlato, P., and Langone, A. (2013). The partitioning of trace elements between clinopyroxene and trachybasaltic melt during rapid cooling and crystal growth. Contrib. Mineral. Petrol. 166, 1633–1654. doi: 10.1007/s00410-013-0946-6
Mollo, S., Lanzafame, G., Masotta, M., Iezzi, G., Ferlito, C., and Scarlato, P. (2011). Cooling history of a dike as revealed by mineral chemistry: a case study from Mt. Etna volcano. Chem. Geol. 288, 39–52. doi: 10.1016/j.chemgeo.2011.06.016
Mollo, S., Putirka, K., Iezzi, G., and Scarlato, P. (2012). The control of cooling rate on titanomagnetite composition: implications for a geospeedometry model applicable to alkaline rocks from Mt. Etna volcano. Contrib. Mineral. Petrol. 165, 457–475. doi: 10.1007/s00410-012-0817-6
Neave, D. A., Bali, E., Guðfinnsson, G. H., Halldórsson, A., Kahl, M., Schmidt, A., et al. (2019). Clinopyroxene–liquid equilibria and geothermobarometry in natural and experimental tholeiites: the 2014–2015 Holuhraun eruption, Iceland David. J. Petrol. 60, 1653–1680. doi: 10.1093/petrology/egz042
Neave, D. A., and Putirka, K. D. (2017). A new clinopyroxene-liquid barometer, and implications for magma storage pressures under Icelandic rift zones. Am. Mineral. 102, 777–794. doi: 10.2138/am-2017-5968
Nimis, P. (1995). A clinopyroxene geobarometer for basaltic systems based on crystal-structure modeling. Contrib. Mineral. Petrol. 121, 115–125. doi: 10.1007/s004100050093
Nimis, P., and Ulmer, P. (1998). Clinopyroxene geobarometry of magmatic rocks part 1: an expanded structural geobarometer for anhydrous and hydrous, basic and ultrabasic systems. Contrib. Mineral. Petrol. 133, 122–135. doi: 10.1007/s004100050442
Paton, C., Hellstrom, J., Paul, B., Woodhead, J., and Hergt, J. (2011). Iolite: freeware for the visualisation and processing of mass spectrometric data. J. Anal. At. Spectrom. 26, 2508–2518. doi: 10.1039/C1JA10172B
Paul, B., Paton, C., Norris, A., Woodhead, J., Hellstrom, J., Hergt, J., et al. (2012). CellSpace: a module for creating spatially registered laser ablation images within the Iolite freeware environment. J. Anal. At. Spectrom. 27, 700–706. doi: 10.1039/C2JA10383D
Perugini, D., Poli, G., and Valentini, L. (2005). Strange attractors in plagioclase oscillatory zoning: petrological implications. Contrib. Mineral. Petrol. 149, 482–497. doi: 10.1007/s00410-005-0667-6
Petrelli, M., Laeger, K., and Perugini, D. (2016a). High spatial resolution trace element determination of geological samples by laser ablation quadrupole plasma mass spectrometry: implications for glass analysis in volcanic products. Geosci. J. 20, 851–863. doi: 10.1007/s12303-016-0007-z
Petrelli, M., Morgavi, D., Vetere, F., and Perugini, D. (2016b). Elemental imaging and petro-volcanological applications of an improved laser ablation inductively coupled quadrupole plasma mass spectrometry. Period. Mineral. 85, 25–39. doi: 10.2451/2015PM0465
Petrus, J. A., Chew, D. M., Leybourne, M. I., and Kamber, B. S. (2017). A new approach to laser-ablation inductively-coupled-plasma mass-spectrometry (LA-ICP-MS) using the flexible map interrogation tool ‘Monocle’. Chem. Geol. 463, 76–93. doi: 10.1016/j.chemgeo.2017.04.027
Probst, L. C., Sheldrake, T. E., Gander, M. J., Wallace, G., Simpson, G., and Caricchi, L. (2018). A cross correlation method for chemical profiles in minerals, with an application to zircons of the Kilgore Tuff (USA). Contrib. Mineral. Petrol. 173:23.
Putirka, K. D. (2008). Thermometers and barometers for volcanic systems. Rev. Mineral. Geochem. 69, 61–120. doi: 10.1515/9781501508486-004
R Core Team (2017). R: A Language and Environment for Statistical Computing. Vienna: R Foundation for Statistical Computing. Available at: https://www.R-project.org/
Ruch, J., Wang, T., Xu, W., Hensch, M., and Jónsson, S. (2016). Oblique rift opening revealed by reoccurring magma injection in central Iceland. Nat. Commun. 7:12352. doi: 10.1038/ncomms12352
Sigmundsson, F., Hooper, A., Hreinsdóttir, S., Vogfjörd, K. S., Ófeigsson, B. G., Heimisson, E. R., et al. (2014). Segmented lateral dyke growth in a rifting event at Bárðarbunga volcanic system, Iceland. Nature 517, 191–195. doi: 10.1038/nature14111
Ubide, T., McKenna, C. A., Chew, D. M., and Kamber, B. S. (2015). High-resolution LA-ICP-MS trace element mapping of igneous minerals: in search of magma histories. Chem. Geol. 409, 157–168. doi: 10.1016/j.chemgeo.2015.05.020
Ubide, T., Mollo, S., Zhao, J., Nazzari, M., and Scarlato, P. (2019). Sector-zoned clinopyroxene as a recorder of magma history, eruption triggers, and ascent rates. Geochim. Cosmochim. Acta 251, 265–283. doi: 10.1016/j.gca.2019.02.021
Wallace, G. S., and Bergantz, G. W. (2002). Wavelet-based correlation (WBC) of zoned crystal populations and magma mixing. Earth Planet. Sci. Lett. 202, 133–145. doi: 10.1016/s0012-821x(02)00762-8
Ward, J. H. Jr. (1963). Hierarchical grouping to optimize an objective function. J. Am. Stat. Assoc. 58, 236–244. doi: 10.1080/01621459.1963.10500845
Welsch, B., Hammer, J., Baronnet, A., Jacob, S., Hellebrand, E., and Sinton, J. (2016). Clinopyroxene in postshield haleakala ankaramite: 2. texture, compositional zoning and supersaturation in the magma. Contrib. Mineral. Petrol. 171, 1–19. doi: 10.1007/s00410-015-1213-9
Wood, B. J., and Banno, S. (1973). Garnet-orthopyroxene and orthopyroxene-clinopyroxene relationships in simple and complex systems. Contrib. Mineral. Petrol. 42, 109–124. doi: 10.1007/BF00371501
Keywords: mineral chemistry, petrology, magmatic processes, magma, eruption
Citation: Caricchi L, Petrelli M, Bali E, Sheldrake T, Pioli L and Simpson G (2020) A Data Driven Approach to Investigate the Chemical Variability of Clinopyroxenes From the 2014–2015 Holuhraun–Bárdarbunga Eruption (Iceland). Front. Earth Sci. 8:18. doi: 10.3389/feart.2020.00018
Received: 28 October 2019; Accepted: 21 January 2020;
Published: 07 February 2020.
Edited by:
Chiara Maria Petrone, Natural History Museum, United KingdomReviewed by:
Pier Paolo Giacomoni, University of Ferrara, ItalyCopyright © 2020 Caricchi, Petrelli, Bali, Sheldrake, Pioli and Simpson. This is an open-access article distributed under the terms of the Creative Commons Attribution License (CC BY). The use, distribution or reproduction in other forums is permitted, provided the original author(s) and the copyright owner(s) are credited and that the original publication in this journal is cited, in accordance with accepted academic practice. No use, distribution or reproduction is permitted which does not comply with these terms.
*Correspondence: Luca Caricchi, bHVjYS5jYXJpY2NoaUB1bmlnZS5jaA==
Disclaimer: All claims expressed in this article are solely those of the authors and do not necessarily represent those of their affiliated organizations, or those of the publisher, the editors and the reviewers. Any product that may be evaluated in this article or claim that may be made by its manufacturer is not guaranteed or endorsed by the publisher.
Research integrity at Frontiers

Learn more about the work of our research integrity team to safeguard the quality of each article we publish.