 Andrew S. Merdith
 Suzanne E. Atkins
 Michael G. Tetley
- 1CNRS, UMR 5276 LGL-TPE, F-69622, University of Lyon, Université Lyon 1, Ens de Lyon, Lyon, France
- 2Département de Géosciences, École Normal Supérieure, Paris, France
The subduction of upper oceanic lithosphere acts as a primary driver of Earth’s deep carbon and water cycles, providing a key transportation mechanism between surface systems and the deep Earth. Carbon and water are stored and transported in altered oceanic lithosphere. In this study, we present mass estimates of the subducted carbon and serpentinite flux from 320 to 0 Ma. Flux estimates are calculated using a full-plate tectonic reconstruction to build a descriptive model of oceanic lithosphere at points along mid-ocean ridges. These points then track the kinematic evolution of the lithosphere until subduction. To address uncertainties of modeled spreading rates in synthetic ocean basins, we consider the preserved recent (83–0 Ma) spreading history of the Pacific Ocean to be representative of the Panthalassa Ocean. This analysis suggests present-day subducting upper oceanic lithosphere contains 10–39 Mt/a of carbon and 900–3500 Mt/a of serpentinite (∼150–450 Mt/a of water). The highest rates of carbon delivery to trenches (20–100 Mt/a) occurred during the Early Cretaceous, as upper oceanic lithosphere subducted during this period formed in times of warm bottom water and the Cretaceous period experienced high seafloor production and consumption rates. Additionally, there are several episodes of high serpentinite delivery to trenches over the last 100 Ma, driven by extensive serpentinization of mantle peridotites exposed at slow spreading ridges. We propose variations in subduction regimes act as the principal control on the subduction of carbon stored in upper oceanic lithosphere, as since 320 Ma the volume of stored carbon across all ocean basins varies by less than an order of magnitude. For pre-Pangea times (<300 Ma), this suggests estimates of seafloor consumption represent a reasonable first-order approximation of carbon delivery. Serpentinite and associated water flux at subduction zones appear to be primarily controlled by the spreading regime at mid-ocean ridges. This is apparent during times of supercontinent breakup where slow spreading ridges produce highly serpentinized crust, and is observed in the present-day Atlantic, Arctic and Indian oceans, where our model suggests upper oceanic lithosphere is up to ∼100 times more enriched in serpentinite than the Panthalassa and Pacific oceans.
Introduction
The cycling of oceanic lithosphere from creation at mid-ocean ridges to destruction at subduction zones is the surface expression of the dynamic relationship between Earth’s tectonic plates and the convecting mantle over geological timescales (Conrad and Lithgow-Bertelloni, 2002, 2004; Becker, 2006; Seton et al., 2012). Whilst primarily a cycle of rocky material, the oceanic lithosphere also carries a significant mass of volatiles including carbon and water (Jarrard, 2003). These volatiles are sequestered and stored by alteration of the lithosphere through exposure to seawater (Janecky and Seyfried, 1986; Alt and Teagle, 1999), and are either released into melt or enter storage in the mantle during subduction. As a result, the cycling of oceanic lithosphere is a driver of the deep carbon (Dasgupta and Hirschmann, 2010) and water cycles (van Keken et al., 2011), which in turn carry important implications for climate stability (Kasting, 1989), and the rheology of the mantle (Hirth and Kohlstedt, 1996).
Alteration of the upper oceanic lithosphere by contact with seawater occurs globally in all ocean basins. The manner of the alteration depends on the lithological properties of the oceanic crust. New oceanic crust is continuously formed at mid-ocean ridges by magmatic processes, and the upper layers of volcanic crust cool rapidly when exposed to seawater, either directly or indirectly as it percolates through the rock. Alteration in these cases is most concentrated in the upper few hundred meters of the volcanic portions of the crust. However, at slow spreading ridges (full spreading rate < 40 mm/a), the geotherm is insufficient to induce extensive melt and asymmetric, tectonic exhumation of the upper lithospheric mantle occurs with little or no volcanic material (Tucholke and Lin, 1994). This exposes mantle peridotite, rather than basalt, to seawater (Cannat, 1993), resulting in extensive serpentinization of large areas of the peridotitic upper oceanic lithosphere (Früh-Green et al., 2004; Sauter et al., 2013).
The carbon sequestered in oceanic lithosphere comes from several sources, changing through the lifetime of the rock. The initial source is mantle carbon which is degassed at mid-ocean ridges directly into the water column (Dasgupta, 2013) or stored in carbon minerals at the base of the lithosphere (Keller et al., 2017). Freshly formed upper-oceanic lithosphere sequesters carbon in the form of carbonate through precipitation within the volcanic suites of oceanic crust during alteration (Alt and Teagle, 1999; Gillis and Coogan, 2011) or serpentinized peridotite (Alt et al., 2013). As the newly formed crust moves away from the mid-ocean ridge, sediment is deposited. After the Late-Cretaceous (Dutkiewicz et al., 2019), these sediments function as a major sink of both inorganic and organic carbon (Jarrard, 2003; Clift, 2017). Once subducted, carbon stored in sediments and crust can either be released into the lithosphere and atmosphere through melting and/or volcanic outgassing, or recycled back into the mantle (Zhang and Zindler, 1993; Sleep and Zahnle, 2001) as part of the deep carbon cycle (Dasgupta and Hirschmann, 2010). In particular, the metasomatism of oceanic crust occurring within subduction zones stores carbon in blueschists and greenschists (Bebout and Barton, 1989; Kelemen and Manning, 2015), and calcite has been identified as a major storage of carbon in the forearc (Barry et al., 2019).
The alteration of oceanic lithosphere also results in chemically bound water being stored in altered basalts and peridotites, within clay minerals and rocks such as serpentinite (Thompson, 1992). Serpentinite can store up to 13 wt% water, whilst estimates for altered basalts range between 2.7 and 5.7% (Staudigel et al., 1996; Jarrard, 2003; Gerya et al., 2006). Stored water is either dehydrated during subduction or, if subduction is cold and fast, can be returned to the mantle as “return flow” (van Keken et al., 2011). Quantifying the mass of water in oceanic lithosphere as it enters subduction zones is important for understanding and constraining depth-dependent metamorphic processes in the upper mantle and estimating rates of return flow, each having significant implications for viscosity variations deeper in the mantle (Hirth and Kohlstedt, 1996), long term sea level change (Karlsen et al., 2019) and post-seismic deformation (Muto et al., 2016).
Bottom-up approaches, which start from geophysical and geochemical first principles, have been used to calculate how much carbon or water any piece of oceanic crust can store to estimate global storage capacity in the oceanic lithosphere at present day (Staudigel et al., 1996; Jarrard, 2003; Dasgupta and Hirschmann, 2010; Alt et al., 2013; Bodnar et al., 2013; Kelemen and Manning, 2015). A number of studies explore the present-day behavior of chemically bound water in subducted slabs (Hacker, 2008; van Keken et al., 2011), requiring estimates of volatile supply to subduction zones. These studies use concentrations from Jarrard (2003) who estimated the weight percent (wt%) of water stored in different layers of oceanic crust entering subduction zones at the present day, using crustal age together with dredge and core data adjacent to trenches. We also use Jarrard (2003) as reference data for material formed at fast-spreading ridges. However, Jarrard (2003) did not consider the distribution of strongly serpentinitic lithosphere formed at slow spreading ridges entering subduction zones (Kerrick, 2002). The flux of these volatiles at a subduction zone is expected to vary through time because of the time-dependence of both the volume and alteration of oceanic lithosphere. Müller and Dutkiewicz (2018) estimate carbon storage based on carbon stored in altered crust using a plate reconstruction to trace parcels of seafloor through time. However, in addition to altered basalts, there is a significant amount of carbon stored in other components of oceanic crust including sheeted dykes and gabbros which were not explicitly considered in their study (∼0.145 wt% (∼1200 m thick) and 0.01 wt% (∼5000 m thick), respectively) (Alt and Teagle, 1999; Jarrard, 2003; Alt et al., 2013; Kelemen and Manning, 2015). In this study, we follow a similar approach to Müller and Dutkiewicz (2018), extending the analysis to the full crustal suite including serpentinized peridotite, allowing us to calculate estimates of water delivery in serpentinites and the upper 300 m of altered basalts to trenches.
In constructing bottom-up approaches to model volatile storage in oceanic lithosphere, we must consider a range of dependent and independent variables and the observational and analytical data that best constrain them (Crameri et al., 2019). Calculating estimates of carbon storage requires data constraining the: (i) thicknesses of each volcanic layer, (ii) proportion of peridotite exhumed into the upper oceanic lithosphere, (iii) degree of serpentinization, (iv) degree of basalt alteration, (v) bottom water temperature, and (vi) spreading rate. Consequently, uncertainties associated with each type of constraining data must be included and addressed in the construction of first-order subduction flux models. Quantification of these constraints is difficult even for times with a well-preserved seafloor spreading record, presenting a significant challenge for the Palaeozoic and Mesozoic where a complete geological or geophysical classification of the oceanic lithosphere does not exist. The bulk of observations come from a limited number of sampling sites adjacent to mid-ocean ridges, drill cores on continent-ocean boundaries, and dredge samples (Constantin et al., 1995; Früh-Green et al., 1996; Minshull et al., 2006; Shilobreeva et al., 2011). As a result of these limitations, few time-dependent studies have been completed that are able to both quantitatively estimate the storage of carbon or water in serpentinite at mid-ocean ridges and track ocean basin evolution to estimate the subduction flux of these elements and minerals through time.
The structure, composition, and potential volatile storage capacity of the oceanic lithosphere can be inferred as a function of the spreading rate of the ridge at which it formed. As the spreading rate varies both spatially and temporally (Müller et al., 2008; Crameri et al., 2019), the subduction of carbonates and water-rich serpentinites must also be allowed to vary spatially and temporally in any subduction flux model. The time-dependent storage capacity of oceanic lithosphere presents the second major challenge in a bottom-up approach. To do this, we use full-plate tectonic reconstructions built using a synthesis of geological, geophysical and geochemical data to constrain the locations and nature of plate boundaries in a self-consistent, evolving network (Seton et al., 2012). For the Cenozoic and Mesozoic, where oceanic lithosphere is preserved, isochrons and fracture zones are used to reconstruct ocean basins, and constrain the relative motion of plates. For times older than 200 Ma, where very little lithosphere from that period remains at present day (<30%) (Torsvik et al., 2010; Domeier and Torsvik, 2017), greater importance is placed on jointly interpreting continental palaeomagnetic and geological data in order to approximate the azimuth, and magnitude of plate motion. For example, plate models spanning the Mesozoic and Cenozoic provide a geological constraint on both the length of spreading systems and the rate at which they evolve (Müller et al., 2008, 2016). In comparison, plate reconstructions spanning the Palaeozoic (Domeier and Torsvik, 2014; Domeier, 2016, 2018; Young et al., 2019) and earlier times (Merdith et al., 2017) provide minimum ridge-length estimates requiring artificial spreading and convergence rates, making them a useful, but incomplete tool for extending analyses to pre-Pangea times. This is because spreading rates are tied to both the proportion of exhumed mantle lithosphere and the resulting composition of the upper oceanic lithosphere (Tucholke and Lin, 1994; Reston and McDermott, 2011), and seafloor production rates. Consequently, addressing the inherent uncertainty of pre-Pangea spreading rates is critical to constrain the storage of volatiles and the volume of oceanic lithosphere delivered to subduction zones.
Here, we build a bottom-up estimate of carbonate storage in the complete upper oceanic lithosphere including volcanics and altered peridotites, and an estimate of model uncertainty. Our approach ties the storage and the resulting availability of carbon in upper oceanic lithosphere directly to seafloor production rates and a defined volume of rock. We use a suite of descriptive system components identified and defined using present-day observations and data compilations (e.g., Kelemen and Manning, 2015) to estimate the volume of carbon stored in upper oceanic lithosphere. The time-dependence of our model is constrained by a recent full-plate reconstruction extending back to 410 Ma (Matthews et al., 2016), providing an integrated interpretation of the global evolution of tectonic plates on Earth’s surface. We test the sensitivity of our results to the effects of uncertainties in the geochemical data and plate reconstruction, providing a method to address uncertainty.
Methodology
Spreading Rate
To track the time-dependent evolution of tectonic plates and their boundaries, we use the plate reconstruction model of Matthews et al. (2016) spanning from 410 to 0 Ma and corrected for the model errata identified and explained in Torsvik et al. (2019). This plate model is a synthesis of the Domeier and Torsvik (2014) model for the late Palaeozoic (410–250 Ma) and the Müller et al. (2016) model for the Mesozoic and Cenozoic (230–0 Ma). We use the Python programing language1 with the GPlates software and python API pyGPlates2 to interrogate the reconstruction of Matthews et al. (2016) and build a time-dependent database of mid-ocean ridges, spreading segment lengths and spreading rates.
Since the breakup of Pangea, the strongest constraint for the reconstruction of past plate motion including spreading rates is provided by the preserved oceanic lithosphere (Hellinger, 1981; Lithgow-Bertelloni and Richards, 1998). Consequently, the estimated uncertainty of a plate reconstruction model can be related to the amount of lithosphere that is preserved at a given time (Torsvik et al., 2010). In order to accommodate this unavoidable uncertainty in the Palaeozoic and Early Mesozoic where little oceanic lithosphere remains preserved, we broadly distinguish ocean basins as either “internal” or “external” (Murphy and Nance, 2003), adopting a different approach for each type.
Internal oceans, such as the Atlantic and Indian Oceans, are defined as occurring typically on overriding plates formed during supercontinent breakup and initially contain a large component of continental lithosphere that decreases gradually over time as the ocean expands. External oceans, such as the Panthalassa and Pacific Oceans, are defined as remaining stable through at least a single supercontinent cycle (Merdith et al., 2019), are ringed by subduction (Collins, 2003; Domeier and Torsvik, 2014), and are composed almost entirely of oceanic lithosphere. In our analysis we classify the Panthalassa and Pacific Oceans as the only external oceans, whilst all other basins in the plate model are considered internal oceans (e.g., Figures 1A–F). For external oceans earlier than 160 Ma (rounding down to the nearest 10 Ma from the age of the earliest magnetic lineations of seafloor spreading preserved in the Pacific Ocean (e.g., Müller et al., 2016), we treat spreading rate as a free parameter in our calculations and compare these results to those produced by explicitly using the spreading rate taken from the plate model. We use this method to assess the validity of synthetic ocean plates (i.e., ocean plates presumed to have existed, but of which no evidence remains in situ), and to explore the sensitivity of our results to variations of spreading rate.
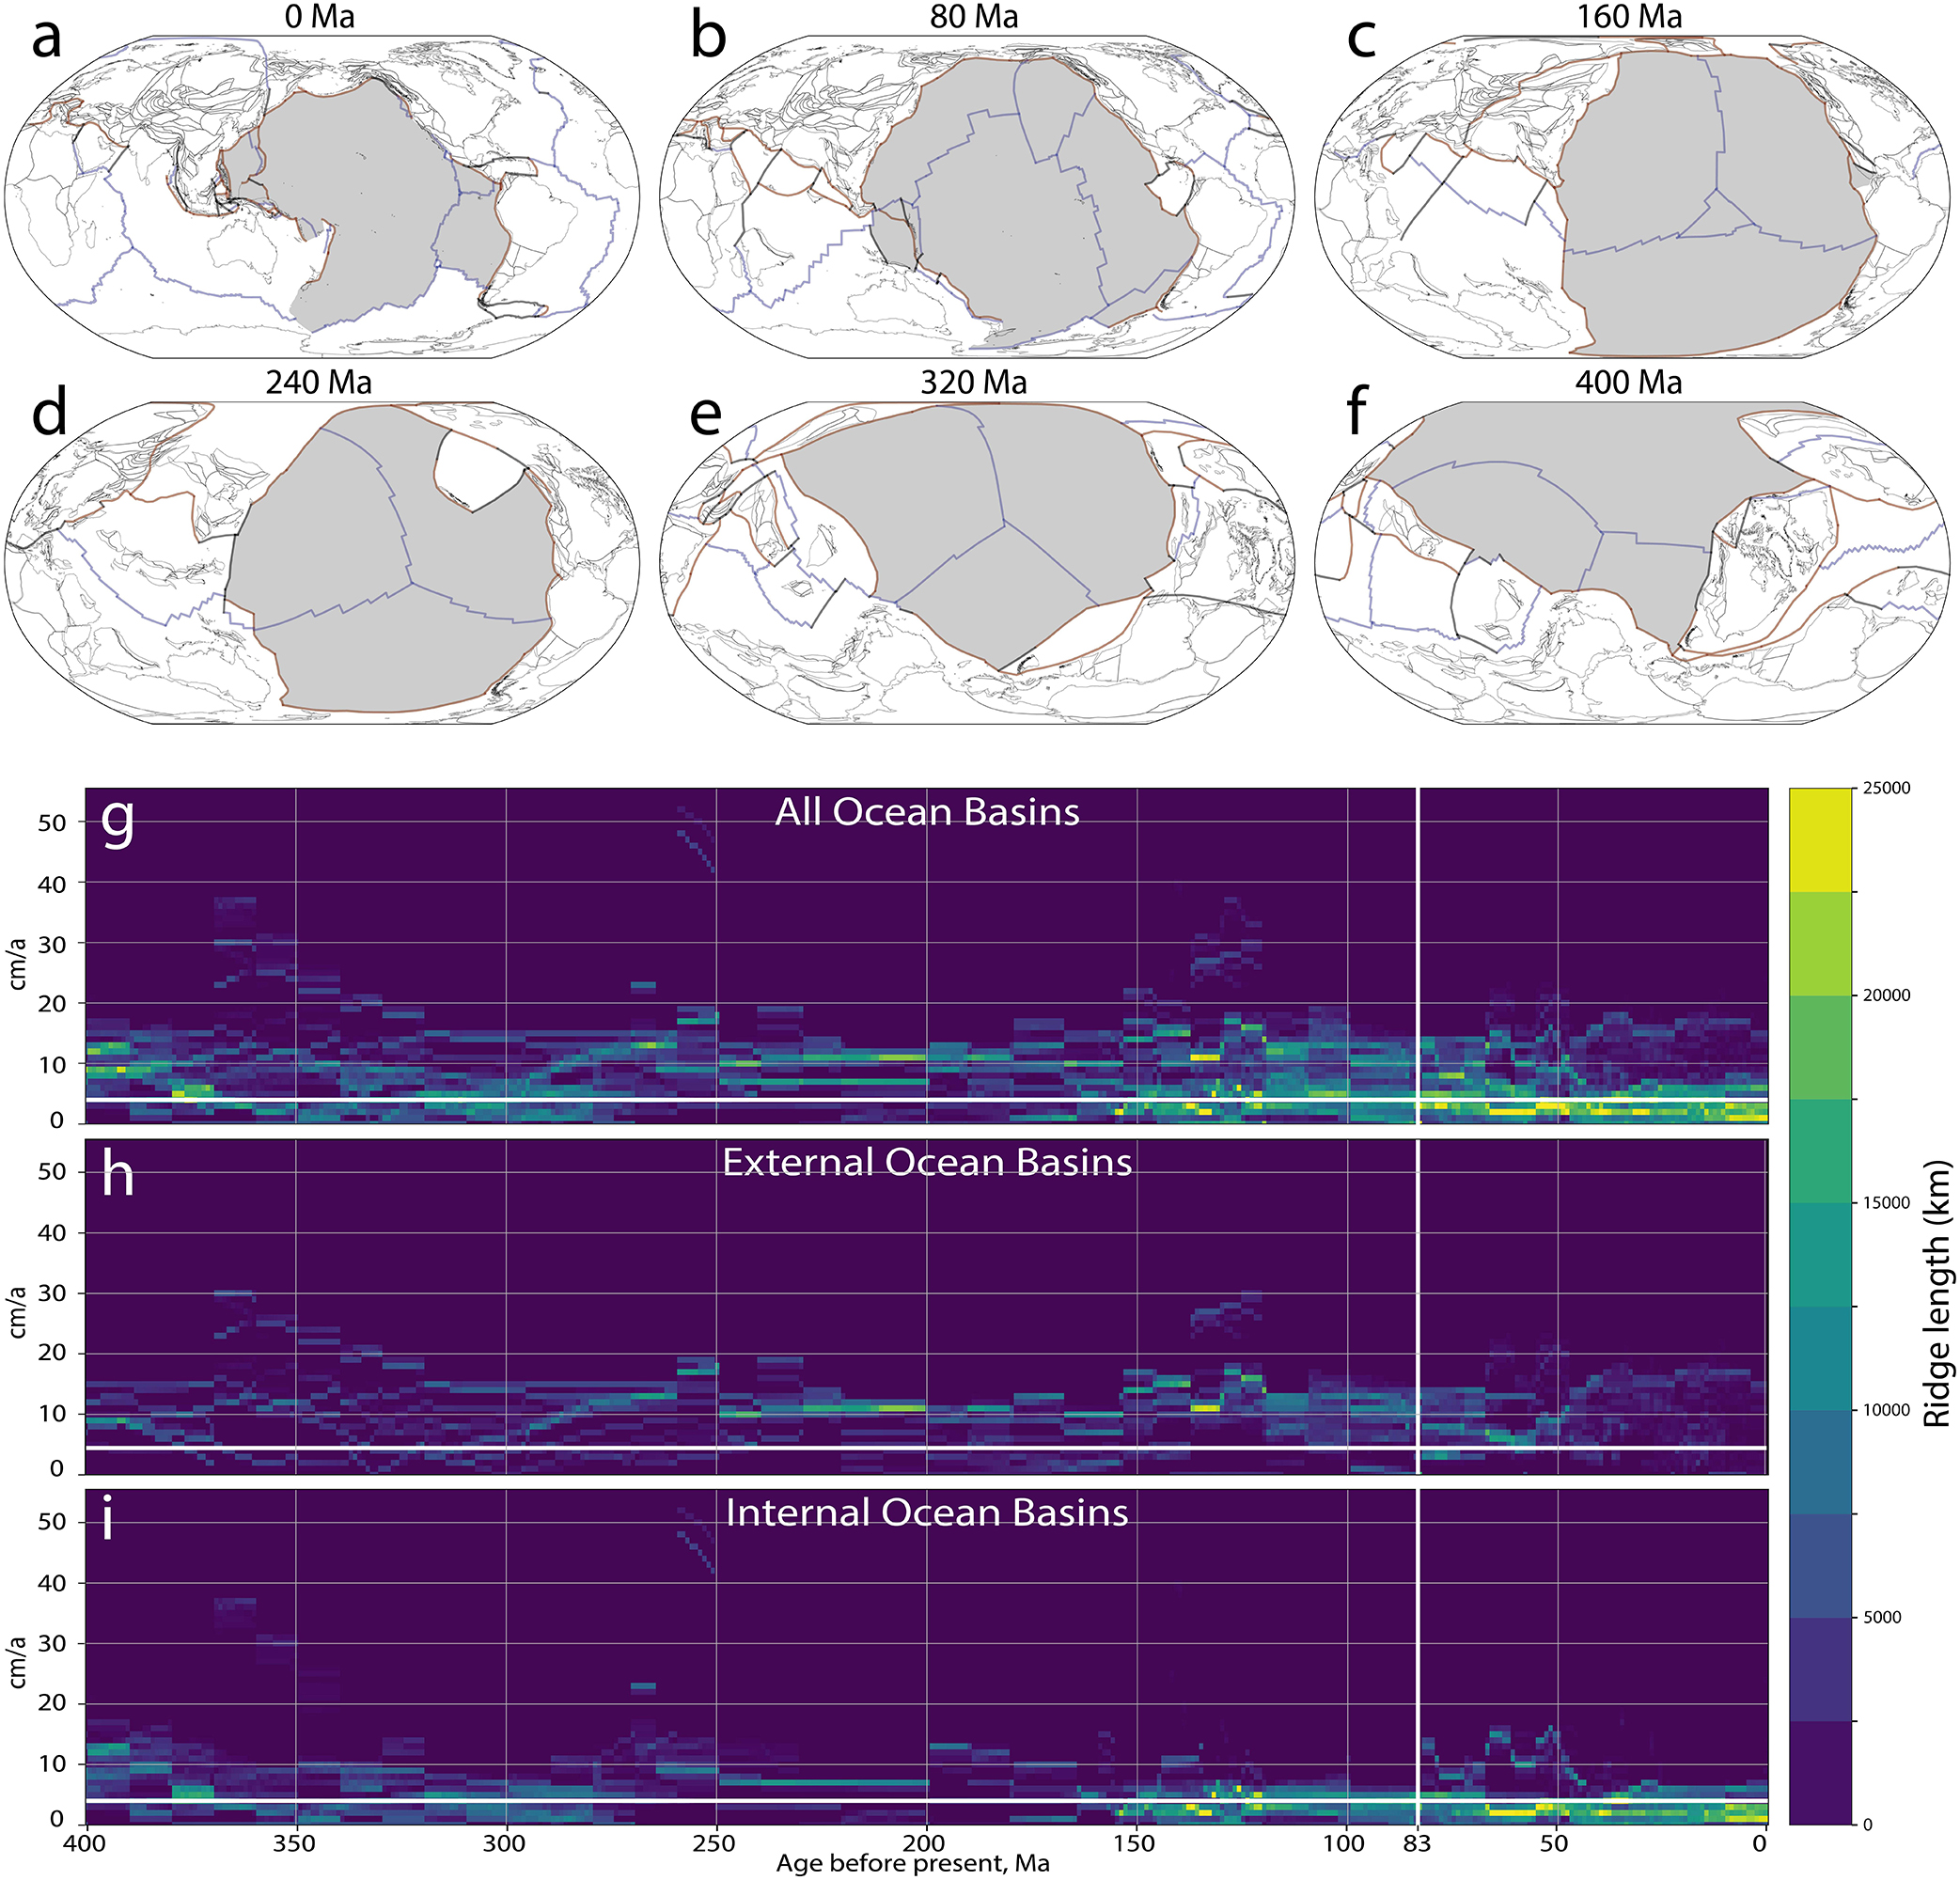
Figure 1. Evolution of the Pacific Ocean used in our analysis. (A–F) Snapshots of the Pacific and Panthalassa Oceans and associated basins used to extract spreading rate distributions (dark gray). All plates constituting the Pacific basin during the last 83 Ma were identified using the model of Matthews et al. (2016). Mid-ocean ridges in blue, subduction zones in brown, and connecting plate boundaries in gray. Tectonic plates highlighted in dark gray are what we considered “external” ocean basins, while internal ocean basins are the remainder. (G–I) show the distribution of full ridge spreading rates sampled at spreading segments in cm/a with (G) all ocean basins, (H) external ocean basins, and (I) internal ocean basins. The bold vertical white line shows the 83 Ma cut off, where we use the external ocean distribution as an archetype for pre-160 Ma external ocean basins. The horizontal white lines are at 4 cm/a, where in our model we separate amagmatic and magmatic crustal forming processes at ridges.
The Pacific Ocean is the only large, stable, external ocean that is well-constrained in plate models for the last ∼83 Ma (Wright et al., 2016). For this study, we assume that other large external oceans that have existed through time behave in a similar way, thereby assuming the tectonic mechanisms acting at present-day in the Pacific are representative of external oceans for the last 400 Ma (Figure 1G). We extract Pacific spreading rates for the last 83 Ma at a temporal resolution of 1 Ma and an along-ridge strike spatial resolution of 1 km (Figure 1H) to produce representative external ocean spreading rate distributions. For external oceans younger than 160 Ma, we use the spreading rate as modeled by the plate model, whilst for times earlier than 160 Ma we use the Pacific data to provide representative distributions (Figure 1H) of spreading rates for large, stable, and external ocean basins in deeper time (Figures 1D–F). Each ridge segment at each timestep in an external, pre-160 Ma ocean uses a spreading rate randomly drawn from the observed distribution of Pacific data. For internal oceans we use the explicit spreading rates from the plate model, as in the absence of preserved oceanic lithosphere, the geological and palaeomagnetic data used to construct the plate model provide a first-order constraint on times and rates for rift, drift and collision (Figure 1I). As part of the evaluation of our methodology, we compare the results of our preferred approach using Pacific-Ocean derived spreading rates (POSR) with results produced when using plate-model spreading rates directly (PMSR) (section “Plate Model vs. Pacific Ocean Spreading Rates”).
Properties of Upper Oceanic Lithosphere
The carbon storage capacity of oceanic lithosphere is determined by its relative proportion of peridotitic and volcanic suites. The relative proportions of volcanic and peridotitic suites result from melt supply at ridges and can be broadly linked to spreading rates (Cannat, 1993; Tucholke and Lin, 1994), and the transition from amagmatic or low melt percentage to magmatic spreading (Dick et al., 2003). At high spreading rates, ocean crust is formed by magmatic processes. When the spreading rate is slow enough that the thermal profile of the ridge is too cool to support a magma chamber or to trigger a melt product that can be incorporated into the oceanic crust, mantle peridotite is exposed to seawater (Sleep and Barth, 1997). In these cases the lithospheric mantle is tectonically exhumed into the rock column by asymmetric detachment faulting (Tucholke et al., 2008; Carbotte et al., 2016), exposing mantle peridotites and ultramafics to seawater where serpentinization can occur (Cannat et al., 2010; Figure 2A). We begin our analysis at the initiation of seafloor spreading, neglecting transitional crust that is exposed during continental rifting, although this can also be variably serpentinized (e.g., Zastrozhnov et al., 2018). By estimating the proportion of peridotite present, we also estimate the proportion of the magmatic component. We divide the total thickness of the magmatic suite into sub-components: upper volcanics (basalt), lower volcanics, transition layer, sheeted dykes, and gabbros, after Alt and Teagle (1999) and Jarrard (2003) (Figure 2B). Each subdivision has a specific distribution of carbon associated with it, which we randomly sample and re-combine to estimate the cumulative total amount of carbon present.
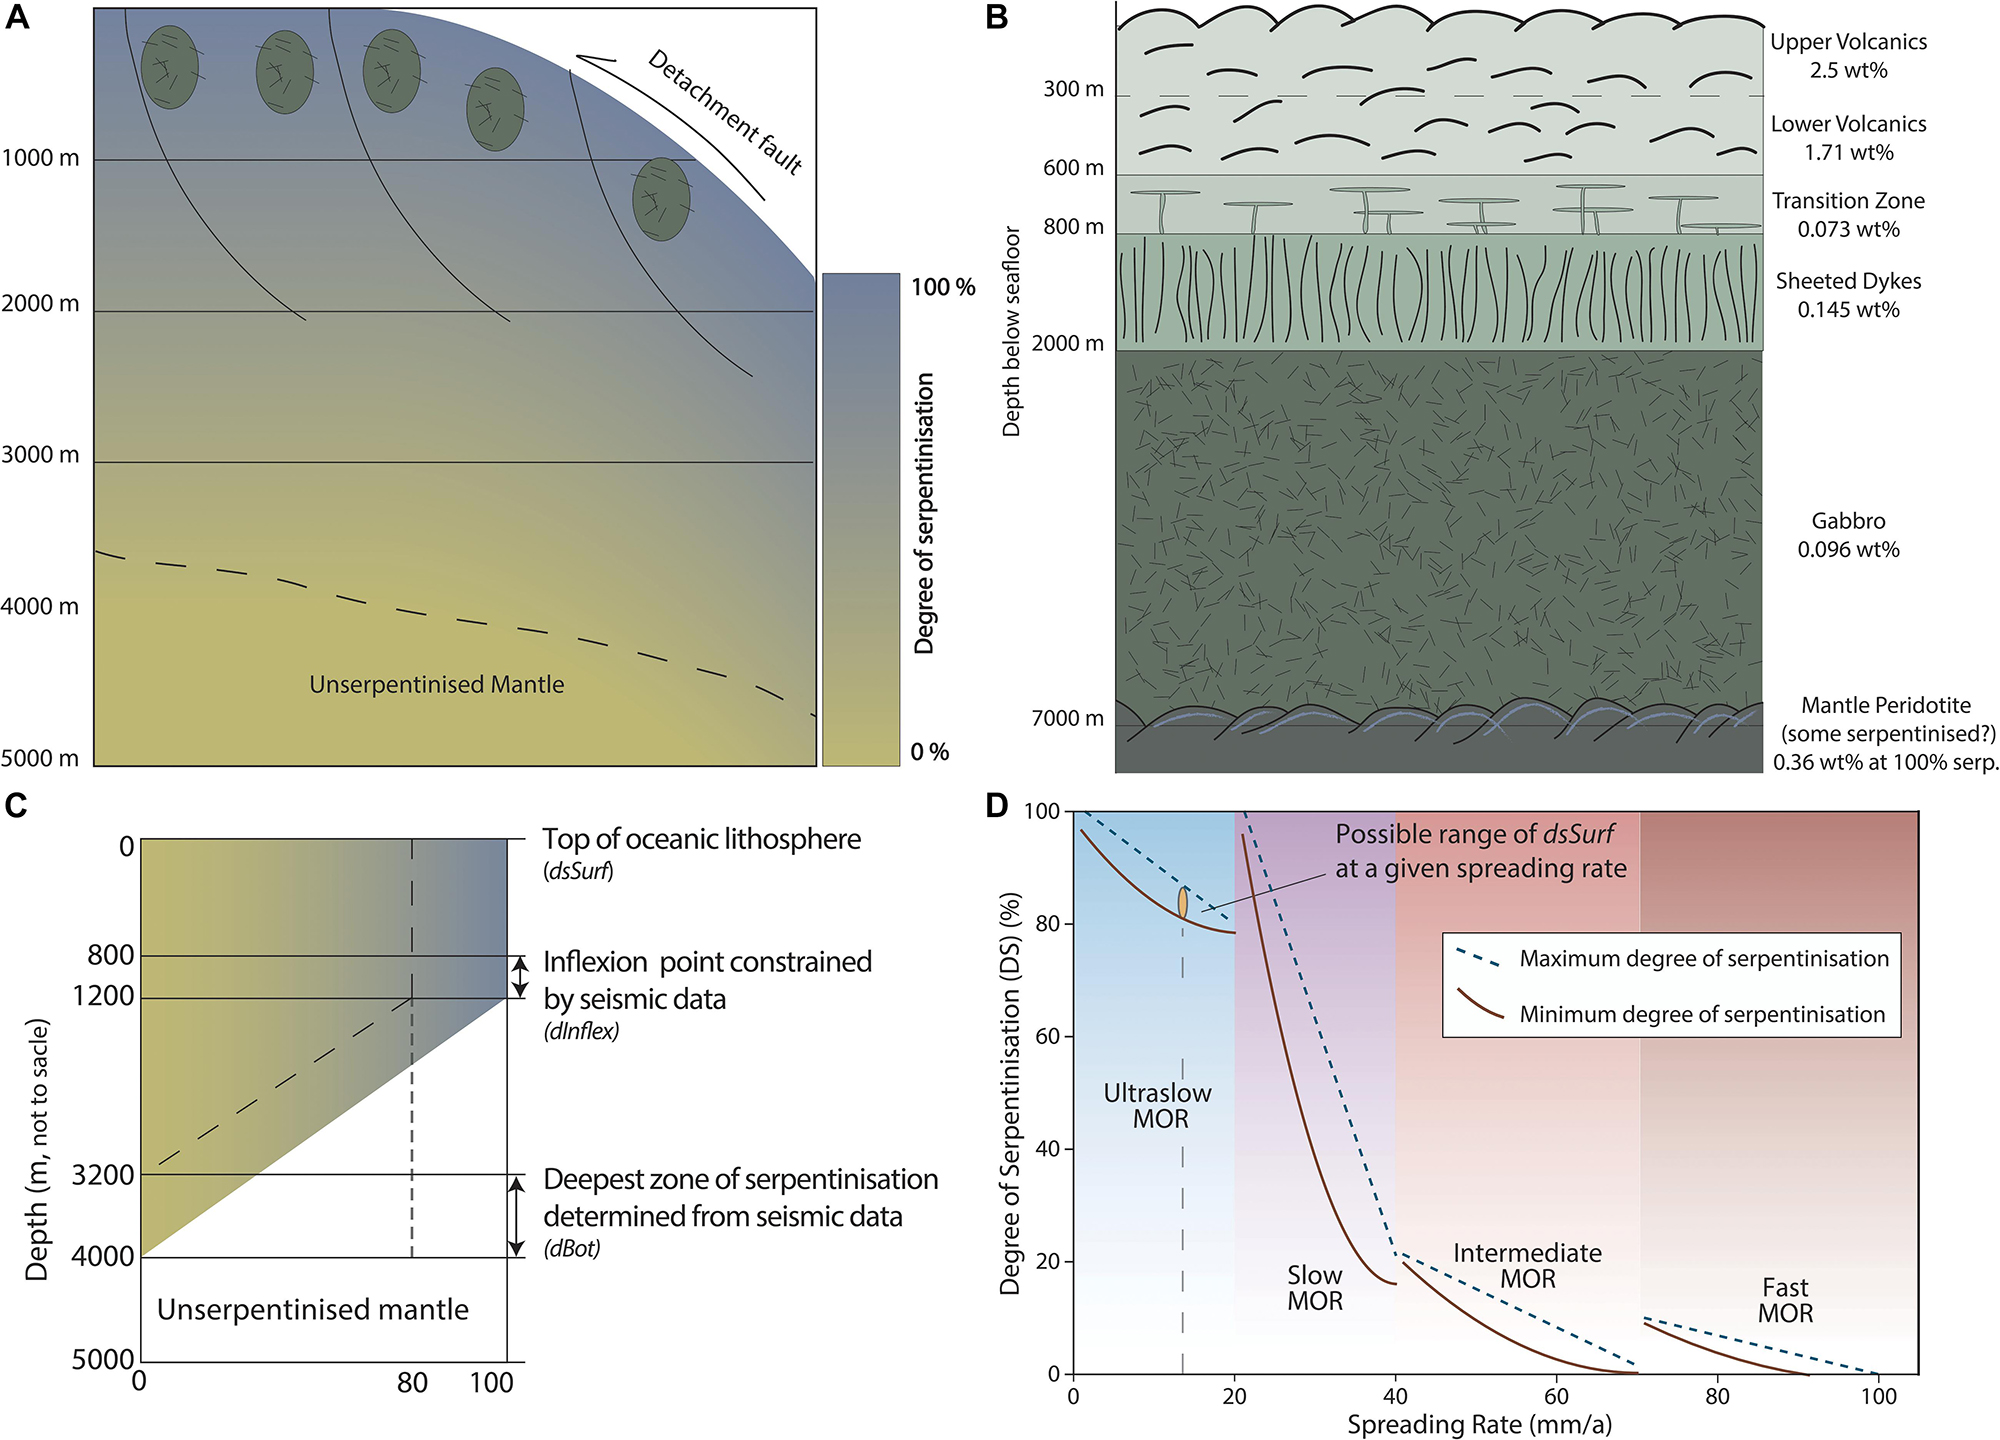
Figure 2. Schematic cross sections of upper oceanic lithosphere produced at (A) slow spreading ridges (full spreading rate < 40 mm/a) where tectonic exhumation of the lithospheric mantle occurs, and (B) fast spreading ridges (full spreading rate > 40 mm/a) where the typical column of oceanic crust consisting of basalts, dykes, and gabbros is formed. At these slow ridges (A), the mantle lithosphere is exposed to seawater, and undergoes serpentinization to a depth of ∼3200–4000 m. Weight percentages of carbonate for each layer are taken from Kelemen and Manning (2015). (C) Parameterization of the seismic relationship from Cannat et al. (2010) to estimate the depth of serpentinization and the overall degree of serpentinization of a system. (D) Initialization and inverse correlative relationship of degree of serpentinization and spreading rate that we employ in this model.
The exhumation rate of mantle lithosphere acts as a control on the degree of bulk rock serpentinization over million-year timescales. However, there is little geological data constraining the degree of serpentinization at ridge systems, compounded by the fact that many recovered samples are described only qualitatively. Dredged material from ridges spreading at less than 40 mm/a have returned variably serpentinized samples ranging from 20% to 100% (Dick, 1989; Sauter et al., 2013). As spreading rate increases and magmatic oceanic crust is produced, serpentinization is considered to be a negligible component of the crustal profile, though dredges at fast spreading ridges have returned fully serpentinized samples (Constantin et al., 1995). Cannat et al. (2010) used seismic data from Canales et al. (2000) to build bulk rock estimates of serpentinization at ridges spreading at less than 40 mm/a. They estimate that approximately the first kilometer of crustal profile is highly serpentinized (80–100%) as a result of extensive fracturing during exhumation. At this depth, there is an inflexion in the degree of serpentinization, with a linear decrease between a depth of 3.2 and 4 km to 0% (Figure 2C). To account for the variation and uncertainty within the seismic data, we parameterize the relationship between depth and serpentinization using the initial degree of serpentinization at the surface of the lithosphere (dsSurf), the depth of the inflection point (dInflex) and the depth to serpentinized mantle (dBot) (e.g., Figure 2C). dInflex and dBot are taken from Cannat et al. (2010) (e.g., Table 1). To reflect the greater uncertainty related to the initial degree of serpentinization, we employ a negative correlative relationship between dsSurf and spreading rate, such that the slower the spreading ridge, the higher the degree of serpentinization (Figure 2D). Slow ridges exhibit high variability in the degree of serpentinization, especially as they approach spreading rates of 40 mm/a (e.g., Dick et al., 2003) and have a broader range of dsSurf (Figure 2D).
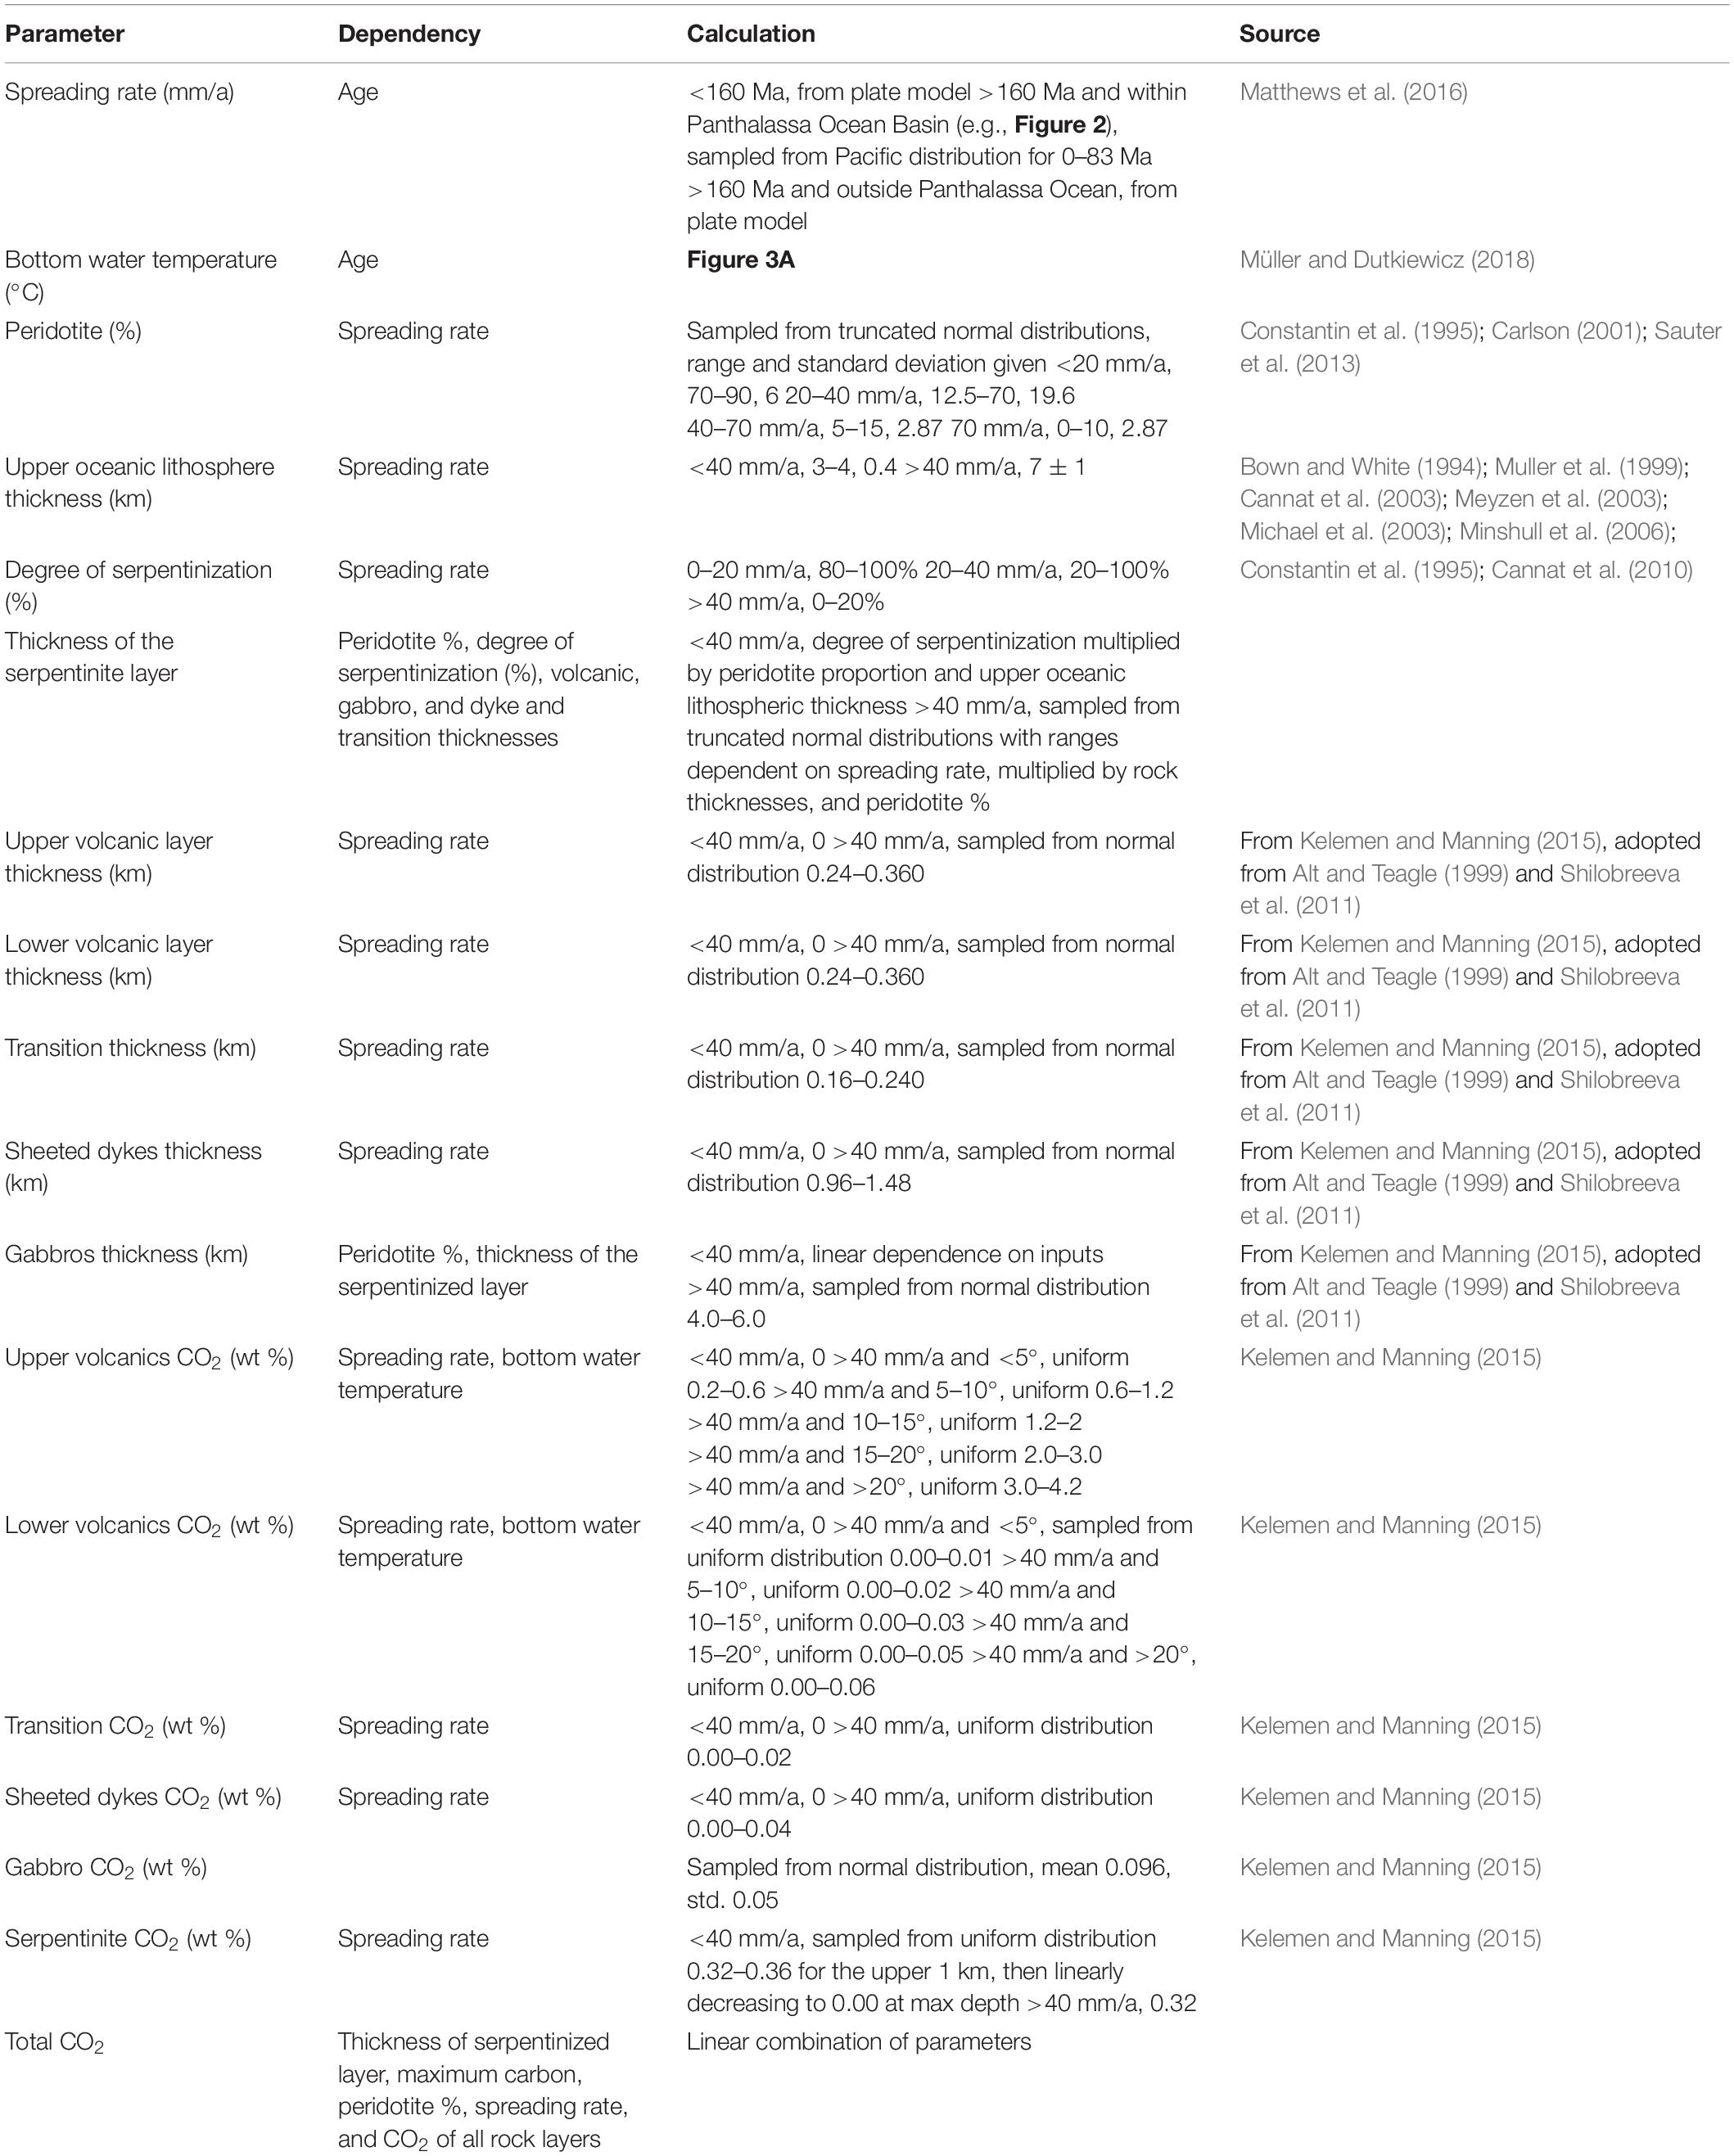
Table 1. Parameter description, dependencies, and references.
Bottom Water Temperature
Carbonate precipitation in the upper 300 m of basaltic oceanic crust is a function both of age and bottom water temperature (Gillis and Coogan, 2011; Coogan et al., 2016). Warmer bottom water results in a higher carbonate precipitation rate, and greater progressive uptake of carbonate over the life of oceanic crust, with ∼80% of carbonate being sequestered within 20 Ma of crustal formation (Coogan et al., 2016). Young (<5 Ma) oceanic crust is therefore less enriched in carbonate relative to older oceanic crust (>20 Ma), although this is moderated by the evolution of bottom water temperature (Alt and Teagle, 1999; Gillis and Coogan, 2011). Müller and Dutkiewicz (2018) used these observations with a bottom water temperature curve from 400 to 0 Ma to derive a log-weighted relationship between seafloor age, water temperature and wt% of precipitated carbonate (Figure 3A). We apply a similar relationship as a weighting factor in our calculation of carbon storage for the upper volcanic layers only. For each segment of oceanic crust, we calculate the integrated average bottom water temperature for the first 20 Ma from this curve (e.g., Figure 3B) and scale the mean wt% of carbon accordingly. The pre-scaled mean wt% carbon is drawn randomly from the distribution defined by Kelemen and Manning (2015).
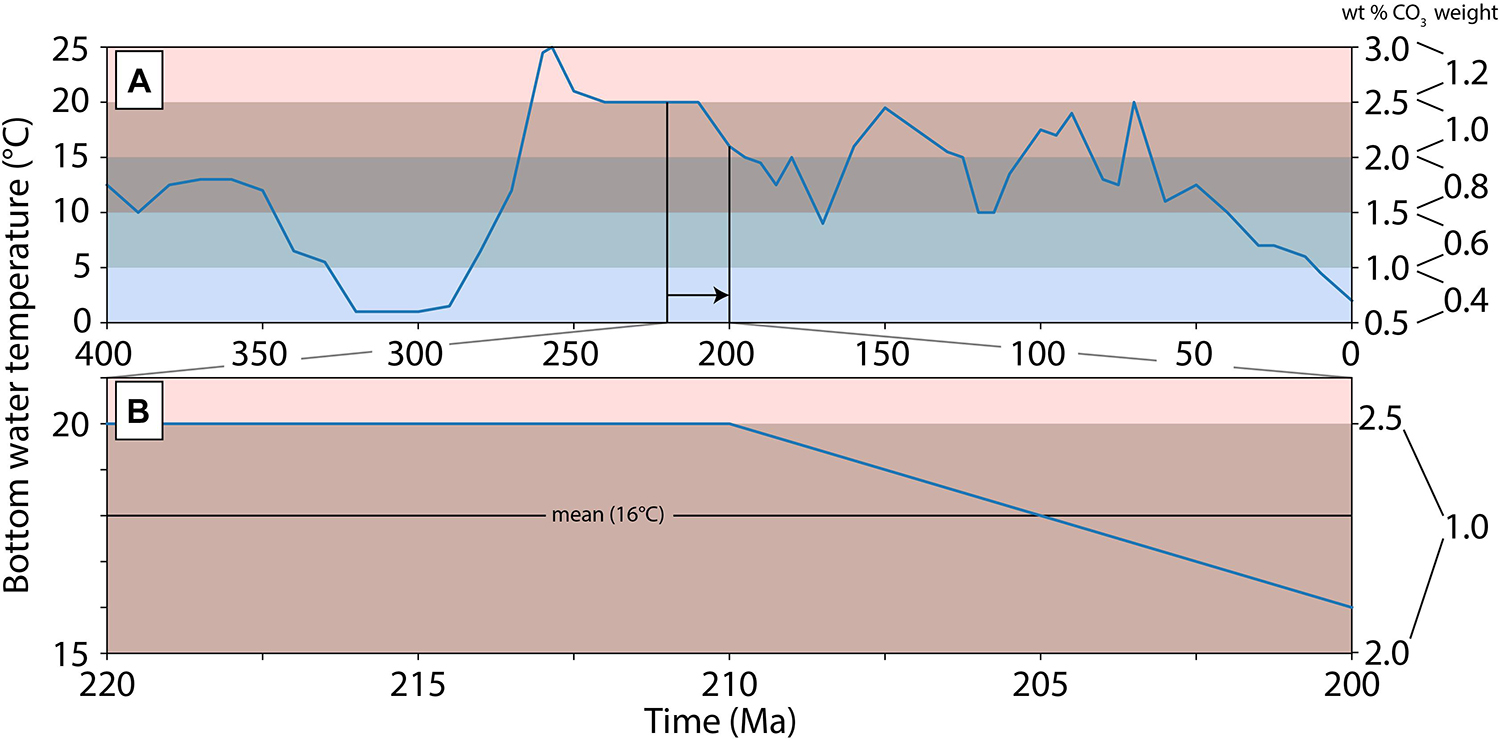
Figure 3. (A) Bottom water temperature curve from 400 to 0 Ma with a resolution of 10 Ma after Müller and Dutkiewicz (2018). Wt% carbonate and the applied weighting factor prescribed in 5°C bands. The bands are represented by the horizontal colored bars. (B) Calculated mean water temperature using a moving 20 Ma window to scale carbonate wt%. At each time step we perform (B) to determine the average bottom water temperature of a parcel of fresh oceanic crust.
The mean carbon wt% from Kelemen and Manning (2015) was calculated from all recovered oceanic basalt samples and used to calculate storage capacity only at present-day. From this, we prescribe a weighting of unity to bottom water temperature coinciding with the 15–20°C threshold identified by Müller and Dutkiewicz (2018), then scale each 5°C temperature bracket accordingly from factor 0.4 at 0–5°C to factor 1.2 at 20–25°C. This processing step is included as the relationship presented by Müller and Dutkiewicz (2018) was established using the same samples as Kelemen and Manning (2015). This results in scaling the values of carbon wt% in the upper volcanic layer drawn from the Kelemen and Manning (2015) data to better reflect the temporal history of ocean bottom water temperature. Thus, oceanic crust produced in cooler water (e.g., Miocene to present and the late Carboniferous) will have carbonate storage capacity scaled down, whilst oceanic crust produced during the Triassic, when bottom water was warmer, will be more enriched in carbonate (Figure 3A).
Subduction Zone Calculation
To calculate subduction flux we follow the methodology set out by Dutkiewicz et al. (2019). This approach tessellates subduction zones in a given GPlates plate reconstruction along the great circle of each straight-line segment of the polyline representing the subduction zone. Subduction polarity is accounted for to ensure that only raster cells located on the downgoing plate are used to calculate subduction flux. The thickness of carbon or serpentinite along the subduction segment is found from a raster of values. Convergence rates are extracted for each tessellated subduction segment, and volume is calculated by multiplying thickness with tessellation width and the local convergence rate.
Bringing It All Together
The distribution and storage of both carbon and serpentinite in upper oceanic lithosphere is a function of mid-ocean ridge processes that have occurred continuously for at least the last 200 Ma (Alt and Teagle, 1999; Cannat et al., 2010). Our approach brings the previously described components together to calculate the volume of carbonate and serpentinite at each time step along mid-ocean ridge segments where upper oceanic lithosphere crystallizes.
We distinguish crust forming at mid-ocean ridges prior to 160 Ma from younger times as only 20% of seafloor older than 160 Ma is preserved at the present day (Torsvik et al., 2010; Torsvik and Cocks, 2016; Domeier and Torsvik, 2017). Ocean crust that formed more recently than 160 Ma store the thickness of carbonate as a sum of the constituent layers of upper oceanic lithosphere. In calculating the amount of carbon stored we first establish two variables: (i) the total thickness of the crustal column, and (ii) the proportion of peridotite, which also implicitly provides us with an estimated magmatic proportion of the crust. Both of these components are drawn randomly from normal distributions for thickness and peridotite proportion, as observed at the present day (Table 1). At intermediate and fast spreading ridges where magmatic spreading dominates, we subdivide the resulting volcanic component into sublayers, each with their own specific thicknesses (Alt and Teagle, 1999). Each sublayer is then assigned a wt% of carbonate (Kelemen and Manning, 2015), with values drawn randomly from a uniform distribution (Table 1). Small portions of peridotite may be exposed at the base of the crust and undergo minor serpentinization. These observations of serpentinized peridotite are also included in our calculation, but given the scarcity of peridotite (<10%) and low degree of serpentinization (<10%), they typically make up less than 1% of the total rock volume available for carbon storage at intermediate and fast spreading ridges. At slow and ultraslow ridges where amagmatic spreading dominates, lenses of gabbros are included within the exhumed peridotite and are considered to be the only volcanic component present in our model. Gabbros are treated in the same way as at fast ridges, where a wt% of carbon present is drawn at random from the distribution defined in Kelemen and Manning (2015). The carbon stored in the serpentinized peridotite component of these ridges ranges between 0.32 and 0.36 wt% at 100% serpentinization, decreasing linearly to 0 wt% at 0% serpentinization. We apply this to the serpentinization model described above (section “Properties of Upper Oceanic Lithosphere”), such that the carbon wt% remains constant to dInflex, before then decreasing linearly to 0 wt% at dBot.
For upper oceanic lithosphere forming prior to 160 Ma and located within the Panthalassa Ocean, we follow the same procedure as above for crust younger than 160 Ma with one exception. For these ridge segments we randomly sample the distribution of Pacific Ocean spreading rate (e.g., Figure 1H). The spreading rate from this distribution is then used in our calculation to characterize the lithosphere (magmatic vs. amagmatic) and calculate an estimated cumulative thickness of carbon storage and serpentinite formation. We multiply the thickness in these cases by the sampled spreading rate. This approach records the cumulative vertical area of carbon and serpentinite storage between two hypothetical isochrons perpendicular to the spreading direction instead of cumulative thickness of a crustal profile. When these portions of lithosphere reach a subduction zone, we multiply them only by the length of subduction. Internal oceans prior to 160 Ma use the spreading rate taken directly from the plate model, as their spreading histories are constrained by a combination of geological and palaeomagnetic data.
Our analysis begins at 400 Ma and progresses toward 0 Ma. At t = 400 Ma (i.e., start time) we tessellate each ridge segment at a resolution of 2 arc degrees along the segment’s great circle to ensure sufficient coverage. At these points (mid-points of each tessellated segment), we perform our calculation for carbon storage and serpentinite formation, resulting in each point being associated with a latitude, longitude and a z-value (which consists of the thickness of carbon, serpentinite, and the crustal composition, e.g., thickness of different layers, proportion of peridotite). We also determine the average bottom water temperature for the next 20 Ma at each timestep, and apply a modifier to the wt% of carbonate in the upper volcanic layer (section “Bottom Water Temperature”). Using stage rotations from the plate model we rotate these points forward in time in 1 Ma increments, preserving the z-values that were calculated at the ridge segment. At each time step (i.e., t = 399 Ma), we repeat the calculation (carbon and serpentinite storage and formation) for the next set of points at the mid-ocean ridge, representing newly formed crust. We then rotate these new, ridge segment points, along with any current points from previous timesteps, forward in time using the plate model. At each timestep we perform a subduction test after Williams (2019)3 (see the section “Method and Code”). This process is repeated until the analysis end time is reached.
Table 1 details which parameter values are chosen by random sampling, the distributions from which they are drawn, and the dependency of each parameter on other randomly sampled parameters. The Pearson correlation coefficient of each parameter is presented in Figure 4. Peridotite percent is negatively correlated with the thickness of other rock types, as these are a function of volcanic percentage which constitutes the non-peridotite component of the rock column.
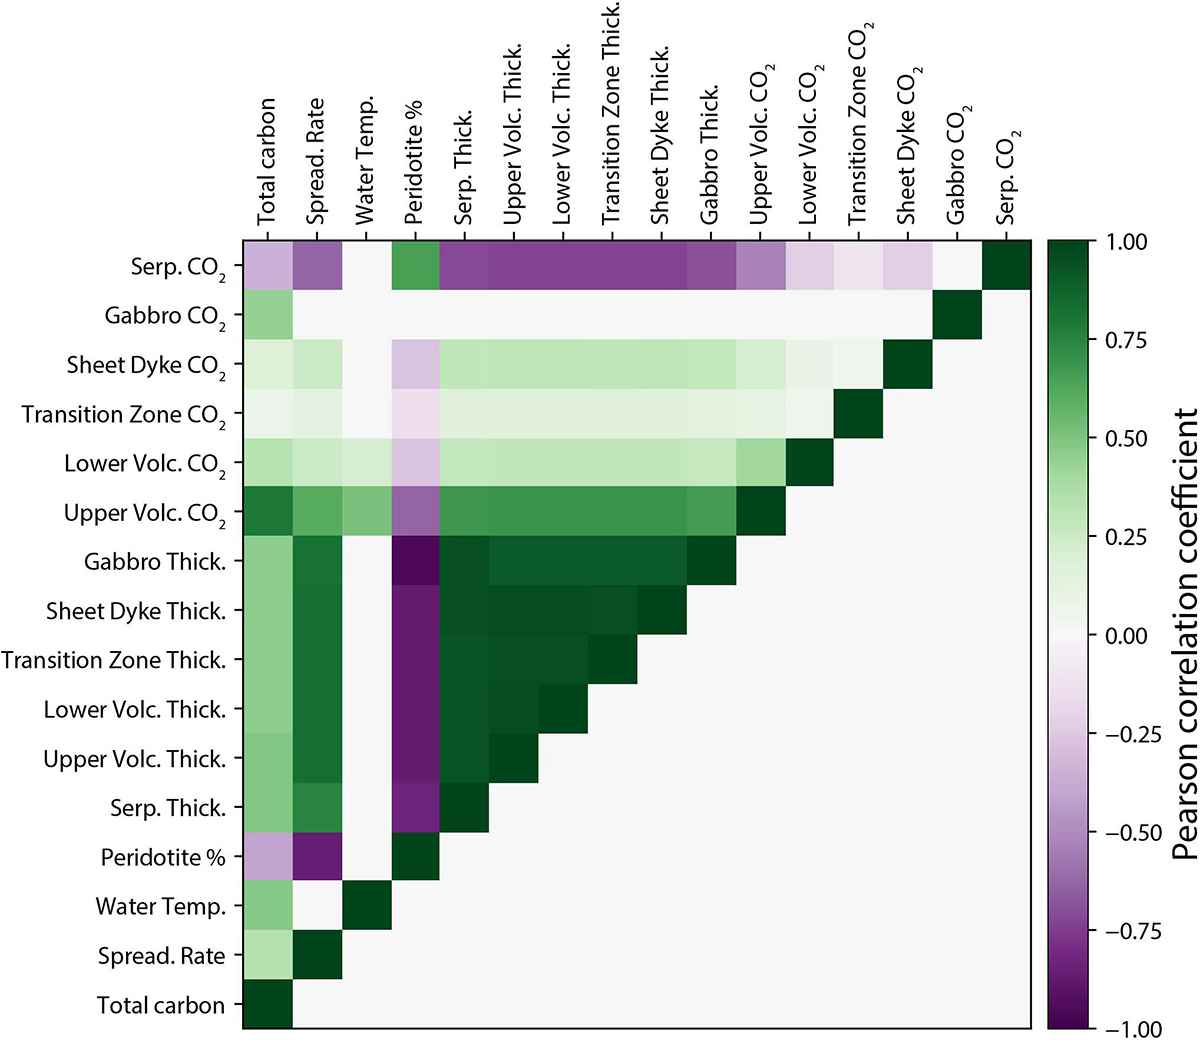
Figure 4. Pearson correlation coefficients between each parameter that contributes to the total carbon content of any point in the ocean crust. The correlation coefficient is calculated with 107 samples drawn at random from the distributions given in Table 1 to ensure a sufficient number of samples across the full range of possible values. The data used to calculate our model follow identical statistical relationships.
To facilitate community efforts and future developments, we provide interactive Project Jupyter notebooks4 and associated metadata of our methodology with this publication (Supplementary Material 7).
Results
Model Uncertainty
Our approach to estimate carbon flux in subduction zones requires the characterization of upper oceanic lithosphere through time, from which we can extract the total thicknesses of carbon and serpentinite stored and formed in the lithospheric profile. From this, area and volume become a function of spreading/convergence rate and ridge/subduction length, respectively. Carbon storage in oceanic crust is dominated by the upper volcanic layer (top ∼300 m of crust), although both the sheeted dyke complexes and gabbros contribute a significant proportion (∼40% of the total), as they have a greater proportional thickness in the oceanic crust column (Figures 5A,B, see Supplementary Material 1, 2 for tables of results). This translates to a cumulative transport point thickness of roughly 3–4 m of carbon in oceanic crust formed at a fast spreading ridge assuming a bottom water temperature of 12°C. Oceanic lithosphere exhumed at slow ridges also sequesters carbon at a similar order of magnitude to fast ridges (thickness of ∼1.5 m). This carbon is predominantly stored in altered peridotite (thickness of ∼1.15 m), though gabbroic lenses which are also formed at slow ridges contribute a similar amount of carbon (thickness of ∼0.3 m) (Figures 5C,D). Colder bottom water, such as at present day, scale down the amount of carbon stored, while warmer water during the Triassic and Jurassic acts to scale the values up. Consequently, ocean crust forming since the Cretaceous is only 25–50% as enriched with carbonate as that formed during the Triassic and Jurassic. Serpentinite itself is almost entirely found at slow and ultraslow spreading ridges, where it forms ∼33% of the rock column, with remnant gabbroic lenses and unaltered peridotite forming the other components (in our model each occupies a similar thickness of 1000–1300 m) (Figure 5D). At fast ridges, the thickness of serpentinite is two orders of magnitude lower (73 ± 60 m), making up less than 1% of the total column and the corresponding storage of carbonate in serpentinite here is almost completely negligible (thickness of ∼0.06 m) (Figure 5A).
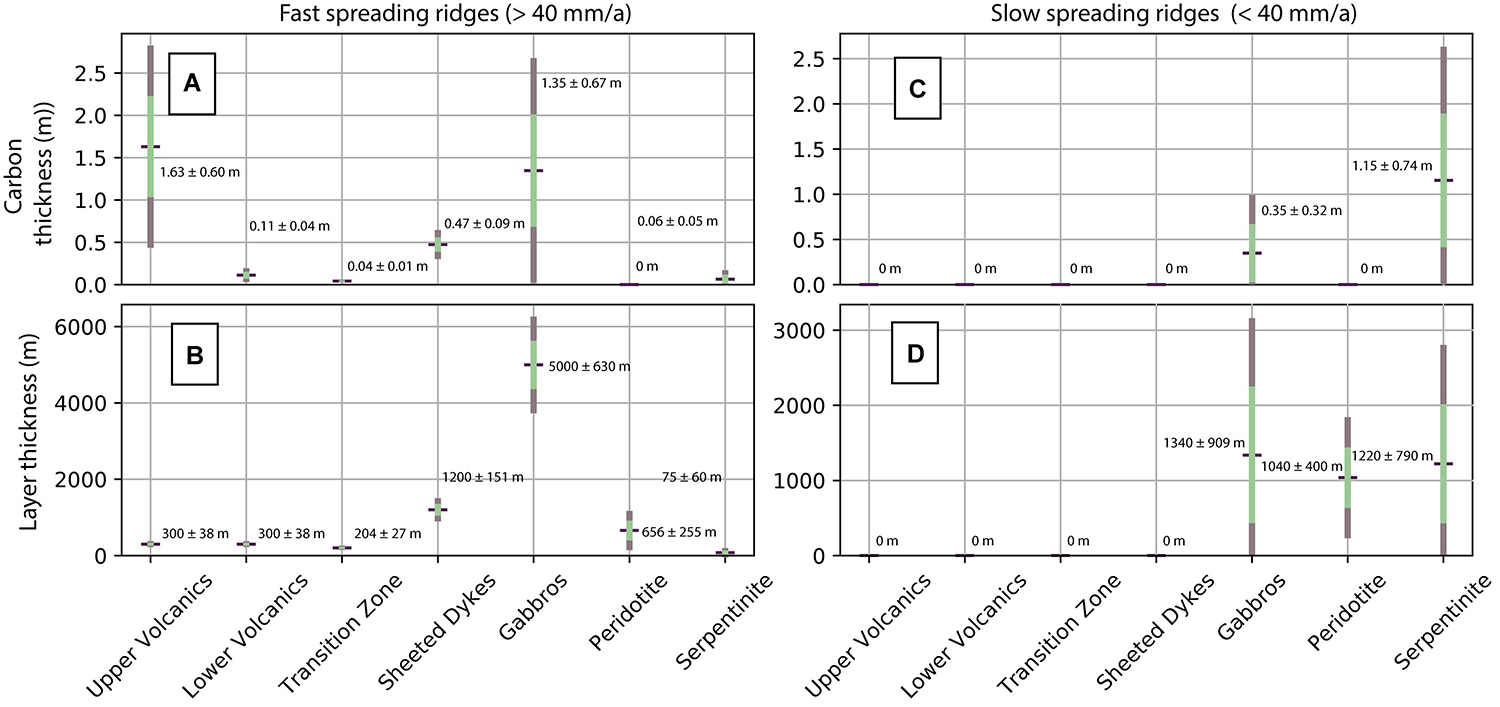
Figure 5. Summary of predicted crustal and carbon storage thicknesses at fast and slow spreading ridges from our model and the carbonate values from Kelemen and Manning (2015). A spreading rate drawn randomly from the present-day distribution of global spreading rates preserved in ocean basins (37 ± 27 mm/a) is used to initiate the calculation. Using this spreading rate, we determine the thickness of the different oceanic crust components and their corresponding carbon thickness. To ensure components are adequately sampled, this process was repeated 10000 times. The average bottom water temperature of the last 400 Ma, 12°C (Müller and Dutkiewicz, 2018), was used in the calculation, meaning the thicknesses are ∼60% of expected thicknesses assuming warm bottom water (∼20°C). Purple shows the maximum range of values, with one standard deviation highlighted in green. Text in the panels describes the mean and one standard deviation. (A) Range of possible carbon thicknesses for each lithological unit in crust produced at fast spreading ridges. (B) Range of possible thicknesses of each lithological unit in crust produced at fast spreading ridges. (C) Range of possible carbon thicknesses for each lithological unit in crust produced at slow spreading ridges. (D) Range of possible thicknesses of each lithological unit in crust produced at slow spreading ridges.
We present the conditional probability of the total carbon content in any crustal segment, given a known spreading rate, including all possible variations of every parameter (Figure 6). This shows both the full distribution of possible carbon content at any spreading rate and how any error or uncertainty impacts the total carbon content. The possible range of carbon storage is much greater at higher spreading rates because of larger variations in volcanic structure. There are clear changes in the distribution of carbon content at spreading rates of 20 and 40 mm/a (Table 1). These points are where the uncertainty in spreading rate will have the largest effect, tipping the lithosphere into a different carbon-storage regime. Away from these points, even relatively large uncertainties in spreading rate will have minimal effect on the distribution of possible carbon content. This range of possible values is sampled according to the modeled spreading rates to produce the distributions shown in Figures 5, 6. These give an estimate of the uncertainty of our results, including all of the uncertainties in the geochemical data. The wide range of possible values does not obscure the large-scale patterns seen in our model, which are caused by variations in spreading and subduction rates.
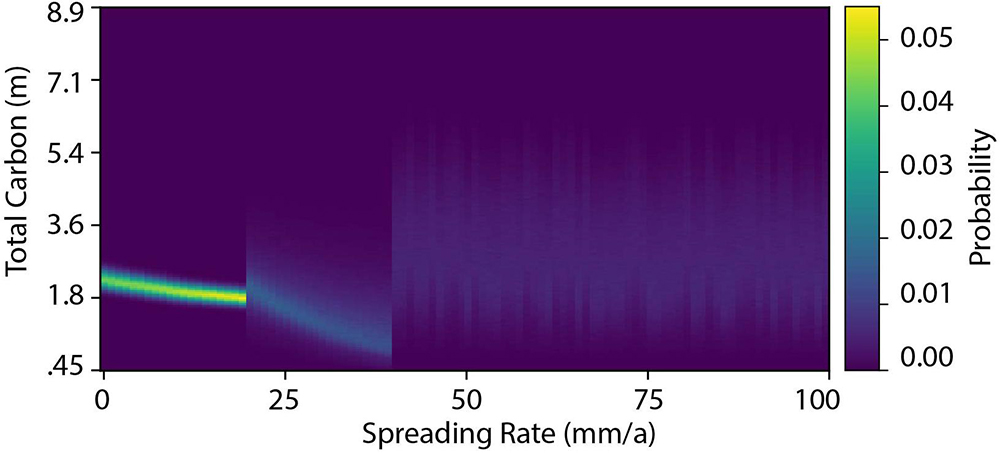
Figure 6. Conditional probability of the value of total carbon sequestered in ocean crust as a function of the spreading rate of the ridge at which it formed, with the ranges determined by all the variation in parameters listed in Table 1.
Results
We present our results initially as distributions using the Pacific Ocean spreading rate (POSR) data, with a comparison between the POSR and plate model spreading rate (PMSR) following this section. The results for carbon storage and flux in ocean basins have temporal and spatial variability (e.g., Figures 7A,B, 8). Our model suggests that at present-day between 20 and 60 Mt of carbon are sequestered at mid-ocean ridges (Figure 7A) and between 20 and 40 Mt of carbon are entering subduction zones (Figure 7B). Levels of carbon sequestration at mid-ocean ridges peak during the Early Cretaceous (250–300 Mt/a at ca. 150–130 Ma, Figure 7A) and just prior to the Carboniferous-Permian boundary (250–350 Mt/a at ca. 255–250 Ma). These results show that between these two peaks (during the Permian–Jurassic), carbon sequestration was at a slightly higher level than over the last 50 Ma, about 1.3 times present-day values. The mass of subducted carbon exhibits a similar but less pronounced pattern, with our estimates suggesting between 15 and 60 Mt/a of carbon being subducted during the Carboniferous, before decreasing to 15–40 Mt/a until the Cretaceous (Figure 7B). By 150 Ma our results suggest greater than 65 Mt/a of carbon were being subducted, remaining at a similar level for most of the Cretaceous before decreasing from ca. 75 Ma toward present-day (Figure 7B).
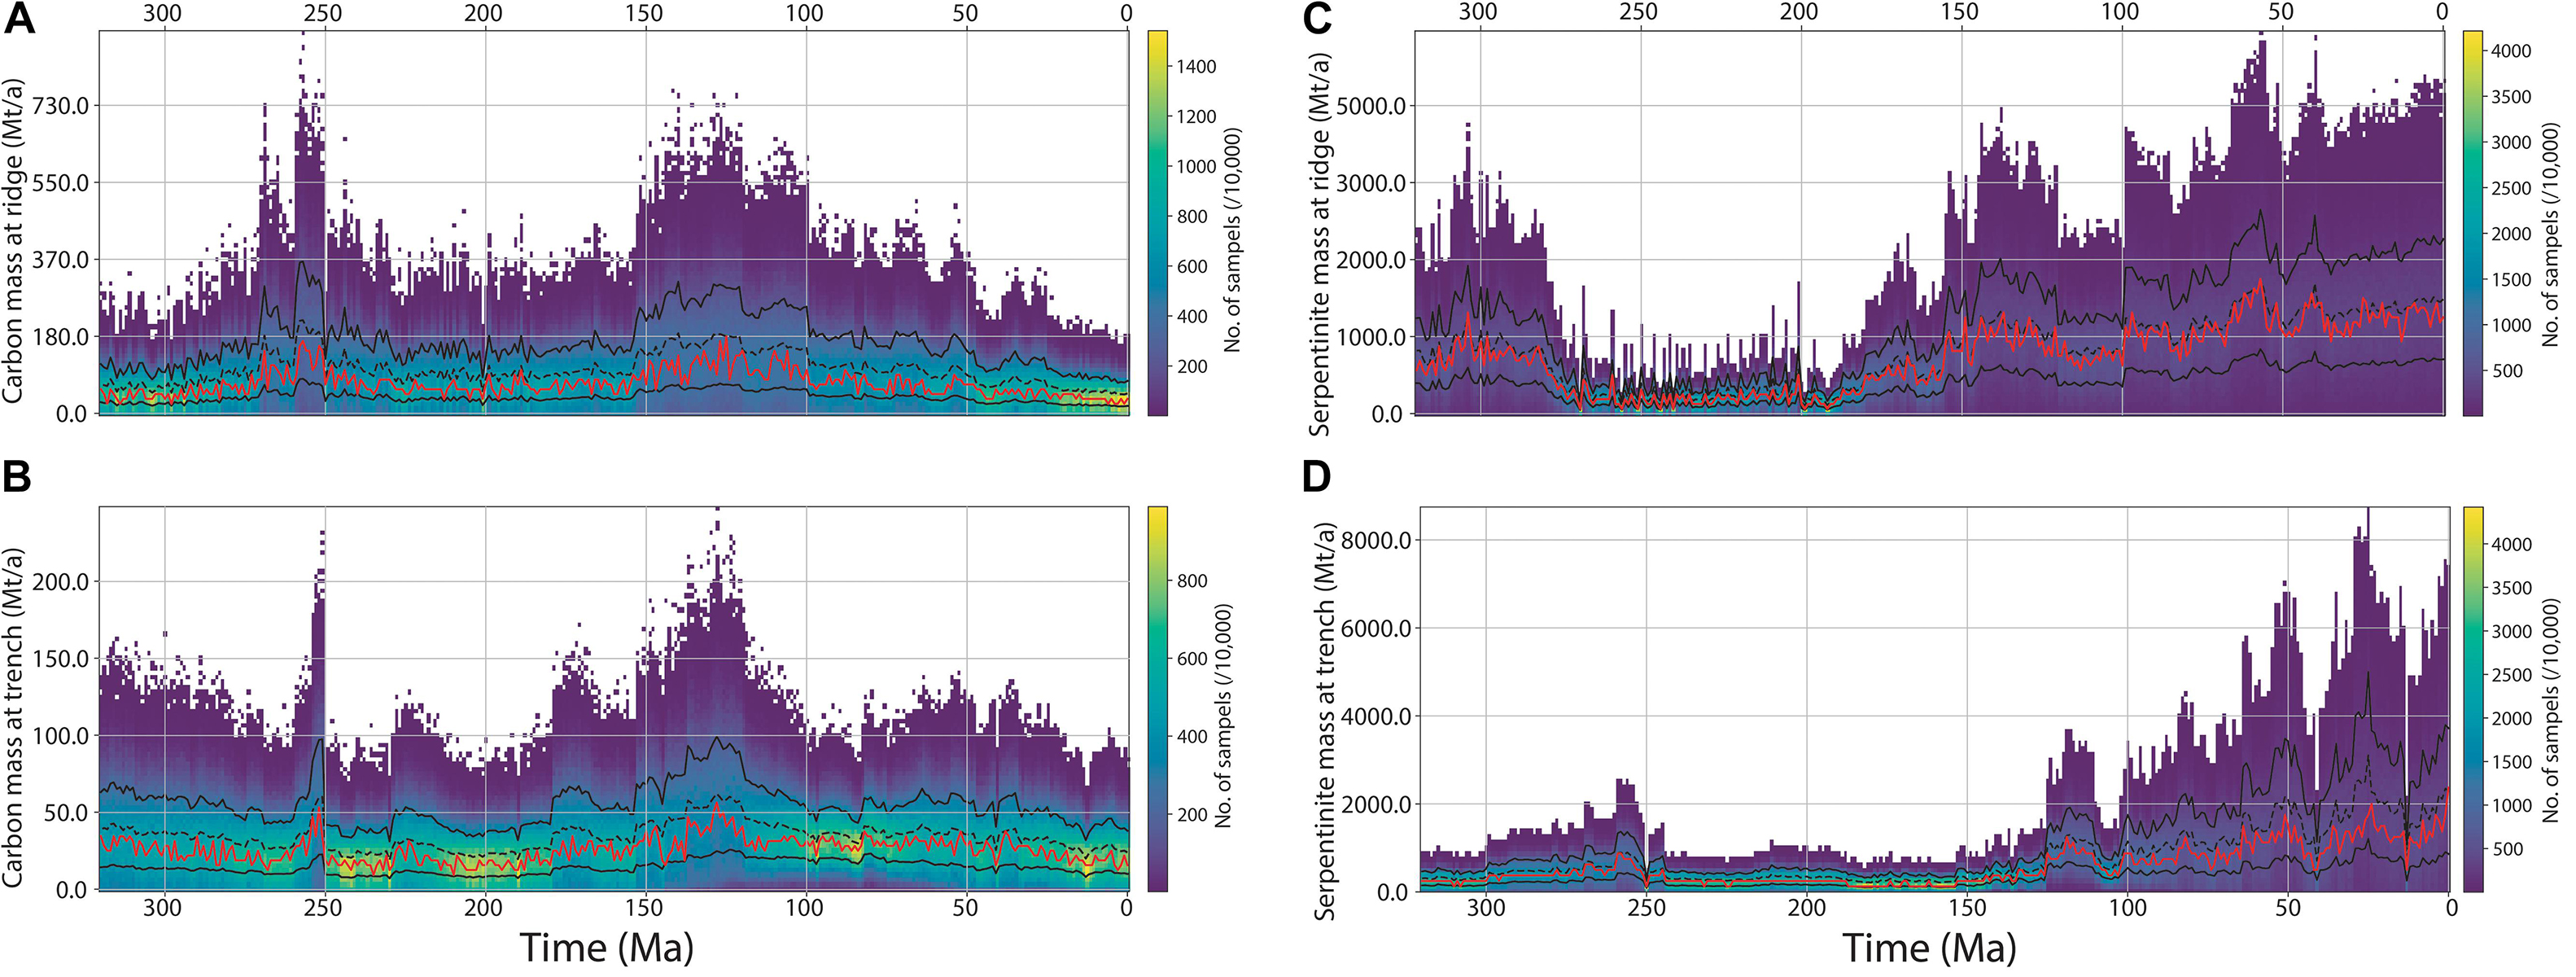
Figure 7. Distributions (10000 samples) of (A) mass of carbon sequestrated at mid-ocean ridges, (B) mass of carbon entering a subduction zone, (C) mass of serpentinite formation at mid-ocean ridges, and (D) mass of serpentinite entering a subduction zone. Red line is mode of samples, dashed black line is mean (∼, to mode for C), and solid black lines show 1 standard deviation from the mean. The carbon distribution is skewed to the right.
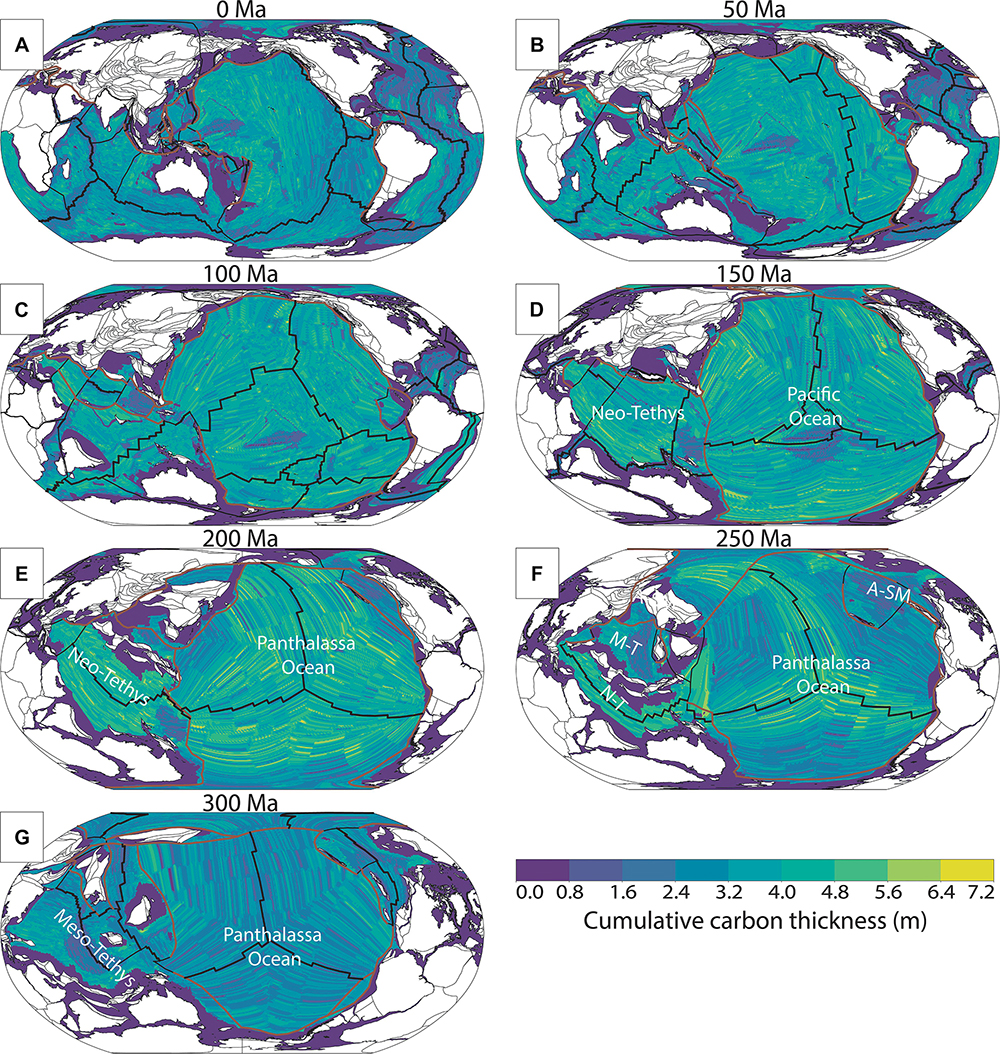
Figure 8. (A–G) Cumulative thickness of carbon sequestered adjacent to mid-ocean ridges and transported in the upper oceanic lithosphere through ocean basins toward subduction zones since 300 Ma in 50 Ma intervals (see Supplementary Material 3 for 1 Ma grids and rasters and Supplementary Material 5 for an animation). Thicknesses calculated prior to 160 Ma are converted from vertical area to point thickness. A-SM, Alexander-Stoney Mountain ocean basin; M-T, Meso-Tethys Ocean; N-T, Neo-Tethys Ocean. Purple areas represent lithosphere not covered by our analysis or the plate model, such as submerged continental lithosphere or lithosphere trapped between a continent and a subduction zone (principally in the Palaeozoic), which would represent earlier (pre-400 Ma) oceanic crust. Black lines are mid-ocean ridges, brown lines are subduction zones.
The Pacific and Panthalassa Oceans are the two ocean basins with the highest carbon storage, irrespective of bottom water temperature (Figure 8). During times of warm bottom water (250–200 Ma) carbon storage in the Pacific and Panthalassa oceans reaches approximately 7 m at maximum (∼0.1 wt% of seafloor production, e.g., Figures 8E,F), although during times of cool bottom water (300 Ma and present-day) the thickness is between 1 and 2.5 m (∼0.05 wt% of seafloor production, e.g., Figures 8A,G). The maximum amount of sequestered carbon during the Triassic is matched only during the breakup of Pangea (ca. 150–100 Ma), when the water temperature was lower but global mid-ocean ridge length much longer (Müller and Dutkiewicz, 2018; Figure 7A), resulting in a higher availability of fresh basalt for alteration.
Serpentinite mass exhibits a different trend, with both storage and subduction masses showing a much stronger temporal and spatial variability than carbon (Figures 7C,D, 9). The Carboniferous is marked by higher production of serpentinite, between 500 and 2000 Mt/a (Figures 7C, 9G). This drops rapidly at ca. 275 Ma to between 250 and 500 Mt/a, before slowly increasing from ca. 200 Ma to present-day to values between 700 and 2200 Mt/a (Figure 7C). The largest mass of serpentine produced is at ca. 60 Ma (Figure 7C). Significant spikes in the amount of serpentinite being subducted begin from ca. 120 Ma (Figure 7D), with some areas of the Pacific Ocean producing small pockets of serpentinite from ca. 200 Ma that reach the Andean and New Zealand margins during the Cretaceous (Figures 9C,D).
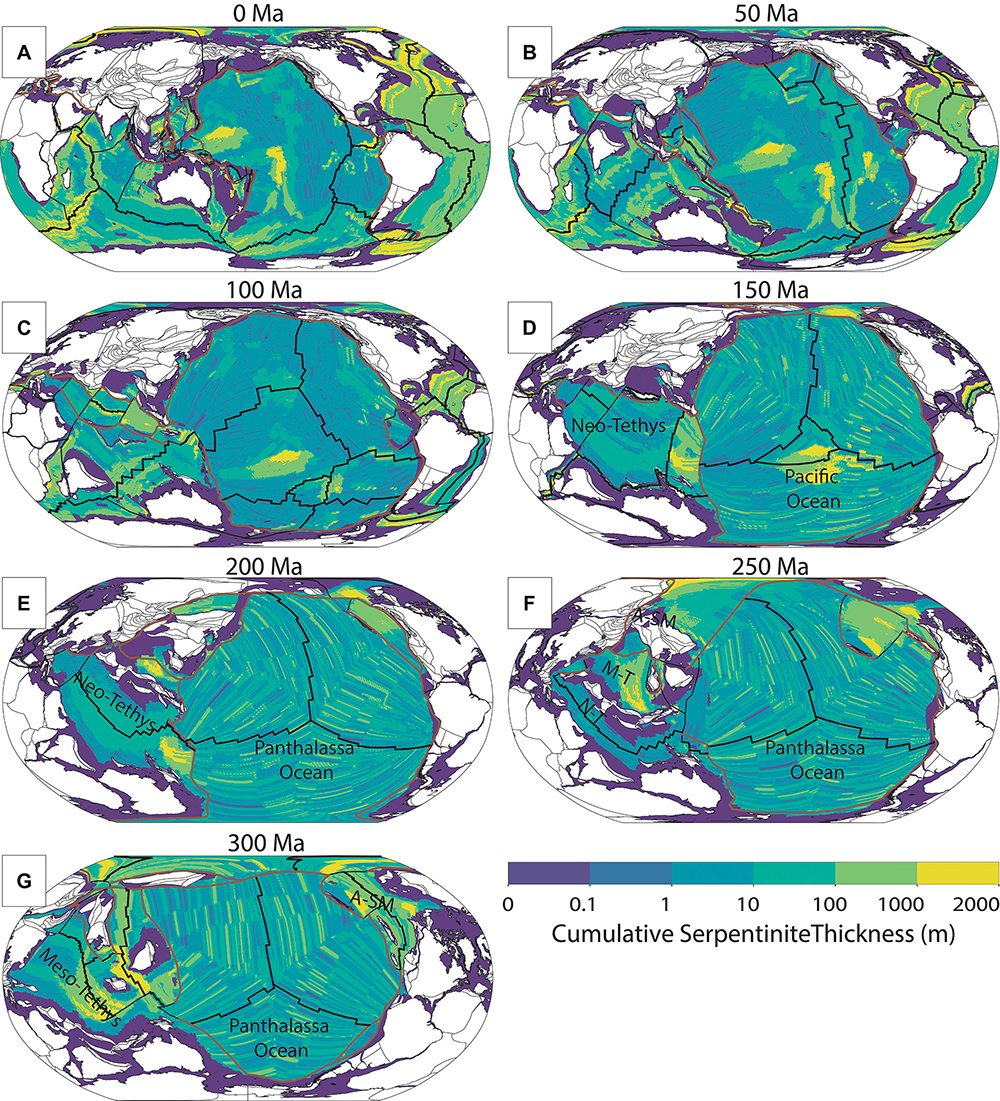
Figure 9. (A–G) Cumulative thickness of serpentinite formed near mid-ocean ridges and transported in the upper oceanic lithosphere through ocean basins toward subduction zones since 300 Ma in 50 Ma intervals (see Supplementary Material 4 for 1 Ma grids and rasters, and Supplementary Material 6 for an animation). Thicknesses calculated prior to 160 Ma are converted from vertical area to point thickness. Since Pangea breakup, our model suggests extensive serpentinite formation in the Arctic, Atlantic, and Indian oceans. A-SM, Alexander-Stoney Mountain ocean basin; M-T, Meso-Tethys Ocean; N-T, Neo-Tethys Ocean. Purple areas represent lithosphere not covered by our analysis or the plate model, such as submerged continental lithosphere or lithosphere trapped between a continent and a subduction zone (principally in the Palaeozoic), which would represent earlier (pre-400 Ma) oceanic crust. Black lines are mid-ocean ridges, brown lines are subduction zones.
The production of serpentinites for pre-Jurassic times is principally controlled by the evolution of the Meso-Tethys Ocean and the Alexander-Slide Mountain ocean basin that opened on the northwestern margin of Laurentia (Matthews et al., 2016; Figures 9E–G). This is because their modeled spreading rates are low enough (<40 mm/a) that our methodology treats them as exposing large amounts of peridotite that is serpentinized. Hence, the opening and closure of these oceans result in the only significant disparity in serpentinite subduction prior to the Jurassic at ca. 180 Ma as the Panthalassa Ocean makes up the rest of the globe’s ocean basins. The majority of serpentinite produced in the last 320 Ma currently resides in the Atlantic, Indian and Arctic oceans, whereas the Pacific and Panthalassa oceans are relatively barren (Figure 9A). Consequently, for more recent times small onsets of subduction in the Atlantic and Indian oceans act as principal drivers for the subsequent peaks from 100 Ma to present.
Plate Model vs. Pacific Ocean Spreading Rates
In this study, we compare our results which use the geologically recent (83–0 Ma) Pacific Ocean spreading rates (POSRs) as a proxy for the Panthalassa Ocean between 400 and 160 Ma, with a calculation that directly incorporated the PMSR from the reconstruction of Matthews et al. (2016) (Figure 10). To the first-order, there is little difference between both approaches, suggesting that for analysis of ocean basin lithosphere properties and dynamics existing plate models of the Palaeozoic produce reasonable estimates of carbon and serpentinite storage. However, there are some specific times where the approaches deviate as a consequence of how spreading rate is modeled in both approaches.
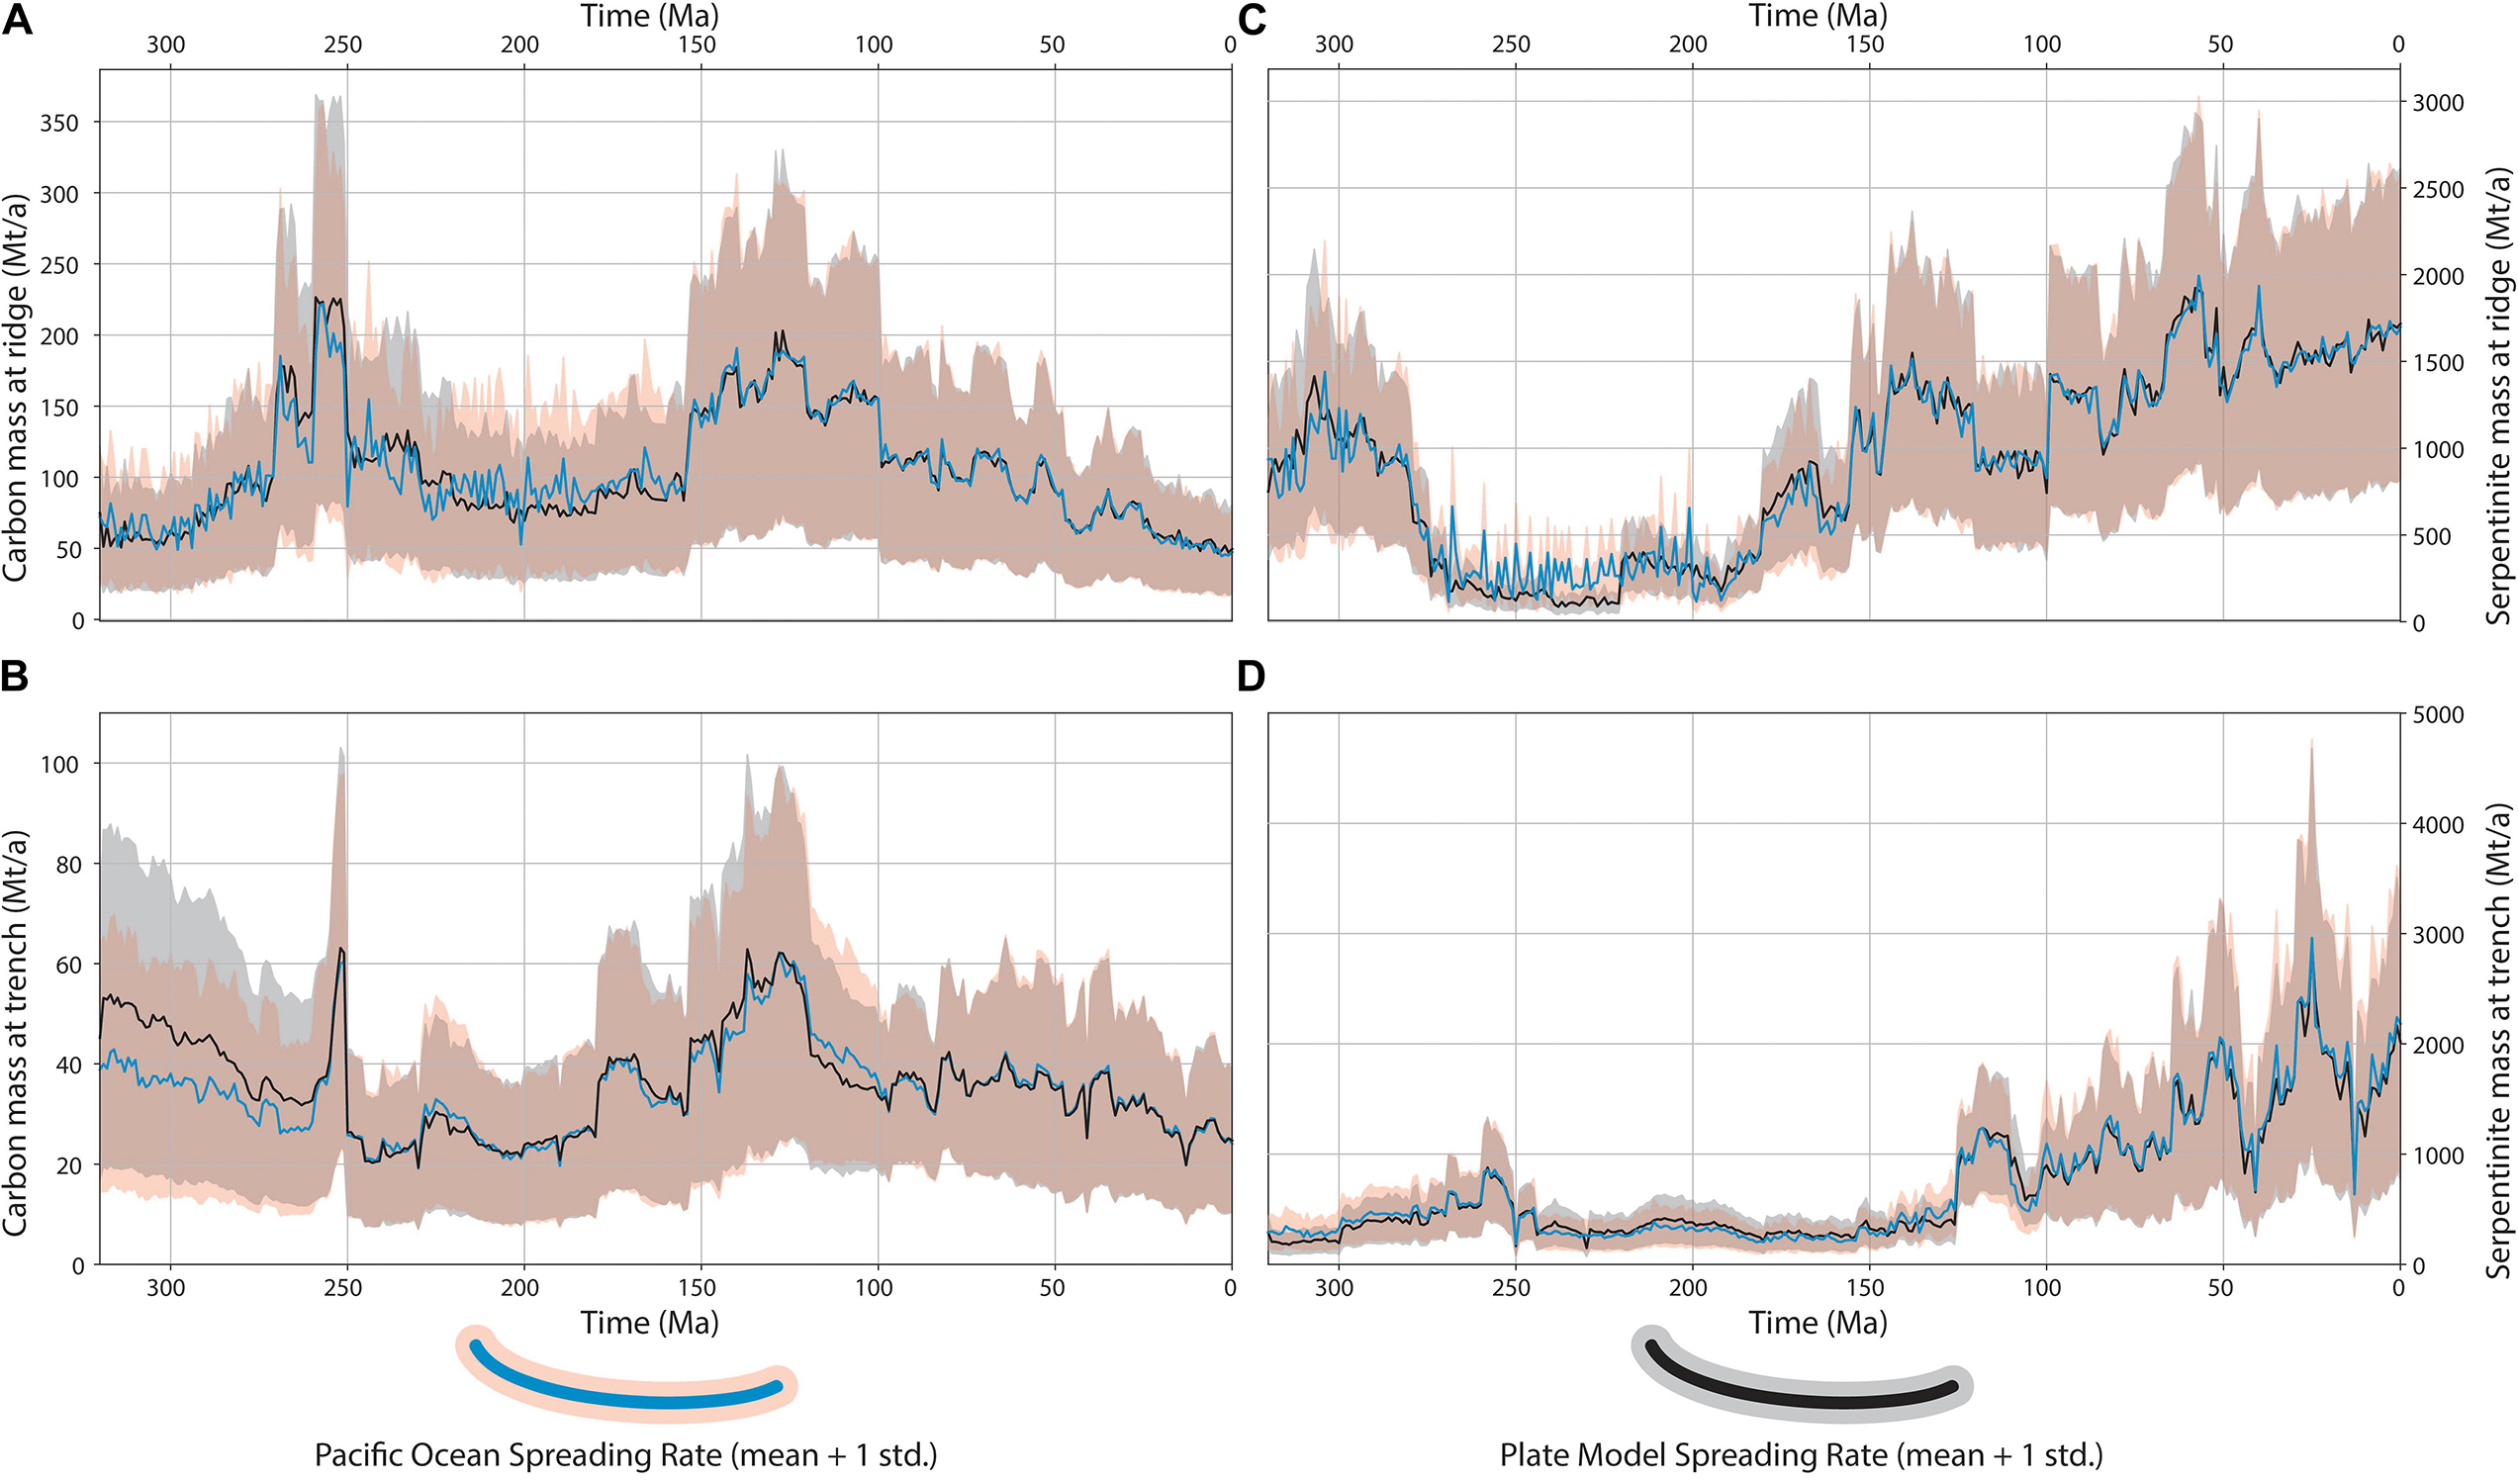
Figure 10. Comparison of two approaches used in this analysis, POSR (red shaded area and blue line are one standard deviation and mean, respectively), and PMSR (gray shaded area and black line are one standard deviation and mean, respectively). (A) Carbon sequestration at ridges in altered ocean lithosphere, (B) carbon mass in altered ocean lithosphere at trenches, (C) serpentinite mass from altered mantle peridotite at ridges, and (D) serpentinite mass in altered mantle peridotite at trench.
The sequestration and delivery of carbon from ridges to trenches is reasonably similar across both models (Figures 10A,B). In the POSR model, carbon sequestration displays a series of spikes occurring between 220 and 160 Ma. These are likely a consequence of passing a new spreading rate in at each timestep, resulting in a more pronounced temporal variation (Figure 10A). Key deviations of sequestration occur between 270 and 230 Ma, where the PMSR model suggests more carbon was being stored than the POSR model. In particular, we highlight the peak of carbon sequestration suggested in the PMSR between 255 and 250 Ma, which is not reflected in the POSR results (Figure 10A). This is important because this time coincides with the P-T mass extinction event and an incredibly pronounced change in carbon capture occurring just prior (350 Mt/a to 200 Mt/a) to the event could potentially provide key insights into palaeoclimate drivers during this period. However, the comparison of our two approaches suggests that the extent of carbon capture at this time may be a consequence of artificially high spreading rates for Panthalassa. Between 320 and 260 Ma, the PMSRs suggesting an extra ∼25–30% of carbon was being delivered to trenches compared to the POSR results (PMSR upper bound of ∼85 Mt/a vs. ∼65 Mt/a for POSR) (Figure 10B). This is a direct function of a distribution of faster spreading rates in the plate model between 400 and 320 Ma (e.g., Figure 1H) compared to the distribution of slower spreading rates that are used in the POSR calculation. Unlike the sequestration estimates, the peak at ca. 255–250 Ma in carbon delivery at trenches is reflected in both POSR and PMSR results (Figure 10B).
Mass estimates of serpentinite between POSR and PMSR at ridges and trenches are also broadly similar, but with some key times of deviation. Formation of serpentinite at ridges deviates most strongly between 270 and 220 Ma, with the POSR model suggesting 3 times as much serpentinite could have formed at ridges (300 Mt/a vs. 100 Mt/a). This deviation is the most statistically significant across the entire evaluation, with the mean of each approach being separated by their standard deviation. This is due to the modeled Panthalassa spreading rates being consistently above 40 mm/a, with modal spreading rate between 100 and 150 mm/a (Figure 1H) from 250 to 220 Ma. As with carbon sequestration, the high variation of values during this time is most likely a function of passing in a unique spreading rate at each timestep. The delivery of serpentinite to trenches displays very little difference between the models. The POSR results suggest slightly more serpentinite is being delivered between 320 and 260 Ma, and also between 140 and 120 Ma. The earlier of these two deviations is barely statistically significant, with the mean of POSR result falling outside the deviation band of the PMSR result. The latter deviation is the result of the aforementioned spreading rate differences between 250 and 220 Ma.
Interpretation and Comparison of Results
The results of this study, which estimate the mass of subducted carbon sequestered in upper oceanic lithosphere, can be linked directly to seafloor production rates. This is in contrast to previous estimates of subducted carbon that typically rely only on the volume of rock entering subduction zones (Dasgupta and Hirschmann, 2010; Kelemen and Manning, 2015). Additionally, as most estimates are only given for present-day and do not include a time-dependent component, it is difficult to directly compare the results of this study against studies applying alternative approaches. At present day, Kelemen and Manning (2015) (hereby referred to as KM15) and Dasgupta and Hirschmann (2010) (hereby referred to as DH10) suggest a carbon flux at subduction zones of between 22 and 29 Mt/a and 12 and 61 Mt/a, respectively (Figures 11B,C). Our estimates, and those of Müller and Dutkiewicz (2018) (hereby referred to as MD18), suggest between 10–39 Mt/a and 15–25 Mt/a at present day, respectively: each within a similar range to those of KM15. The slightly reduced lower-range estimates of both our result and that of MD18 relative to KM15 and DH10 are likely due to two factors. First, both the results of this study and MD18 include the effect of bottom water temperature on carbon storage, which given the cooler waters since the Cretaceous (Lear et al., 2000), result in slightly lower estimates at present-day (carbon crustal mean of 0.11 wt% instead of 0.196 wt% in KM15). Secondly, the estimated subduction zone length at present day differs between KM15 and both MD18 and our study (45000 km vs. 55000 km, respectively). None-the-less, the range estimated by KM15 encompasses our mean (∼28 Mt/a) and lies just above the modal distribution at present-day (15–18 Mt/a, Figure 7B).
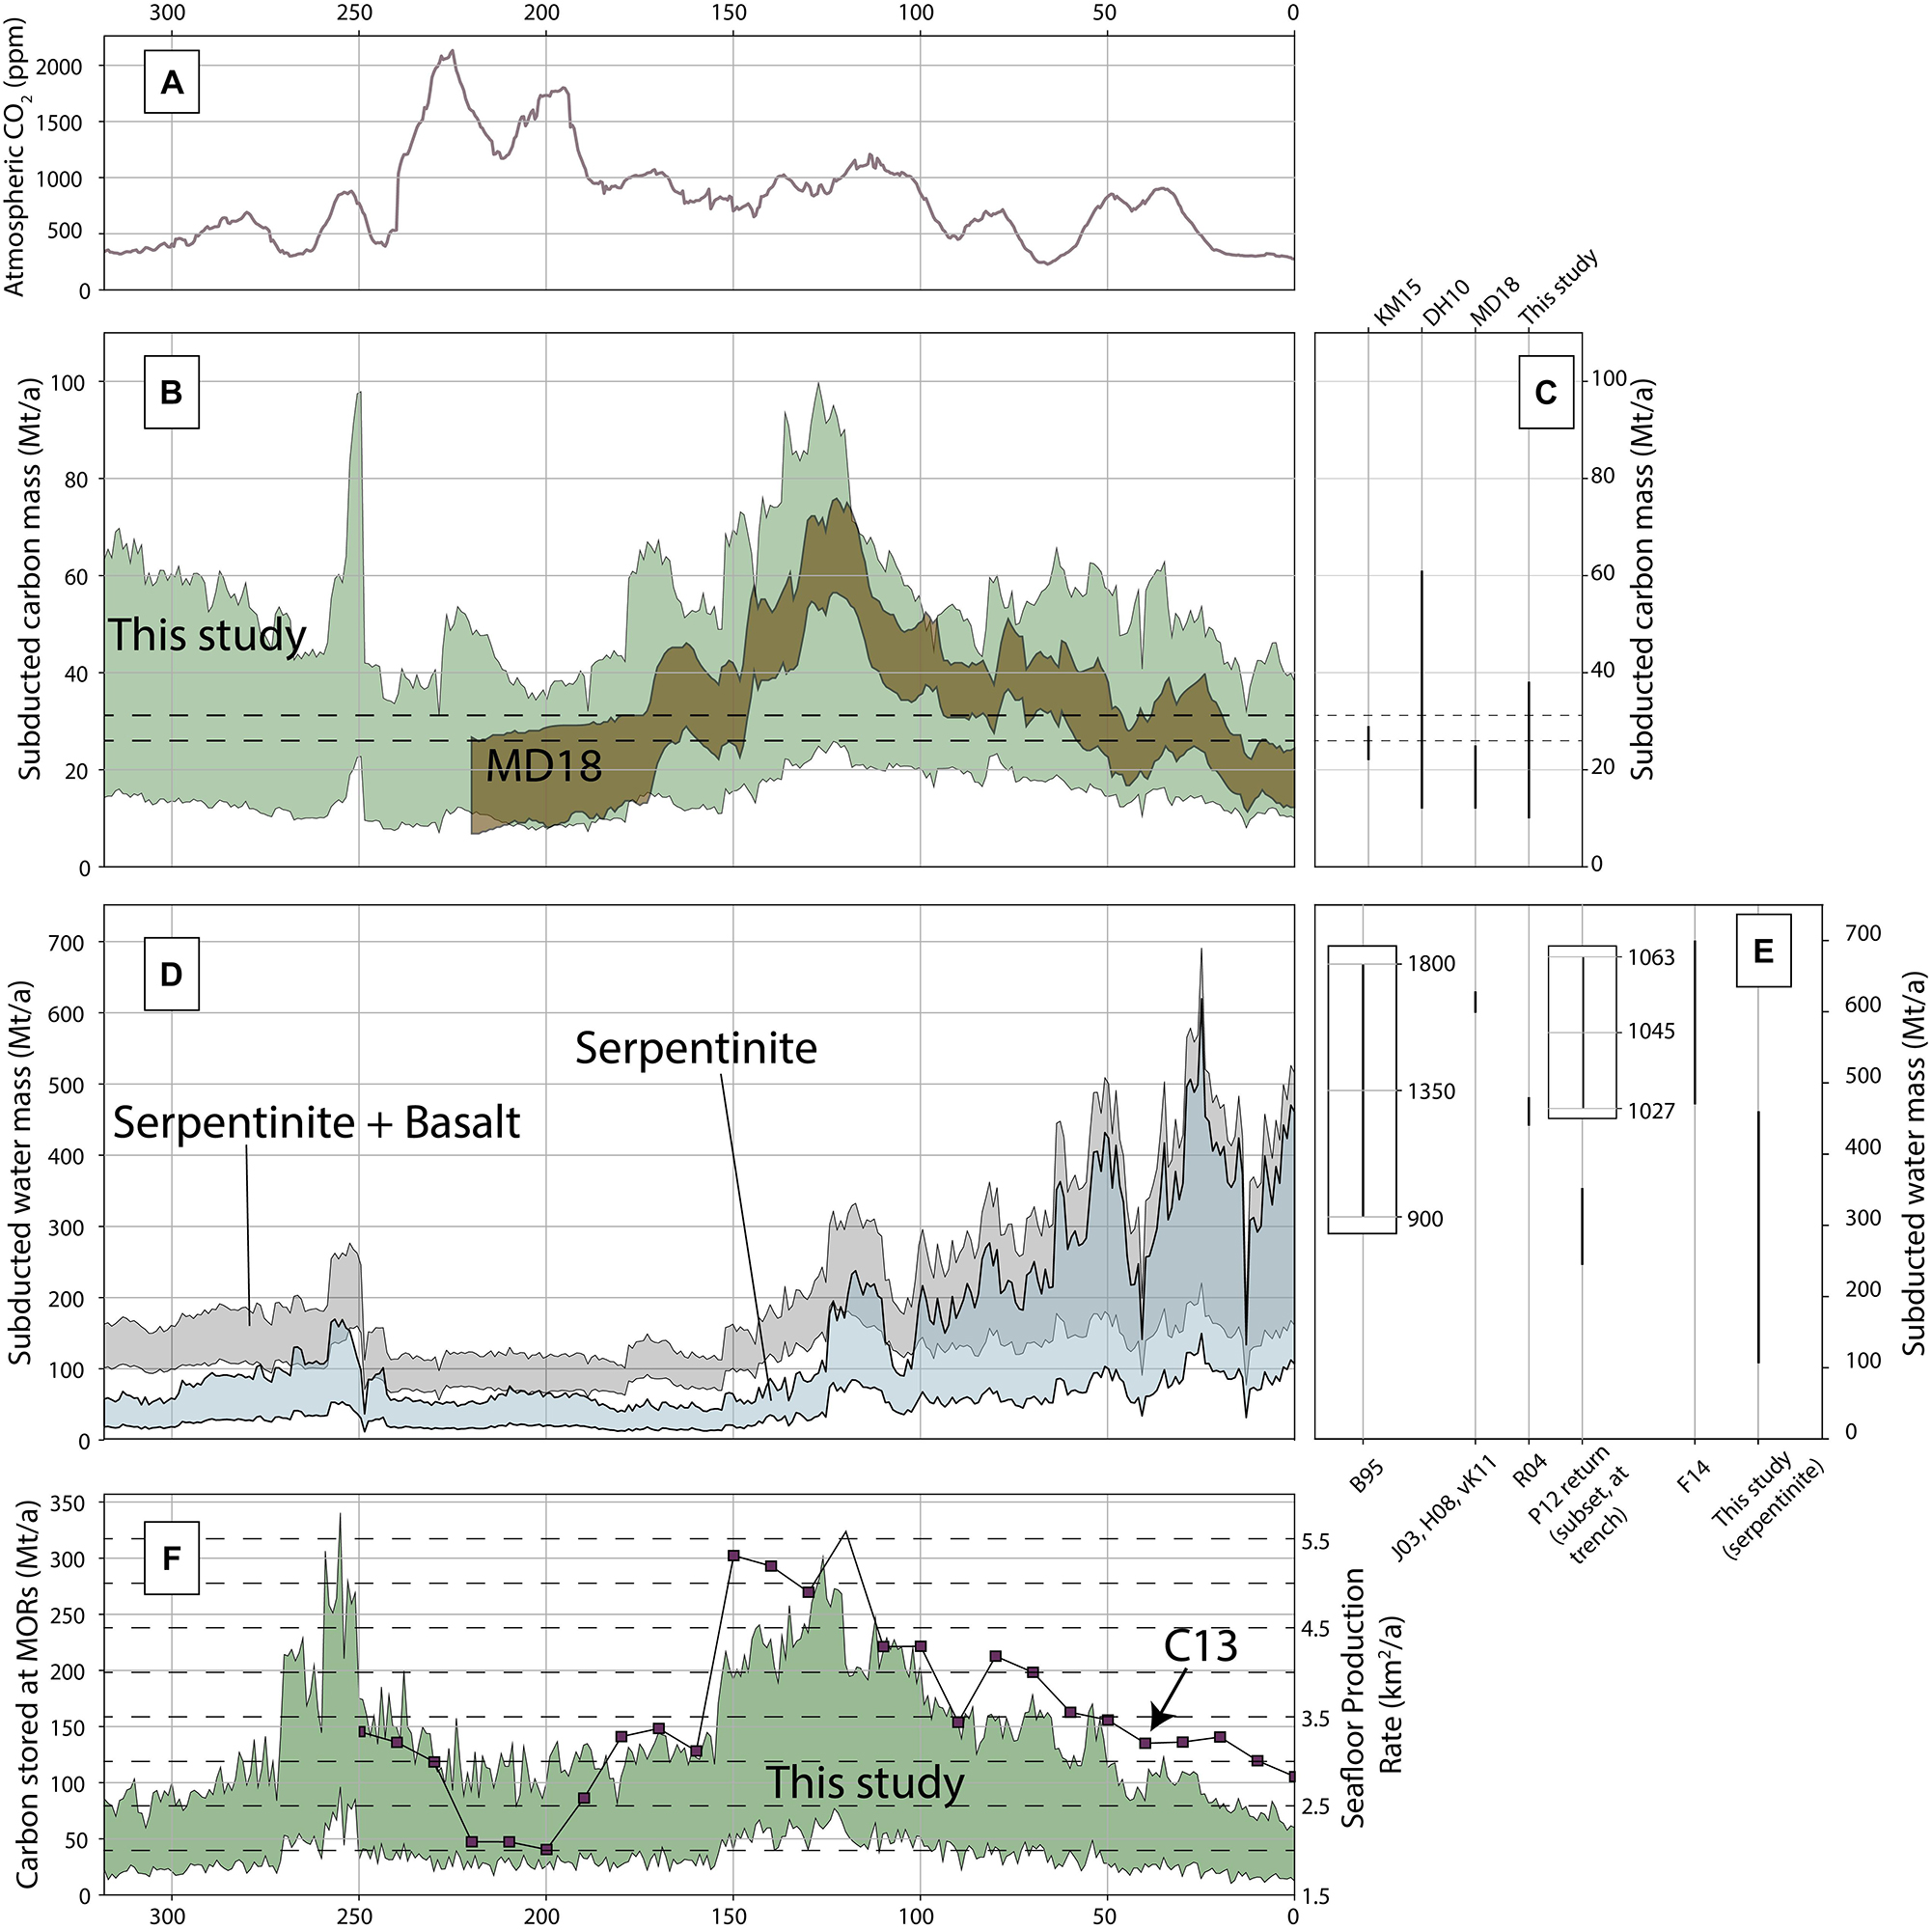
Figure 11. (A) Atmospheric CO2 after Foster et al. (2017). (B) Mass of carbon entering subduction zones according to our results (green) and Müller and Dutkiewicz (2018) (bronze, MD18). (C) Present-day estimates from other studies. KM15, Kelemen and Manning (2015); DH10, Dasgupta and Hirschmann (2010); MD18, Müller and Dutkiewicz (2018). (D) Mass of water stored in serpentinite and the upper volcanic layer entering subduction zones. (E) present-day estimates of water storage in oceanic crust; B95, Bebout (1995); J03, Jarrard (2003); R04, Rüpke et al. (2004); H08, Hacker (2008); vK11, van Keken et al. (2011); P12, return flow from Parai and Mukhopadhyay (2012) (inset is delivery to trench), and F14, Faccenda (2014). (F) Seafloor production rates after Coltice et al. (2013) for the past 250 Ma (purple squares, C13) and our estimates of carbon stored in upper oceanic lithosphere at mid-ocean ridges (green band).
Estimates of time-varying carbon subduction flux in this study can be evaluated in two ways: either through a direct comparison with the MD18 curve, or by evaluating the misfit between our results and present-day estimates (Figures 11B,C). Although our calculated mean is broadly similar to that of MD18, it has a larger standard deviation (14 Mt/a). This is to be expected as our calculation explicitly includes carbon stored in individual layers of oceanic crust and we explored the effect of varying thicknesses and carbon content of these layers. Importantly, our results show a peak in the early-mid Cretaceous at ca. 140–120 Ma (20–80 Mt/a) consistent with MD18 as a consequence of enriched Triassic and Jurassic ocean crust being subducted. As a proportional relationship exists between carbon stored in the upper 300 m of oceanic crust and carbon stored in the entire column at all fast ridges due to a fixed ratio of carbon wt% and layer thickness, we interpret times of trend deviation from MD18 to be the result of serpentinite subduction at the expense of upper volcanic subduction.
For the majority of our calculated history of carbon flux, the values, including uncertainties, lie inside the range proposed for present day by DH10 (Figures 11B,C). During times when the upper estimate of our range deviates from their present-day estimate (e.g., 250 Ma, 150–100 Ma), our results suggest the mass of carbon being subducted was up to 80 Mt/a. The lowest estimate (∼10 Mt/a at ∼200 Ma) of our range is slightly less than the minimum present-day range suggested by DH10, suggesting a value between 10 and 15 Mt/a could be considered as a minimum mass of carbon delivery to trenches at any one time. The narrower distribution of KM15 further highlights the deviation in all three of these time periods.
The decrease between 250 and 230 Ma in the mass of subducted carbon in our model is likely a result of two factors (Figure 11B). First, cold bottom water temperature between 320 and 270 Ma (∼1–8°C) gives a 40–60% relative reduction of carbonate in our model, and secondly, as Pangea was fully formed during this time, there were only two major ocean basins (Panthalassa and the Meso-Tethys) serving to limit the number of active spreading ridges. We ascribe a similar scenario to the peak of carbon subduction in the Late Jurassic and Early Cretaceous, consistent with MD18. During this period oceanic crust that formed during the Triassic and Jurassic in warm bottom water temperatures begins to be subducted, and there is an increase in mid-ocean ridge and subduction length as a result of the breakup of Pangea, resulting in more consumption of oceanic crust (Figures 8D, 9D; Coltice et al., 2013; Van Der Meer et al., 2014; Müller et al., 2016).
Although displaying temporal variation, uncertainty associated with the calculated tectonic parameters is sufficient to identify a small band of carbon subduction that could be considered constant for the last 320 Ma (26–31 Mt/a) (dashed lines, Figure 11B). This band shows a small amount of overlap with the estimates of KM15, suggesting it could be a useful starting value for any study using arc flux of carbon for pre-Pangea times (see also section “Water Storage and Delivery”).
Estimates of serpentinite mass at trenches are much more difficult to directly compare with other studies than carbon estimates. This is because other studies have not estimated the time sensitive delivery of serpentinite to subduction zones, and also due to geographic uncertainties associated with the location of off-axis serpentinized oceanic lithosphere at present-day. These two factors mean there is little available data to evaluate our model against. To address this, as our approach traces serpentinite from ridge to trench, we compare our results to bulk rock properties at ridges from previous studies, assuming the evolution of ocean basins moves bodies of serpentinite away from ridges over time. Worman et al. (2016) developed mechanistic models to calculate hydrogen production from serpentinization at mid-ocean ridges, with their preferred model suggesting that at slow and ultraslow ridges the thickness of “serpentinizing peridotite’ ranges between 0.7 and 2.8 km. This estimate is approximately congruent with the proportion of peridotite exhumed at slow ridges in our model. Worman et al. (2016) do not estimate the total volume of serpentinized peridotite, though their preferred result (∼0.35–1.4 km of serpentinite), which assumes the serpentinization reaction is 50% complete, is similar to our results, not accounting for volume or density changes. A study by Cannat et al. (2010) also estimated bulk rock serpentinization of off-axis ultramafics, however, as we use these data to guide the inputs to our model, this study cannot be used to benchmark our results. Additionally, as both Worman et al. (2016) and Cannat et al. (2010) only analyzed bulk rock at present-day ridges, their results do not present a time-sensitive analysis nor convey the spatial distribution in ocean basins.
Our model shows a clear bimodal distribution of serpentinite in ocean basins as a function of the spreading history of any single basin (Figure 9). Basins where ridges spread less than 20 mm/a tend to produce a cumulative serpentinite thickness of ∼800–1500 m, whilst spreading rates between 20 and 40 mm/a produce more varied serpentinitic thicknesses of ∼100–1000 m (Figure 9). The Atlantic Ocean (in particular the north Atlantic), the Arctic Ocean, the Labrador Sea and the southwest Indian Ocean all are enriched in serpentinite relative to the bulk Pacific and Panthalassa Oceans (Figure 9A). The evolution of the Indian Ocean is particularly noteworthy in this regard, as our model suggests it contained very little serpentinite early in its existence (Figures 9B,C) as a consequence of the rapid velocity of the Indian plate. Once Greater India collided with Asia, the spreading system slowed considerably and our model suggests extensive peridotite emplacement and serpentinite production around the southwest Indian Ridge (Figure 9A). This has been suggested previously by Sauter et al. (2013), who argue detachment faulting at the SW Indian ridge has accommodated 100% of plate divergence for the past 11 Ma. The peridotite exposed from these detachment faults is highly serpentinized, with dredges producing samples of up to 80–100% serpentinization (Sauter et al., 2013) and a single borehole suggesting a body of serpentinite up to 3 km thick (Muller et al., 1997). Prior to Pangea breakup (320–200 Ma), our model suggests that the majority of serpentinite was preserved in marginal basins (e.g., Alexander-Stoney Mountain basin, Annamia-South China basin) or smaller internal oceans (e.g., Meso Tethys) (Figures 9E–G). These predictions are incredibly difficult to ground truth, and are sensitive to the plate model used (see section “Plate Model and Associated Uncertainty”), however, have the potential to inform future research such as the investigation of arc flare ups (Lee and Lackey, 2015; Cashman et al., 2017).
Discussion
Plate Model and Associated Uncertainty
Although they are excellent tools for reconstructing first-order paleogeographic configurations through time, plate models such as Matthews et al. (2016) contain a number of quantitative and qualitative uncertainties that must be taken into consideration when used to construct geological or geodynamic models. Plate models of this type comprise three underlying models: an absolute plate motion (APM) model, constraining global motions to a fixed reference frame; a relative plate motion (RPM) model, constraining the relative motion of adjacent features; and a plate circuit (PC) model which acts as the “connective tissue” tying RPM features to the APM (Müller et al., 2016). Reconstruction kinematics are highly sensitive to the choices of APM, RPM and PC, as each introduce independent uncertainties, with resulting plate models prone to unphysical geodynamic behavior rendering all analyses using these data as plate model specific (Tetley et al., 2019). Additionally, the requirement for the inclusion of synthetic plates and associated boundaries for times older than ∼160 Ma (as explored in this study, e.g., Panthalassa Ocean), introduces significant kinematic uncertainty which is difficult to quantify due to the APM, RPM, and PC dependency described above (Torsvik et al., 2010; Müller et al., 2016; Torsvik and Cocks, 2016; Tetley et al., in press, 2019). Therefore, the significance of our comparison between the POSR and PMSR methodologies shows that, at least for the Palaeozoic, results derived from the synthetic components of the plate model can be used to identify times of interest or a first-order trend for further investigation.
An unaddressed uncertainty in plate reconstruction models that affects our results are temporal changes in spreading rates that occur within internal oceans. Although the distribution of spreading rates for both internal and external oceans shows little variation (Figures 1H,I), pre-Pangea plate models are constructed using palaeomagnetic and geological data that typically have a coarser temporal resolution than data preserved in the present-day ocean basins (e.g., magnetic lineations). Consequently, this necessitates interpolation to equally sample ocean basins through time, which implicitly assumes a linear spreading rate between data points. This approach is most effective in cases where highly detailed apparent polar wander paths (APWPs) able to capture changes in velocity are available for a given block (e.g., Domeier, 2018), and most sensitive to cases where spreading rates are interpolated between rift-drift transition and continent-continent collision. In either case, the ability of the geological record to distinguish subtle changes in spreading rate is highly limited, making alternative periods of fast, and slow spreading in any internal ocean equally likely. These subtle variations have minimal impact on our estimates of carbon delivery, however, they would affect estimates of serpentinization. We consider the risk of this to be minimal in our models, but acknowledge a uniformitarian approach does not preclude this. For example, Brune et al. (2016) show that final continental breakup is marked by a rapid increase in divergence rate, which relaxes within ∼10 Ma to a slower drift speed. Analysis of the Atlantic and Indian Oceans at present-day reveal a series of variations in spreading rate and orientation (Müller et al., 2016) occurring, at a minimum, on a 10–20 Ma timescale. Excluding the Indian ocean, most changes in spreading rates are of less than 30 mm/a, and typically closer to values of 5–10 mm/a. The variation in timescale is approximately equivalent to the temporal spacing of smoothed APWPs (e.g., Torsvik et al., 2012), suggesting that for the evolution of internal oceans constrained by well-constructed APWPs, the modeled spreading rates are reliable.
Dynamic Drivers of Carbon and Serpentinite in Ocean Basins
An important question motivating this work is how the broader-scale plate tectonic system drives and controls variation in the carbon and serpentinization cycle. We observe notable differences in the trends of carbon and serpentinite subduction flux curves within our results. As both curves were derived using the same plate boundaries (Matthews et al., 2016), this suggests that carbon and serpentinite sequestration and subduction are controlled by more than plate boundary geometry alone. The storage capacity of carbon in the upper oceanic lithosphere is dependent on the combination of mid-ocean ridge length and bottom water temperature, rather than variations in mid-ocean ridge spreading rate, as although the storage method is different, crust from fast and slow ridges can store similar total amounts of carbon (Kelemen and Manning, 2015). Therefore, as seafloor production rates control the amount of carbon sequestered, we suggest that the total volume of carbon entering a subduction zone is a function not of the geodynamic nature of mid-ocean ridges, but rather the global abundance of subduction at any given time on Earth. The temporal variability of carbon entering a trench is therefore relatively insensitive to mid-ocean ridge dynamics or the evolution of ocean basins, instead appearing most strongly related to the volume of oceanic crust being subducted (e.g., Figures 7B, 12A). A consequence of this is that total volumes of carbon sequestration in ocean basins remain relatively constant through time (Figures 12B,C). This has important implications for estimating time-dependent carbon flux at arcs, as evidence of arcs are more readily preserved in the geological record than evidence of rifts or ridges (Cao et al., 2017; Merdith et al., 2019). This suggests first-order estimates of carbon flux at arcs could be made for the Neoproterozoic and Palaeozoic using only calculations of plate boundary length and convergence rate, analogous to arguments made for episodic zircon age spectra (Domeier et al., 2018). This formulation could provide important constraints for modeling of palaeoclimate and biogeochemical processes during these times (Lenton et al., 2018; Mills et al., 2019).
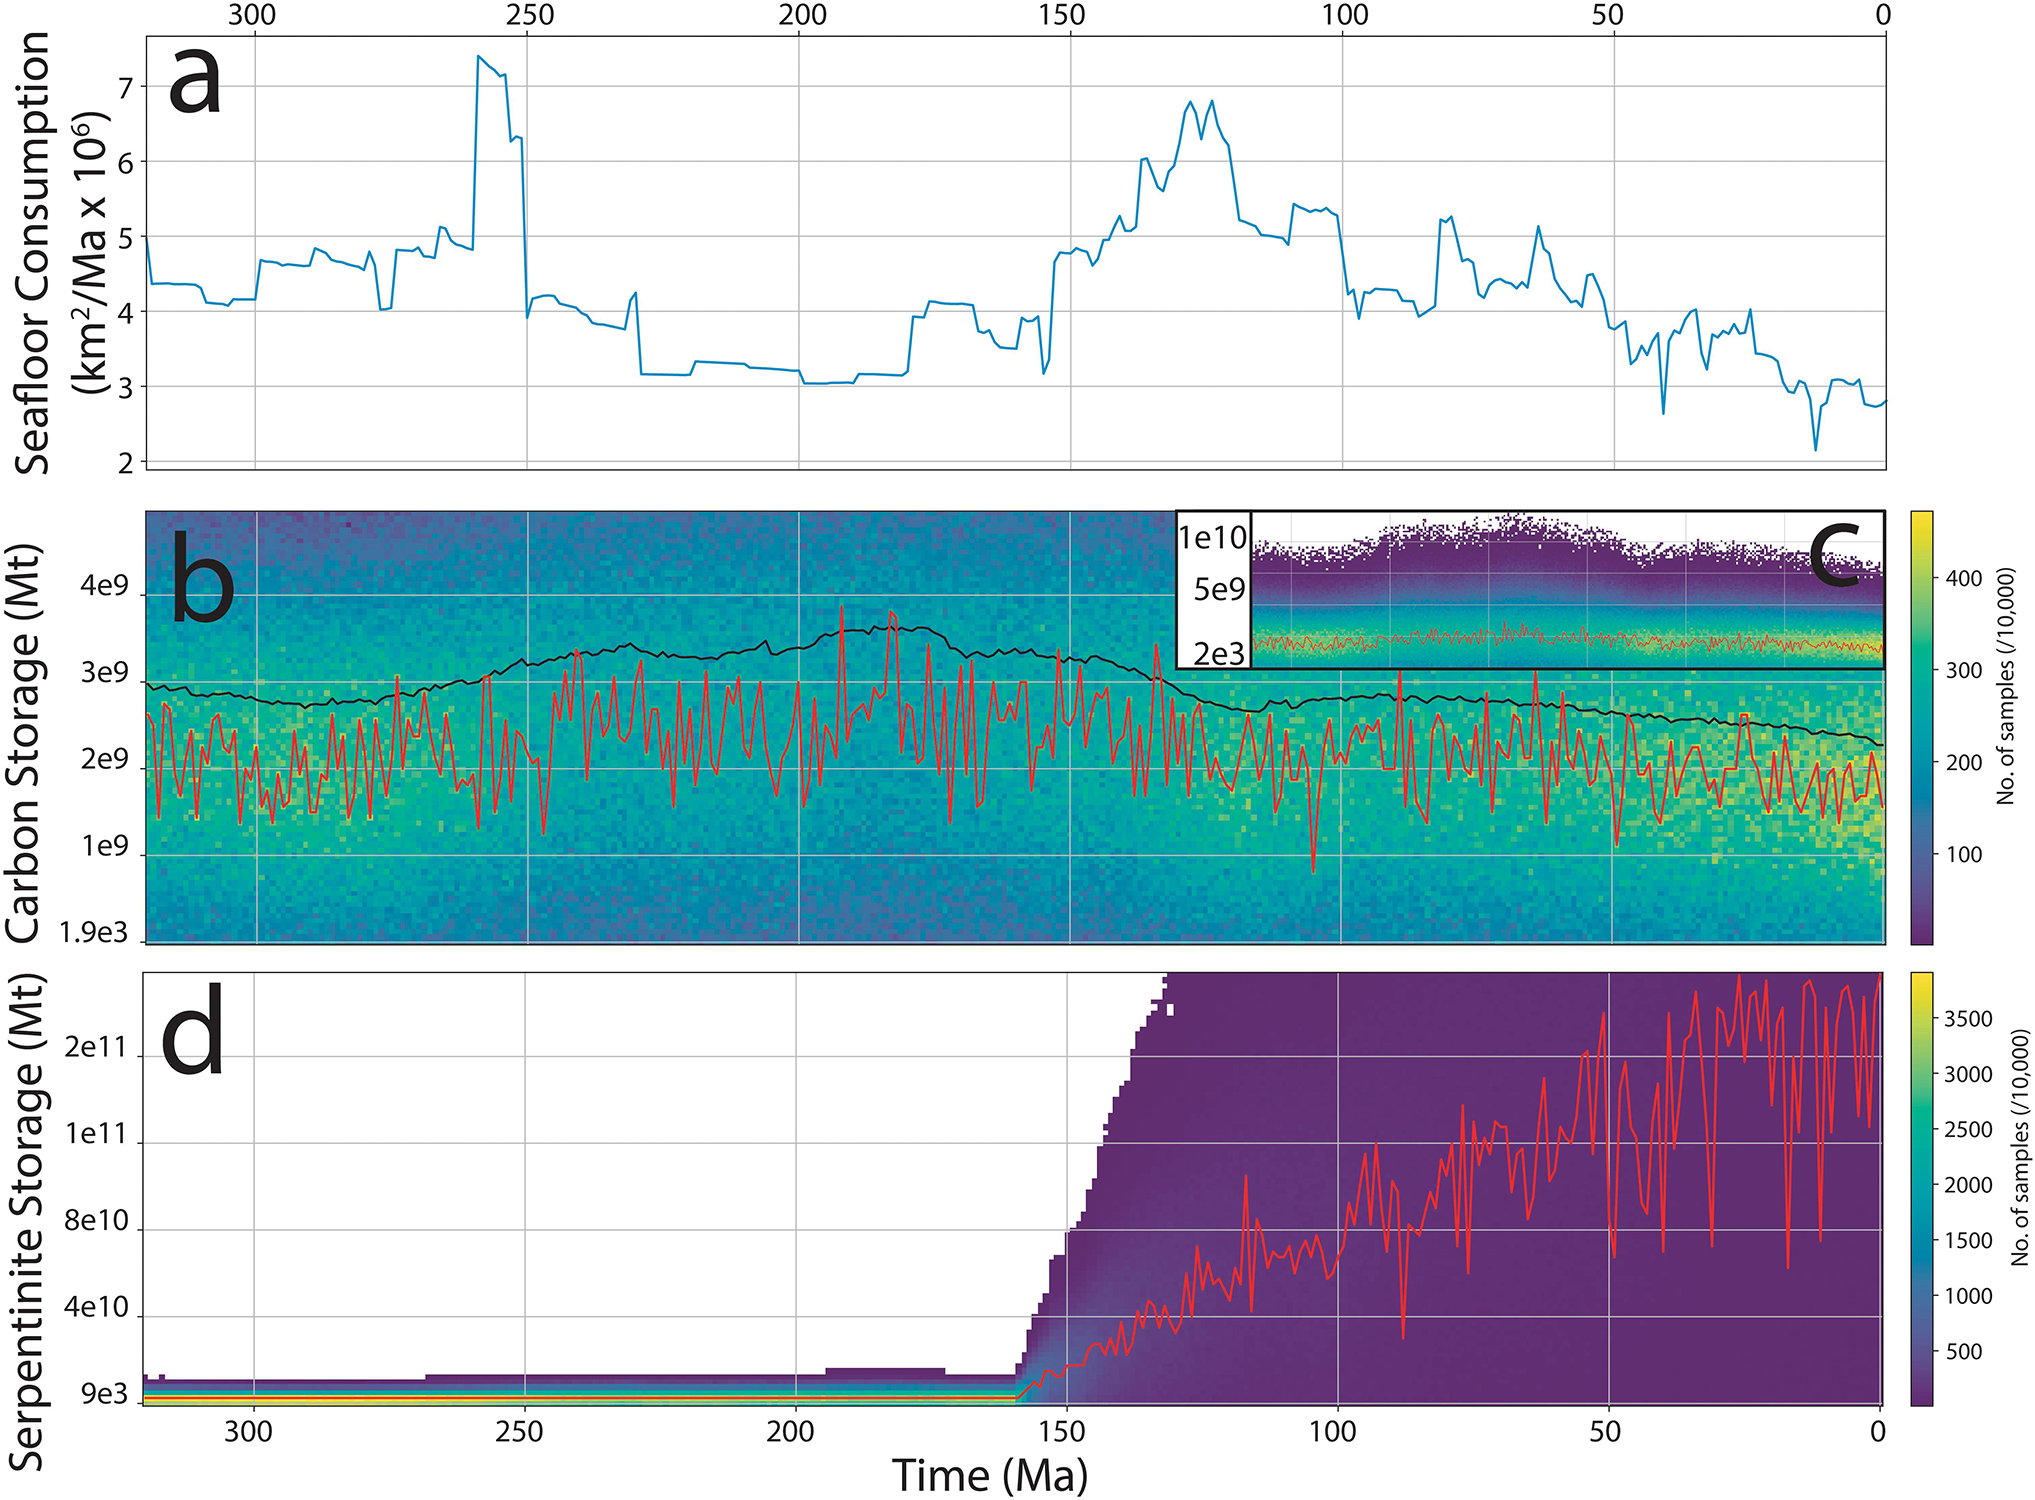
Figure 12. (A) Seafloor consumption rates from Matthews et al. (2016) (using PMSR). (B) Binned distribution of total sequestered carbon in ocean basins (black line is the mean, red line is the mode) using POSR. (C) Full distribution of (B). (D) Binned distribution of total serpentinite in ocean basins (red line is the mode) using POSR. Due to the interpolation and gridding of our data, together with inconsistencies in the plate model, our measure of total storage slightly over-estimates the actual result and is to be interpreted as a maximum. See Supplementary Material 1, 2 for table of results and Supplementary Material 3, 5 for grids in 1 Ma timesteps.
Serpentinites, by comparison, appear concentrated only in specific ocean basins (Figure 9), with their subsequent delivery to trenches not as spatio-temporally consistent as that of carbon. We propose that the subduction flux of serpentinite (and the associated water storage) is not principally controlled by subduction, but instead by variations in spreading rate, as spreading rate provides a first-order control on the volume of exhumed mantle within an ocean basin. Internal oceans, defined as oceans occurring on overriding plates as a result of supercontinent breakup, are thought to evolve more slowly as the main driver of plate motion (subduction) is not acting upon them. This implies that during the closure of one or more internal oceans, the flux of serpentinite and water being subducted will be significantly higher than during supercontinent breakup, or during periods of drift when few internal oceans are actively closing, as characterized by global plate configurations over the last 300 Ma (Cogné and Humler, 2008). Furthermore, if we consider that oceanic lithosphere is completely recycled every ∼200 Ma, it would suggest that the periodicity of serpentinite (and water) storage and subduction is related to the supercontinent cycle. In this case, the stage of supercontinent assembly (such as during the amalgamation of Gondwana or Pangea, or the future closure of the Atlantic Ocean) would be marked by extensive delivery of serpentinite (Figure 12D) and water into continental arcs, which may affect accretionary dynamics during subsequent continental collision (Menant et al., 2019).
Water Storage and Delivery
In this study, we provide a bottom-up mass estimate of water bound in both serpentinite and the volcanic layers of oceanic crust at trenches. Lithospheric flexure of oceanic crust adjacent to trenches is also thought to contribute to mantle serpentinization (Ranero et al., 2003; Grevemeyer et al., 2018; Scambelluri et al., 2019). However, it is poorly constrained (Faccenda, 2014) and subsequently not considered in this study. Whilst quantitative estimates of serpentinite delivery from ridge to trench do not exist in alternative studies, there are a number of investigations into the mass of water entering subduction zones (Iwamori, 1998), which we use to evaluate our results. As estimates of hydrated oceanic crust have been provided in numerous previous studies (Rüpke et al., 2004; Hacker, 2008; van Keken et al., 2011), we focus our contribution on analyzing the time-sensitive delivery of water stored in serpentinite to subduction zones. Our estimates of water mass in serpentinite at subduction can be used alongside estimates of oceanic crust as a first-order approximation to constrain thermodynamic models investigating water content in the mantle wedge.
Estimates of subducted water mass stored within oceanic crust typically range between 400 and 1800 Mt/a (Bebout, 1995; Schmidt and Poli, 1998, 2003), with more recent studies suggesting a lower range between 400 and 600 Mt/a (Jarrard, 2003; Rüpke et al., 2004; Hacker, 2008; van Keken et al., 2011; Faccenda, 2014; Figures 11D,E). Notably, the upper extents of estimates from early studies (prior to accounting for dehydration) are up to an order of magnitude higher than our estimates of water stored in serpentinite (100–450 Mt/a). Our estimates are slightly lower than those of Jarrard (2003) (hereby referred to as J03), who suggested a delivery of 600 Mt/a in oceanic crust, representing a geologically complete estimate of water delivery to trenches. If our analysis included only water stored in upper volcanic layers (2.7 wt% in our analysis, black shaded area in Figure 11D), our estimates would approach parity with J03, though we do not include water stored in the entire crustal profile or pore water. Consequently, the sum of our serpentinitic component (100–450 Mt/a) and J03’s estimate of ocean crust storage (∼600 Mt/a) may reflect a more complete picture of water delivery to trenches (at present-day), with a total almost doubling the global water budget (Jarrard, 2003) at trenches before accounting for additional serpentinization of the mantle occurring due to trench flexure.
The combined estimate of water in upper oceanic lithosphere (∼700–1100 Mt/a) is similar to the range suggested by Faccenda (2014) (hereby, F14) (Figure 11E) for oceanic crust, and that of Parai and Mukhopadhyay (2012) (hereby, PM12). PM12 applied a Monte Carlo approach to model the mantle deep water cycle, with results suggesting a steady state estimate of water entering the trench between ∼1020 and 1070 Mt/a, with a return flow consisting of about 30% (280–380 Mt/a). Additionally, PM12 found subduction scenarios with large water flux (>1400 Mt/a) were unlikely to reproduce expected sea level changes throughout the Phanerozoic. The addition of substantial mantle hydration during flexure to the combined estimate, such as that suggested in F14 of ∼1000 Mt/a, would greatly exceed the upper limit of PM12. However, as noted in both F14 and this study, there is large spatial (and temporal) variability of both serpentine in ocean basins and the degree of trench flexure, making it difficult to infer a “static” present-day value. In our model there is little serpentinite being subducted around the Pacific. Comparably, the eventual closure of the Atlantic and/or Indian Ocean would likely greatly increase the delivery of water to trenches.
We can also consider the predicted water content contained within the total mass of serpentinite in all ocean basins through time (Figure 12D). Our present-day estimate of serpentinite within all ocean basins suggests ∼4.3 ∙ 1019 kg of water is stored in mantle peridotite altered at mid-ocean ridges (using the mean value of 3.1 ∙ 1011 Mt and 13.5 wt% water). This is approximately one-third of the amount estimated to be stored in oceanic crust by Bodnar et al. (2013). Considering that ridges with significant peridotite exhumation are unlikely to produce basaltic crust during this time, the ratio of volcanic to peroditic crust could be higher. This high amount of potential water storage is significant as the distribution of serpentinite has clear temporal variation, potentially making this an under-explored component for constraining sea level (Rüpke et al., 2004; Parai and Mukhopadhyay, 2012; Karlsen et al., 2019).
Relationship With Atmospheric Carbon Dioxide
One of the key motivations for estimating the mass of carbon entering subduction zones is the potential to provide constraints on the delivery of CO2 from the crust to the atmosphere via volcanic outgassing. However, this is a non-trivial problem as the fate of carbon stored in subducted oceanic lithosphere is poorly understood. Specifically, the proportion of carbon that: (i) remains in the slab and is subsequently recycled into the mantle, (ii) is mobilized but trapped in the arc wedge and subsequently incorporated into continental lithosphere, and (iii) is expelled by a volcano into the atmosphere, is collectively poorly constrained and thought to vary depending on a range of tectonic, petrological, geochemical and geodynamic variables (Dasgupta and Hirschmann, 2010; Kelemen and Manning, 2015). Kelemen and Manning (2015) estimated that between ∼30 and 100% of subducted carbon is recycled into the overriding plate, where it is then either incorporated into carbon bearing minerals or is degassed as CO2, with the remaining carbon being transported into the mantle. We assume decarbonation of the slab and either degassing by volcanoes or sequestration in the wedge occurs on sub-1 Ma timescales (Van Der Meer et al., 2014), as CO2 rich fluids from the slab are released early in the dehydration process (John et al., 2012). However, this suggests there is little lag time between subduction and outgassing on tectonic scales, and does not provide any clear way for estimating the proportion of carbon being delivered to the atmosphere. A proxy that could be used to evaluate our estimates are atmospheric CO2 records, themselves the summation of multiple other sources of carbon such as degassing from ridges (Kerrick, 2001) and continental rifts (Brune et al., 2017). As a result of this, we expect some level of mismatch between our estimates and those of atmospheric CO2 through time.
Some similarity exists between our results of carbon delivery to trenches and estimates of time-dependent atmospheric CO2 (Foster et al., 2017), particularly during the late Permian and Early Triassic (Figures 11A,B). The peak at ∼75 Ma in our estimates of subducted carbon also appears to correlate with a CO2 peak at this time, though the progression in our results after this peak (toward 50 Ma) deviates from the CO2 curve. Here (∼70–55 Ma) our results show an increase in carbon delivery to trenches while atmospheric CO2 drops, until the Cenozoic rifting period initiates (Brune et al., 2017). The more recent evolution of subducted carbon and atmospheric CO2 also show similarities, with a local maxima occurring in the late Eocene (∼40 Ma), before both curves decrease toward present-day values (Figures 11A,B). Significant deviations occur in the Carboniferous to early Permian, the Triassic-Jurassic boundary and during the Early Cretaceous (Figures 11A,B). In the first of these deviations our results show declining carbon delivery while CO2 increases; in the second, atmospheric CO2 peaks while our estimates remain constant; and in the Early Cretaceous we have a broad peak of carbon delivery to trenches while atmospheric CO2 remains constant. Deviations where our estimates of carbon delivery to trenches increase while atmospheric CO2 either remains constant or decreases are most likely a consequence of other crustal, tectonic or biological factors at play that were not considered in this study. Conversely, deviations when atmospheric CO2 peak while carbon delivery remains constant may be accounted for through either rift or ridge degassing. In this case, the first and third deviation are somewhat enigmatic in comparison to our results, suggesting either the amount of carbon degassed from subduction zones changes over time in a manner not related to the tectonic parameters (i.e., the length and convergence rate), or there is a co-dependence between tectonic sources and sinks of carbon (e.g., rifts, ridges, and arcs) that operate on different timescales. This would suggest that subduction zones and arc-degassing can not solely account for atmospheric CO2 variations.
Although we do not explicitly measure seafloor production rates, we can estimate them as carbon storage in the upper oceanic lithosphere is broadly proportionally related to spreading rate (Figure 11F), as the thickness of oceanic crust is approximately constant. Our estimates are similar to both those of Coltice et al. (2013) (Figure 11F, black line with purple boxes), and the combined spreading rate and ridge length predictions of MD18 (Müller and Dutkiewicz (2018) their Figures 2B,C). Following this, assuming that carbon degassing is approximately linearly proportional to seafloor production rates (e.g., Kerrick (2001), though we note that CO2 content of magmas are not constant across the globe), the relative shape of any carbon degassing curve should follow the seafloor production rate curve, providing a first-order estimate of degassing from mid-ocean ridge systems. Applying this approach, the atmospheric CO2 curve (Figure 11A) shows some correlation with seafloor production rates (Figure 11F, using carbon storage at mid-ocean ridges as a proxy), and is most strongly demonstrated by peaks in the latest Carboniferous and early Eocene (∼55–50 Ma). Inversely, and perhaps more interestingly, are times of strong deviation between the curves in Figures 11A,B,F in particular the aforementioned peak of atmospheric CO2 in the Triassic-Jurassic (Figure 11A) that do not appear to be correlated with the amount of carbon being subducted (Figure 11B), carbon sequestration or seafloor production rates (Figure 11F). The exact cause of this is unclear from our analysis, however, rift degassing may be one potential contributor, as it can deliver a similar volume of carbon directly into the atmosphere as that from mid-ocean ridges or subduction zones over geological time (Brune et al., 2017).
Conclusion
The long-term evolution of carbon and water on Earth is in part controlled by the continual recycling of oceanic lithosphere between mid-ocean ridges and subduction zones. Here we present a general method for the geological characterization of ocean basins constrained by full-plate tectonic reconstruction models explicitly mapping the location and geometry of mid-ocean ridges and subduction zones. We calculate the amount of carbonate and serpentinite preserved in both the oceanic crust and exhumed mantle lithosphere at a given mid-ocean ridge, then trace those masses through time to calculate the subduction flux of each. We find carbon storage is approximately uniform throughout geological time, and propose variation in observed subduction flux is controlled by subduction dynamics and not mid-ocean ridge dynamics. We find present-day rates of carbon subduction in upper oceanic lithosphere to be at the lowest levels for the past 200 Ma (15–39 Mt/a). Additionally, our results suggest the amount of serpentinite (and volume of water stored within it) being subducted at present-day is higher than between the Carboniferous to Cretaceous. We infer this is because the primary tectonic control on the mass of serpentinite delivered to a trench is the geodynamic nature of mid-ocean ridges, as only slow and ultraslow spreading ridges result in the exhumation of the lithospheric mantle such that it is in contact with ocean water, allowing extensive serpentinization to occur. Our results predict that much of the serpentinite formed in the past 320 Ma remains preserved in ocean basins located within the Atlantic, Indian and Arctic oceans. This suggests the closure of internal oceans, such as during the assembly of a supercontinent, result in increased subduction of water relative to times of supercontinent breakup or drift (e.g., the past 300 Ma).
Data Availability Statement
All datasets generated for this study are included in the article/Supplementary Material.
Author Contributions
AM, SA, and MT conceived of the study together. AM designed and carried out the analysis, and wrote the manuscript with contributions and input from SA and MT. SA characterized the Pacific-Ocean spreading rate to pass into pre-Pangea times. All authors contributed to the discussion.
Funding
AM was supported by the Deep Energy Community of the Deep Carbon Observatory. SA was supported by the AUGURY European Research Council Project 617588, the European Union Horizon 2020 Research and Innovation Programme under grant agreement TRANSCALE 716542, and EU H2020 Marie Skłodowska-Curie Individual Fellowship TEMPO Project 838535. MT was supported by the AUGURY European Research Council Project 617588. This is a contribution to IGCP 648.
Conflict of Interest
The authors declare that the research was conducted in the absence of any commercial or financial relationships that could be construed as a potential conflict of interest.
Acknowledgments
We thank the editor and reviewers for their constructive criticism which helped to improve the manuscript. All authors appreciate discussion and advice from I. Daniel, M. Andreani, and N. Coltice.
Supplementary Material
The Supplementary Material for this article can be found online at: https://figshare.com/articles/Supp_material_Merdithetal_Frontiers_zip/11323463/1
MATERIAL S1 | Carbon table of results.
MATERIAL S2 | Serpentinite table of results.
MATERIAL S3 | Carbon grids and rasters.
MATERIAL S4 | Serpentinite grids and raster.
MATERIAL S5 | Carbon animation.
MATERIAL S6 | Serpentinite animation.
MATERIAL S7 | Jupyter notebooks.
Footnotes
References
Alt, J. C., Schwarzenbach, E. M., Früh-Green, G. L., Shanks, W. C., Bernasconi, S. M., Garrido, C. J., et al. (2013). The role of serpentinites in cycling of carbon and sulfur: seafloor serpentinization and subduction metamorphism. Lithos 178, 40–54. doi: 10.1016/j.lithos.2012.12.006
Alt, J. C., and Teagle, D. A. H. (1999). The uptake of carbon during alteration of ocean crust. Geochim. Cosmochim. Acta 63, 1527–1535. doi: 10.1016/S0016-7037(99)00123-124
Barry, P. H., de Moor, J. M., Giovannelli, D., Schrenk, M., Hummer, D. R., Lopez, T., et al. (2019). Forearc carbon sink reduces long-term volatile recycling into the mantle. Nature 568, 487–492. doi: 10.1038/s41586-019-1131-1135
Bebout, G. E. (1995). The impact of subduction-zone metamorphism on mantle-ocean chemical cycling. Chem. Geol. 126, 191–218. doi: 10.1016/0009-2541(95)00118-115
Bebout, G. E., and Barton, M. D. (1989). Fluid flow and metasomatism in a subduction zone hydrothermal system: catalina schist terrane. California. Geology 17:976. doi: 10.1130/0091-7613(1989)017<0976:ffamia>2.3.co;2
Becker, T. W. (2006). On the effect of temperature and strain-rate dependent viscosity on global mantle flow, net rotation, and plate-driving forces. Geophys. J. Int. 167, 943–957. doi: 10.1111/j.1365-246X.2006.03172.x
Bodnar, R. J., Azbej, T., Becker, S. P., Cannatelli, C., Fall, A., and Severs, M. J. (2013). Whole Earth geohydrologic cycle, from the clouds to the core: the distribution of water in the dynamic Earth system. Geol. Soc. Am. Spec. Pap. 500, 431–461.
Bown, J. W., and White, R. S. (1994). Variation with spreading rate of oceanic crustal thickness and geochemistry. Earth Planet. Sci. Lett. 121, 435–449. doi: 10.1016/0012-821X(94)90082-90085
Brune, S., Williams, S. E., Butterworth, N. P., and Müller, R. D. (2016). Abrupt plate accelerations shape rifted continental margins. Nature 536, 201–204. doi: 10.1038/nature18319
Brune, S., Williams, S. E., and Müller, R. D. (2017). Potential links between continental rifting, CO2 degassing and climate change through time. Nat. Geosci. 10, 941–946. doi: 10.1038/s41561-017-0003-6
Canales, J. P., Collins, J. A., Escartín, J., and Detrick, R. S. (2000). Seismic structure across the rift valley of the Mid-Atlantic Ridge at 23 20’(MARK area): implications for crustal accretion processes at slow spreading ridges. J. Geophys. Res. 105, 28411–28425. doi: 10.1029/2000JB900301
Cannat, M. (1993). Emplacement of mantle rocks in the seafloor at mid-ocean ridge. J. Geophys. Res.: Solid Earth 4163:4172.
Cannat, M., Fontaine, F., and Escartín, J. (2010). “Serpentinization and associated hydrogen and methane fluxes at slow spreading ridges,” in Diversity of Hydrothermal Systems on Slow Spreading Ocean Ridges Geophysical Monograph Series, eds P. A. Rona, C. W. Devey, J. Dyment, and B. J. Murton, (Washington, DC: American Geophysical Union), 241–264. doi: 10.1029/2008gm000760
Cannat, M., Rommevaux-Jestin, C., and Fujimoto, H. (2003). Melt supply variations to a magma-poor ultra-slow spreading ridge (Southwest Indian Ridge 61° to 69° E). Geochem. Geophys. Geosyst. 4, 1–21. doi: 10.1029/2002GC000480
Cao, W., Lee, C.-T. A., and Lackey, J. S. (2017). Episodic nature of continental arc activity since 750 Ma: a global compilation. Earth Planet. Sci. Lett. 461, 85–95. doi: 10.1016/j.epsl.2016.12.044
Carbotte, S. M., Smith, D. K., Cannat, M., and Klein, E. M. (2016). Tectonic and magmatic segmentation of the global ocean ridge system: a synthesis of observations. Geol. Soc. Lon. Spec. Publ. 420, 249–295. doi: 10.1144/SP420.5
Carlson, R. L. (2001). The abundance of ultramafic rocks in atlantic ocean crust. Geophys. J. Int. 144, 37–48. doi: 10.1046/j.0956-540x.2000.01280.x
Cashman, K. V., Sparks, R. S. J., and Blundy, J. D. (2017). Vertically extensive and unstable magmatic systems: a unified view of igneous processes. Science 355:eaag3055. doi: 10.1126/science.aag3055
Clift, P. D. (2017). A revised budget for cenozoic sedimentary carbon subduction: cenozoic carbon subduction. Rev. Geophys. 55, 97–125. doi: 10.1002/2016RG000531
Cogné, J.-P., and Humler, E. (2008). Global scale patterns of continental fragmentation: wilson’s cycles as a constraint for long-term sea-level changes. Earth Planet. Sci. Lett. 273, 251–259. doi: 10.1016/j.epsl.2008.06.030
Collins, W. J. (2003). Slab pull, mantle convection, and Pangaean assembly and dispersal. Earth Planet. Sci. Lett. 205, 225–237. doi: 10.1016/s0012-821x(02)01043-9
Coltice, N., Seton, M., Rolf, T., Müller, R. D., and Tackley, P. J. (2013). Convergence of tectonic reconstructions and mantle convection models for significant fluctuations in seafloor spreading. Earth Planet. Sci. Lett. 383, 92–100. doi: 10.1016/j.epsl.2013.09.032
Conrad, C. P., and Lithgow-Bertelloni, C. (2002). How mantle slabs drive plate tectonics. Science 298, 207–209. doi: 10.1126/science.1074161
Conrad, C. P., and Lithgow-Bertelloni, C. (2004). The temporal evolution of plate driving forces: Importance of “slab suction” versus “slab pull” during the Cenozoic. J. Geophys. Res. 109:B10407. doi: 10.1029/2004JB002991
Constantin, M., Hékinian, R., Ackermand, D., and Stoffers, P. (1995). “Mafic and ultramafic intrusions into upper mantle peridotites from fast spreading centers of the easter microplate (South East Pacific),” in Mantle and Lower Crust Exposed in Oceanic Ridges and in Ophiolites, eds R. L. M. Vissers, and A. Nicolas, (Netherlands: Springer), 71–120. doi: 10.1007/978-94-015-8585-9_4
Coogan, L. A., Parrish, R. R., and Roberts, N. M. W. (2016). Early hydrothermal carbon uptake by the upper oceanic crust: Insight from in situ U-Pb dating. Geology 44, 147–150. doi: 10.1130/G37212.1
Crameri, F., Conrad, C. P., Montési, L., and Lithgow-Bertelloni, C. R. (2019). The dynamic life of an oceanic plate. Tectonophysics 760, 107–135. doi: 10.1016/j.tecto.2018.03.016
Dasgupta, R. (2013). Ingassing, storage, and outgassing of terrestrial carbon through geologic time. Rev. Mineral. Geochem. 75, 183–229. doi: 10.2138/rmg.2013.75.7
Dasgupta, R., and Hirschmann, M. M. (2010). The deep carbon cycle and melting in Earth’s interior. Earth Planet. Sci. Lett. 298, 1–13. doi: 10.1016/j.epsl.2010.06.039
Dick, H. J. B. (1989). Abyssal peridotites, very slow spreading ridges and ocean ridge magmatism. Geol. Soci. Lon., Spec. Publ. 42, 71–105. doi: 10.1144/GSL.SP.1989.042.01.06
Dick, H. J. B., Lin, J., and Schouten, H. (2003). An ultraslow-spreading class of ocean ridge. Nature 426, 405–412. doi: 10.1038/nature02128
Domeier, M. (2016). A plate tectonic scenario for the Iapetus and Rheic oceans. Gondwana Res. 36, 275–295. doi: 10.1016/j.gr.2015.08.003
Domeier, M. (2018). Early Paleozoic tectonics of Asia: towards a full-plate model. Geosci. Front. 9, 789–862. doi: 10.1016/j.gsf.2017.11.012
Domeier, M., Magni, V., Hounslow, M. W., and Torsvik, T. H. (2018). Episodic zircon age spectra mimic fluctuations in subduction. Sci. Rep. 8:17471. doi: 10.1038/s41598-018-35040-z
Domeier, M., and Torsvik, T. H. (2014). Plate tectonics in the late Paleozoic. Geosci. Front. 5, 303–350. doi: 10.1016/j.gsf.2014.01.002
Domeier, M., and Torsvik, T. H. (2017). Full-plate modelling in pre-Jurassic time. Geol. Mag. 156, 261–280. doi: 10.1017/S0016756817001005
Dutkiewicz, A., Dietmar Müller, R., Cannon, J., Vaughan, S., and Zahirovic, S. (2019). Sequestration and subduction of deep-sea carbonate in the global ocean since the Early Cretaceous. Geology 47, 91–94. doi: 10.1130/G45424.1
Faccenda, M. (2014). Water in the slab: a trilogy. Tectonophysics 614, 1–30. doi: 10.1016/j.tecto.2013.12.020
Foster, G. L., Royer, D. L., and Lunt, D. J. (2017). Future climate forcing potentially without precedent in the last 420 million years. Nat. Commun. 8:14845. doi: 10.1038/ncomms14845
Früh-Green, G. L., Connolly, J. A. D., Plas, A., Kelley, D. S., and Grobéty, B. (2004). “Serpentinization of oceanic peridotites: Implications for geochemical cycles and biological activity,” in The Subseafloor Biosphere at Mid-Ocean Ridges Geophysical Monograph Series, eds W. S. D. Wilcock, E. F. DeLong, D. S. Kelley, J. A. Baross, and S. Craig Cary, (Washington, DC: American Geophysical Union), 119–136. doi: 10.1029/144gm08
Früh-Green, G. L., Plas, A., and Lécuyer, C. (1996). 14. Petrologic and stable isotope constraints on hydrothermal alteration and serpentinization of the EPR shallow mantle at hess deep (site 895). Proc. Ocean Drill. Prog. Sci. Results 147, 255–291.
Gerya, T. V., Connolly, J. A. D., Yuen, D. A., Gorczyk, W., and Capel, A. M. (2006). Seismic implications of mantle wedge plumes. Phys. Earth Planet. Inter. 156, 59–74. doi: 10.1016/j.pepi.2006.02.005
Gillis, K. M., and Coogan, L. A. (2011). Secular variation in carbon uptake into the ocean crust. Earth Planet. Sci. Lett. 302, 385–392. doi: 10.1016/j.epsl.2010.12.030
Grevemeyer, I., Ranero, C. R., and Ivandic, M. (2018). Structure of oceanic crust and serpentinization at subduction trenches. Geosphere. 14, 395–418. doi: 10.1130/ges01537.1
Hacker, B. R. (2008). H2O subduction beyond arcs. Geochem. Geophys. Geosyst. 9:Q03001. doi: 10.1029/2007GC001707
Hellinger, S. J. (1981). The uncertainties of finite rotations in plate tectonics. J. Geophys. Res. 86, 9312–9318. doi: 10.1029/JB086iB10p09312
Hirth, G., and Kohlstedt, D. L. (1996). Water in the oceanic upper mantle: implications for rheology, melt extraction and the evolution of the lithosphere. Earth Planet. Sci. Lett. 144, 93–108. doi: 10.1016/0012-821X(96)00154-159
Iwamori, H. (1998). Transportation of H2O and melting in subduction zones. Earth Planet. Sci. Lett. 160, 65–80. doi: 10.1016/S0012-821X(98)00080-86
Janecky, D. R., and Seyfried, W. E. (1986). Hydrothermal serpentinization of peridotite within the oceanic crust: experimental investigations of mineralogy and major element chemistry. Geochim. Cosmochim. Acta 50, 1357–1378. doi: 10.1016/0016-7037(86)90311-X
Jarrard, R. D. (2003). Subduction fluxes of water, carbon dioxide, chlorine, and potassium. Geochem. Geophys. Geosyst. 4:8905. doi: 10.1029/2002GC000392
John, T., Gussone, N., Podladchikov, Y. Y., Bebout, G. E., Dohmen, R., Halama, R., et al. (2012). Volcanic arcs fed by rapid pulsed fluid flow through subducting slabs. Nat. Geosci. 5:489. doi: 10.1038/ngeo1482
Karlsen, K. S., Conrad, C. P., and Magni, V. (2019). Deep water cycling and sea level change since the breakup of pangea. Geochem. Geophys. Geosyst. 20, 2919–2935. doi: 10.1029/2019GC008232
Kelemen, P. B., and Manning, C. E. (2015). Reevaluating carbon fluxes in subduction zones, what goes down, mostly comes up. Proc. Natl. Acad. Sci. U.S.A. 112, E3997–E4006. doi: 10.1073/pnas.1507889112
Keller, T., Katz, R. F., and Hirschmann, M. M. (2017). Volatiles beneath mid-ocean ridges: deep melting, channelised transport, focusing, and metasomatism. Earth Planet. Sci. Lett. 464, 55–68. doi: 10.1016/j.epsl.2017.02.006
Kerrick, D. (2002). Geology. Serpentinite seduction. Science 298, 1344–1345. doi: 10.1126/science.298.5597.1344
Kerrick, D. M. (2001). Present and past nonanthropogenic CO2 degassing from the solid Earth. Rev. Geophys. 39, 565–585. doi: 10.1029/2001RG000105
Lear, C. H., Elderfield, H., and Wilson, P. A. (2000). Cenozoic deep-Sea temperatures and global ice volumes from Mg/Ca in benthic foraminiferal calcite. Science 287, 269–272. doi: 10.1126/science.287.5451.269
Lee, C.-T. A., and Lackey, J. S. (2015). Global continental arc flare-ups and their relation to long-term greenhouse conditions. Elements 11, 125–130. doi: 10.2113/gselements.11.2.125
Lenton, T. M., Daines, S. J., and Mills, B. J. W. (2018). COPSE reloaded: an improved model of biogeochemical cycling over Phanerozoic time. Earth-Sci. Rev. 178, 1–28. doi: 10.1016/j.earscirev.2017.12.004
Lithgow-Bertelloni, C., and Richards, M. A. (1998). The dynamics of cenozoic and mesozoic plate motions. Rev. Geophys. 36, 27–78. doi: 10.1029/97RG02282
Matthews, K. J., Maloney, K. T., Zahirovic, S., Williams, S. E., Seton, M., and Müller, R. D. (2016). Global plate boundary evolution and kinematics since the late Paleozoic. Glob. Planet. Chang. 146, 226–250. doi: 10.1016/j.gloplacha.2016.10.002
Menant, A., Angiboust, S., and Gerya, T. (2019). Stress-driven fluid flow controls long-term megathrust strength and deep accretionary dynamics. Sci. Rep. 9:9714. doi: 10.1038/s41598-019-46191-y
Merdith, A. S., Collins, A. S., Williams, S. E., Pisarevsky, S., Foden, J. D., Archibald, D. B., et al. (2017). A full-plate global reconstruction of the Neoproterozoic. Gondwana Res. 50, 84–134. doi: 10.1016/j.gr.2017.04.001
Merdith, A. S., Williams, S. E., Brune, S., Collins, A. S., and Müller, R. D. (2019). Rift and plate boundary evolution across two supercontinent cycles. Glob. Planet. Chang. 173, 1–14. doi: 10.1016/j.gloplacha.2018.11.006
Meyzen, C. M., Toplis, M. J., Humler, E., Ludden, J. N., and Mével, C. (2003). A discontinuity in mantle composition beneath the southwest Indian ridge. Nature 421:731. doi: 10.1038/nature01424
Michael, P. J., Langmuir, C. H., Dick, H. J. B., Snow, J. E., Goldstein, S. L., Graham, D. W., et al. (2003). Magmatic and amagmatic seafloor generation at the ultraslow-spreading Gakkel ridge. Arctic Ocean. Nat. 423:956. doi: 10.1038/nature01704
Mills, B. J. W., Krause, A. J., Scotese, C. R., Hill, D. J., Shields, G. A., and Lenton, T. M. (2019). Modelling the long-term carbon cycle, atmospheric CO2, and Earth surface temperature from late Neoproterozoic to present day. Gondwana Res. 67, 172–186. doi: 10.1016/j.gr.2018.12.001
Minshull, T. A., Muller, M. R., and White, R. S. (2006). Crustal structure of the Southwest Indian Ridge at 66 E: seismic constraints. Geophys. J. Int. 166, 135–147. doi: 10.1111/j.1365-246x.2006.03001.x
Muller, M. R., Minshull, T. A., and White, R. S. (1999). Segmentation and melt supply at the Southwest Indian Ridge. Geology 27, 867–870.
Muller, M. R., Robinson, C. J., Minshull, T. A., White, R. S., and Bickle, M. J. (1997). Thin crust beneath ocean drilling program borehole 735B at the Southwest Indian Ridge? Earth Planet. Sci. Lett. 148, 93–107. doi: 10.1016/S0012-821X(97)00030-37
Müller, R. D., and Dutkiewicz, A. (2018). Oceanic crustal carbon cycle drives 26-million-year atmospheric carbon dioxide periodicities. Sci. Adv. 4:eaaq0500. doi: 10.1126/sciadv.aaq0500
Müller, R. D., Sdrolias, M., Gaina, C., and Roest, W. R. (2008). Age, spreading rates, and spreading asymmetry of the world’s ocean crust. Geochem. Geophys. Geosyst. 9:Q0400. doi: 10.1029/2007GC001743
Müller, R. D., Seton, M., Zahirovic, S., Williams, S. E., Matthews, K. J., Wright, N. M., et al. (2016). Ocean basin evolution and global-scale plate reorganization events since pangea breakup. Annu. Rev. Earth Planet. Sci. 44, 107–138. doi: 10.1146/annurev-earth-060115-12211
Murphy, B. J., and Nance, D. R. (2003). Do supercontinents introvert or extrovert?: Sm-Nd isotope evidence. Geology 31, 873–876. doi: 10.1130/G19668.1
Muto, J., Shibazaki, B., Iinuma, T., and Ito, Y. (2016). Heterogeneous rheology controlled postseismic deformation of the 2011 Tohoku−Oki earthquake. Geophysical. 43, 4971–4978. doi: 10.1002/2016GL068113
Parai, R., and Mukhopadhyay, S. (2012). How large is the subducted water flux? New constraints on mantle regassing rates. Earth Planet. Sci. Lett. 31, 396–406. doi: 10.1016/j.epsl.2011.11.024
Ranero, C. R., Morgan, J. P., McIntosh, K., and Reichert, C. (2003). Bending-related faulting and mantle serpentinization at the Middle America trench. Nature 425, 367–373. doi: 10.1038/nature01961
Reston, T. J., and McDermott, K. G. (2011). Successive detachment faults and mantle unroofing at magma-poor rifted margins. Geology 39, 1071–1074. doi: 10.1130/G32428.1
Rüpke, L. H., Morgan, J. P., Hort, M., and Connolly, J. A. D. (2004). Serpentine and the subduction zone water cycle. Earth Planet. Sci. Lett. 223, 17–34. doi: 10.1016/j.epsl.2004.04.018
Sauter, D., Cannat, M., Rouméjon, S., Andreani, M., Birot, D., Bronner, A., et al. (2013). Continuous exhumation of mantle-derived rocks at the Southwest Indian Ridge for 11 million years. Nat. Geosci. 6:314. doi: 10.1038/ngeo1771
Scambelluri, M., Cannaò, E., and Gilio, M. (2019). The water and fluid-mobile element cycles during serpentinite subduction. A review. Eur. J. Mineral. 31, 405–428. doi: 10.1127/ejm/2019/0031-2842
Schmidt, M. W., and Poli, S. (1998). Experimentally based water budgets for dehydrating slabs and consequences for arc magma generation. Earth Planet. Sci. Lett. 163, 361–379. doi: 10.1016/S0012-821X(98)00142-143
Schmidt, M. W., and Poli, S. (2003). Generation of Mobile Components during Subduction of Oceanic Crust. Treatise Geochem. 3:659. doi: 10.1016/B0-08-043751-6/03034-3036
Seton, M., Müller, R. D., Zahirovic, S., Gaina, C., Torsvik, T., Shephard, G., et al. (2012). Global continental and ocean basin reconstructions since 200Ma. EarthSci. Rev. 113, 212–270. doi: 10.1016/j.earscirev.2012.03.002
Shilobreeva, S., Martinez, I., Busigny, V., Agrinier, P., and Laverne, C. (2011). Insights into C and H storage in the altered oceanic crust: results from ODP/IODP Hole 1256D. Geochim. Cosmochim. Acta 75, 2237–2255. doi: 10.1016/j.gca.2010.11.027
Sleep, N. H., and Barth, G. A. (1997). The nature of oceanic lower crust and shallow mantle emplaced at low spreading rates. Tectonophysics 279, 181–191. doi: 10.1016/s0040-1951(97)00121-122
Sleep, N. H., and Zahnle, K. (2001). Carbon dioxide cycling and implications for climate on ancient Earth. J. Geophys. Res. 106, 1373–1399. doi: 10.1029/2000JE001247
Staudigel, H., Plank, T., White, B., and Schmincke, H.-U. (1996). “Geochemical fluxes during seafloor alteration of the basaltic upper oceanic crust: DSDP Sites 417 and 418: Bebout/Subduction top to bottom,” in Subduction Top to Bottom Geophysical Monograph Series, eds G. E. Bebout, D. W. Scholl, S. H. Kirby, and J. P. Platt, (Washington, D. C: American Geophysical Union), 19–38. doi: 10.1029/gm096p0019
Tetley, M. G., Li, Z.-X., Matthews, K. J., Williams, S. E., and Müller, R. D. (in press). Decoding earth’s plate tectonic history using sparse geochemical data. Geosci. Front. doi: 10.1016/j.gsf.2019.05.002
Tetley, M. G., Williams, S. E., Gurnis, M., Flament, N., and Müller, R. D. (2019). Constraining absolute plate motions since the Triassic. J. Geophys. Res. 124, 7231–7258. doi: 10.1029/2019JB017442
Thompson, A. B. (1992). Water in the Earth’s upper mantle. Nature 358, 295–302. doi: 10.1038/358295a0
Torsvik, T. H., and Cocks, L. R. M. (2016). Earth History and Palaeogeography. Cambridge: Cambridge University Press.
Torsvik, T. H., Steinberger, B., Gurnis, M., and Gaina, C. (2010). Plate tectonics and net lithosphere rotation over the past 150My. Earth Planet. Sci. Lett. 291, 106–112. doi: 10.1016/j.epsl.2009.12.055
Torsvik, T. H., Steinberger, B., Shephard, G. E., Doubrovine, P. V., Gaina, C., Domeier, M., et al. (2019). Pacific−panthalassic reconstructions: overview, errata and the way forward. Geochem. Geophys. Geosyst. 20, 3659–3689. doi: 10.1029/2019GC008402
Torsvik, T. H., Van der Voo, R., Preeden, U., Mac Niocaill, C., Steinberger, B., Doubrovine, P. V., et al. (2012). Phanerozoic polar wander, palaeogeography and dynamics. Earth-Sci. Rev. 114, 325–368. doi: 10.1016/j.earscirev.2012.06.007
Tucholke, B. E., Behn, M. D., Roger Buck, W., and Lin, J. (2008). Role of melt supply in oceanic detachment faulting and formation of megamullions. Geology 36, 455–458. doi: 10.1130/G24639A.1
Tucholke, B. E., and Lin, J. (1994). A geological model for the structure of ridge segments in slow spreading ocean crust. J. Geophys. Res. 99, 11937–11958. doi: 10.1029/94JB00338
Van Der Meer, D. G., Zeebe, R. E., van Hinsbergen, D. J. J., Sluijs, A., Spakman, W., and Torsvik, T. H. (2014). Plate tectonic controls on atmospheric CO2 levels since the Triassic. Proc. Natl. Acad. Sci. U.S.A. 111, 4380–4385. doi: 10.1073/pnas.1315657111
van Keken, P. E., Hacker, B. R., Syracuse, E. M., and Abers, G. A. (2011). Subduction factory: 4. Depth-dependent flux of H2O from subducting slabs worldwide. J. Geophys. Res 116, B01401. doi: 10.1029/2010JB007922
Worman, S. L., Pratson, L. F., Karson, J. A., and Klein, E. M. (2016). Global rate and distribution of H2 gas produced by serpentinization within oceanic lithosphere: H2 formation in ocean lithosphere. Geophys. Res. Lett. 43, 6435–6443. doi: 10.1002/2016GL069066
Wright, N. M., Seton, M., Williams, S. E., and Müller, R. D. (2016). The Late Cretaceous to recent tectonic history of the Pacific Ocean basin. Earth-Sci. Rev. 154, 138–173. doi: 10.1016/j.earscirev.2015.11.015
Young, A., Flament, N., Maloney, K., Williams, S., Matthews, K., Zahirovic, S., et al. (2019). Global kinematics of tectonic plates and subduction zones since the late Paleozoic Era. Geosci. Front. 10, 989–1013. doi: 10.1016/j.gsf.2018.05.011
Zastrozhnov, D., Gernigon, L., Gogin, I., Abdelmalak, M. M., Planke, S., Faleide, J. I., et al. (2018). Cretaceous-paleocene evolution and crustal structure of the northern vøring margin (Offshore Mid-Norway): results from integrated geological and geophysical study. Tectonics 37, 497–528. doi: 10.1002/2017TC004655
Keywords: deep carbon cycle, serpentinite, subduction flux, water and carbon storage, oceanic crust, tectonics
Citation: Merdith AS, Atkins SE and Tetley MG (2019) Tectonic Controls on Carbon and Serpentinite Storage in Subducted Upper Oceanic Lithosphere for the Past 320 Ma. Front. Earth Sci. 7:332. doi: 10.3389/feart.2019.00332
Received: 19 June 2019; Accepted: 29 November 2019;
Published: 13 December 2019.
Edited by:
Dan J. Bower, University of Bern, SwitzerlandCopyright © 2019 Merdith, Atkins and Tetley. This is an open-access article distributed under the terms of the Creative Commons Attribution License (CC BY). The use, distribution or reproduction in other forums is permitted, provided the original author(s) and the copyright owner(s) are credited and that the original publication in this journal is cited, in accordance with accepted academic practice. No use, distribution or reproduction is permitted which does not comply with these terms.
*Correspondence: Andrew S. Merdith, YW5kcmV3Lm1lcmRpdGhAdW5pdi1seW9uMS5mcg==