Corrigendum: Topography and Tilt at Volcanoes
- School of Earth & Environment, The University of Leeds, Leeds, United Kingdom
For optimal monitoring of the deformation of a volcano, instrumentation should be deployed at the location most sensitive to changes at the suspected deformation source. The topographic effect on tilt depends strongly on the orientation of the deformation field relative to the surface on which the instrument is deployed. This fact has long been understood and corrected for in tilt measurements related to body tides and referred to as “cavity” or “topographic effects” (Harrison, 1976). Despite this, and whilst topography at volcanoes is often significant, until now the topographic effect on tilt at volcanoes has not been systematically explored. Here, we investigate the topographic effect on tilt produced by either the pressurization of a reservoir or conduit, or shear stress as magma ascends through a conduit, using 2D axisymmetric and 3D finite element deformation modeling. We show that topography alone can amplify or reduce the tilt by more than an order of magnitude, and control the orientation of the maximum tilt. Therefore, a decrease in tilt can even be caused by an increase in deformation at the source. Hence, inverting for the source stress using simple analytical models that neglect topography could potentially lead to a misinterpretation of how the volcanic system is evolving. Since topographic features can amplify the tilt signal, they can be exploited when deciding upon an installation site.
1. Introduction
Deformation at volcanoes can be generated by a number of different sources. Broad centimeter to meter-scale uplift and subsidence over periods of months to years can be indicative of inflation and deflation of a magma reservoir at depth (Mogi, 1958). Close to the conduit, cyclic variations in tilt have been linked to shear stress exerted on the conduit wall as magma ascends (Beauducel et al., 2000; Neuberg et al., 2018; Marsden et al., 2019). Near-field deformation has also been linked to a pressure source in the upper edifice (Voight et al., 1999; Widiwijayanti et al., 2005; Hautmann et al., 2009). Inversion and forward modeling can be performed to estimate the source geometry and the amplitude of the stress responsible for the observed deformation, taking key factors such as viscoelasticity (Newman et al., 2006; Del Negro et al., 2009), topography (McTigue and Segall, 1988; Cayol and Cornet, 1998; Ronchin et al., 2015), and mechanical heterogeneity (Trasatti et al., 2003; Hautmann et al., 2010; Hickey and Gottsmann, 2014) into account.
Tiltmeters are commonly deployed at volcanoes to measure deformation, and are typically sensitive to a precision of at least 1 μrad, equivalent to an uplift of 1 mm over a horizontal distance of 1 km. Due to this precision, tilt is highly sensitive to small changes in the stress field, as observed in the local vicinity of topographic features such as valleys, cliffs, and ridges. Harrison (1976) showed that tilt caused by earth tides can be significantly higher on the slopes of a valley than on a flat surface. However, how topography affects tilt is dependent on the orientation of the deformation field relative to the surface on which the instrument is deployed. Volcanoes often have considerable relief and complex topography. Hence, we systematically explore the effect of volcanic topography on the monitored tilt signal.
We investigate how tilt induced by either shear stress, conduit, or reservoir pressure is influenced by topography, using the finite element numerical modeling software COMSOL Multiphysics v5.4. We show that topography alone can amplify, reduce, or even reverse the polarity of the tilt signal. Firstly, in section 2 we show analytically that tilt is dependent on the original slope angle. In section 3, we present results of 2D axisymmetric modeling to investigate the influence that the relief of the edifice has on tilt by varying the elevation of a Gaussian-sloped volcano topography. We then, in section 4, show how the local topography affects the tilt by introducing changes in slope into our models. Finally, in section 5, we assess how tilt varies spatially across real topography by incorporating 10 × 10 m digital elevation models of Tungurahua volcano, Ecuador, and Soufrière Hills volcano, Montserrat (SHV) into 3D models. We also show how topography can be exploited to enhance the signal amplitude.
In each of the following sections, we consider the following three axisymmetric deformation sources:
• Reservoir pressure: A spherical reservoir centered directly below the summit at a depth of 8 km below the mean elevation, with a radius of 500 m and a pressure of 20 MPa.
• Conduit shear stress: Reference depth-variant shear stress profile from Marsden et al. (2019), derived through flow modeling, extending from the surface to a depth of 5 km.
• Conduit pressure: Depth-variant over-pressure profile from the same model in Marsden et al. (2019), similarly extending from the surface to a depth of 5 km.
In section 5, we also discuss the topographic effect on tilt produced by 3D deformation sources, where the orientation of the maximum tilt is not radial from the source even in the absence of topography.
2. Influence of the Original Slope Angle
Tilt is dependent on both the source stress and the orientation of the displacement field relative to the surface where tilt is measured. Consider a purely vertical displacement field along a simple slope, where the amount of displacement decreases linearly from w to 0 at distance x (Figure 1A). The change in slope, or tilt, Δθ, is a function of the original slope angle θ,
where z = x tan θ. By solving Equation (1) for a suite of slope angles θ, holding w and x constant, we show that the tilt Δθ is greatest where the original slope is horizontal, and no tilt is generated where the slope is vertical (Figure 1A). Results are normalized by the maximum tilt, Δθmax.
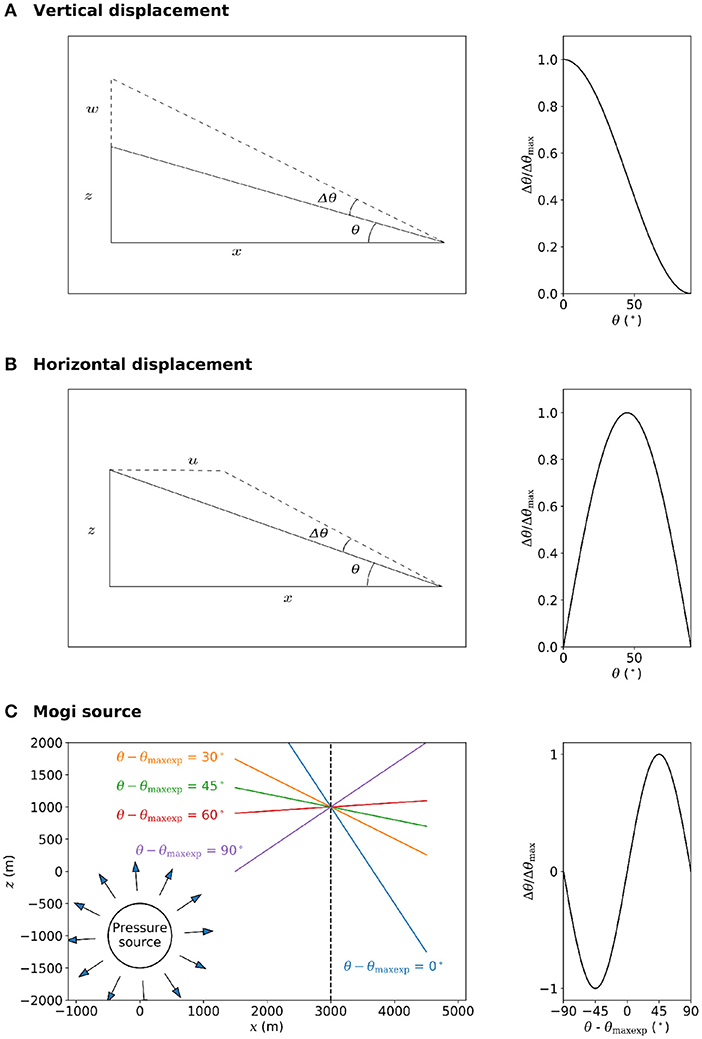
Figure 1. Tilt produced by purely vertical (A) or horizontal (B) displacement that decreases linearly with distance from the conduit, as a function of the original angle of the slope θ. (C): Tilt induced by a spherical source, as a function of slope angle, where θ − θmaxexp = 0 when the slope is perpendicular to the displacement field.
Similarly, we can consider a purely horizontal displacement field where the amount of displacement decreases linearly from u to 0 at distance x (Figure 1B).
Holding u and x constant, Equation (4) shows that no tilt is produced where the ground is horizontal or vertical, and the highest tilt, Δθ/Δθmax, is produced where the slope is at 45° (Figure 1B).
Inflation or deflation of a magma reservoir is commonly modeled analytically using a point source (Mogi, 1958), where the orientation of the displacement field at the surface varies with horizontal distance from the source. The point source approximation is valid for a spherical source where the source radius is small with respect to the distance from that source. Addressing the influence of topography, Cayol and Cornet (1998) showed that displacement produced by reservoir pressure is greater at lower elevation, where the surface is closer to the source. Delving further, Ronchin et al. (2015) found that the slope angle θ is a secondary control on the displacement. Through numerical modeling, they showed that the maximum displacement is produced where the surface is perpendicular to a line between the surface and source, where the exposure to the pressure source is greatest. We refer to the slope angle with the maximum exposure to the source at any point as θmaxexp, and the deviation from this angle as θ − θmaxexp. Hence, tilt generated by a point or spherical source is influenced by the slope angle. We vary this over a 90° range around a point centered at x = 3 km, z = 3 km (Figure 1C). We calculate u and w at each point along the slope using it's distance from the centre of a Mogi source (x = 0 km, z = −1 km)
where ΔP is the pressure, α is the source radius, d is the vertical distance between each point and the source center, ν is the Poisson's ratio and Em is the Young's modulus. v is the displacement in the y direction, which is not used in this 2D example, but is considered in the 3D modeling later in section 5. The new slope angle can be computed as the derivative of the new coordinates for each point along the slope, x + u and z + w. The tilt Δθ is then calculated as the change in slope angle. Beauducel and Carbone (2015) suggested that tilt induced by a spherical pressure source is greater where the slope of the edifice is steeper. However, we find that the tilt Δθ/Δθmax is greatest where the surface is 45° from the angle of maximum exposure, i.e., where θ − θmaxexp = 45° (Figure 1C). In other words, no tilt is produced where the surface is parallel or perpendicular to the displacement field, and the highest tilt is generated where the surface is 45° from this. This, unsurprisingly, is as previously shown for a purely horizontal displacement field.
3. Relief of the Edifice
The surface directly above a point source in an elastic half-space is pushed vertically upwards as pressure increases, as the surface is perpendicular to the displacement field. Moving horizontally away from this point, the surface rotates outwards, away from the source, which we define as a positive radial tilt. McTigue and Segall (1988) showed that where the relief of the edifice is considerable, such that the surface vertically above the source is further from the source than a point down slope, the surface rotates inwards, hence a negative radial tilt is produced. In this case, the amplitude of displacement is greater at a point down slope than directly above the source. Whilst this relationship has been examined for a point source, the topographic effect on tilt produced by conduit pressure or shear stress has not been investigated. Here, we perform 2D axisymmetric deformation modeling using COMSOL Multiphysics v5.4 to investigate how edifice relief influences the tilt produced by conduit pressure and shear stress. We include a volcanic edifice with a Gaussian slope, where the elevation z is calculated as
where x is the horizontal distance from the source, and the maximum relief zmax is varied between 0 and 3 km. Roller boundary conditions that allow vertical motion only are applied to the lateral model boundaries. The base of the model is fixed in all directions. The model is extended to a radius of 40 km and a depth of 50 km to avoid numerical effects from these boundary conditions. The surface may deform freely. A spatially-variant triangular mesh is used, that allows complex geometries to be suitably meshed easily. A finer mesh is used in the upper 3 km below the surface to a horizontal distance of 10 km, where the modeled solution is examined, and thus a higher degree of accuracy is required (Figure 2D). A minimum element size of around 30 m is used within this region. A sensitivity analysis was necessary to ensure that a sufficiently fine mesh was used, until the solution was consistent if the mesh was refined further. The Young's modulus and Poisson's ratio of the medium are set at 1 GPa and 0.25, respectively. The numerical models were benchmarked against the analytical solution for a Mogi source.
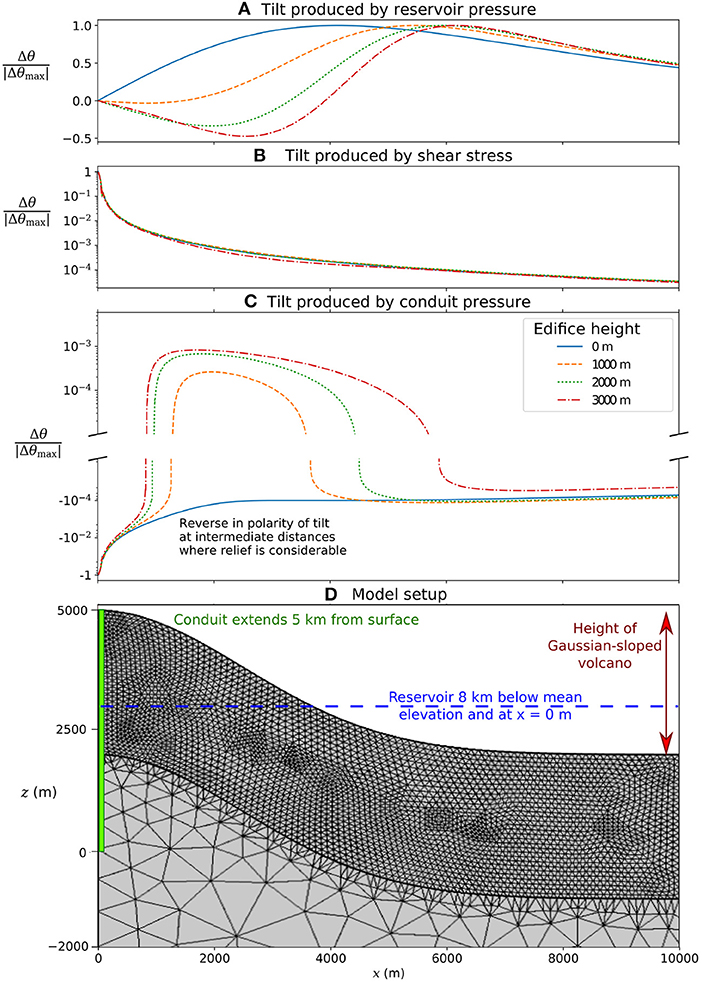
Figure 2. Modeled tilt Δθ produced by (A) reservoir pressure, (B) shear stress, or (C) conduit pressure, each as a function of horizontal distance from the conduit x. The height of the Gaussian-sloped volcano is varied. (D) Model setup. A high resolution mesh is used to a depth of 3 km below the surface, to a horizontal distance of 10 km, with a minimum element size of around 30 m.
For both a shear stress or a conduit pressure source, the strongest tilt signal can be seen close to the conduit while it decreases with increasing distance (Figure 2). The influence of the relief on tilt produced by shear stress appears to be minimal, and the resulting tilt is always positive, irrespective of the relief. In the absence of relief, a negative radial tilt is induced by conduit pressure at all locations. However, where the relief is considerable, such that the component of the displacement pushing the surface perpendicularly outwards decreases with increasing distance from the conduit, a positive radial tilt is modeled at intermediate distances from the conduit. Here, we must consider how both the total displacement, and the alignment of the displacement field with the surface (Figure 3), vary with distance from the conduit.
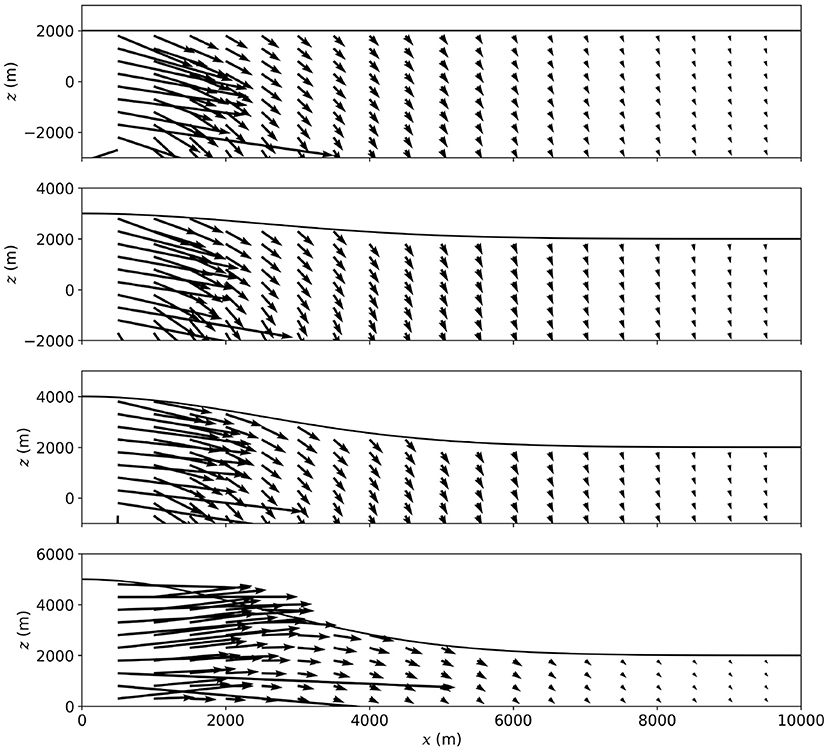
Figure 3. Deformation field produced by overpressure of the conduit for a suite of values for the edifice relief. In each case the pressure source extends from the surface to 5 km below. The arrows depict the amplitude and orientation of the displacement field at each point.
4. Local Topography
To investigate the effect of local topography on tilt, we introduce breaks in slope into our model (Figure 4). A tapering feature was used to avoid sharp edges at the breaks in slope. We include one slope facing away from the center of the model, hereon referred to as the proximal slope. This is opposed by a slope facing toward the center of the model, hereon referred to as the distal slope. The opposing slopes each dip at 60° from horizontal and are separated by a horizontal distance of 100 m. With this pair of opposing slopes, we attempt to represent topographic features such as cliffs and valleys. We focus on this morphology, as Johnson et al. (2019) have shown that anomalous tilt measurements can be produced in close proximity to the cliffs of a caldera rim. The resolution of the triangular mesh is increased in the close vicinity of each break in slope, to a minimum element size of around 20 cm. The location of these opposing slopes is varied.
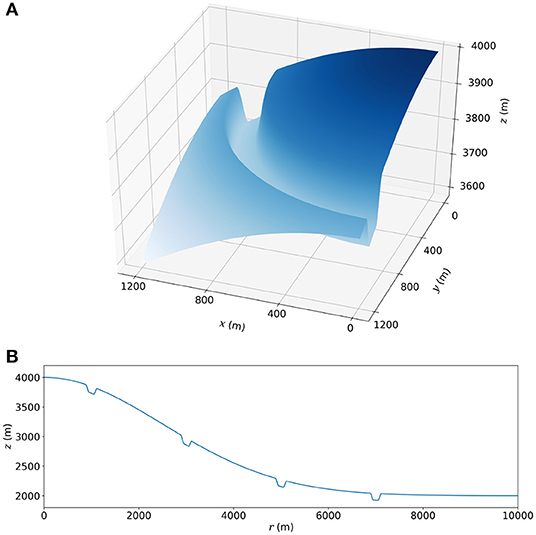
Figure 4. Two opposing slopes introduced onto the Gaussian-sloped edifice, in (A) 3D and (B) 2D axisymmetric space.
Since the topographic effect on tilt is predominantly limited to the extent of the topographic feature (Harrison, 1976), the topographic effect of each break in slope can be considered in isolation. Thus, the topographic effect of a range of features can be inferred based on our models, such as cliffs, ridges, and valleys. Whilst Harrison (1976) investigated how tilt induced by earth tides is affected by the inclusion of a cavity or valley, the topographic effect on tilt generated by volcanic sources may be considerably different, due to (1) differences in the orientation of the deformation field with respect to the surface, and (2) the spatial extent of deformation is much smaller for shallow volcanic sources than generated by earth tides, and can be similar to the scale of typical topographic features found at volcanoes (Figure 2).
To isolate the topographic effect on tilt, in each case the radial tilt Δθ is divided by the “reference” tilt, Δθr, modeled for a Gaussian slope or flat surface, at the same x coordinate, in the absence of local topography. We introduce the following parameters that are used in the following sections:
• ΔθAMP = Δθ/Δθr is the factor by which topography has amplified or reduced tilt. In the absence of local topography, ΔθAMP = 1.
• ΔθDIFF = (Δθ − Δθr)/|Δθr| is the difference in tilt due to topography. In the absence of local topography ΔθDIFF = 0. Where ΔθDIFF is positive, the radial tilt is higher due to the presence of the local topography. Note that Δθ and Δθr could still be either positive or negative depending on the direction of the slope rotation.
By plotting how these parameters vary across the topography, as opposed to the tilt Δθ, our results are not masked by the decrease in tilt with distance from the source. Also, the absolute amplitude of the tilt Δθ is strongly dependent on the mechanical properties of the edifice, which are often poorly constrained. However, ΔθAMP and ΔθDIFF are not, and so they can be used to quantify the topographic effect on tilt irrespective of these mechanical properties.
4.1. Reservoir Pressure
Here, we investigate the topographic effect on tilt produced by the pressurization of a magma reservoir, for opposing slopes centered at either x = 0.5, 4, 7, or 9.5 km (Figure 5). For a spherical pressure source, the total displacement decreases with increasing distance from the source. For an edifice with a relief of 3 km as shown here, the summit is not the closest point to the source. How tilt varies across the slopes depends on the relative amount of vertical and horizontal displacement, w and u, respectively. The vertical component of displacement, w, is greater at the base of each slope than at the top, hence the height of each slope reduces. Each slope must become shallower to accommodate this. Competing against this, since the horizontal component u is greater on the proximal slope than the distal slope, the opposing slopes are pushed closer together and steepen. For opposing slopes introduced at x < 7 km, where u < w, the radial tilt is reduced on the proximal slope (ΔθDIFF < 0) and increased on the distal slope (ΔθDIFF > 0). For opposing slopes centered at x = 0.5 km, where the displacement field is predominantly vertical, the polarity of the radial tilt is reversed toward the base of the distal slope due to topography (ΔθAMP < 0). Here, Δθr is negative (Figure 2). However, if the relief of the edifice is less pronounced, Δθr would be positive, and thus ΔθAMP would be negative on the proximal slope. For opposing slopes introduced at x > 7 km, whilst each slope tilts away from the source, the radial tilt is increased on the proximal slope (ΔθDIFF > 0) and reduced on the distal slope due to topography (ΔθDIFF < 0). For opposing slopes introduced at x = 7 km, ΔθAMP is close to one at most points, meaning that the topographic effect on tilt is in this case small. This topographic effect on tilt is, however, more pronounced in close proximity of the base of each slope.
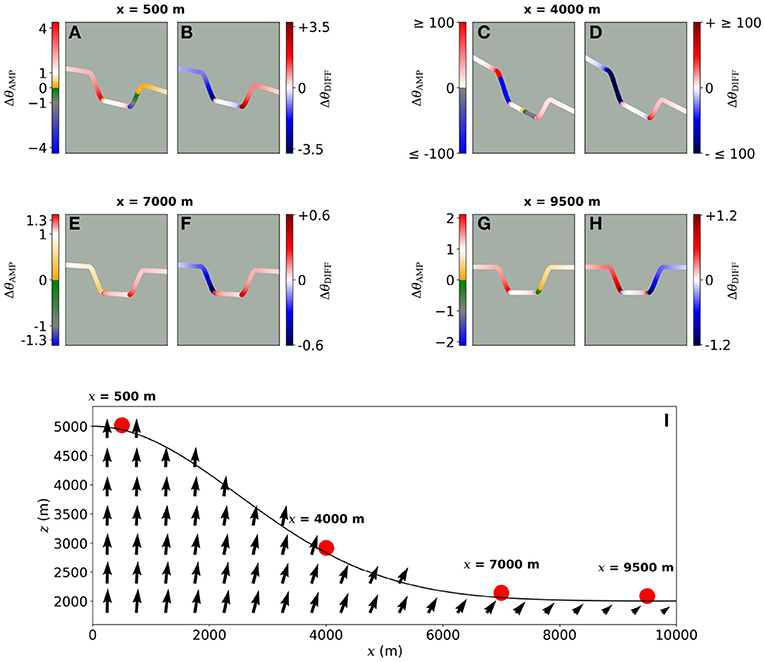
Figure 5. (A–H) Amplification factor and difference due to the topographic effect on tilt generated by reservoir pressure, where opposing slopes are included at either x = 500, 4,000, 7,000, or 9,500 m, as indicated by red dots. (I) Amplitude and orientation of the displacement field produced by reservoir pressure.
Irrespective of the location of the opposing slopes, the effect on tilt is greatest close to the base of each slope (|ΔθAMP| is high). The highest values of |ΔθAMP| are obtained with the opposing slopes centered at x = 4 km. Here, the reference tilt, Δθr, is close to zero (Figure 2) and is insensitive to changes in the reservoir pressure. Interestingly however, the surface of the Gaussian slope at this point is close to perpendicular to the displacement field. Consequently, the amount by which the base and top of each slope move closer together is relatively large here, and the tilt is amplified significantly on the slopes. This suggests that for two points in close proximity at the same elevation and distance from the source, a relatively high tilt can be produced at one, and no tilt at the other, with the local topography being the only difference.
4.2. Conduit Shear Stress
Shear stress produces a predominantly vertical displacement field, but the ratio u/w increases with distance from the conduit (Figure 6f). Opposing slopes introduced at any location will each rotate away from the conduit as a result of shear stress (i.e., Δθ is positive). Whilst in our models the tilt Δθ is always higher on the proximal slope than the distal, due to tilt decreasing significantly with increasing distance from the conduit (Figure 2), the topographic effect on the tilt varies between the opposing slopes, and depends on the location of the topographic feature. Here we show that this depends on whether the slopes are located in a predominantly extensional (where du/dx is positive) or compressional (where du/dx is negative) regime horizontally. We present results for an edifice with a relief of 2 km (Figure 6), such that opposing slopes at x = 2.5 km are situated in an extensional regime, whilst opposing slopes at 9 km are situated in a compressional regime. The distance between opposing slopes at x = 2.5 km increases due to extension, and so the modeled tilt is reduced ΔθAMP < 1 on the proximal slope, and amplified on the distal slope ΔθAMP > 1. Contrary to this, the distance between opposing slopes centered at x = 9 km decreases due to compression, so the modeled tilt is amplified ΔθAMP > 1 on the proximal slope, and reduced toward the base of the distal slope ΔθAMP < 1. In both cases, the tilt is amplified at the base of the each slope.
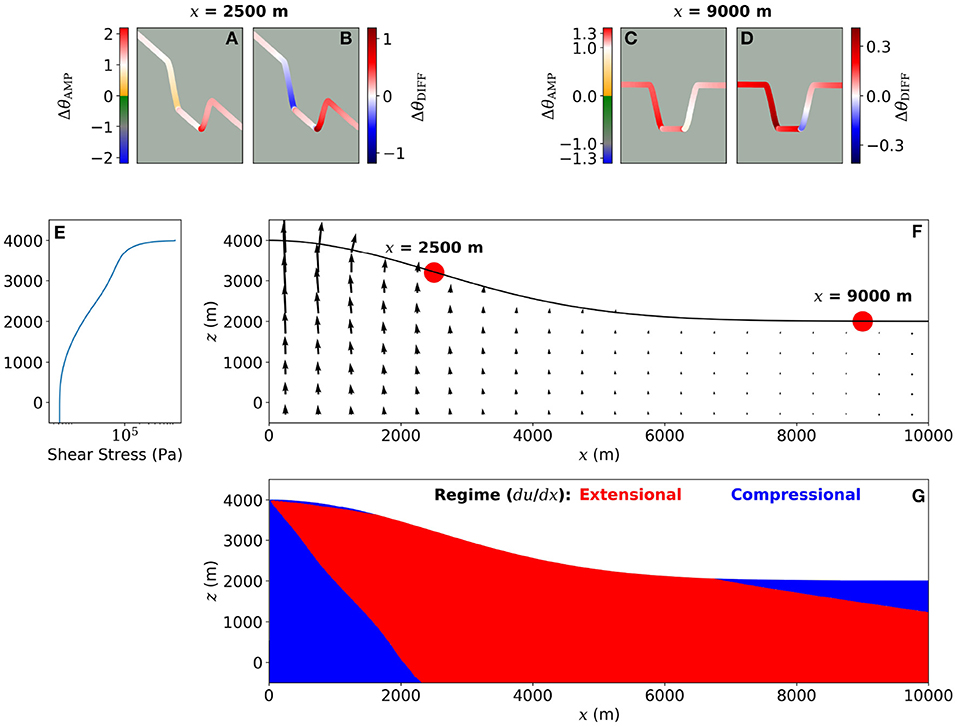
Figure 6. (A–D) Amplification factor and difference due to the topographic effect on tilt produced by shear stress, where opposing slopes are included at either x = 2,500 or 9,000 m, as indicated by red dots. (E) Depth variant shear stress profile from flow modeling of Marsden et al. (2019). (F) Amplitude and orientation of the displacement field produced by shear stress. (G) du/dx, red where positive and horizontal displacement is increasing with increasing x, and so the horizontal distance between points is increasing (extension), blue where negative and the horizontal distance between points is decreasing (compression).
If the surface is flat, an extensional regime is only observed close to the surface within a few hundred meters of the conduit (Figure 7). However, where the relief is considerable, an extensional regime is exerted at the surface at much greater distances from the conduit. Therefore, whether the tilt is amplified or reduced by local topography depends on the relief of the edifice and the location of the topographic feature.
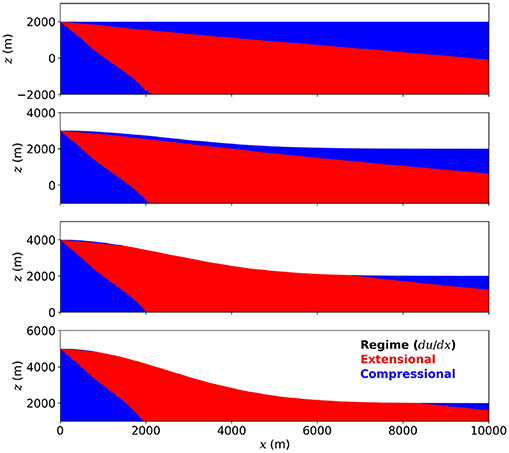
Figure 7. du/dx, red where positive and horizontal displacement is increasing with increasing x, and so the horizontal distance between points is increasing (extension). Blue where negative, and the horizontal distance between points is decreasing (compression). Results are presented for edifices with heights between 2,000 and 5,000 m.
4.3. Conduit Pressure
Conduit pressure produces a predominantly horizontal displacement field close to the conduit (Figure 3), and the amplitude of this displacement decreases with increasing distance from the conduit (Figure 2). Wherever this is the case, opposing slopes introduced close to the conduit will be pushed closer together by conduit pressure and steepen, i.e., ΔθDIFF will be positive on the proximal slope and negative on the distal slope (Figures 8b,d). In the absence of local topography, the polarity of the reference tilt, Δθr, depends on the relief of the edifice and distance from the conduit (section 3), and therefore so too does ΔθAMP (Figures 8a,c). Where an edifice with a relief of 1 km is modeled, Δθr is negative at x = 0.5 km and positive at x = 1.5 km. Hence, when opposing slopes are introduced at x = 500 m, the tilt is reduced (ΔθAMP < 1) on the proximal slope and amplified (ΔθAMP > 1) on the distal slope (Figure 8). In contrast to this, when opposing slopes are introduced at x = 1.5 km, the tilt is amplified on the proximal slope (ΔθAMP > 1), whilst on the distal slope, ΔθAMP < −1. This means that the tilt is amplified and reversed in polarity on the distal slope in this case. Therefore, topography can amplify, reduce, or reverse the polarity of tilt induced by conduit pressure depending on the relief of the edifice and the distance between the topographic feature and the conduit.
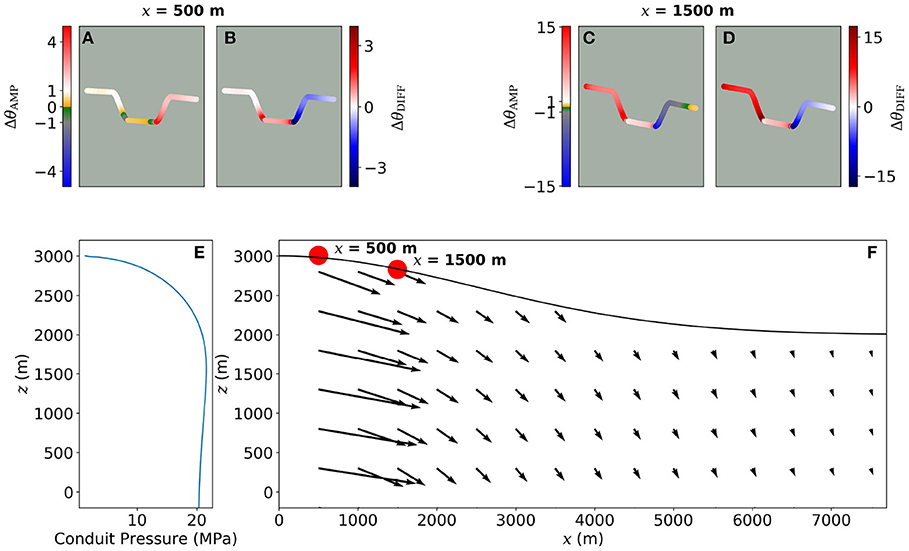
Figure 8. (A–D) Amplification factor and difference due to the topographic effect on tilt produced by conduit pressure, where opposing slopes are included at either x = 500 or 1,500 m, as indicated by red dots. (E) Depth variant pressure profile from flow modeling of Marsden et al. (2019). (F) The amplitude and orientation of the displacement field produced by shear stress.
5. Real Topography
The 2D axisymmetric models in sections 3, 4 are useful in demonstrating how exaggerated features of simplified topography can affect the tilt. However, it is important to consider whether the effect of real topography is significant or negligible. To do this, we present results of 3D deformation modeling, using 10 m × 10 m digital elevation models (DEMs) of Tungurahua volcano, Ecuador and Soufrire Hills volcano, Montserrat (SHV), and compare how tilt varies spatially across both DEMs where topography is the only variable. We again asses the topographic effect on tilt induced by each of the sources described in section 1. The mesh must be suitably fine such that the resolution of the DEM is matched. Beauducel and Carbone (2015) investigated the influence of real topography on tilt produced by a spherical pressure source. However, since they use a spatially variant mesh with a minimum element size of 200 m, they thus do not consider the influence of local topography, which we show can significantly influence the tilt (section 4). Here, we use spatially variant triangular mesh across the entire DEM, to a distance of almost 8 km in x and y from the conduit, with a minimum element size of ~1 m where the topography is most complex. The model is extrapolated to distance of 40 km in x and y and a depth of 50 km, to ensure that the deformation within the region that the DEM covers is not affected by the boundary constraints, described in section 3. A much coarser mesh (maximum element size ~7 km) is used for this extrapolation. We consider the maximum tilt for Δθ, which is always positive and not necessarily radial to the source.
In defining the reference tilt, Δθr, we followed the common practice where topography is not considered. Therefore, ΔθAMP is the factor by which the modeled tilt is scaled when topography is considered relative to the common practice when it is not. For tilt generated by reservoir pressure, an analytical solution was used (Mogi, 1958) (Equation 7), taking the x, y, z coordinates of each individual point across the mesh to calculate Δθr. For tilt produced by conduit pressure or shear stress, in the absence of an available analytical solution, we obtain Δθr from 2D axisymmetric models using a constant slope, based on the average dip angle radially away from the summit for each edifice. This mimics the approach of Albino et al. (2011), who represent topography using only this first-order approximation. The computation of this average dip angle, and a full description of these 2D axisymmetric models, is included in the Supplementary Material, Section S1.
Figure 9 shows how the topographic effect on tilt generated by each source varies spatially across each DEM. The gradient of the topography is used to generate an illumination model, that highlights how ΔθAMP correlates with the topography. Particularly for the reservoir or conduit pressure sources, the azimuth of the maximum tilt is often not radial to the source. Thus, if the radial rather than maximum tilt is used when inverting for the source stress, the stress amplitude could be greatly underestimated. Where the maximum tilt is orientated toward the source, an increase in stress would be falsely interpreted as a decrease in stress.
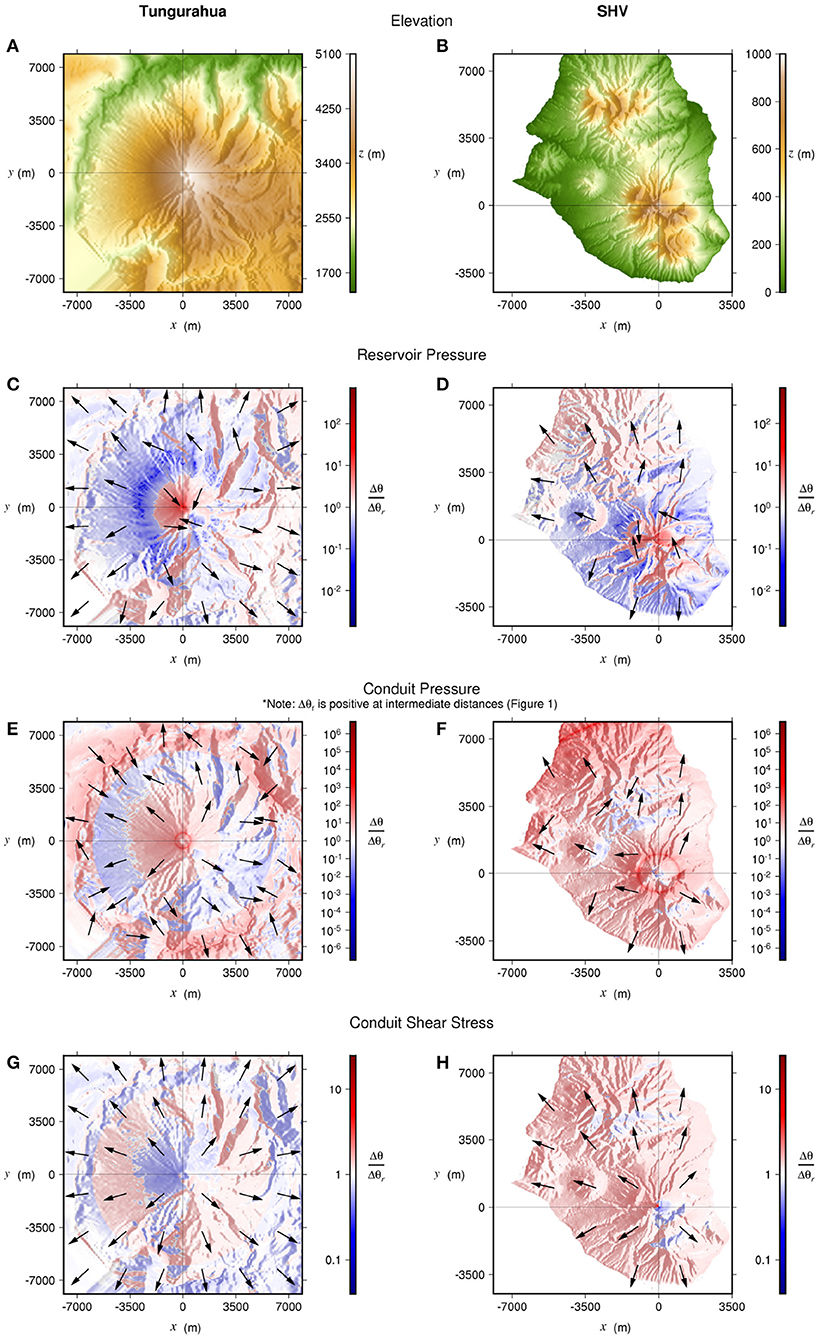
Figure 9. DEMs of Tungurahua volcano (left) and SHV (right) (A,B). Amplification factor due to the topographic effect on tilt produced by reservoir pressure (C,D), conduit pressure (E,F), or shear stress (G,H). The arrows depict the orientation of the maximum tilt. Note that this is often not radial to the source, located at x = 0 m, y = 0 m in each case.
The topographic effect on tilt is most obviously apparent for tilt induced by reservoir pressure, where tilt is clearly amplified and reduced on opposing sides of topographic features such as ridges and valleys. In some cases ΔθAMP varies by over an order magnitude over horizontal distances of just tens of meters. ΔθAMP is very high directly above the deformation source, where Δθr approaches zero. Close to the summit, the surface tilts inwards toward the center of the model, due to the summit being further away from the center of the source that the surface further down slope (McTigue and Segall, 1988). At a large distance from the summit, the surface tilts away from the summit. At an intermediate distance between the two, Δθ, and therefore ΔθAMP, approach zero.
The radial tilt induced by conduit pressure intercepts zero at a certain distance from the conduit, as shown in section 3. Rings of apparently high ΔθAMP values are therefore visible in Figures 9E,F, at constant distances from the conduit, where Δθr approaches zero. Elsewhere, tilt generated by conduit pressure is amplified or reduced by over an order of magnitude at many locations. For a shear stress source, whilst ΔθAMP is generally closer to 1, and the direction of the maximum tilt is close to radial from the source, the topographic effect on tilt is apparent nonetheless.
Other volcanic deformation sources, such as the pressurization of a dyke, are non-axisymmetric and so even in the absence of topography the tilt produced must be described in 3D (Figure 10B). Here we consider a NW-SE striking dyke, 2 m wide, 450 m long and extending from 1.2 to 5 km below the summit, the inferred geometry of a dyke at SHV (Costa et al., 2007a,b; Hautmann et al., 2009). The dyke is modeled as a cuboid for simplicity, centered at x = 0 km, y = 0 km, and a pressure of 20 MPa is applied along the length of both walls of the dyke. Δθr is obtained through forward modeling, using an axisymmetric geometry for the edifice as used in the modeling of conduit pressure or shear stress. Hence, this modeling is performed in 3D model space to enable us to include an elongate source. The topographic effect on the tilt is complex (Figures 10C,D), and depends on many factors such as the dyke geometry, strike, location, and depth below the surface. Since the orientation of the displacement field varies spatially (Figure 10A), and because there is compression and extension at different locations with respect to the dyke, it is difficult to discern generalized relationships that describe the topographic effect on tilt in this case. This emphasizes the complexity of the issue and why topography must be considered when interpreting tilt data on a case-by-case basis.
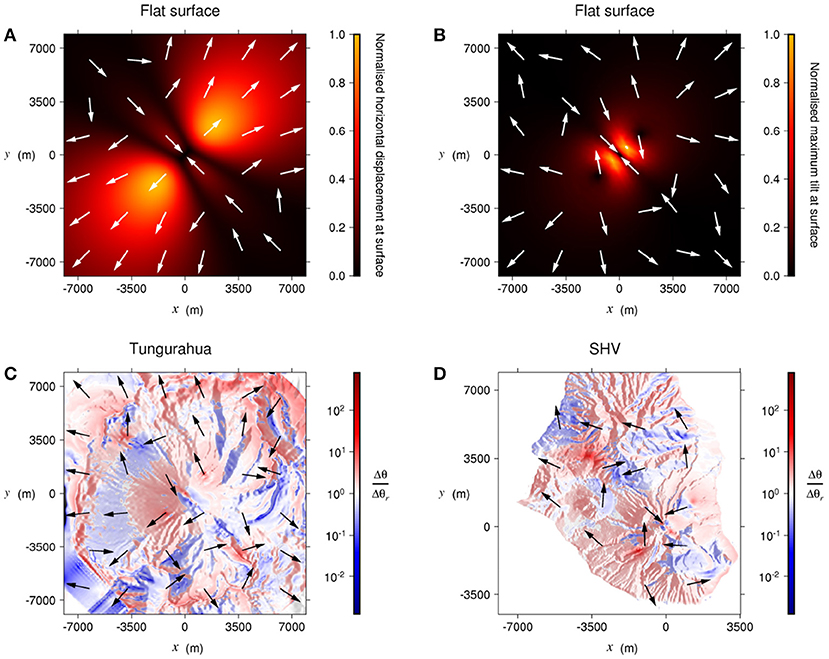
Figure 10. Deformation produced by the pressurization of a NW-SE striking dyke. (A) Normalized amplitude and orientation of the displacement field for a dyke 1.2 km below a flat surface, (B) Normalized amplitude and orientation of the maximum tilt for the same dyke below a flat surface. (C) Amplification factor due to the topographic effect on tilt for the same dyke 1.2 km below the summit of Tungurahua and (D) SHV. The dyke is located at x = 0 m, y = 0 m in each case.
We have shown that topography can amplify, reduce, or change the direction of the maximum tilt measured. If not accounted for in the modeling processes, the topographic effect on tilt will appear as misfit between data and model output and be wrongly absorbed by inferred source parameters. This trade-off can only be avoided by deploying several stations. Johnson et al. (2019) showed that if multiple tiltmeters are deployed, the topographic effect on tilt can be identified as anomalous measurement at an individual station.
6. Deployment Recommendations
When deciding where to deploy a tiltmeter, performing 3D deformation modeling that includes a DEM and a best guess of the source type, location, and geometry would be beneficial. This will enable one to assess how tilt will vary spatially due to stress for several source types. Besides deployment and maintenance, the following issues should be considered for each potential deformation source:
Reservoir pressure
• The azimuth of the maximum tilt is often not radial to the source. If the edifice has considerable relief, a decrease in the radial tilt could be induced by an increase in pressure.
• Tilt can be either significantly amplified or reduced on slopes that are considerably steeper than the surrounding topography, depending on the orientation of the displacement field relative to that slope. This is best determined through modeling.
Conduit shear stress
• A tiltmeter should be deployed as close to the conduit as possible to monitor changes in shear stress.
• Tilt can be either amplified or reduced toward the base of steep slopes, depending on the relief of the edifice, the distance from the conduit, and whether the slope is facing toward or away from the conduit.
• However, the topographic effect on tilt produced by shear stress is relatively small in most cases, and deploying a tiltmeter close to the conduit is key.
Conduit pressure
• Tilt produced due to changes in conduit pressure is greatest close to the conduit.
• An increase in pressure could be recorded as either an increase or decrease in tilt, depending on the distance between the tiltmeter and conduit and the relief of the edifice. This is best determined through modeling.
• Tilt may be smaller where the surface is parallel or perpendicular to the displacement field, and largest when the angle between the surface and deformation field is 45°. However, the strong effect of local topography will dominate over the general orientation.
• The direction of the maximum tilt is often not radial to the source.
• Tilt can be either amplified or reduced on slopes that are significantly steeper than the surrounding topography, depending on the relief of the edifice and the distance from the conduit.
7. Conclusions
• Through numerical modeling, we have shown that topography can amplify or reduce tilt at volcanoes by over an order of magnitude.
• The direction of maximum tilt is often not radial to the source, and in some cases an increase in stress can cause the surface to tilt inwards toward the summit of the volcano, causing a polarity change.
• If topography is not considered when inverting for the source stress, the source stress can be under or overestimated significantly. In some cases a decrease in tilt could be falsely interpreted as a decrease in stress. This could potentially have serious ramifications for forecasting changes in activity using tilt data.
• Tiltmeters can be deployed strategically near topographic features to increase the sensitivity of the instrument to changes in source stress. If a DEM is available, it is relatively simple to use numerical modeling to predict how tilt will vary spatially at any volcano, and it would be of great benefit to make this assessment prior to deploying a tiltmeter.
Data Availability Statement
The datasets generated for this study are available on request to the corresponding author.
Author Contributions
LM developed the models. JN and MT provided expertise on technical aspects of the project.
Funding
LM was funded by a studentship from the NERC-SPHERES Doctoral Training Partnership (NE/L002574/1). JN was partially funded by the Centre for the Observation and Modeling of Earthquakes, Volcanoes and Tectonics (COMET NE/J01978X/1).
Conflict of Interest
The authors declare that the research was conducted in the absence of any commercial or financial relationships that could be construed as a potential conflict of interest.
Acknowledgments
We would like to thank EF and SD for providing helpful and constructive reviews and suggestions.
Supplementary Material
The Supplementary Material for this article can be found online at: https://www.frontiersin.org/articles/10.3389/feart.2019.00317/full#supplementary-material
References
Albino, F., Pinel, V., Massol, H., and Collombet, M. (2011). Conditions for detection of ground deformation induced by conduit flow and evolution. J. Geophys. Res. Solid Earth 116:B06201. doi: 10.1029/2010JB007871
Beauducel, F., and Carbone, D. (2015). A strategy to explore the topography-driven distortions in the tilt field induced by a spherical pressure source: the case of Mt Etna. Geophys. J. Int. 201, 1471–1481. doi: 10.1093/gji/ggv076
Beauducel, F., Cornet, F.-H., Suhanto, E., Duquesnoy, T., and Kasser, M. (2000). Constraints on magma flux from displacements data at Merapi volcano, Java, Indonesia. J.Geophys. Res. Solid Earth 105, 8193–8203. doi: 10.1029/1999JB900368
Cayol, V., and Cornet, F. H. (1998). Effects of topography on the interpretation of the deformation field of prominent volcanoes—application to etna. Geophys. Res. Lett. 25, 1979–1982. doi: 10.1029/98GL51512
Costa, A., Melnik, O., and Sparks, R. (2007a). Controls of conduit geometry and wallrock elasticity on lava dome eruptions. Earth Planet. Sci. Lett. 260, 137–151. doi: 10.1016/j.epsl.2007.05.024
Costa, A., Melnik, O., Sparks, R., and Voight, B. (2007b). Control of magma flow in dykes on cyclic lava dome extrusion. Geophys. Res. Lett. 34:L02303. doi: 10.1029/2006GL027466
Del Negro, C., Currenti, G., and Scandura, D. (2009). Temperature-dependent viscoelastic modeling of ground deformation: application to etna volcano during the 1993–1997 inflation period. Phys. Earth Planet. Interiors 172, 299–309. doi: 10.1016/j.pepi.2008.10.019
Harrison, J. (1976). Cavity and topographic effects in tilt and strain measurement. J. Geophys. Res. 81, 319–328. doi: 10.1029/JB081i002p00319
Hautmann, S., Gottsmann, J., Sparks, R. S. J., Costa, A., Melnik, O., and Voight, B. (2009). Modelling ground deformation caused by oscillating overpressure in a dyke conduit at Soufrière Hills Volcano, Montserrat. Tectonophysics 471, 87–95. doi: 10.1016/j.tecto.2008.10.021
Hautmann, S., Gottsmann, J., Sparks, R. S. J., Mattioli, G. S., Sacks, I. S., and Strutt, M. H. (2010). Effect of mechanical heterogeneity in arc crust on volcano deformation with application to soufrière hills volcano, montserrat, west indies. J. Geophys. Res. Solid Earth 115:B09203. doi: 10.1029/2009JB006909
Hickey, J., and Gottsmann, J. (2014). Benchmarking and developing numerical finite element models of volcanic deformation. J. Volcanol. Geotherm. Res. 280, 126–130. doi: 10.1016/j.jvolgeores.2014.05.011
Johnson, J. H., Poland, M. P., Anderson, K. R., and Biggs, J. (2019). A cautionary tale of topography and tilt from kīlauea caldera. Geophys. Res. Lett. 46, 4221–4229. doi: 10.1029/2018GL081757
Marsden, L. H., Neuberg, J., Thomas, M., Mothes, P., and Ruiz, M. (2019). Combining magma flow and deformation modelling to explain observed changes in tilt. Front. Earth Sci. 7:219. doi: 10.3389/feart.2019.00219
McTigue, D., and Segall, P. (1988). Displacements and tilts from dip-slip faults and magma chambers beneath irregular surface topography. Geophys. Res. Lett. 15, 601–604. doi: 10.1029/GL015i006p00601
Mogi, K. (1958). Relations between the eruptions of various volcanoes and the deformations of the ground surfaces around them. Bull. Earthq. Res. Inst. Univ. Tokyo 36, 99–134.
Neuberg, J. W., Collinson, A. S., Mothes, P. A., Ruiz, M. C., and Aguaiza, S. (2018). Understanding cyclic seismicity and ground deformation patterns at volcanoes: intriguing lessons from Tungurahua volcano, Ecuador. Earth Planet. Sci. Lett. 482, 193–200. doi: 10.1016/j.epsl.2017.10.050
Newman, A. V., Dixon, T. H., and Gourmelen, N. (2006). A four-dimensional viscoelastic deformation model for long valley caldera, california, between 1995 and 2000. J. Volcanol. Geotherm. Res. 150, 244–269. doi: 10.1016/j.jvolgeores.2005.07.017
Ronchin, E., Geyer, A., and Martí, J. (2015). Evaluating topographic effects on ground deformation: insights from finite element modeling. Surv. Geophys. 36, 513–548. doi: 10.1007/s10712-015-9325-3
Trasatti, E., Giunchi, C., and Bonafede, M. (2003). Effects of topography and rheological layering on ground deformation in volcanic regions. J. Volcanol. Geotherm. Res. 122, 89–110. doi: 10.1016/S0377-0273(02)00473-0
Voight, B., Sparks, R., Miller, A., Stewart, R., Hoblitt, R., Clarke, A., Ewart, J., et al. (1999). Magma flow instability and cyclic activity at Soufrière Hills Volcano, Montserrat, British West Indies. Science 283, 1138–1142. doi: 10.1126/science.283.5405.1138
Keywords: topography, tilt, shear stress, pressure, numerical modeling, volcano
Citation: Marsden LH, Neuberg JW and Thomas ME (2019) Topography and Tilt at Volcanoes. Front. Earth Sci. 7:317. doi: 10.3389/feart.2019.00317
Received: 10 September 2019; Accepted: 14 November 2019;
Published: 28 November 2019.
Edited by:
Yosuke Aoki, The University of Tokyo, JapanReviewed by:
Eisuke Fujita, National Research Institute for Earth Science and Disaster Resilience (NIED), JapanSilvio De Angelis, University of Liverpool, United Kingdom
Copyright © 2019 Marsden, Neuberg and Thomas. This is an open-access article distributed under the terms of the Creative Commons Attribution License (CC BY). The use, distribution or reproduction in other forums is permitted, provided the original author(s) and the copyright owner(s) are credited and that the original publication in this journal is cited, in accordance with accepted academic practice. No use, distribution or reproduction is permitted which does not comply with these terms.
*Correspondence: Luke H. Marsden, ZWVsaG0mI3gwMDA0MDtsZWVkcy5hYy51aw==
 Luke H. Marsden
 Jürgen W. Neuberg
 Mark E. Thomas