 Sébastien Fabre
 Catherine Jeandel
 Thomas Zambardi2
 Rafaël Almar
94% of researchers rate our articles as excellent or good
Learn more about the work of our research integrity team to safeguard the quality of each article we publish.
Find out more
ORIGINAL RESEARCH article
Front. Earth Sci. , 11 September 2019
Sec. Marine Biogeochemistry
Volume 7 - 2019 | https://doi.org/10.3389/feart.2019.00231
We consider the Si flux resulting from sand grain dissolution on beaches under the pressure of the intensive and continuous shaking by the waves, a potential source of oceanic DSi that is not currently considered. Today, DSi source and sink fluxes are balanced within large uncertainties, at ca. 10.4 ± 4.2 and 14.6 ± 7.8 × 10¹² mol yr–1, respectively, underlining that some processes are not well constrained and possibly overlooked so far. To quantitatively explore this idea, we first realized an experimental dissolution of quartz grains in a stirred vessel designed to simulate the sediment orbital motion induced by the waves. These experiments lead to the calculation of a solid–liquid mass-transfer coefficient directly linked to the rotation speed of the shaker. This coefficient being itself related to the energy communicated to the liquid, we could apply the Nienow relationship to calculate a mass-transfer coefficient for beach sand exposed to 1 m height waves. Extrapolation of this value to the whole sandy beaches led us to conclude that this mechanism could be significant, shortening the calculated residence time of oceanic DSi by up to a factor 2.
Since the end of the 20th century, the understanding and the importance of the silicon cycle in marine biogeochemistry have increased, because of the need to constrain the role of diatoms and siliceous species in the export of carbon toward the deep ocean (Tréguer and De La Rocha, 2013).
Recent reviews (Tréguer and De La Rocha, 2013; Frings et al., 2016; Rahman et al., 2019) proposes an overview of the global ocean silica cycle comprising inputs (e.g., dissolved riverine, aeolian dusts, and hydrothermal fluids) and outputs (e.g., sedimentation of biogenic particles on coastal margins followed by reverse weathering and opal burial in the abyss) assumed to be at steady state, fluxes being expressed in 1012 mol yr–1. It is worth noting that some of these fluxes were defined to close the ocean mass-balance, and are poorly constrained by independent evidence. Indeed, despite numerous work (e.g., DeMaster, 1981; De La Rocha and Bickle, 2005; Ragueneau et al., 2006; Rahman et al., 2017) major uncertainties remain concerning the magnitudes of these fluxes (Ragueneau et al., 2000; Rahman et al., 2017). As previously noticed by Tréguer and De La Rocha (2013), the flux of particulate silica (lithogenic and biogenic) to estuaries calculated by Dürr et al. (2011) is 147 ± 44 Tmol Si yr–1. How much of this flux actually dissolves remains unknown. In addition, while Rahman et al. (2019) revisited the importance of the reverse weathering in deltaic environments, other recent studies strongly suggest that the release of chemical species from solid material deposited at the land–ocean interface are occurring (Jeandel and Oelkers, 2015). Field, laboratory, and modeling works suggest that these fluxes are considerable, although less than a few percent of the sediment dissolves (Lacan and Jeandel, 2005; Arsouze et al., 2009). Jeandel (2016) underlined that the environments where such processes take place can be very diverse, from deep margins to subsurface coastal submarine groundwater discharge and that the release mechanisms have to be better quantified and constrained. Among others, roughly one-third of the world’s shorelines are made of sand beaches (Brown and Mclachlan, 2002; Luijendijk et al., 2018), in other words huge resources of silicates. Here, we assess the impact of wave energy in the beach surf zone on the dissolution of quartz sand supplied by weathering. We propose that a key input term to DSi could have been neglected in current estimates of the oceanic Si budget: abiotic dissolution of quartz grains mediated in the surf zone where waves break.
Quartz dissolution has been extensively studied despite the challenges in measuring its dissolution rate which is generally slow (Knauss and Wolery, 1988; Brady and Walther, 1990; Bennett, 1991; Dove, 1994; Gautier et al., 2001).
Recent studies of Crundwell (2014) tentatively gathered all the literature data in a single model of dissolution for all the silicates. The rate of silicate dissolution proposed follows the equation:
where [c] represents the activity or concentration of a reactant, k the rate constant [mol(mol/m3)–n/(m2 s)], n the order of the reaction, EA the activation energy (kJ/mol), R the gas constant (kJ/mol/K), and T the temperature (K). A is the specific surface area (m2) and (1−Q/K) the chemical affinity. Rates are expressed in mol s–1.
Measured quartz dissolution rates at 25°C suggest that (i) quartz dissolves under both acidic and alkaline pH conditions and (ii) the order of the reaction is 0.5 with respect to H+ or OH– (Casey, 1991; Brantley et al., 2008). These dissolution models consider static solutions, where mass transport is much slower than the chemical dissolution reaction. Such reactions are named “transport controlled reactions.” Contrastingly, when a mineral dissolves in a mobile solvent, the measured rate derives from a combination of the rate of chemical reaction at the solid–liquid interface (pure dissolution) and the diffusion velocity across the diffusional boundary layer in the vicinity of the interface when placed in a flow (mass transport). The mechanism proposed here will show that diffusion is no longer a limiting step of quartz dissolution under more dynamic mechanical conditions in the surf zone. Earlier studies conducted in situ and ex situ on bottom sediment dissolution in seawater (e.g., Gehlen et al., 1995; Van Cappellen, 1996) showed that this could be an important Si input term. However, these studies were made on biogenic silica while we are focusing here on the lithogenic phase.
The sediments selected for this study were quartz grains from the sand of Fontainebleau formation (France). The Fontainebleau sandstone is an early Oligocene (36–27 My) unit, 50–80 m thick, made of fine grained, well-sorted, quartz arenite.
This sediment is thought to be representative of the abiotic material present in sandy beaches. Indeed, fine sand grain size (namely 125–250 μm) represents the most abundant feature – circa 106 km2 – of alluvial and coastal depositional systems (Haddad et al., 2006).
Polarizing microscope observation did not show any mineral phases other than quartz in the sample and X-ray diffraction (XRD) revealed only α-quartz diffraction peaks. Grain size distribution obtained by laser diffraction (Coulter LS100 Q) indicated a very sharp unimodal symmetrical distribution with a geometric mean of 270 μm (Orton and Reading, 1993).
X-ray diffraction analyses of the initial sand powder were performed on a Bruker® D8 XRD diffractometer (CuKα1 + 2 radiation) over the 2–60° 2Θ angular range with 0.02° 2Θ steps and 2 s per step. It confirmed that the sand was only composed of pure α-quartz (Figure 1). Its homogeneity was checked by performing XRD analysis of three different samples, leading to three undistinguishable XRD patterns. No particular preparation was carried out on the samples in order to maintain their surface state as close as possible to that of natural quartz grains.
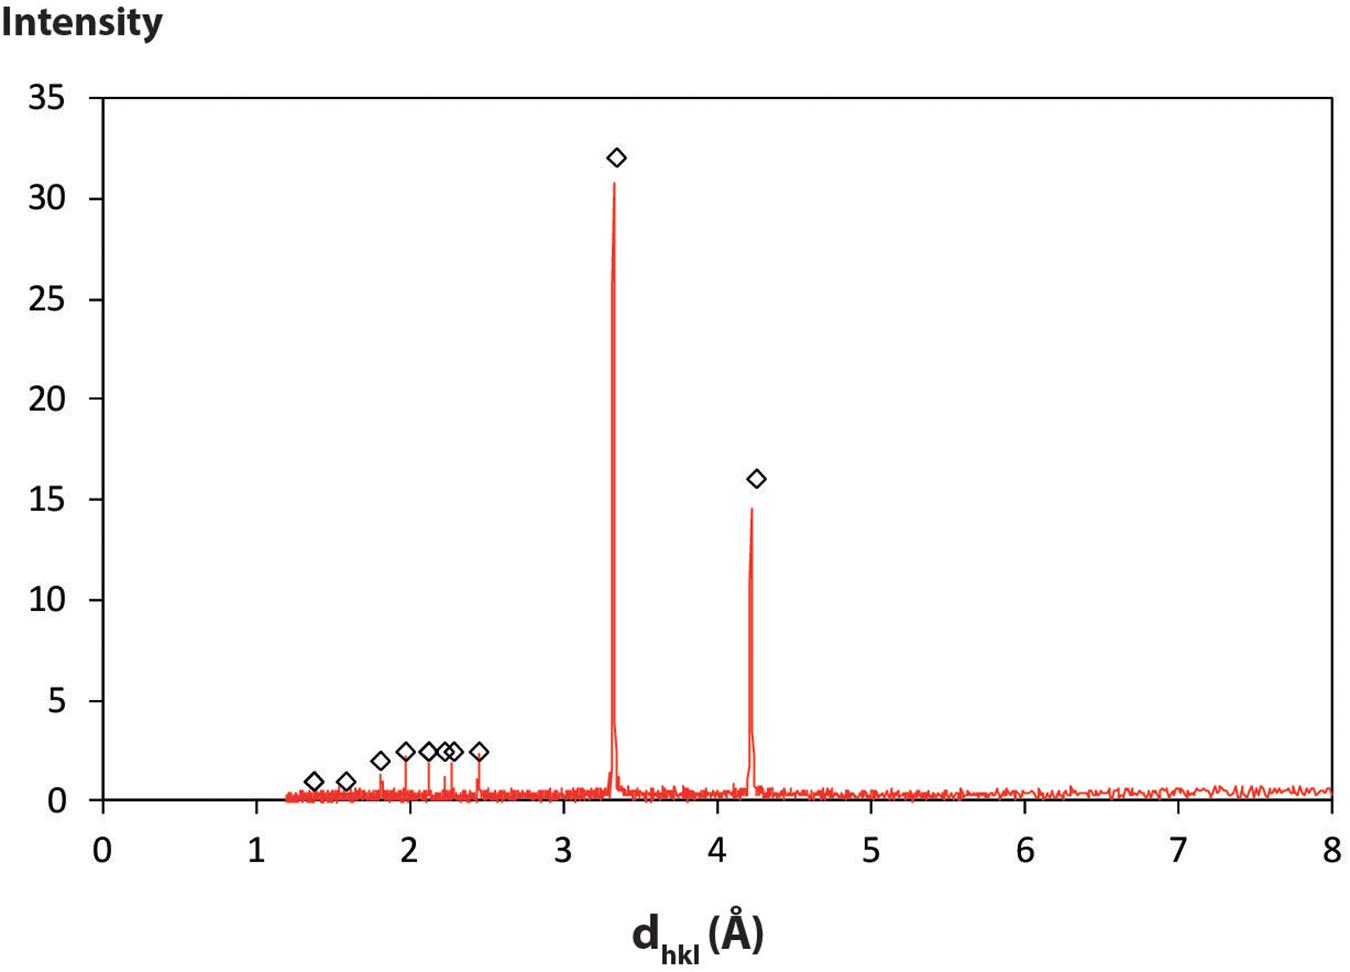
Figure 1. XRD patterns of the Fontainebleau sand before the experiments. Three samples taken from the sand pool were analyzed and their respective XRD patterns overlaid perfectly on each other. Diamonds are reference values from ICDD, (1997), PDF# 40-1045.
For each experiment, sand and deionized water or filtered commercial abiotic seawater1 (pH ≈ 7.85 at 20°C) with various rock–water ratios (R/W) were introduced into HDPE closed containers and placed on an agitator (Stuart, Orbital Shaker; see Table 1 for a summary of the experimental conditions). A first set of experiments was conducted for 10 days under static or dynamic conditions (0, 80, or 230 rotations per minute, rpm). At various time intervals, aliquots of 5 mL were sampled, filtered (0.22 μm mesh), and analyzed. The final sampled solution represented <10% of the initial volume. A second set of experiments with variable rock/water ratio – from 0.18 to 1.25 − was conducted during 270 h (≈11 days) with a constant rotation speed (230 rpm). All the experiments were performed at room temperature (21°C).
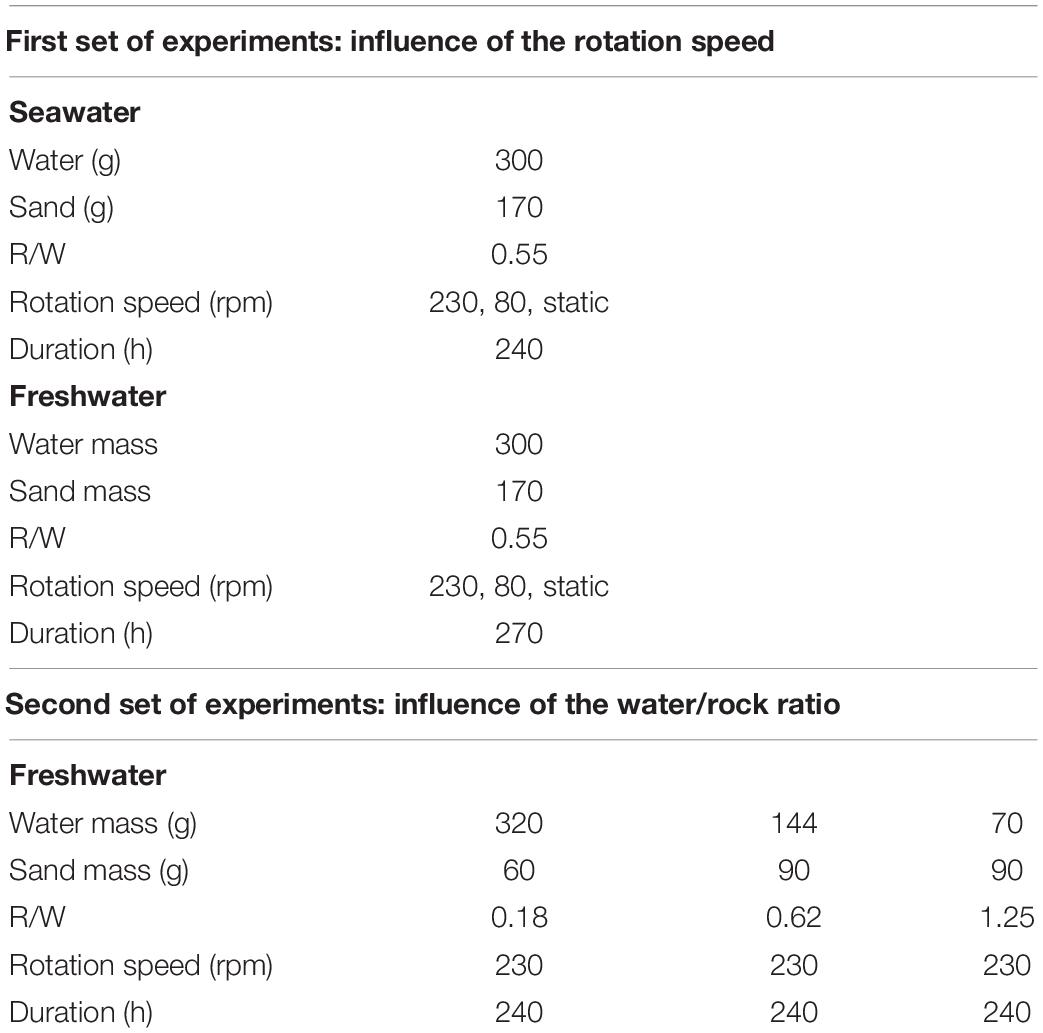
Table 1. Recap chart of the experimental conditions.
pH was measured at room temperature with a WRW IS 60 pH-meter coupled to an Orion electrode, previously calibrated at pH 4 and 7. The aqueous silica concentration was measured using the molybdate method (Strickland and Parsons, 1972) with a Technicon Analyzer II Colorimeter. Seawater dissolved Si analysis rigorously followed international protocols (Hood et al., 2010). Replicate measurements were performed establishing that the precision of the measurements is 1.78 μmol L–1 and blanks are negligible.
Figures 2A,B depict the experimental data expressed as silica concentration as a function of time (Table 2). Not surprisingly, in static mode, quartz dissolution is very slow. However, silica concentration increases modestly when mixing at 85 rpm and far more significantly at 230 rpm to reach a value of 523 μmol L–1 in seawater and ≈943 μmol L–1 in fresh water. From a kinetic point of view, after a rapid initial burst, the rate of dissolution decreases with time to reach a plateau when the solution approaches saturation relative to quartz. Other experiments using higher rotation speeds (330 rpm) – not depicted2 – show no significant increase of silica concentration. Saturation indices SI = , where Q is the ionic activity product and K(T) the reaction equilibrium constant were calculated for three Si bearing phases (namely Quartz, Chalcedony, and Amorphous silica) using PHREEQC software (Parkhurst and Appelo, 1999) coupled to the Lawrence Livermore National Laboratory (LLNL) database (Delaney and Wolery, 1989; Table 3). Using these values we find that experimental solutions stayed under-saturated for all the considered phases in static mode and for low rotation speed whatever the media. At 230 rpm, however, solutions became over-saturated for quartz and chalcedony between 1440 and 2940 h, while dissolution was still operating for several hours before reaching the plateau phase. This means that agitation maintains dissolution of quartz grains even under solution chemical conditions thermodynamically unfavorable. Filtering to 0.22 μm ensured that we measured only dissolved silica. We are aware of the fact that the molybdate method will detect the monomeric SiO2 only. However, as noticed by Ning (2003) colloidal silica is depolymerized by seawater, meaning that in the analyzed seawater SiO2 is in the monomeric form only.
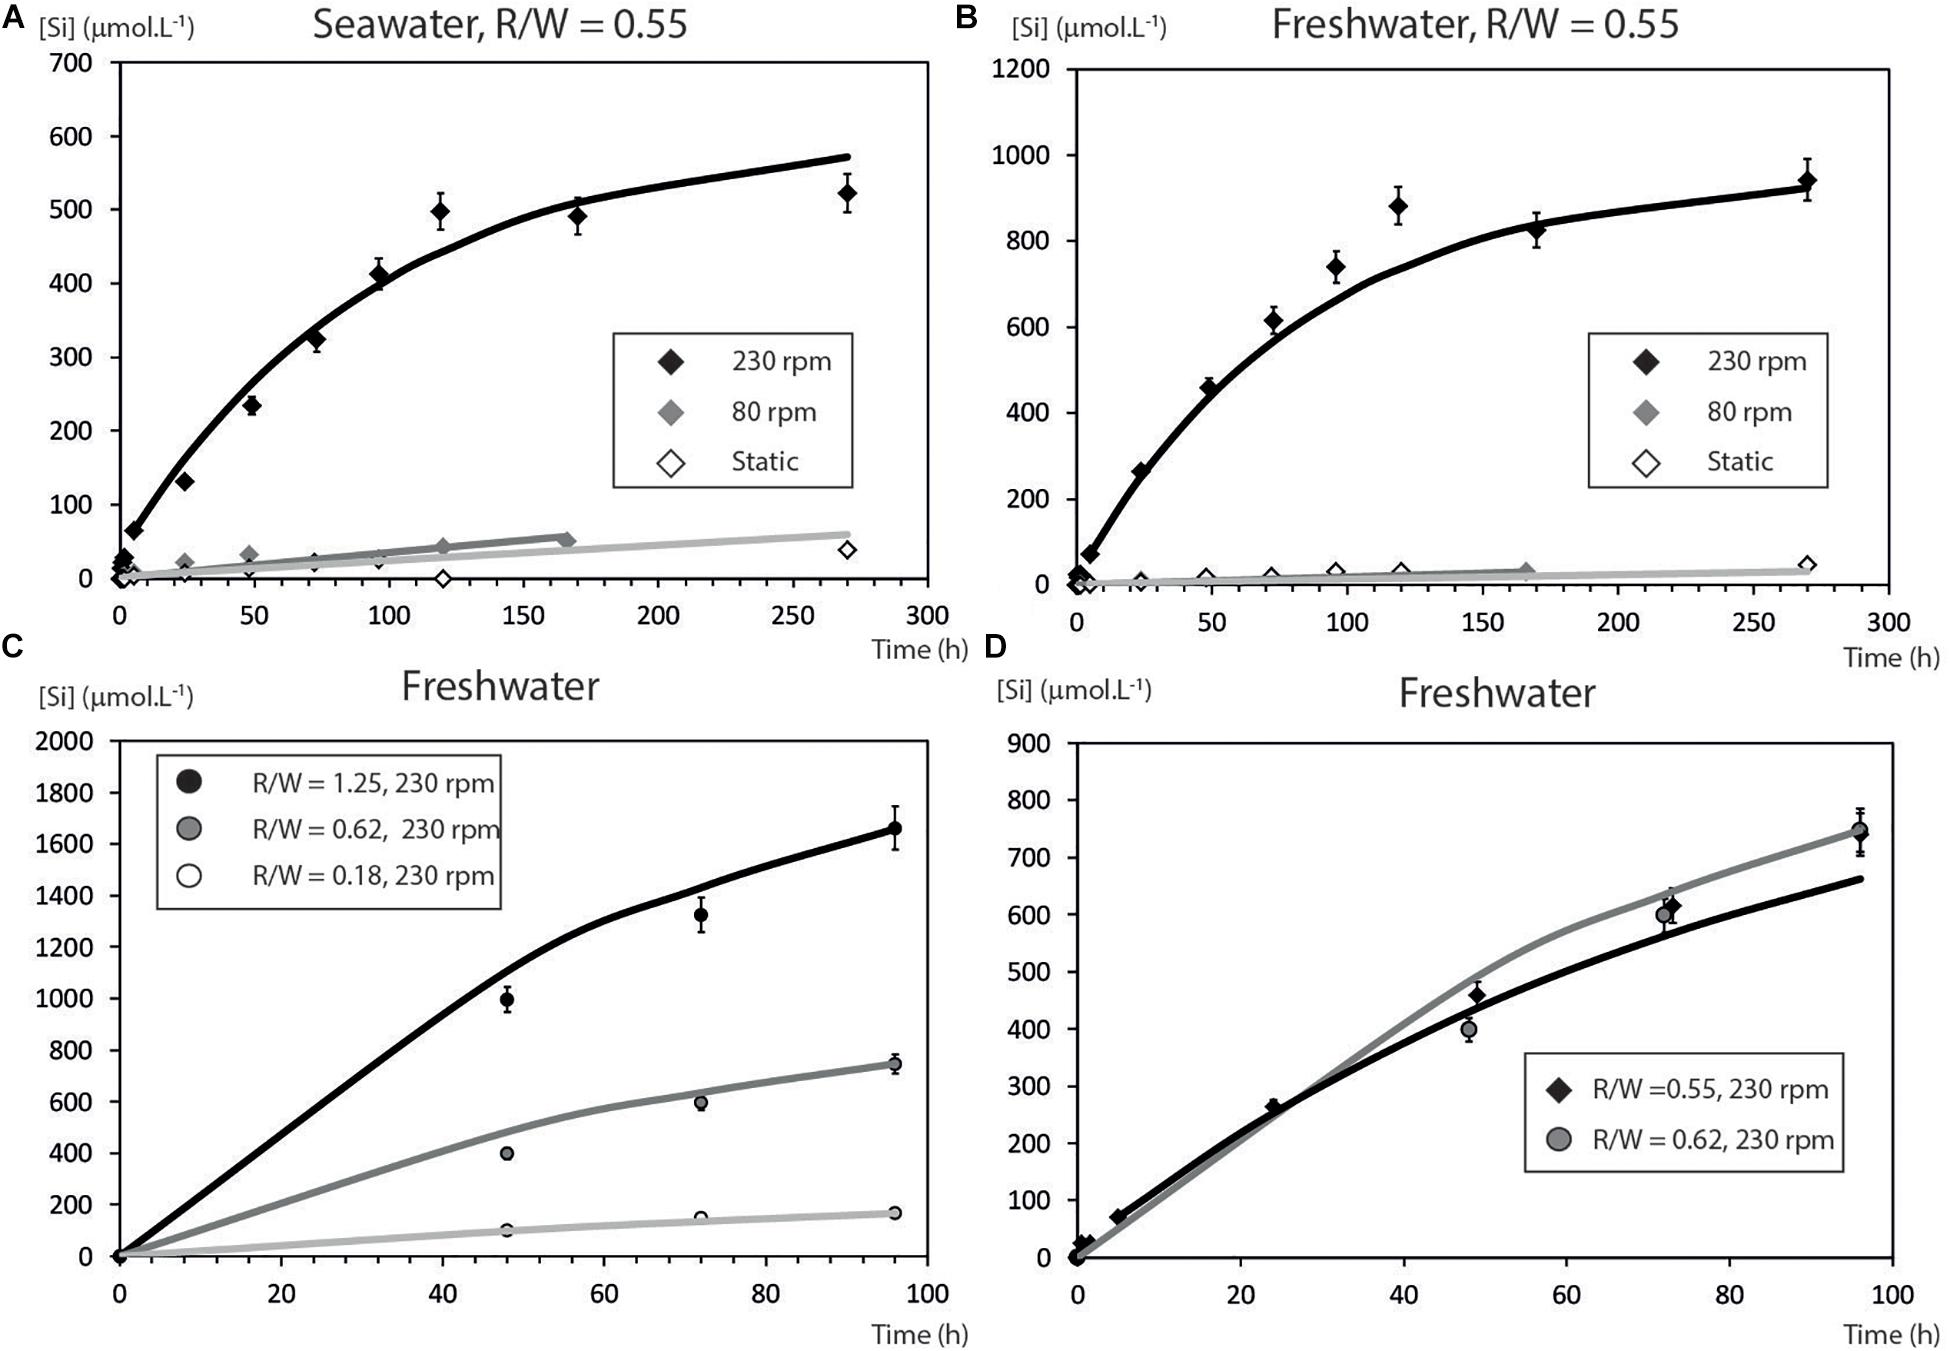
Figure 2. Experimental results of sand grains dissolution at various rotation speeds. (A) Silica concentrations in seawater. (B) In deionized water. (C) Influence of the R/W ratio on the dissolution rate. (D) Reproducibility and sensitivity of the experiments, note the slight difference between R/W ratio of 0.55 and 0.62.
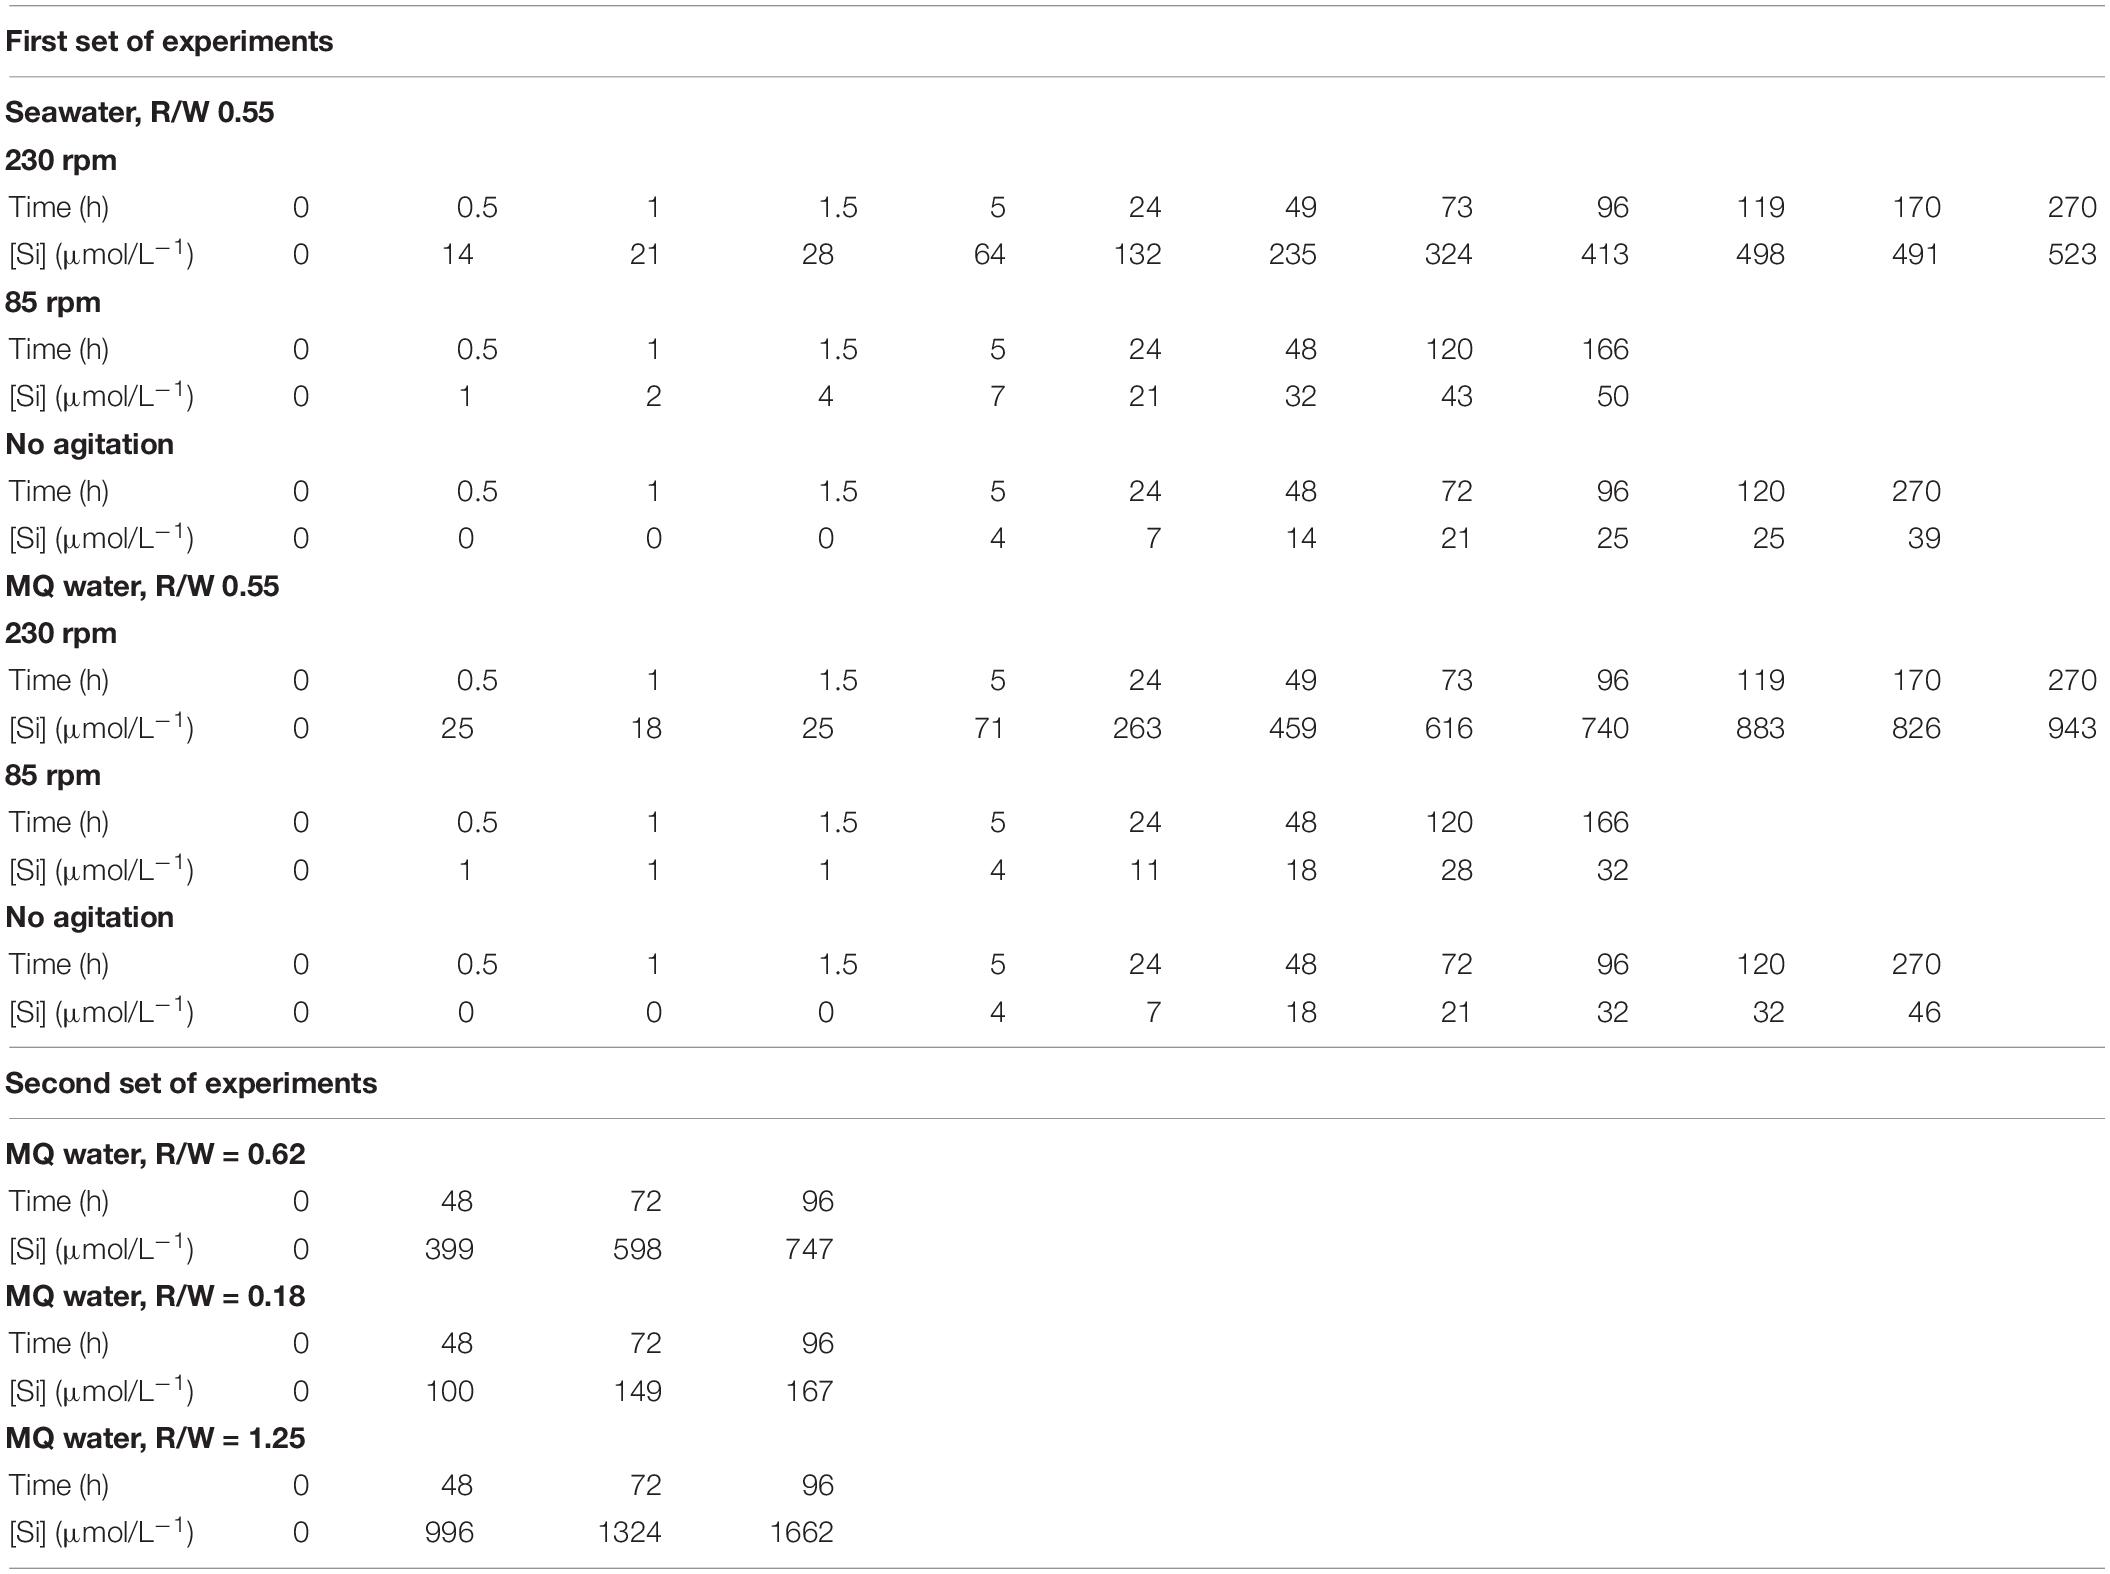
Table 2. Experimental results.
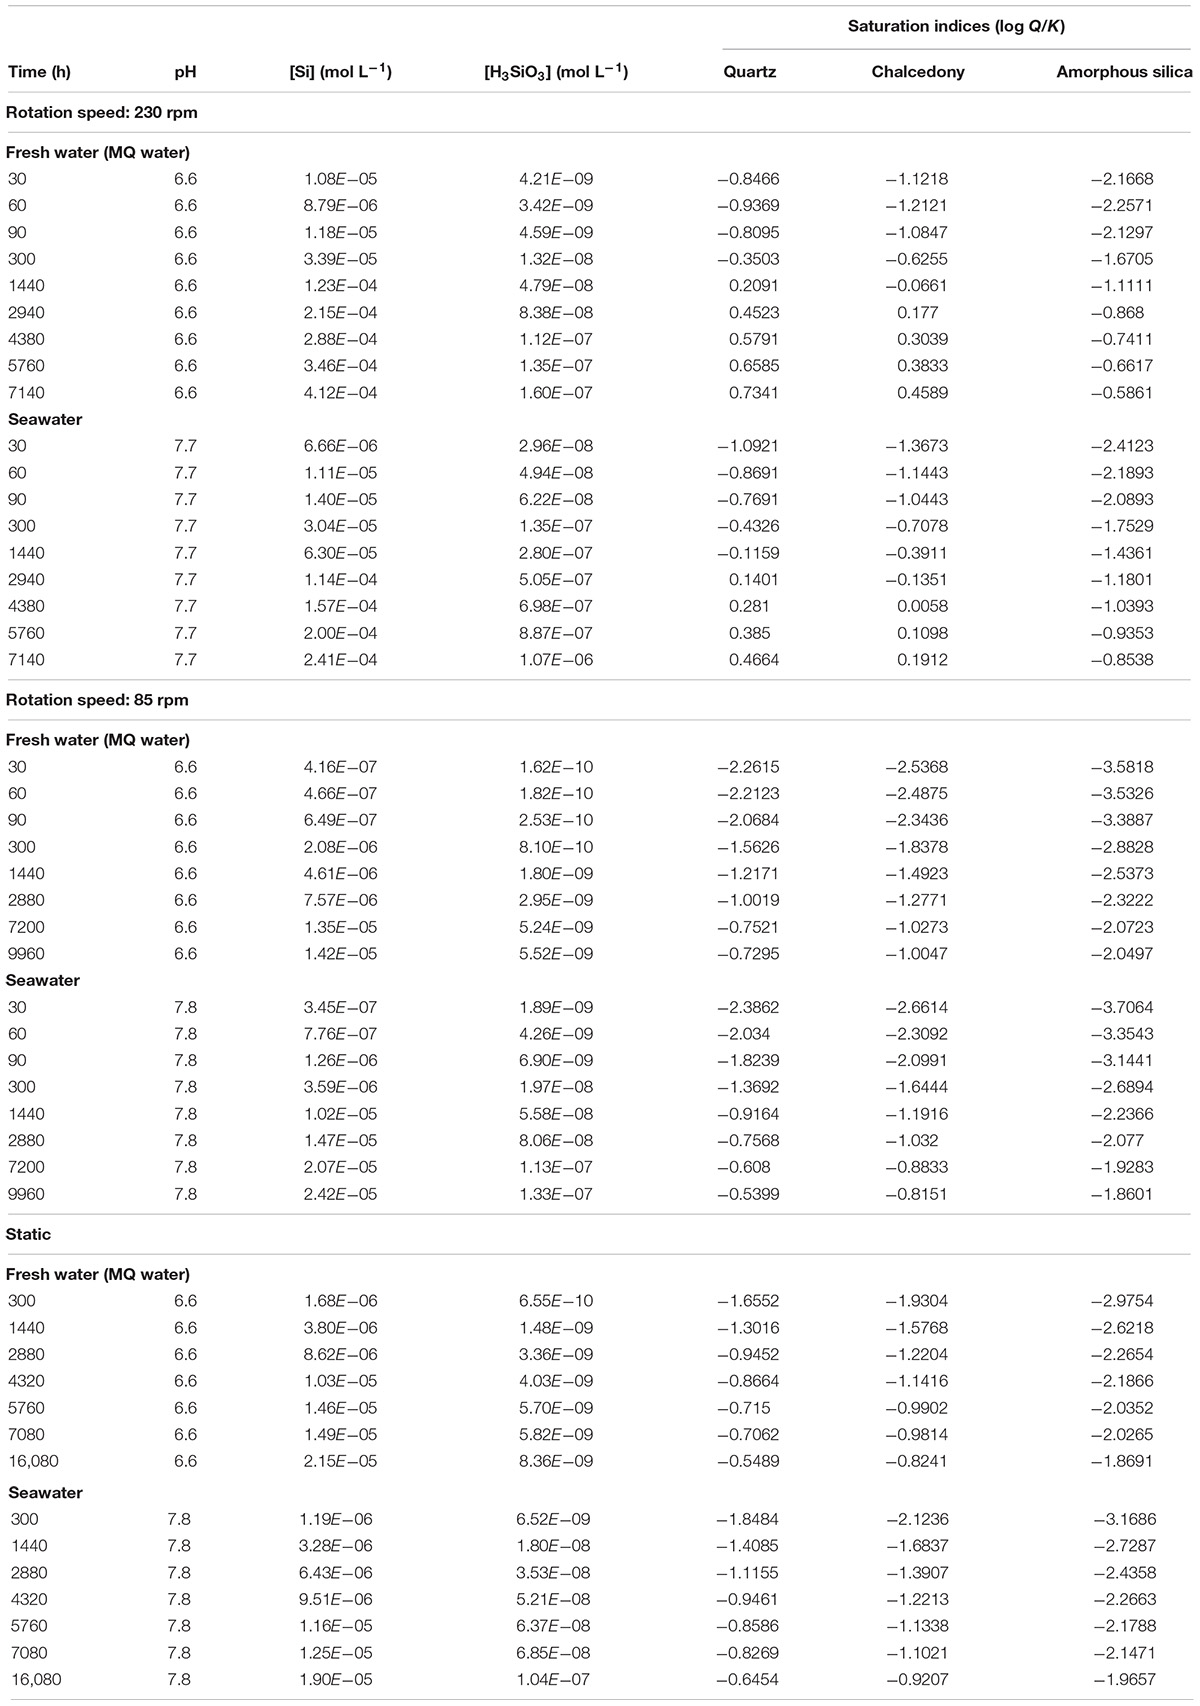
Table 3. Calculated saturation indices (SIs) for silica mineral phases amorphous silica, chalcedony, and quartz.
Variation of the rock–water ratio clearly illustrates the proportionality between the amount of quartz grains and dissolved Si concentrations (Figure 2D), which is easy to understand on a qualitative point of view: as rock/water ratio diminishes the DSi concentration lowers by dilution. This point is discussed quantitatively in the section “Chemical Modeling.” In order to test the reproducibility and the sensitivity of the experiments to the R/W ratio, two others experiments with very close R/W ratios were performed (Figure 2D). The DSi concentrations values are not significantly different except for the middle value.
The effect of organic coatings on quartz dissolution was not considered in our experimental setup because we were focusing on the abiotic dissolution only. However, organic coatings could modify the quartz dissolution in two opposite ways. On the one hand, organic acids at circum neutral pH accelerate the quartz dissolution and enhance its solubility in seawater (Bennett, 1991). On the other hand, organic coatings deposited onto the silica surface can decrease the dissolution rate by restricting access to reactive surface area (Banfield et al., 1997). Contrastingly, however, Van Cappellen and Qiu (1997) showed that the formation of protective organic coatings do not explain the observed reduction in biogenic silica reactivity. These observations underline that the role of organic coatings on quartz dissolution requires more investigation, while Brantley et al. (2008) underlined that inorganic controls on dissolution such as Al sorption could affect more the quartz dissolution rate than organic coating.
The evolution of grain surfaces was observed using Scanning Electron Microscopy (Figure 3). Neither grain rounding nor etch pit formation was apparent on the micrographs, although more discrete features could be observed. Worn blocky conchoidal fracture patterns can be seen in Figure 2A, fresher breakage patterns, probably produced by grinding of the other grains are visible in Figure 2B. Old slightly curved grooves or scratches measuring t 5–15 μ in length are shown in Figure 3C. On reacted grain surfaces (Figure 3D) V-shaped indentations and friction marks are visible. These latter features are likely caused by contact between sharp edges of one sand grain and another. Finally, worn etch pits of the initial grains with rounded edges are different from oriented V-shaped patterns on final quartz grain surfaces. They probably result from chemical etching in seawater (Krinsley and Margolis, 1969) but all these features pre-exist to the experiments as previously noted by Vos et al. (2014). The possibility that dissolution of quartz cement could result in the kinetic observed can be ruled out for two reasons: (1) Haddad et al. (2006) showed that the very small fraction of cement in the studied sand is mostly constituted of crystallized quartz and (2) our SEM observations confirmed these findings (Figure 3).
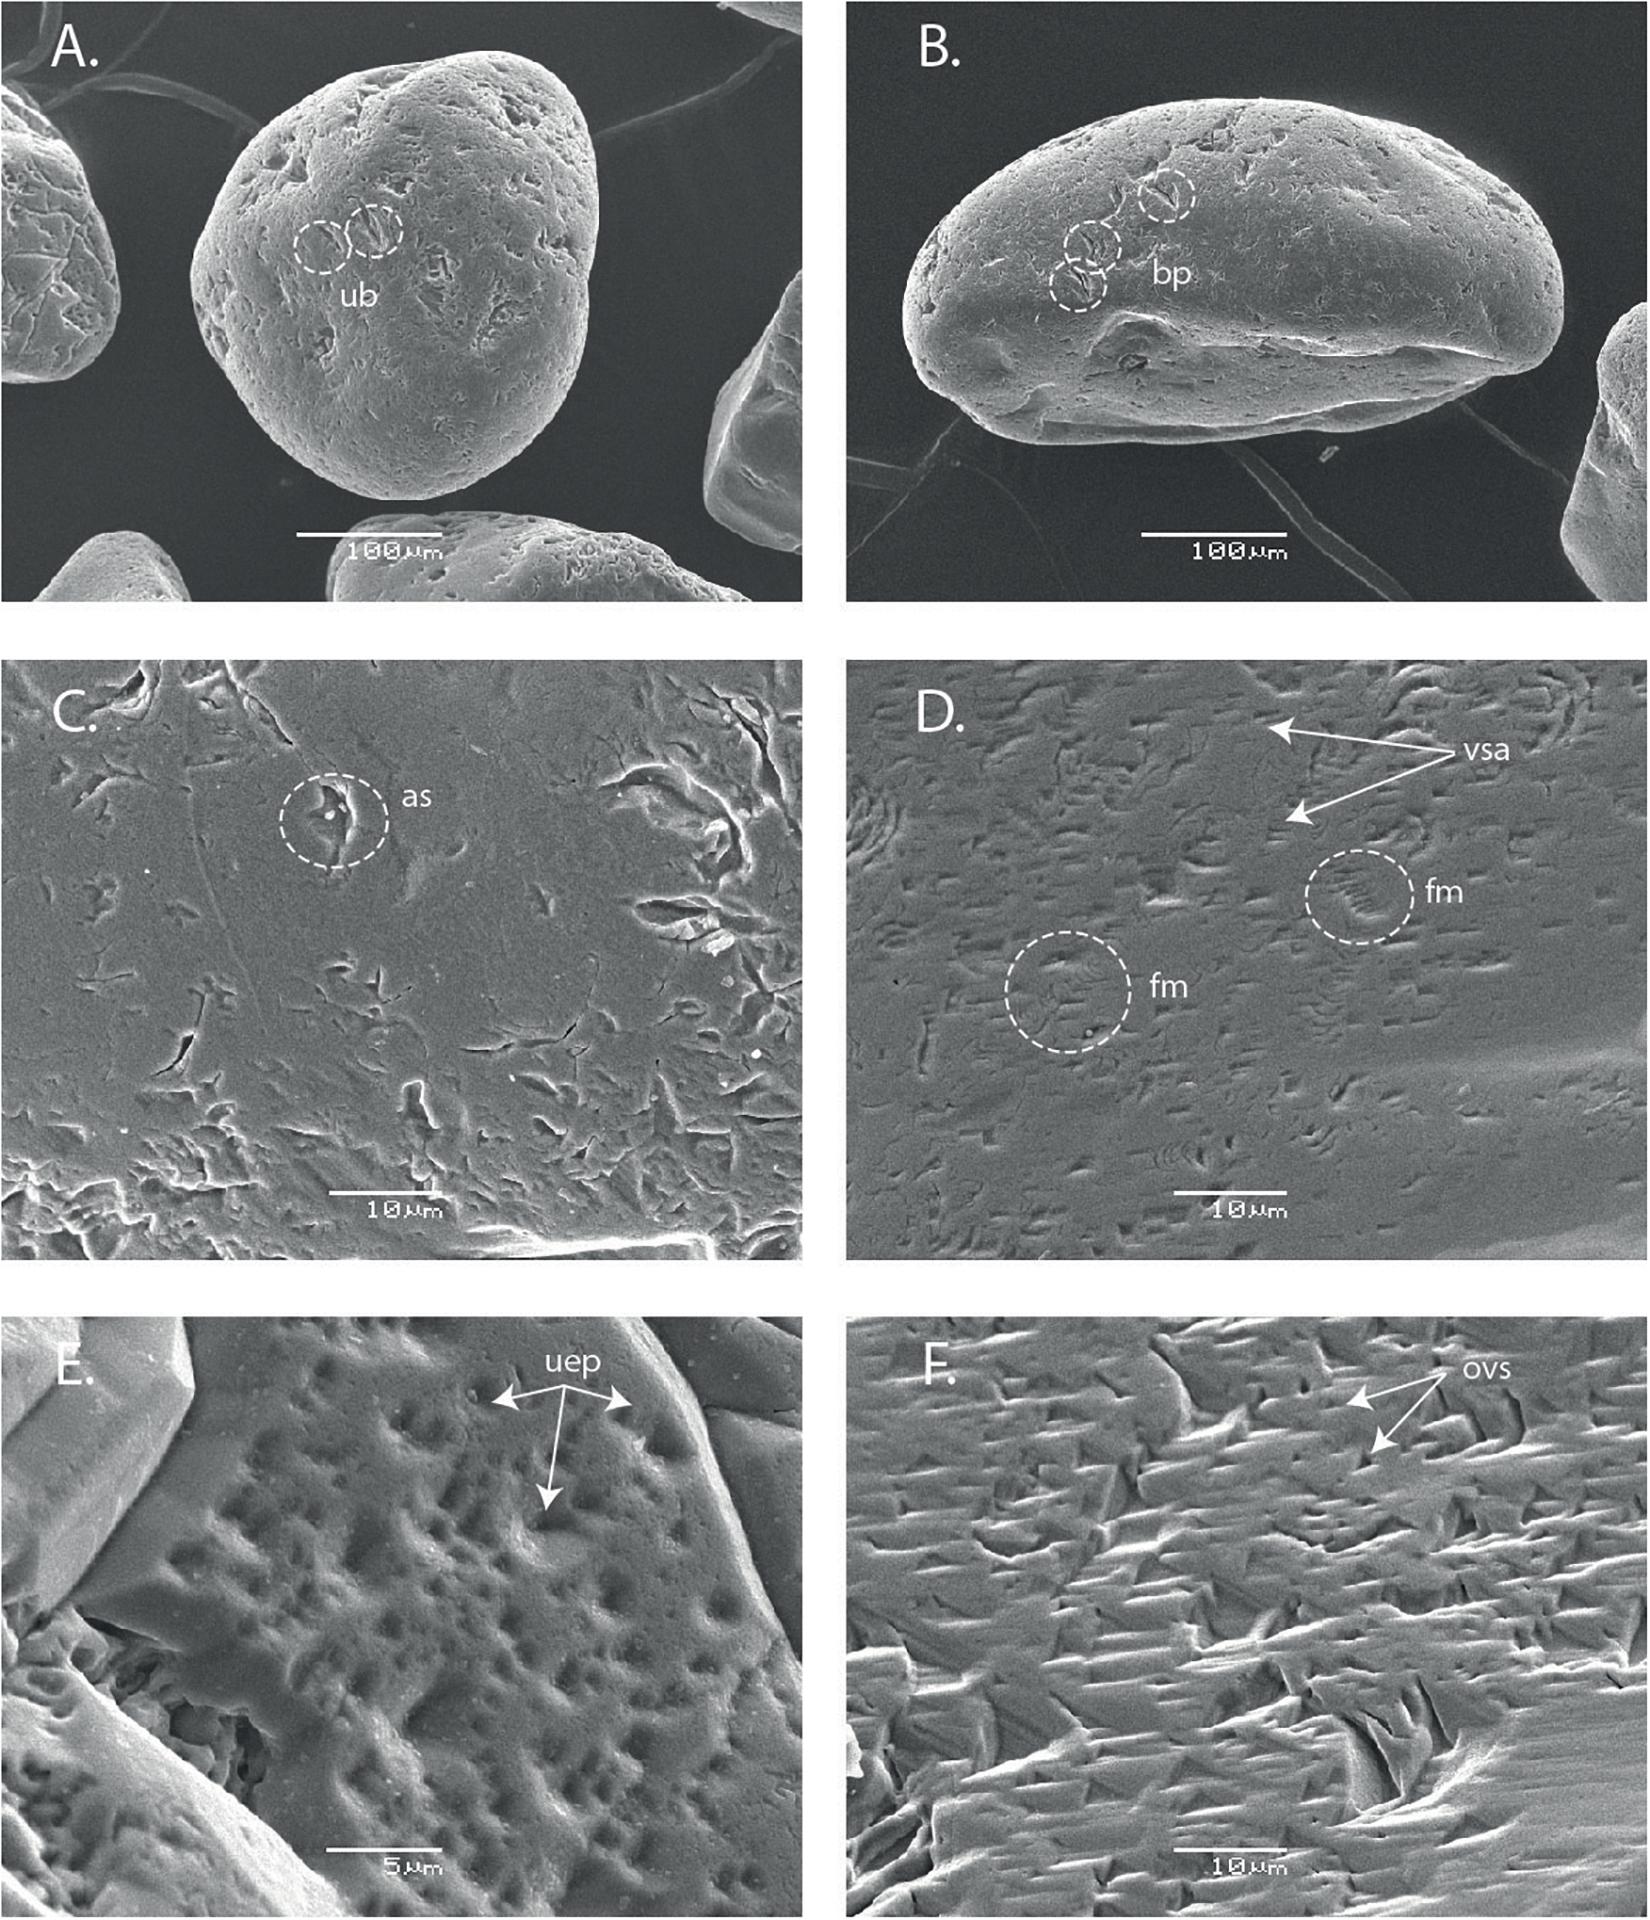
Figure 3. SEM morphology of unaltered (left column) and altered (right column) sand after 10 days experiments (250 μm, R/W = 1.8). (A) General view of a sub-rounded quartz grain of high sphericity. It exhibits used blocky breakage conchoidal patterns (ub). (B) A rounded quartz grain displaying fresh blocky conchoidal patterns (fb). (C) Detail of a plane surface showing old arc shaped impact features (as). (D) High density of V-shaped abrasion (vsa) and friction marks (fm). (E) Detail of the upper edge of the quartz grain, used etch pits are clearly visible (uep). (F) Numerous oriented V-shaped patterns (ovs).
Attempts to model the experiments using Eq. (1) failed because of its inappropriate formalism to describe grain dissolution in an agitated medium. Indeed, the diffusive contribution to quartz dissolution is no longer the limiting step. Forced convection is intense enough to maintain the chemical potential disequilibrium between the surface mineral and the solution. We therefore choose to use a shrinking sphere model to fit the experimental data, widely used in pharmaceutical and metallurgical domains even if the reactive surface area of grains did not significantly vary during the experiments (Figure 3). In such model, a simple Si mass balance equation between the grains and the solution is considered. Our approach was to assume a quasi-stationary mode, the particle dissolves faster in an agitated media because the boundary layer where the transport of aqueous species is driven by diffusion – slower than advection – is very thin. As a consequence, the difference between the Si concentration at the particle surface and at the end of the boundary limit – i.e., concentration gradient – is considered constant. As justified in detail in the Supplementary Material, the quantity of a given element transferred from the solid to the fluid can be expressed as:
with F (mol s–1) the mass flux,
k (m s–1) the mass-transfer coefficient,
S (m2) the grain surface area,
C1 and C2 (mol m–3) are, respectively, concentrations in the solid and in the solution.
The quasi-stationary particle dissolution can be described by a mass balance between the amount of quartz grains dissolved and the increase in Si in solution for a time interval dt expressed as:
with
V (m3) reactor volume,
S(t) (m2) exchange surface area according to time,
C∗ (kg m–3) the maximum solid concentration in solution
C (kg m–3) solid concentration.
The mass transfer coefficient (k) was obtained by fitting Eq. (3) to the experimental data for the best test conditions (Figure 2B). Mean values and standard deviation of the different measurements are reported in Tables 4, 5. The data fitting is very good in all the cases (Tables 4, 5, sum of quadratic error < 10–5). The very good agreement of the fit (Figure 2 and Table 2) argues in favor of the dissolution model described before. One can notice that k values are low compared to other materials which are circa 10–4 m s–1 (Roustan, 2003).
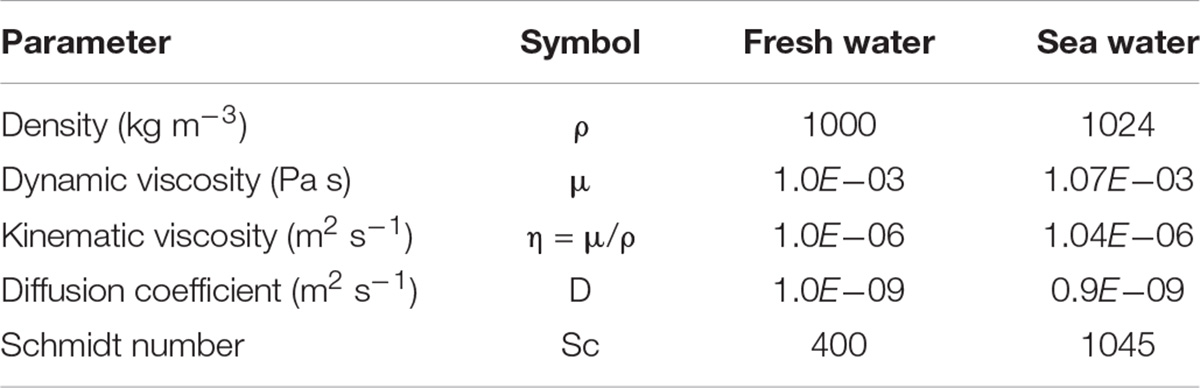
Table 4. Parameters used for the calculation of the mass transfer coefficient.
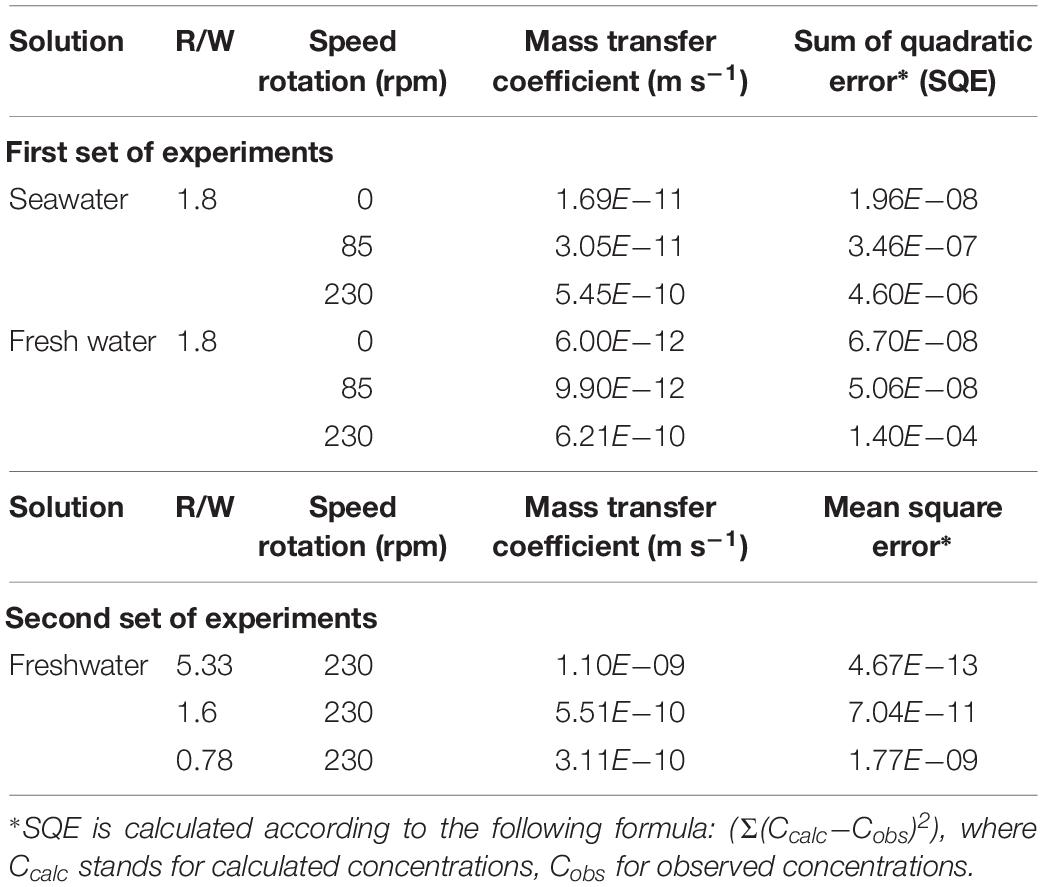
Table 5. Mass transfer coefficient (k) for quartz grains in agitated solutions according to the various experimental conditions.
As rotation speed increases, k increases moderately but, as previously mentioned, for higher speeds the silica concentrations do not increase significantly, indicating that the k-value noted for 230 rpm is probably close to a maximum. Studying particle dissolution under different physical forcing, Nienow (1985) proposed a relationship between the mass transfer coefficient and the dissipated energy by mass unit. The Nienow correlation is as follows:
with Sh the Sherwood number, dp the grain diameter, D the diffusion coefficient of dissolved Si, e the dissipated energy by mass unit, Sc the Schmidt number, μL the liquid viscosity, and rL the liquid density. This semi-empirical relationship links the mass-transfer coefficient to the energy of the media. While this relationship is satisfied – what we just verified for the quartz dissolution in water – the calculation of the k-value is possible.
This formulation means that for a given quartz grain diameter, the mass transfer coefficient varies with the dissipated power by mass unit according to a law in ≈(e)0.15. This means that the system needs a very strong increase of dissipated energy to significantly modify the k-value, which is in line with our observations.
Quantitatively, the R/W ratio is expressed by the ratio S(t)/V in Eq. (3), ratio between the exchanging surface area of the solid and the reactor volume. The dissolution rate is faster if there are more particles in a given volume, as shown by the initial slopes of the curves (Figure 2) which depend on the rock/water ratio. The characteristic time τ of the system (see Supplementary Material for a complete derivation of this parameter) depends only on the mass-transfer coefficient and the R/W ratio. All the experimental curves of Figure 2C are fitted using Eq. (6) and consequently take in into account the R/W ratio. Again, the model reproduces satisfactorily the observations.
Recent studies led to suspect that processes at play at the beach–ocean boundary could yield dissolved Si input to the ocean. Based on Si isotope variations, Ehlert et al. (2016) demonstrated that dissolution of lithogenic silica is likely occurring in beach sediment of the North Sea. In a lagoon near the Mediterranean Sea, Tamborski et al. (2018) established that the local DSi increase can be attributed to water drainage due to Submarine Groundwater Discharge. At mesoscopic scale, these authors also conducted in situ dissolution experiments of local sediment, they measured 250 μmol L–1 after 4 days of incubation. With grossly the same R/W (1.25 vs. 1.16) ratio our experimental values are greater (1780 μmol L–1) but their experimental device was only gentle stirred. In comparison, Anschutz et al. (2009) estimated a significantly lower Si flux in tidal sands namely 3.02 × 10⁻⁶ mol yr–1 assumed to be mediated by microbial activity. However, none of these works discussed the processes at play and more specifically the role of the waves on the dissolution rates. Here, the contribution of sandy beaches to the marine silica cycle is estimated through mass balance. The global annual Si flux (FSi in Tmol yr–1) resulting from the dissolution of quartz grains on sandy beaches is calculated using the same formalism as in Eq. (2). In the case of quartz dissolution in seawater this flux can be written as:
where kqz(T) is the temperature-dependent quartz mass transfer coefficient (m s–1), Sqz is the grain surface of the quartz grains (m2), is the quartz solubility (mol m–3), and (mol m–3) is the concentration of Si in seawater. The following paragraphs discuss the assumptions related to these parameters. The values used in the mass balance calculation are summarized in Tables 4, 5.
(i) Reactive surface (Sqz): The total world coast length is 1.1 × 10⁶ km (EOTP2, 2 min angle) and 31% of this length is constituted of sandy beaches (Luijendijk et al., 2018). Calculation of the average sediment volume impacted by the waves is based on the idealized surf zone represented in Figure 4 and the numerical values of the various parameters summarized in Tables 3–5. VT is the total volume of water, Vr is the volume of water devoid of sediment, and Vm is the volume containing the agitated sediment. Volumes are calculated assuming an intertidal slope (α) of 1° (Shanks et al., 2017), leading to a maximum depth e of 1.75 m at the extremity of the surf-zone (l = 100 m, Figure 4). The total volume of water is VT = l × L × e/2, i.e., 1.71 × 10¹⁰ m3.
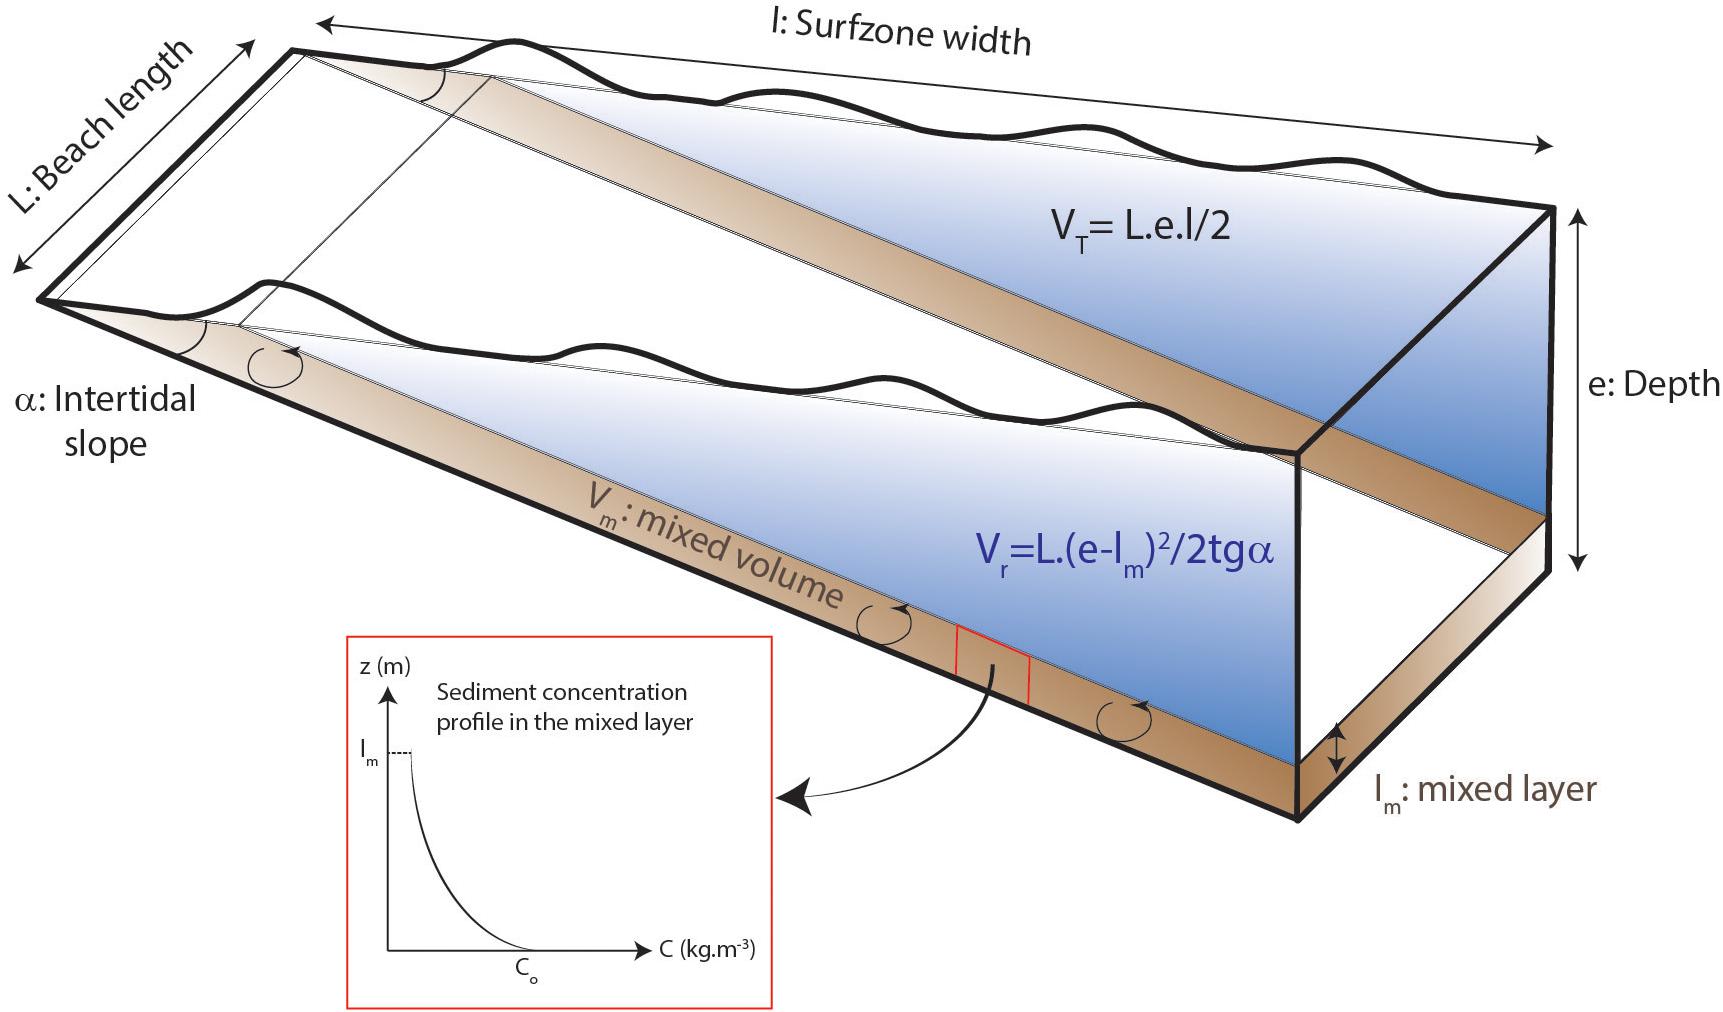
Figure 4. Simplified geomorphological model of sandy beach used for the Si flux calculations. Numerical values of the various parameters are summarized in Tables 3, 4. Sediment is agitated by the waves only into the mixed layer (shaded brown) and the sediment concentration decreases exponentially form the bottom to the top of this layer. VT is the total volume of water, Vr is the volume of water devoid of sediment, and Vm is the volume containing the agitated sediment.
The sediment is agitated by the waves only into the mixed layer close to the seafloor (in shaded brown in Figure 4) and the sediment concentration decreases exponentially from the bottom to the top of this layer. This mixed layer (lm) is comprised between 0.1 and 1 m (Aagaard and Jensen, 2013); we took 0.5 m in average. Assuming that the sediment concentration decreases from the bottom (Co) to the top of the mixing layer following an exponential law (Figure 4, Co = 1 kg m–3, Aagaard and Jensen, 2013; Yoon et al., 2015), we took an average sediment concentration of 0.42 kg m–3 in the mixed layer. Based on simple geometrical characteristics shown in Figure 4, the volume of the mixed zone is:
and numerically Vr = 1.58 × 10¹⁰ m3.
The mixed volume Vm is the difference between VT and Vr, namely 1.28 × 10⁹ m3.
Finally, a compilation of diverse coastal environments gives an average sand grain size of 200 μ (Orton and Reading, 1993). Assuming spherical shape for quartz grains, the reactive surface of the sand (see Eq. 2 in the Supplementary Material) is Sqz = 5.9 × 10⁹ m2.
(ii) Concentration gradient between the quartz grains and seawater: For water depths of 0–450 m, DSi values vary between ca. 5 and 70 μM, compilation established along various basin coasts (Lal, 1977). Thus, we kept a value of 35 μmol L–1 (or 9.8 × 10⁻⁴ kg m–3) in our calculations (Eq. 5).
C∗ could be taken equal to quartz solubility (355 μmol L–1), which explicitly corresponds to a system close to chemical equilibrium. However, as shown by the experimental results C∗ could exceed this value – at least temporarily – up to 70% (676 μmol L–1). This reflects the shaking effect, leading to a chemical disequilibrium. The final range of DSi flux calculated with Eq. (5) will reflect these two bounds. In any case, the large difference between C∗ and the DSi value of the coastal waters induces a strong gradient.
(iii) Wave frequency, height, and mass-transfer coefficient: The mean height of waves and the wave frequency are taken as 1 m and 0.1 Hz, respectively (Aagaard and Jensen, 2013). The energy flux of the waves (E) depends on the wave frequency (or period T) as described by this formula
where H is the significant wave height, T the wave period, ρ the water density, and g the acceleration by gravity (Svendsen, 2006). This equation expresses that the wave power is proportional to the wave period. This energy flux (E) is now converted in an energy by volume unit (ε) using the simple geometry of the shore (Figure 4), as required by the Nienow relationship which links the DSi flux to this energy per volume unit (ε∧ 1/3, i.e., 0.04 W m–3). The mass transfer coefficient could then be calculated with Eq. (4), namely k = 4.6 × 10⁻⁵ m s–1 (Table 6). This k-value represents the average “natural” mass transfer coefficient of DSi for sandy beaches derived from the previous assumptions (i–iii).
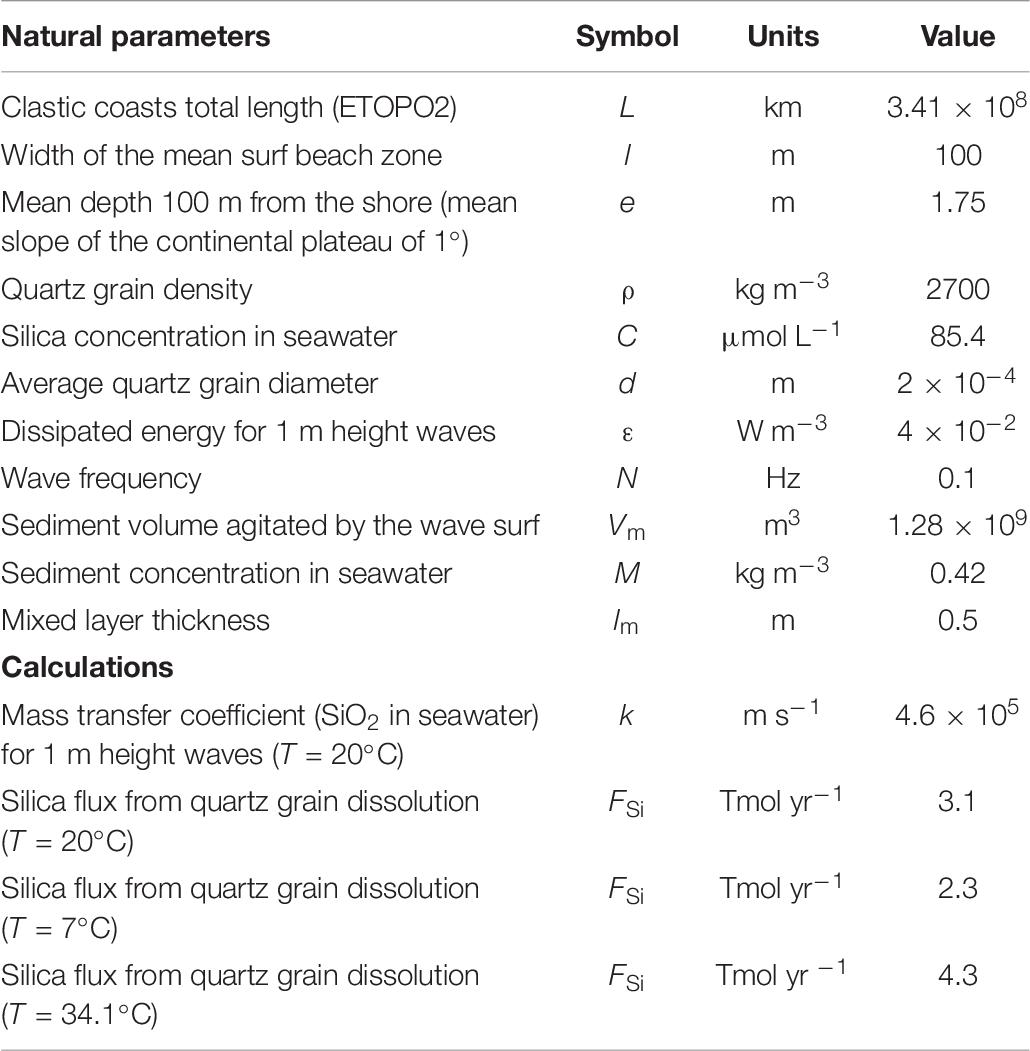
Table 6. Calculated silica fluxes from the beach to the offshore caused by quartz grain dissolution.
(iv) kqz function of T: Neglecting the Antarctic continent, shore line temperatures ranges from 34 to 7°C [NOAA; NOAA Office of Satelllite Production Operation, 2013]. Based on the following semi-empirical correlation between temperature and the mass transfer coefficient (Roustan, 2003):
one can calculate k(T = 7°C) = 3.4 × 10⁻⁵ m s–1 and k(T = 34°C) = 6.4 × 10⁻⁵ m s–1.
(v) Solid versus dissolved fluxes: we assume that the renewal rate of sand grains of the beach by local weathering, wind, and marine currents balance the dissolution rate and that silica concentrations in the surf zone are kept constant. This hypothesis is strengthened by the very recent Ph.D. results of G. Micolajczack (Mikolajczak Ph.D. defense on May 9, 2019) who followed the distribution of the solid discharge of the Rhône River in the Gulf of Lion for 2 years. He established that between 0 and 20 m depth on the shore, 1.6 MT yr–1 of sand is deposited on a surface of 10 km2 (Mikolajczak, 2019). This sand could then be reworked on an annual scale by the currents. However, dissolving 0.1% (i.e., 0.003%, as in our seawater experiments expanded on 365 days) of this flux per year remains negligible. The resulting added DSi concentration would be circa 284 μmol m–3 over 1 year for the same volume. Thus, the amount of solid material annually dissolved and released to the sea is tiny compared to the flux of sediment discharged from the continent.
(vi) Final upscaling: Results are presented in Table 6. The calculated annual global DSi flux Fsi ranges from 2.3 Tmol yr–1 (at 7°C) to 4.3 Tmol yr–1 (at 34.1°C) for C∗ = 355.9 μmol L–1. We kept an average value of 3.2 ± 1.0 Tmol yr–1. Considering the dissolution rate induced by the wave shaking (C∗ = 676.1 μmol L–1), this average Fsi can reach 5.0 ± 2.0 Tmol yr–1. In a Mediterranean lagoon, Tamborski et al. (2018) established that the DSi flux driven by Submarine Ground Water Discharges was similar to the local river one. Using simultaneous 224Raex analyses, they attribute this flux to the dissolution of local sediment. Extrapolating their results to the whole length of sandy beaches discussed in this work leads to a DSi flux of 0.3 Tmol yr–1. Although significant and higher than the 0.07 Tmol yr–1 attributed to the SGD on a global scale by Ehlert et al. (2016), this value stays 10 times lower than the 3.2 Tmol yr–1 derived from our study. These differences illustrate that different processes are at play in the surf zone under the wave pressure and during the discharge of Submarine Groundwaters.
Figure 5 proposes an update Tréguer and De La Rocha (2013) compilation in which the recent SGD inputs proposed by Ehlert et al. (2016) and the revised reverse weathering discussed in Rahman et al. (2017) are considered. We also added the range of DSi input flux originating from the sandy beach proposed in the present work. The new balance of DSi in the oceans is:
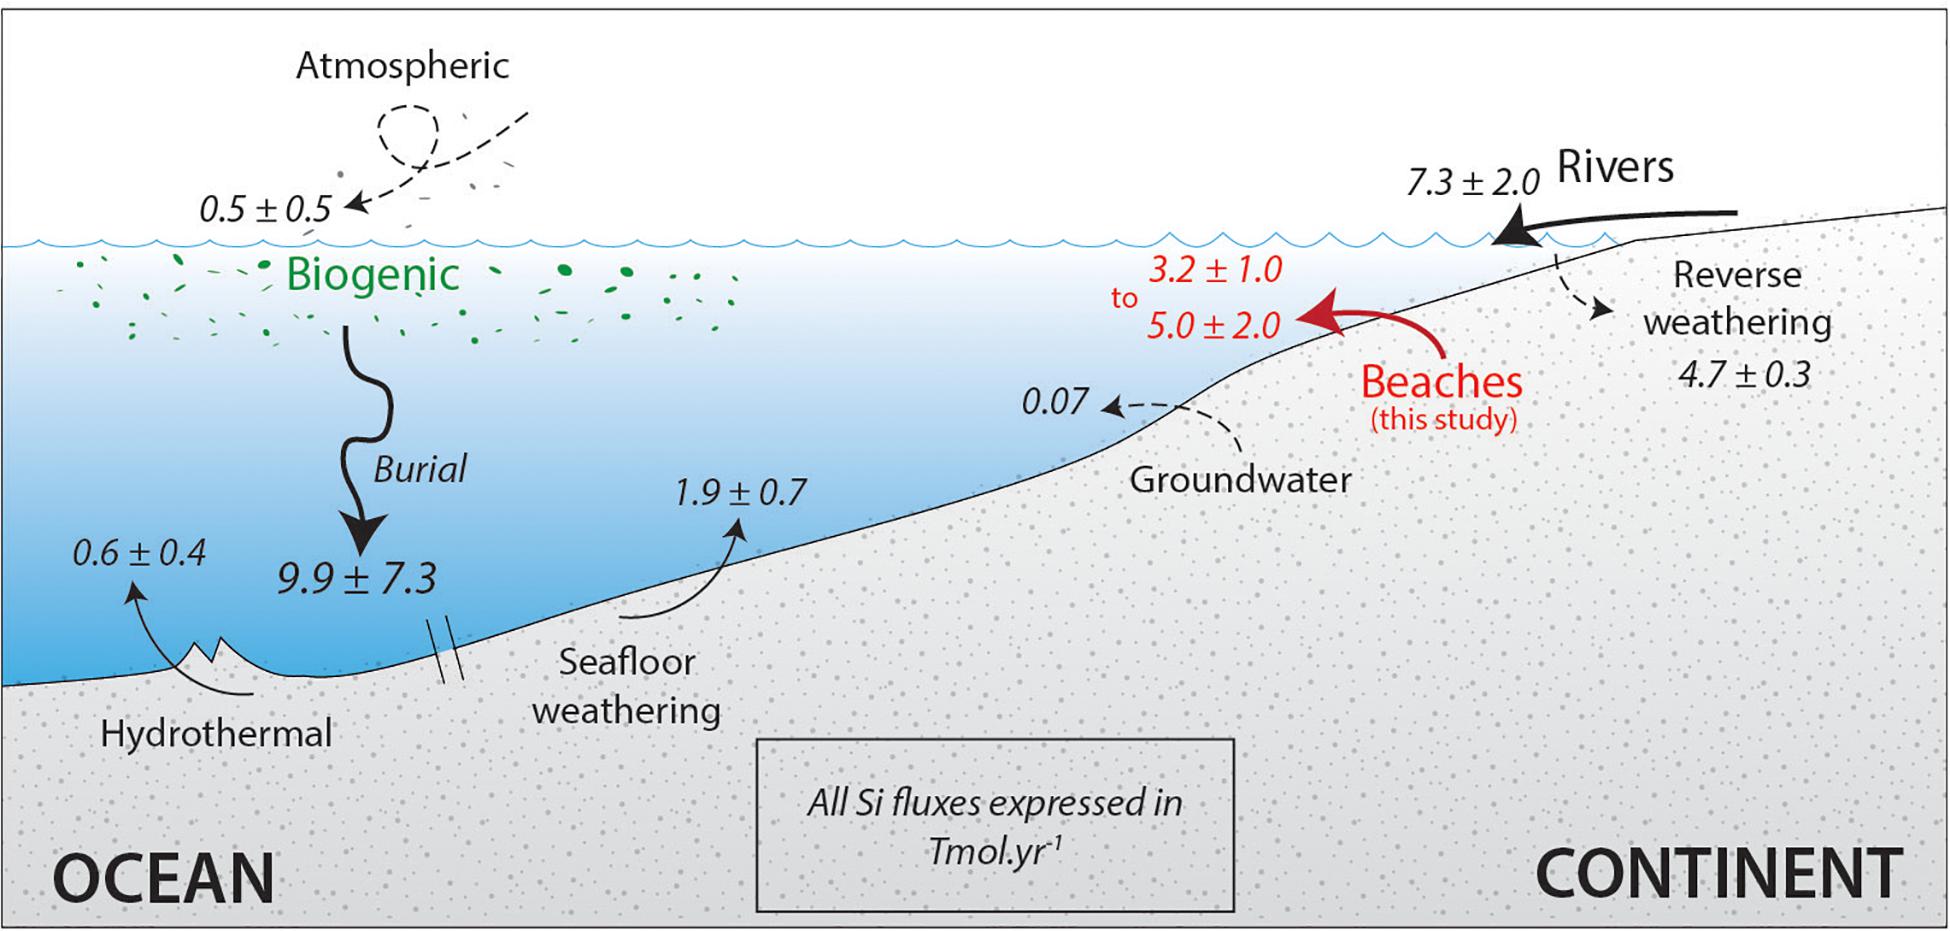
Figure 5. Revised sources and sinks of the global oceanic Si cycle. Inspired by Tréguer and De La Rocha (2013). Values for reverse weathering are from Rahman et al. (2017) and for groundwater discharge from Ehlert et al. (2016).
Sources (F+, Tmol yr–1): river DSi: 6.2 ± 1.8; river biogenic silica: 1.1 ± 0.2; submarine ground water discharge 0.07 (Ehlert et al., 2016); aeolian 0.5 ± 0.5; hydrothermal 0.6 ± 0.4; seafloor weathering: 1.9 ± 0.7; lithogenic flux (this study) 3.2 ± 1.0–5.0 ± 2.0 Tmol yr–1, a flux comparable to the dissolved river one.
Sinks (F–, Tmol yr–1): reverse weathering: 4.7 ± 0.3 (Rahman et al., 2017); biological sequestration by diatoms (6.3 ± 3.6) and sponges (3.6 ± 3.7).
The last published budget was subject to large uncertainties (total sources of 10.4 ± 3.6 Tmol yr–1 versus total sinks of 14.6 ± 7.6 Tmol yr–1). The revised one leads to a sum of sources balancing the sum of sinks (13.6 ± 4.7–15.4 ± 5.7 Tmol yr–1 and 14.6 ± 7.6, respectively), which is more satisfying.
This additional lithogenic DSi flux modifies the current vision of the global oceanic DSi cycle, notably the ratio between inputs and recycling (Tréguer and De La Rocha, 2013). The residence time at steady sate (τG) is equal to the total amount of DSi in the ocean (90,000 Tmol Si) divided by the sum of the net input flux (ΣF+). The additional lithogenic flux proposed here would shorten the DSi τG from its present value of 10,000 to 6696 years. According to this calculation, the total oceanic DSi stock has likely been renewed twice since the beginning of the Holocene (11,500 years), strengthening the hypothesis that the oceanic DSi mass balance is at steady state. This additional flux could also impact the short carbon cycle, via the Biological Carbon Pump. Such changes in the DSi input of continental origin could also have impacted the average oceanic isotopic signature (δ30Si) in the past. Glacial biogenic Si isotopic signatures (Bδ30Si) measured in sediment cores are 0.5–1‰ lower than interglacial ones (Sutton et al., 2013). These authors assign 67% of the isotopic variation observed at the transition between LGM and recent ages to the modification of diatom species in response to environmental changes. We suggest here that the remaining 33% could result from changes of the δ30Si of the inputs, in agreement with Frings et al. (2016). This suggestion should be taken cautiously, knowing that the variation reported by Sutton et al. (2013) was the maximum amount of variability explained by species-specific fractionation at one location. During the last glacial maximum (LGM), atmospheric CO2 dropped from 280 to 190 ppmv likely related to an increase in surface productivity (Khatiwala et al., 2019). Indeed, several authors proposed that massive aeolian inputs of continental iron or silica during the LGM boosted the biological carbon production (Angelis et al., 1987; Duce et al., 1991; Martin et al., 1994; Monnin, 2001; Khatiwala et al., 2019). The present work also suggests that glacial conditions might have two contrasting effects for the continental Si inputs: (i) Colder oceanic waters would imply lower kqz, slowing the silicate dissolution as illustrated in Figure 6, showing that the DSi flux would vary from −40 to +40% compared to its value at 20°C. (ii) Contrastingly, stronger winds would have enhanced the wave energy thus the sand beach weathering (Sarnthein et al., 1981).
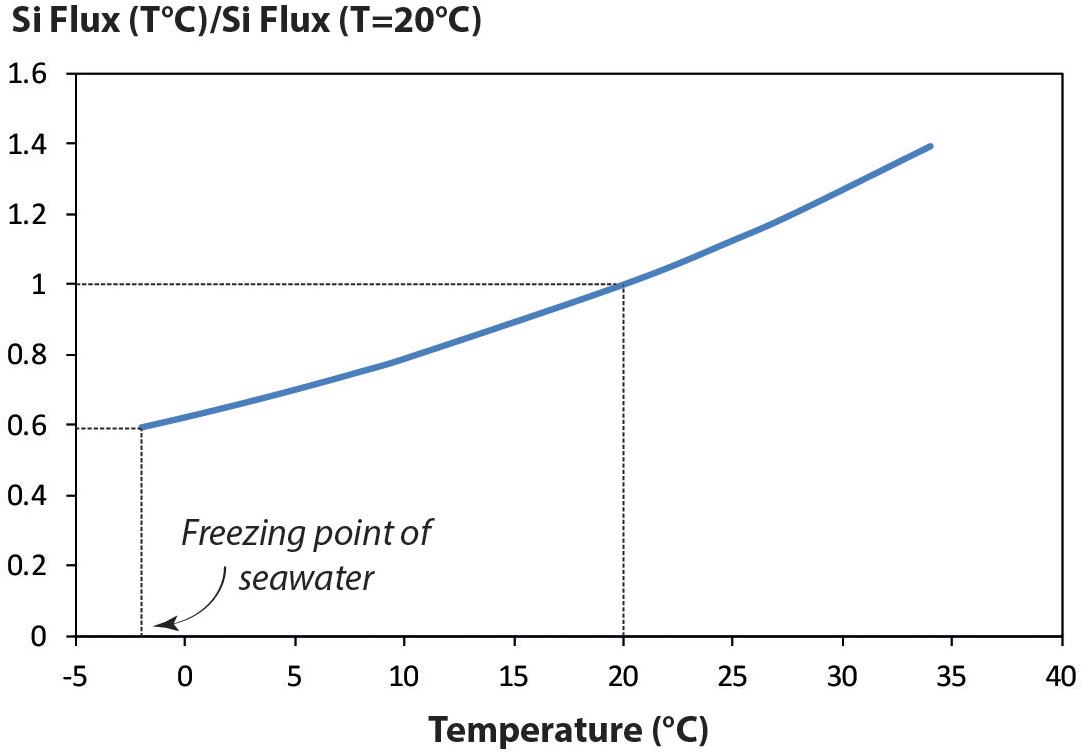
Figure 6. Si flux ratio between value for T = 20°C and a range of temperatures comprised between –2 and +34°C.
Laboratory experiments simulating the strong shaking due to the waves in the surf zone of the sand beaches revealed that the pure quartz dissolution kinetic was considerably accelerated.
We showed that a shrinking sphere model fitted experimental data well, suggesting that the accelerated dissolution in agitated media results from the shrinking of the boundary layer where the transport of aqueous species is driven by diffusion and that advection was the dominant process.
This work strongly suggests that the continuous and energetic mixing of the waves likely accelerates the dissolution kinetics of the silicates, which might yield a new DSi flux to the ocean, overlooked so far. Refining the value of this new flux with regards to the other components of the DSi oceanic cycle will require more in situ observations and field studies, involving concentration and isotope measurements and associated to thermodynamic and biogeochemical modeling.
The raw data supporting the conclusions of this manuscript will be made available by the authors, without undue reservation, to any qualified researcher.
CJ initiated the project. SF, TZ, and CJ designed and operated the experiments. SF and MR conducted the modeling calculation. RA brought his knowledge of the surf zone dynamic. SF and CJ wrote the manuscript.
This work was supported by the project KINETICS (LEFE/EC2CO, PI CJ).
The authors declare that the research was conducted in the absence of any commercial or financial relationships that could be construed as a potential conflict of interest.
S. Mounic is greatly acknowledged for the chemical analysis. We would like to thank S. Latour and M. Monnereau for fruitful discussions about model sizing. V. Regard provided some pertinent advices relative to the dynamics of sandy beaches. At last, S. Blanco’s physical insight was very much appreciated. J. Sonke, Y. Godderis, and M. Toplis are thanked for their thorough readings which contributed to improve this manuscript. Three reviewers provided very useful criticisms and comments that helped to improve the manuscript.
The Supplementary Material for this article can be found online at: https://www.frontiersin.org/articles/10.3389/feart.2019.00231/full#supplementary-material
Aagaard, T., and Jensen, S. G. (2013). Sediment concentration and vertical mixing under breaking waves. Mar. Geol. 336, 146–159. doi: 10.1016/j.margeo.2012.11.015
Angelis, M. D., Barkov, N. I., and Petrov, V. N. (1987). Aerosol concentrations over the last climatic cycle (160 kyr) from an Antarctic ice core. Nature 325, 318–321. doi: 10.1038/325318a0
Anschutz, P., Smith, T., Mouret, A., Deborde, J., Bujan, S., Poirier, D., et al. (2009). Tidal sands as biogeochemical reactors. Estuar. Coast. Shelf Sci. 84, 84–90. doi: 10.1016/j.ecss.2009.06.015
Arsouze, T., Dutay, J.-C., Lacan, F., and Jeandel, C. (2009). Reconstructing the Nd oceanic cycle using a coupled dynamical – biogeochemical model. Biogeosciences 6, 2829–2846. doi: 10.5194/bg-6-2829-2009
Banfield, J. F., Nealson, K. H., and Mineralogical Society of America, (eds) (1997). Geomicrobiology: Interactions between Microbes and Minerals, Reviews in Mineralogy. Washington, DC: Mineralogical Society of America.
Bennett, P. C. (1991). Quartz dissolution in organic-rich aqueous systems. Geochim. Cosmochim. Acta 55, 1781–1797. doi: 10.1016/0016-7037(91)90023-X
Brady, P. V., and Walther, J. V. (1990). Kinetics of quartz dissolution at low temperatures. Chem. Geol. 82, 253–264. doi: 10.1016/0009-2541(90)90084-K
Brantley, S. L., Kubicki, J. D., and White, A. F. (2008). Kinetics of Mineral Dissolution, in: Kinetics of Mineral Interaction. New York, NY: Springer.
Brown, A. C., and Mclachlan, A. (2002). Sandy shore ecosystems and the threats facing them: some predictions for the year 2025. Environ. Conserv. 29, 62–77. doi: 10.1017/s037689290200005x
Casey, W. H. (1991). On the relative dissolution rates of some oxide and orthosilicate minerals. J. Colloid Interface Sci. 146, 586–589. doi: 10.1016/0021-9797(91)90225-W
Crundwell, F. K. (2014). The mechanism of dissolution of minerals in acidic and alkaline solutions: part II application of a new theory to silicates, aluminosilicates and quartz. Hydrometallurgy 149, 265–275. doi: 10.1016/j.hydromet.2014.07.003
De La Rocha, C. L., and Bickle, M. J. (2005). Sensitivity of silicon isotopes to whole-ocean changes in the silica cycle. Mar. Geol. 217, 267–282. doi: 10.1016/j.margeo.2004.11.016
Delaney, J. M., and Wolery, T. J. (1989). The LLNL Thermochemical Database. Report UCRL- 21658. doi: 10.1016/j.margeo.2004.11.016
DeMaster, D. J. (1981). The supply and accumulation of silica in the marine environment. Geochim. Cosmochim. Acta 45, 1715–1732. doi: 10.1016/0016-7037(81)90006-5
Dove, P. M. (1994). The dissolution kinetics of quartz in sodium chloride solutions at 25 degrees to 300 degrees C. Am. J. Sci. 294, 665–712. doi: 10.2475/ajs.294.6.665
Duce, R. A., Liss, P. S., Merrill, J. T., Atlas, E. L., Buat-Menard, P., Hicks, B. B., et al. (1991). The atmospheric input of trace species to the world ocean. Glob. Biogeochem. Cycles 5, 193–259. doi: 10.1029/91GB01778
Dürr, H. H., Meybeck, M., Hartmann, J., Laruelle, G. G., and Roubeix, V. (2011). Global spatial distribution of natural riverine silica inputs to the coastal zone. Biogeosciences 8, 597–620. doi: 10.5194/bg-8-597-2011
Ehlert, C., Reckhardt, A., Greskowiak, J., Liguori, B. T. P., Böning, P., Paffrath, R., et al. (2016). Transformation of silicon in a sandy beach ecosystem: insights from stable silicon isotopes from fresh and saline groundwaters. Chem. Geol. 440, 207–218. doi: 10.1016/j.chemgeo.2016.07.015
Frings, P. J., Clymans, W., Fontorbe, G., De La Rocha, C. L., and Conley, D. J. (2016). The continental Si cycle and its impact on the ocean Si isotope budget. Chem. Geol. 425, 12–36. doi: 10.1016/j.chemgeo.2016.01.020
Gautier, J.-M., Oelkers, E. H., and Schott, J. (2001). Are quartz dissolution rates proportional to B.E.T. surface areas? Geochim. Cosmochim. Acta. 65, 1059–1070. doi: 10.1016/S0016-7037(00)00570-6
Gehlen, M., Malschaert, H., and Van Raaphorst, W. R. (1995). Spatial and temporal variability of benthic silica fluxes in the southeastern North Sea. Cont. Shelf Res. 15, 1675–1696. doi: 10.1016/0278-4343(95)00012-P
Haddad, S. C., Worden, R. H., Prior, D. J., and Smalley, P. C. (2006). Quartz cement in the fontainebleau sandstone, paris basin, france: crystallography and implications for mechanisms of cement growth. J. Sediment. Res. 76, 244–256. doi: 10.2110/jsr.2006.024
Hood, E. M., Sabine, C. L., and Sloyan, B. M. (2010). GO-SHIP Repeat Hydrography Manual: A collection of Expert Reports and Guidelines. IOCCP Report No. 14. doi: 10.2110/jsr.2006.024
Jeandel, C. (2016). Overview of the mechanisms that could explain the “Boundary Exchange” at the land-ocean contact. Philos. Trans. R. Soc. Math. Phys. Eng. Sci. 374:20150287. doi: 10.1098/rsta.2015.0287
Jeandel, C., and Oelkers, E. H. (2015). The influence of terrigenous particulate material dissolution on ocean chemistry and global element cycles. Chem. Geol. 395, 50–66. doi: 10.1016/j.chemgeo.2014.12.001
Khatiwala, S., Schmittner, A., and Muglia, J. (2019). Air-sea disequilibrium enhances ocean carbon storage during glacial periods. Sci. Adv. 5:eaaw4981. doi: 10.1126/sciadv.aaw4981
Knauss, K. G., and Wolery, T. J. (1988). The dissolution kinetics of quartz as a function of pH and time at 70°C. Geochim. Cosmochim. Acta 52, 43–53. doi: 10.1016/0016-7037(88)90055-5
Krinsley, D., and Margolis, S. (1969). Section of geological sciences; a study of quartz sand grain surface textures with the scanning electron microscope. Trans. N. Y. Acad. Sci. 31, 457–477. doi: 10.1111/j.2164-0947.1969.tb02929.x
Lacan, F., and Jeandel, C. (2005). Neodymium isotopes as a new tool for quantifying exchange fluxes at the continent–ocean interface. Earth Planet. Sci. Lett. 232, 245–257. doi: 10.1016/j.epsl.2005.01.004
Lal, D. (1977). The oceanic microcosm of particles. Science 198, 997–1009. doi: 10.1126/science.198.4321.997
Luijendijk, A., Hagenaars, G., Ranasinghe, R., Baart, F., Donchyts, G., and Aarninkhof, S. (2018). The state of the world’s beaches. Sci. Rep. 8:6641. doi: 10.1038/s41598-018-24630-6
Martin, J. H., Coale, K. H., Johnson, K. S., Fitzwater, S. E., Gordon, R. M., Tanner, S. J., et al. (1994). Testing the iron hypothesis in ecosystems of the equatorial Pacific Ocean. Nature 371, 123–129. doi: 10.1038/371123a0
Mikolajczak, G. (2019). Dynamique de l’eau et des apports Particulaires Originaires du Rhône sur la marge Continentale du Golfe du Lion. Toulouse: Toulouse III-Paul Sabatier.
Monnin, E. (2001). Atmospheric CO2 concentrations over the last glacial termination. Science 291, 112–114. doi: 10.1126/science.291.5501.112
Ning, R. Y. (2003). Discussion of silica speciation, fouling, control and maximum reduction. Desalination 151, 67–73. doi: 10.1016/S0011-9164(02)00973-6
NOAA Office of Satelllite Production Operation (2013). Sea Surface Temperature (SST) Contour Charts [WWW Document], 2013. Available at: http://www.ospo.noaa.gov/Products/ocean/sst/contour/ (accessed June 19, 2013).
Orton, G. J., and Reading, H. G. (1993). Variability of deltaic processes in terms of sediment supply, with particular emphasis on grain size. Sedimentology 40, 475–512. doi: 10.1111/j.1365-3091.1993.tb01347.x
Parkhurst, D., and Appelo, C. A. J. (1999). User’s guide to PHREEQC (version 2) - a Computer Program For Speciation, Batch-Reaction, One-Dimensional Transport, And Inverse Geochemical Calculations, Water-Ressources Investigations Report 99-4259. Colorado.
Ragueneau, O., Schultes, S., Bidle, K., Claquin, P., and Moriceau, B. (2006). Si and C interactions in the world ocean: importance of ecological processes and implications for the role of diatoms in the biological pump. Glob. Biogeochem. Cycles 20:GB4S02. doi: 10.1029/2006GB002688
Ragueneau, O., Tréguer, P., Leynaert, A., Anderson, R. F., Brzezinski, M. A., DeMaster, D. J., et al. (2000). A review of the Si cycle in the modern ocean: recent progress and missing gaps in the application of biogenic opal as a paleoproductivity proxy. Glob. Planet. Change 26, 317–365. doi: 10.1016/S0921-8181(00)00052-7
Rahman, S., Aller, R. C., and Cochran, J. K. (2017). The missing silica sink: revisiting the marine sedimentary Si cycle using cosmogenic 32 Si: the missing sedimentary silica sink. Glob. Biogeochem. Cycles 31, 1559–1578. doi: 10.1002/2017GB005746
Rahman, S., Tamborski, J. J., Charette, M. A., and Cochran, J. K. (2019). Dissolved silica in the subterranean estuary and the impact of submarine groundwater discharge on the global marine silica budget. Mar. Chem. 208, 29–42. doi: 10.1016/j.marchem.2018.11.006
Roustan, M. (2003). Transferts Gaz-Liquide Dans Les Procédés De Traitement Des Eaux Et Des Effluents Gazeux. Paris: Tech & doc.
Sarnthein, M., Tetzlaff, G., Koopmann, B., Wolter, K., and Pflaumann, U. (1981). Glacial and interglacial wind regimes over the eastern subtropical Atlantic and North-West Africa. Nature 293, 193–196. doi: 10.1038/293193a0
Shanks, A. L., Morgan, S. G., MacMahan, J., and Reniers, A. J. H. M. (2017). Alongshore variation in barnacle populations is determined by surf zone hydrodynamics. Ecol. Monogr. 87, 508–532. doi: 10.1002/ecm.1265
Strickland, J. D., and Parsons, T. R. (1972). A Practical Handbook Of Seawater Analysis. Ottawa, ON: Fisheries Reasearch Board of Canada.
Sutton, J. N., Varela, D. E., Brzezinski, M. A., and Beucher, C. P. (2013). Species-dependent silicon isotope fractionation by marine diatoms. Geochim. Cosmochim. Acta 104, 300–309. doi: 10.1016/j.gca.2012.10.057
Svendsen, I. A. (2006). Introduction to Nearshore Hydrodynamics, Advanced Series On Ocean Engineering. Singapore: World Scientific.
Tamborski, J., Bejannin, S., Garcia-Orellana, J., Souhaut, M., Charbonnier, C., Anschutz, P., et al. (2018). A comparison between water circulation and terrestrially-driven dissolved silica fluxes to the Mediterranean Sea traced using radium isotopes. Geochim. Cosmochim. Acta. 238, 496–515. doi: 10.1016/j.gca.2018.07.022
Tréguer, P. J., and De La Rocha, C. L. (2013). the world ocean silica cycle. Annu. Rev. Mar. Sci. 5, 477–501. doi: 10.1146/annurev-marine-121211-172346
Van Cappellen, P. (1996). Reactive surface area control of the dissolution kinetics of biogenic silica in deep-sea sediments. Chem. Geol. 132, 125–130. doi: 10.1016/S0009-2541(96)00047-2
Van Cappellen, P., and Qiu, L. (1997). Biogenic silica dissolution in sediments of the Southern Ocean. I. solubility. Deep Sea Res. Part II Top. Stud. Oceanogr. 44, 1109–1128. doi: 10.1016/S0967-0645(96)00113-0
Vos, K., Vandenberghe, N., and Elsen, J. (2014). Surface textural analysis of quartz grains by scanning electron microscopy (SEM): from sample preparation to environmental interpretation. Earth-Sci. Rev. 128, 93–104. doi: 10.1016/j.earscirev.2013.10.013
Keywords: silica, quartz, weathering, beaches, ocean chemistry
Citation: Fabre S, Jeandel C, Zambardi T, Roustan M and Almar R (2019) An Overlooked Silica Source of the Modern Oceans: Are Sandy Beaches the Key? Front. Earth Sci. 7:231. doi: 10.3389/feart.2019.00231
Received: 11 February 2019; Accepted: 22 August 2019;
Published: 11 September 2019.
Edited by:
Eric ‘Pieter Achterberg, GEOMAR Helmholtz Center for Ocean Research Kiel, GermanyReviewed by:
Wei-dong Zhai, Shandong University, ChinaCopyright © 2019 Fabre, Jeandel, Zambardi, Roustan and Almar. This is an open-access article distributed under the terms of the Creative Commons Attribution License (CC BY). The use, distribution or reproduction in other forums is permitted, provided the original author(s) and the copyright owner(s) are credited and that the original publication in this journal is cited, in accordance with accepted academic practice. No use, distribution or reproduction is permitted which does not comply with these terms.
*Correspondence: Sébastien Fabre, c2ViYXN0aWVuLmZhYnJlQGlyYXAub21wLmV1; Catherine Jeandel, Y2F0aGVyaW5lLmplYW5kZWxAbGVnb3Mub2JzLW1pcC5mcg==
Disclaimer: All claims expressed in this article are solely those of the authors and do not necessarily represent those of their affiliated organizations, or those of the publisher, the editors and the reviewers. Any product that may be evaluated in this article or claim that may be made by its manufacturer is not guaranteed or endorsed by the publisher.
Research integrity at Frontiers
Learn more about the work of our research integrity team to safeguard the quality of each article we publish.