 Carolin Willibald
 Sophia Scheuber2
 Henning Löwe
 Martin Schneebeli
- 1WSL Institute for Snow and Avalanche Research SLF, Davos, Switzerland
- 2Institute of Mechanical Systems, ETH Zürich, Zurich, Switzerland
The snow microstructure is crucial for the mechanical behavior of snow, but is usually simplified in numerical models. In Discrete Element Models (DEM), often used in snow mechanics, the microstructure is typically represented by sphere assemblies. This renders a model validation difficult, as the real snow crystal shapes affect the actual contacts and consequently the macromechanical behavior. To approach this problem from the experimental side, we created simplified microstructures comprising spherical ice particles and examined this model snow under structural and mechanical aspects. We developed a new method to create uniform ice spheres and performed a detailed particle characterization using 3D computed tomography (CT). We examined sintered sphere assemblies to relate microstructural and macromechanical properties in a geometrically well-defined system. Microstructural variation was created by varying the sample density and sintering time, to study the role of the number and size of contacts. 3D CT scans were taken of sintered sphere samples, which were then tested in unconfined compression experiments together with a nature identical snow type as a reference. The scans were evaluated regarding the number of particles and contacts, and were used to compute the elastic modulus, as additional mechanical property. The results of the particle characterization showed the spherical shape and sharp size-distribution of the particles, which are the main prerequisites for model validation. The CT image analysis showed the reproducibility of the sphere assemblies and can be applied for efficient reconstruction of the experimental samples as initial condition for simulations. The mechanical properties conform with the reference snow and the expectations from literature, however, the CT scans revealed a complex geometry of the sintered contacts with measurable impact on the mechanical properties.
1. Introduction
Snow mechanics is still an active field of research, despite its considerable history over the past 90 years (Mellor, 1975; Shapiro et al., 1997). Avalanche risk forecasting, snow mobility, snow sports or snow and firn compaction, in general, are just a few of the applications that require quantitative characterization of the dominant mechanical processes. The main challenge thereby comes from the versatile and changeable nature of snow microstructure. Snow is a porous material that consists of an ice skeleton and air. The skeleton forms from single ice crystals that grow at mutual contacts via (early stage) sintering and later evolve in time via (late stage) sintering which are commonly subsumed in the term snow metamorphism. The geometry of the microstructure manifests itself in diverse snow types and physical properties. A reliable mechanical model would only need to combine a geometrical description (snow microstructure) with mechanical properties of ice to fully predict the mechanical behavior of snow (Schneebeli, 2004; Chandel et al., 2014; Hagenmuller et al., 2014).
The geometrical characterization of snow microstructure has considerably advanced in recent years, mainly due to micro-computed tomography (CT). CT imaging allows us to constrain the microstructure in simulations for comparison with experiments. Combining microstructural and mechanical properties of snow has considerably enhanced the comprehension of snow mechanics (Wang and Baker, 2013; Hagenmuller et al., 2014; Kochle and Schneebeli, 2014; Srivastava et al., 2016). For example, it has been shown that the sintered contacts between the grains are the mechanically weakest parts where the structure fractures (Hagenmuller et al., 2014); or that the elastic moduli can be fully predicted from the microstructure measured by CT and the elastic properties of ice (Gerling et al., 2017). However, the incorporation of the microstructure comes along with high methodological and computational effort. A detailed reconstruction (Hagenmuller et al., 2015) is restricted to small volumes, whereas in a simplified representation (Theile and Schneebeli, 2011) the precision is limited by the complexity of the snow crystal shape that renders an unambiguous identification of grains and contacts impossible. Quite generally, if a model utilizes a microstructure model comprising grains, the mapping onto the real bicontinuous geometry obtained from CT images remains the main difficulty.
The difficulty of incorporating the microstructure is an inherent problem of discrete element modeling (DEM) of snow. DEM has become a powerful tool to model snow mechanics (Johnson and Hopkins, 2005; Gaume et al., 2015; Hagenmuller et al., 2015; Michael et al., 2015; Kabore and Peters, 2018) and has also been employed in snow optics (Kaempfer et al., 2007). DEM is widely used to simulate granular materials by calculating particle dynamics and interactions. For snow, DEM is appropriate because the granular particles can also be bonded and thereby represent the sintered, solid-like structure of snow, and yet fracture can be described, as under fast deformation. Then the two key ingredients that need to be specified in DEM modeling are particles and contacts between them. In the simplest and computationally most efficient case, the particles are spherical. The remaining difficulty is then to map the experimental microstructures onto a sphere assembly that captures properties of real snow. The existing approaches include e.g., generic (ballistic) deposition models (Mulak and Gaume, 2019) or configurations drawn from Baxter's sticky hard spheres (Gaume et al., 2017). While these approaches capture some aspects of the microstructure, they do not overcome the complex shape of the snow crystals that affects the particle interactions, and thus the mechanical response is strongly simplified. The effects of the snow particle shape and the actual micro-mechanical contacts cannot be resolved. This was pointed out by Hagenmuller et al. (2015) who studied diverse snow microstructures and their mechanical properties through DEM compression tests. They underlined the necessity of mechanical experiments in combination with CT scans to reduce the uncertainties of the microscopic contact parameters and to validate models. This problem, namely the comparability of experiments and simulations, can be tackled in two ways. First, on the modeling side, the representation of microstructure in DEM could be made more sophisticated (Mede et al., 2018) to represent the true microstructure by only using spheres. Second, it is possible to explore the problem also from the experimental side, and experimentally create synthetic microstructures that closely resemble ideal sphere assemblies.
Snow made of spherical ice particles has been prepared and used in several studies on sintering, the formation of solid necks at the contact points (Kingery, 1960; Kuroiwa, 1961; Hobbs and Mason, 1964; Chen and Baker, 2010). The spheres were commonly produced by spraying water into liquid nitrogen or oxygen to obtain particles in a diameter range of 20 μm up to 4 mm. Ideally grown necks were observed in conformance with the theoretical prediction (Hobbs and Mason, 1964). This renders systems of sintered ice spheres as ideal candidates for DEM models since the key entities of particles and contacts are well-defined. The contact size can even be modified by varying the sintering time. These are ideal preconditions to examine microstructural and mechanical properties of an artificial microstructure comprising spheres. However, the size-dependent sintering process is faster on smaller particles, and the deviations from the ideal spherical shape, due to mass transporation from bulk to neck growth, are more pronounced on smaller particles. Therefore, rather large spheres seem practical to examine contact properties of a sphere assembly while preserving the spherical particle shape for a longer time.
In the present paper, we examine the potential of spherical model snow as a mean to close the gap between experiments and simulations of snow mechanics, that remains despite detailed CT imaging of the microstructure. The ice spheres with clearly defined shapes and contacts, seem to be an ideal intermediate step, to examine contact properties and facilitate a close model validation. We present a new method to create spherical model snow and idealized microstructures, together with a careful characterization of geometrical (spheres, contacts) and mechanical (elasticity and strength) properties. We seek to provide experimental data that can be used for actual DEM simulations. To this end, we developed a novel method for ice bead production and performed a detailed characterization of the particles in terms of particle size and sphericity, using CT images. For the mechanical characterization, unconfined compression experiments of sintered ice bead samples were performed in combination with 3D CT scans. The scans were used to analyze the microstructure and relate it to the mechanical response, and to compute the elastic modulus through FEM simulations as an additional macro-mechanical parameter. Two important contact parameters relevant for DEM (number of contacts, mechanical properties of contacts) were experimentally manipulated: some of the ice bead samples were densified to increase the number of contacts, and different sintering times were investigated to influence the size of the contacts between the particles. As a reference we performed experiments also with nature identical snow.
The results of the particle characterization, namely high sphericity, and narrow size distribution, are ideal prerequisites for an experimental DEM analogon. The CT image analysis showed the reproducibility of the sphere assemblies, and can be applied for efficient reconstruction of the experimental sphere assemblies, as initial condition for simulations. However, the CT images revealed a complex geometry of the bonds after the manipulation by sintering with measurable impact on the mechanical properties.
The paper is organized as follows: The next section starts with the description of the production of the ice beads and snow samples, followed by the specification of the compression experiment. The CT-based methods for particle and structure analysis, as well as the simulation of the elastic modulus are explained together with a qualitative analysis of the ice bead crystallography. The order of particle and structure characterization, simulations of elastic modulus, and compression tests is given in the result section as well as in the subsequent discussion.
2. Materials and Methods
2.1. Ice Bead Production
To meet the requirements of very round ice particles with a narrow size distribution, we constructed a tumbling machine to round off frozen water droplets, similar as in industrial methods like tumbling or barrel finishing (Gillespie, 2007). The droplets were obtained by dropping deionized, purified water with a syringe on a Teflon sheet at –20°C. Using the syringe, the particles had approximately the same initial size. For the tumbling machine we mounted an aluminum can with a diameter of 15.5 cm on a rotary motor, sketched in Figure 1A. The can is coated with sand paper (ISO grit P100) on the inside and closed with a cap during tumbling. The rotational velocity (≈ 3 s−1) was chosen such that the granular flow kept in the rolling regime and no particles stick to the wall due to the centrifugal force. During tumbling the particles become smaller and round off by abrasion to a spherical shape. Tumbling velocity and time determine the size of the particles. For our analysis we produced ice beads in the size range of 2−2.2 mm and we stopped the tumbling process once the particles passed a 2.2 mm sieve. Dust and smaller particles were sieved out with a 2 mm sieve. The frozen water droplets need to be tumbled for ~24 h at –20°C to turn into ice beads in this size range. A microscopy image of one exemplary particle is shown in Figure 2B.
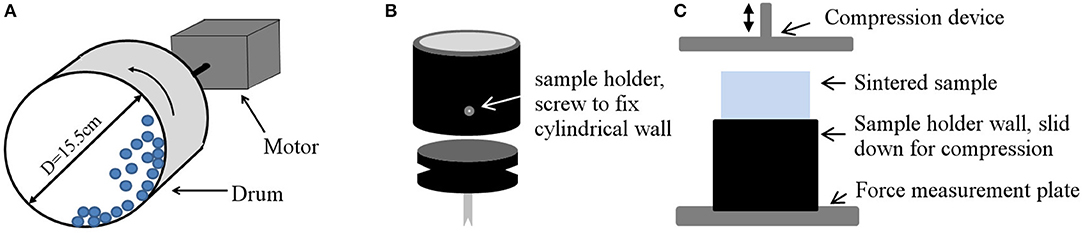
Figure 1. (A) Sketch of the tumbling machine consisting of a cylindrical drum and a rotary motor. (B) Sketch of the sample holder and (C) the experimental set-up for the compression tests.
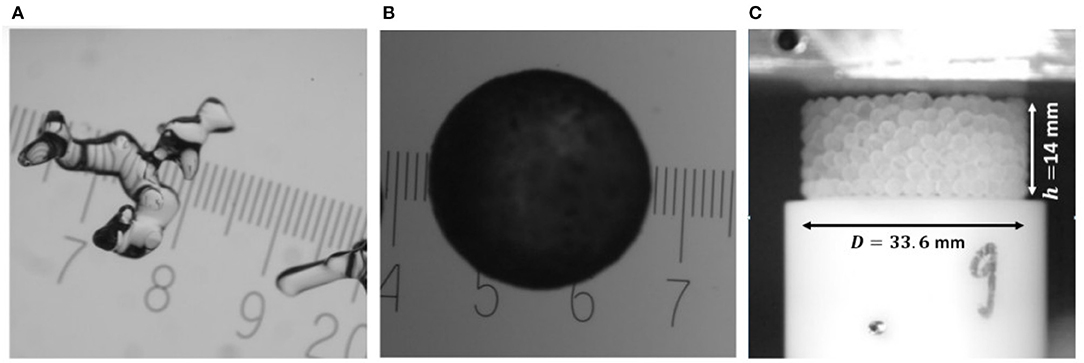
Figure 2. Microscopy images of exemplary particles of nature identical snow (A) and ice beads (B), same scale (mm) in both images. (C) Sample of unconfined sintered ice beads, after removal of sample holder wall, before compression test.
Within the scope of the present application, ice beads can be reused as they were not destroyed in the experiments. We did neither observe fractured particles after the experiment nor any changes of the regarded particle characteristics, like size, or shape. However, before using them in a next experiment, they were tumbled again for about half an hour to smooth the surface which became rough during sintering.
2.2. Nature Identical Snow
As reference for the analysis and the mechanical tests, we included a prevalent and widely investigated snow type in the analysis with isothermally metamorphed rounded grains. The snow was produced in the lab using fresh, dendritic snow from a snowmaker (Schleef et al., 2014) as base material. It was sieved into a Styrofoam box and stored at –5°C over 3 month. Rounded grains developed in a sub-millimeter size range (Figure 2A). According to Schleef et al. (2014), who performed a comprehensive comparison of lab-produced and natural snow, we refer to this snow as “nature identical snow” and classify it as large rounded grains RG according to Fierz et al. (2009).
For the compression tests, the snow was sieved with two sieves with mesh sizes of 1.4 and 0.7 mm, to obtain separated particles in a restricted size range. A 2D cross-section of a 3D binary CT image is presented in Figure 3D. CT images were used to characterize the snow structure in terms of density and specific surface area (SSA).
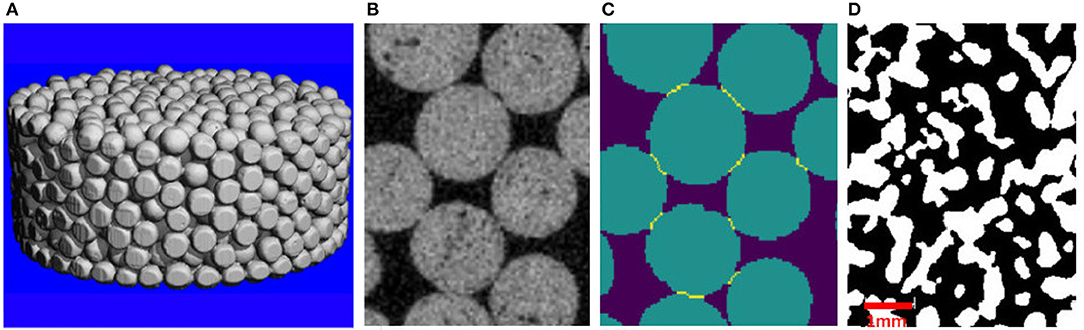
Figure 3. CT images of the samples: (A) binary 3D image of experimental cylindrical ice bead sample (the particles at the rim appear flat, due to the chosen section, to cut out the sample holder wall). (B) 2D slice of ice bead sample, gray image with 18 μm resolution; (C) downscaled and segmented binary image, ice beads were identified using a watershed algorithm and the watersheds as contacts between the particles are depicted as yellow lines. (D) Binary microstructure of nature identical snow (white ice phase), identification of particles and contacts is ambiguous.
2.3. Sample Preparation
With the freshly tumbled ice beads we prepared cylindrical samples (Figure 2C) for the compression experiments. The sample holders consisted of a round base with a diameter of 33.6 mm and a cylindrical wall around. The wall could be fixed on the base to fill in and sinter the particles, and slid down to perform the unconfined compression test (Figures 1B,C). The fixed cylinder wall determined the sample height of 14 mm. With the ice beads, we created two sample classes, namely compacted and uncompacted samples. For the uncompacted samples (referred to as poured beads), the wall was fixed and the particles were poured in. Before they were sealed with a lid to avoid evaporation, particles that stick out were carefully removed to flatten the surface, without pushing them into the sample. For the compacted samples (referred to as tapped beads) the cylindrical wall was held higher than 14 mm for filling in the particles and tapping them 30 times on the table, to densify the structure. After the tapping the wall was slid down and fixed to the same height of 14 mm, to flatten the surface and close the sample with a lid. The samples of the nature identical RG snow were prepared in the same way as the poured ice bead samples: the snow was sieved into the sample holder with the fixed wall and the surface was flattened by removing additional particles.
For sintering, the samples were then placed in a Styrofoam box in a –10°C cold room. The temperature during the entire sintering process was measured for the tapped samples. The fluctuation in the box was ±0.5°C. For all sample classes we investigated different sintering times ts. We chose two main sintering times with a higher number of samples and some sintering times in between, with less samples, to cover a wider time-range. The numbers of samples per sintering time are listed in Table 1. The number of samples with CT scans is written in the parentheses and also counted in the total number of samples. We have chosen different main sintering times for ice beads and RG snow. This reflects the differences in sintering behavior of different snow types (van Herwijnen and Miller, 2013). In the experiments we aimed to cover the time ranges with highest sintering rates, which are different for ice beads and nature identical snow.
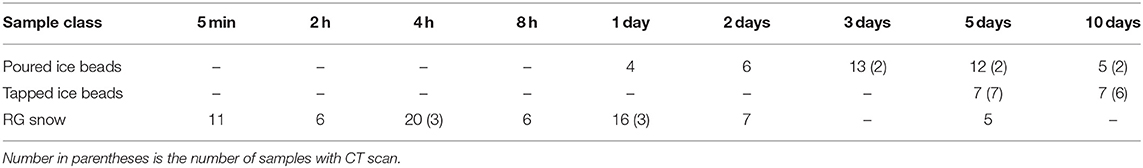
Table 1. Overview of the tested samples per sintering time ts.
2.4. Unconfined Uniaxial Compression Experiments
Unconfined compression experiments were performed to derive with the compressive strength a macro-mechanical property of the samples. The experiments were conducted at –10°C with a friction and compression testing machine described by Theile et al. (2009). To compress a sample it was fixed on a force measurement plate, where the outer wall of the sample holder was removed by sliding it down, as sketched in Figures 1B,C. The unconfined specimen was then compressed to a depth of 8 mm with a constant velocity of 10 mm/s. A force—displacement curve was recorded with a sampling rate of 10 kHz. For the stress—strain conversion, the force was normalized by the circular sample area. Taking the sample area as contact area included the simplification of a constant area. The change of the actual contact area, due to falling out particles during compression, could not be recorded.
2.5. Micro-Computed Tomography
For some samples, 3D CT scans were taken before the compression tests by using a Scanco Medical CT 40 scanner, that is operated in a cold room. The X-ray scanner was held constant at −10 ± 1°C. The trade-off between scanning time and resolution led to a scanning duration of 3 h and a voxel size of 18 μm, resulting in a sample dimension of about (2,000 × 2,000 × 800) voxel. With that, the entire cylindrical sample was scanned to allow for a complete reconstruction of all particles in the experimental samples, as input for DEM simulations, (Figure 3A). The scans were timed as close as possible to the compression tests (ts − 3 h) to capture the final sintering state in the images, but some variations were unavoidable.
2.6. 3D Image Analysis
First, the gray images (Figure 3B) need to be segmented to define ice and air phase. For each image, the appropriate threshold was determined by fitting the sum of three Gaussian distributions to the grayscale histogram, as described by Hagenmuller et al. (2013). A sub-volume of the binary image was then used to compute the elastic modulus, as described below, and to determine the specific surface area SSA via interface triangulation. The triangulation based method is a standard evaluation of the CT images that is provided by the vendor software from Scanco Medical (Hildebrand et al., 1999), for which a deviation of 5% was determined for a reference object with known surface area (Hagenmuller et al., 2016). For the structural analysis of the samples, the image resolution was decreased by a factor two, for numerical reasons. The downscaling was performed on the gray images and therefore acted like a filter. The preservation of the mean gray value before and after downscaling implies the invariance of the air-ice ratio, thus the scaling should not affect the derived parameters (number and size of particles and number of bonds). For the scaling eight voxels were integrated into one before the threshold was determined and the images segmented, as described above. A 2D slice of the downscaled binary image is shown in Figure 3C, where the ice phase is green (1) and the air is blue (0).
The subsequent image analysis was done in Python. The particles needed to be identified to determine the size distribution of the beads and to characterize the structure in terms of the number of particles np and the number of contacts nb. In a first step, air bubbles in the ice phase had to be removed as they disturbed the segmentation process. This is achieved by identifying the largest connected air component and assigning all other voxels the ice value 1. On the bubble-free image a watershed algorithm was applied to identify the particles. This common algorithm is contained in the Python Scipy library. It is often used for similar problems and works well on clear defined shapes (Spettl et al., 2016), as the ones of the ice beads. With a distance transform on the ice phase, local maxima are found around the center of the particles. From these points the watershed algorithm starts to “flood” the ice phase, until a constriction – a watershed – is reached. Such a watershed should be located at the contact, the narrow part between two particles. When the contacts were found the particles were identified. The watersheds themselves were counted as the contacts and are depicted as yellow lines in Figure 3C.
To determine the size rp of the ice beads, the voxels belonging to each particle were counted. Knowing the voxel size, we calculated the particle volume and translated this to the radius of an ideal sphere with equivalent volume. This method works well, given the spherical particle shape. For the sample density ρ the ice volume fraction ϕ was determined and multiplied by the density of ice, ρ = ϕρice.
2.7. FEM Simulation of the Elastic Modulus
A voxel-based Finite Element (FE) code (Garboczi, 1998) was used to compute the elastic moduli E of the samples. This was done to obtain a second macro-mechanical property, independent from the compression experiments. It has been shown by Gerling et al. (2017) that this microstructure-based method can be considered as a reliable estimate of the true elastic modulus of snow. In the FEM code, effective elastic moduli are computed from volume-averaged stresses when the sample is subjected to a prescribed volume-averaged strain. We used the same parameterization as Gerling et al. (2017) by assuming a microstructure made of isotropic, polycrystalline ice, with the ice bulk and shear moduli K = 8.9 GPa and G = 3.5 GPa. The simulations were performed on a cubic sub-volume of the binary images with the original resolution of 18 μm. For obtaining equivalent cutouts, we analyzed the vertical density profiles of the samples and cut the uppermost slices off at a comparable density value. The x- and y-dimensions were the same for all images and chosen such that a maximum cube was cut out of the cylindrical sample volume. The sample dimension was then (1,200 × 1,200 × 650) voxel, corresponding to (21.6 × 21.6 × 11.7) mm, with slight variations in the z-dimension.
2.8. Qualitative Ice Bead Crystallography
As the internal crystalline structure of the ice beads is of potential relevance for model validation, we provide a fabric analysis, as part of the particle characterization. The analysis is based on polarized light microscopy (Riche et al., 2012). This method for visualizing the internal crystalline structure exploits the crystal-axis-orientation dependent optical properties of ice. Thin sections of ice were illuminated under different angles and from the refraction of the translucent light the crystal orientation was deduced. Due to the absence of a calibration of the microscope, only a qualitative picture can be provided. This is, however, sufficient to visualize differences in intensity and to identify differently oriented grains. We examined 31 particles, a random selection of which is shown in Figure 4. The ice bead slices we analyzed in this way consisted of 1 – 10 crystals. While we observed several mono-crystalline beads, we could not find an ice bead consisting of more than 10 crystals. The expectation value and standard deviation was (2.3 ± 1.5) crystals per bead.
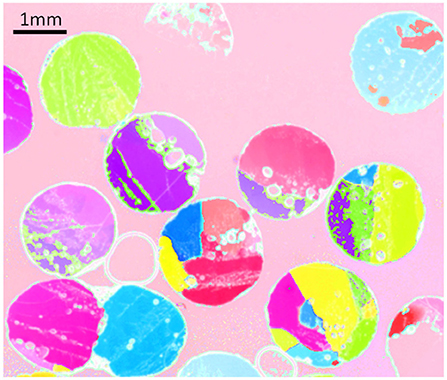
Figure 4. Visualization of crystalline structure of several ice beads, ground to 50 μm thick slices. A mono-crystal is represented by one color.
3. Results
3.1. Characterization of Ice Beads and RG Snow
The key requirements for the particles are a spherical shape and a narrow size distribution. To assess these properties, we analyzed the particle radius rp and the specific surface area SSA. The particle radii rp of the beads were calculated from all CT samples, with the average and standard deviation:
For the specific surface area SSA we obtained from all CT samples the average and standard deviation:
With a deviation of 6% this is very close to the SSA of an ideal sphere with the mean radius of the ice beads, with 2.9 m2kg−1. Since the SSA, the surface to volume ratio, for a given volume is minimal for a sphere, this result implies that the ice beads are close to an ideal spherical shape. From these results, a measure of sphericity can be derived, by the ratio of the surface of a volume-equivalent sphere and the surface of an object (Wadell, 1935). For an ideal sphere, the sphericity is one, for the ice beads the computed sphericity is 0.92.
The nature identical snow was characterized in terms of density and SSA, both derived from the CT images. The respective mean values of the six samples are given by: kg/m3 and m2kg−1.
The SSA of all CT samples, from RG snow and ice beads, is presented in Figure 5B together with the respective sintering time. The dotted lines indicate the averages and shows that the SSA is rather constant and no trend with sintering time can be seen.
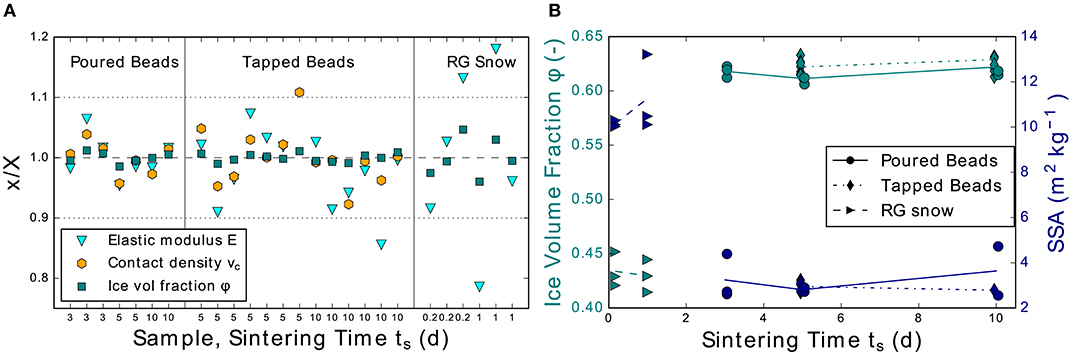
Figure 5. (A) Structural parameters, x = νc, ρ, and E normalized by the mean X of all images of one sample class are shown for all samples of the poured (left) and the tapped beads (middle) and for RG snow (right). The dotted lines indicate ±10%; the sintering time is denoted on the abscissa. (B) Ice volume fraction and SSA of all samples against the sintering time.
3.2. Characterization of the Ice Bead Structures
To demonstrate the reproducibility of the ice bead structures, we determined the number of particles np, the number of bonds nb and the ice volume fraction ϕ as structural parameters from the CT images, Table 2. From these values we calculated the contact density νc = ϕZc, as used by Gaume et al. (2017), with the coordination number Zc = 2nb/np. For all samples these values, normalized by the mean of the respective sample class, are shown in Figure 5A, for the poured (left) and tapped beads (middle). The standard deviation of <10% as indicated in the dotted lines underlines the reproducibility of the structures. The sintering time of the samples can be read on the abscissa. To relate these parameters to the elastic moduli, all values were determined from the cubic sub-volumes of the images which were used for the computation of the elastic moduli.
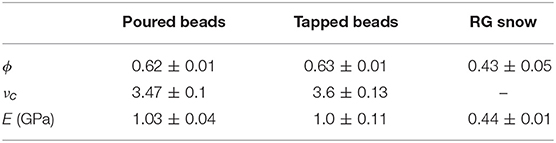
Table 2. Mean and standard deviation of the ice volume fraction ϕ, contact density νc and elastic modulus E.
To show the differences between the two sample classes, the contact density νc is plotted against the ice volume fraction ϕ in Figure 6. Although there is no sharp transition, it reveals the trend that the tapped samples have a higher density and more bonds per particle than the poured.
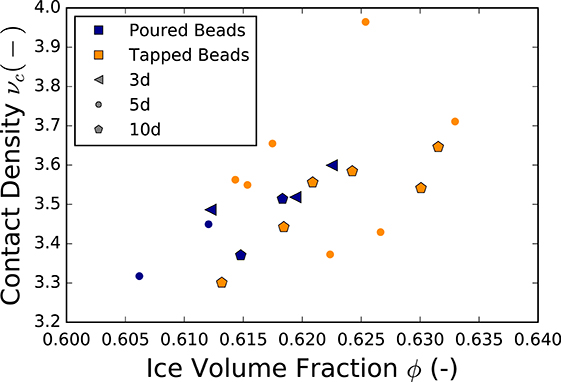
Figure 6. The distinctiveness of poured and tapped samples in the contact density against the ice volume fraction: the tapped samples have by tendency higher densities and more contacts, but also more variability. The sintering time is indicated in the symbols.
For the nature identical snow only density and elastic modulus are shown in Figure 5A (right), since no contact density could be determined. For both parameters the scatter is higher than for the ice bead samples and E exceeds the ±10% range.
3.3. FEM Simulations of the Elastic Modulus
The results for the elastic modulus are shown in Figure 7A against the sintering time ts of the respective sample and in Figure 7B against the ice volume fraction ϕ. The contact density νc of the ice bead samples is color-coded and magnified in the inset. For the ice beads and the RG snow the values of E are clearly separated and each in a narrow range, between 0.34 and 0.52 GPa for RG snow and 1.2 and 1.5 GPa for the ice beads. Figure 7A distinguishes the two ice bead classes in symbols and colors and reveals a rather large scatter of elastic moduli for the tapped samples, compared to the poured. A relation with the sintering time cannot be extracted which indicates that the effect of sintering is not resolved in the images. Figure 7B shows the increase of E with the ice volume fraction, as expected from the literature (Kochle and Schneebeli, 2014; Gerling et al., 2017). The inset shows the elastic moduli for the ice beads as a function of the two investigated parameters with a potential influence on E: on the abscissa is the ice volume fraction and the contact density in the colors. The general picture looks as expected: an increase of E with ϕ and νc. However, a closer look and an intercomparison of the points reveals that examples can be found with similar ice volume fractions, and contact densities but different elastic moduli.
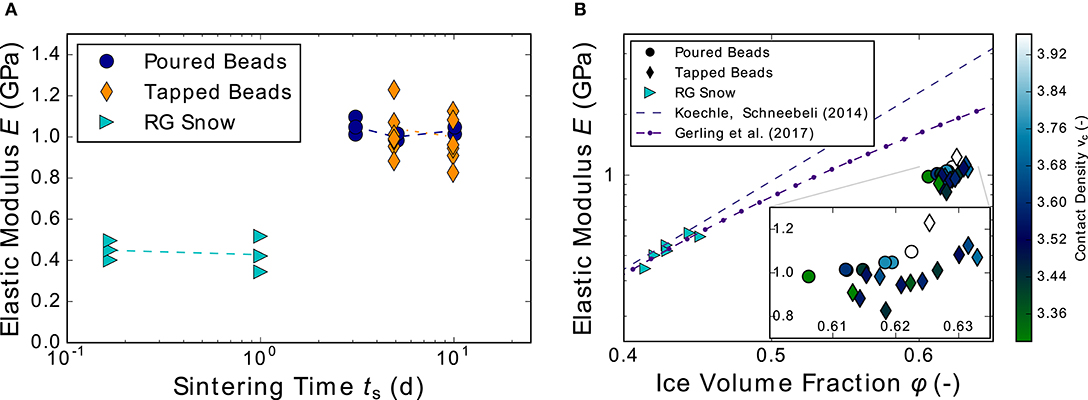
Figure 7. Elastic moduli computed on the CT images: (A) against the logarithmic sintering time, the lines indicate the averages; (B) against the ice volume fraction, with the color-coded contact density for the ice beads. The inset shows a magnification of the ice bead results.
3.4. Compression Experiments
For a visual inspection of the compression curves we show an example of a poured ice bead sample in Figure 8A. The sample has been sintered for 5 days and shows the typical behavior observed in all samples: strongly pronounced peaks occur when clusters of particles fall out (Figure 8B), the stress drops until a new contact is formed and the sample further compressed. The sampling rate of 10 kHz proved to be high enough to resolve the fracture, as is depicted in magnification of the highest peak in the inset of Figure 8A.
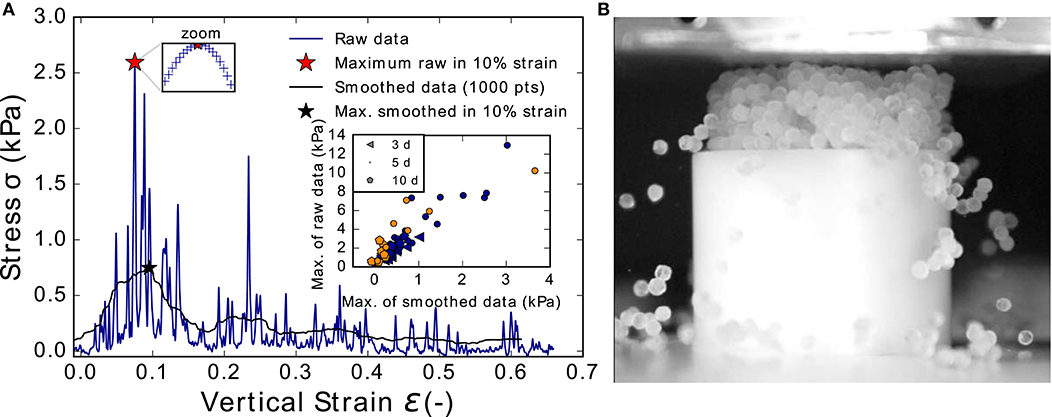
Figure 8. Compression experiment of a poured ice bead sample after 5 days sintering. (A) Example of stress-strain curve as experimental result: the blue curve shows the raw data, the black curve its smoothed version, which was calculated with a moving average over 1,000 data points. The magnification of the blue maximum shows that the sampling rate of 10 kHz resolved the fracture. The maxima within the first 10% of strain were extracted from each curve, as marked by the stars. The inset shows the relation between the maxima of raw and smoothed data. (B) Photography of sample during compression: single particles and clusters of particles break out and lead to the pronounced peaks shown in (A) and a changing contact area during compression.
In order to derive an objective characteristic of the rather irregularly shaped curves, the maximum within the first 10% strain (red star) was extracted from all curves. To examine its significance, it was compared to the maximum of the respective smoothed curve, which was calculated with a moving average over 1,000 data points (black curve and star in Figure 8A). The correlation of the two maxima is presented in the inset for all ice bead samples. Despite the scatter, both definitions of strength are reasonably correlated and led to the same overall-picture (Figure 9), indicating the usability of the first definition. Therefore, the raw data maximum within the first 10% strain is considered as characteristic for the sample. It is presented in Figure 9 as compressive strength σ against the sintering time ts, for all samples.
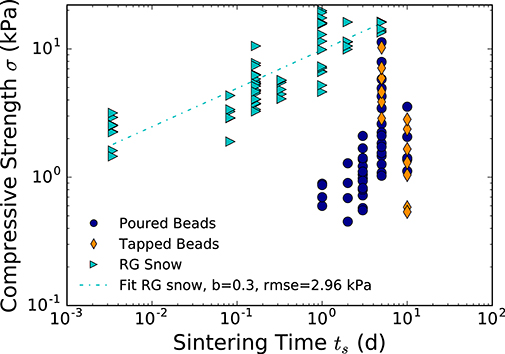
Figure 9. The compressive strength of nature identical snow increases monotonously with sintering time, a power-law fit could be performed. For the ice beads, an increasing strength can only be observed up to 5 days. The 10-days-samples are weaker for both sample types.
The log-log plot in Figure 9 summarizes all experiments of ice beads and RG snow. It shows the relation of compressive strength and sintering time and allows to intercompare the sample types. The RG snow sinters much faster and stronger than the ice beads, thus shorter sintering times were examined. A monotonic increase of the strength with sintering time was observed for the RG snow. In analogy to van Herwijnen and Miller (2013) we fitted the power-law to the data. For RG snow, a good fit (RMSE = 2.96 kPa) was achieved with an exponent b = 0.3. For the ice beads no fit was possible. The strength increases monotonously only up to 5 days (poured) and decreases toward 10 days again. The strength of the tapped samples exceeds the one of the poured after 5 days sintering, but it decreases after 10 days to about the same value.
A high-speed video of an ice bead compression experiment is available in the Video S1.
4. Discussion
4.1. Methods and Ice Bead Characterization
In mechanical tests and CT-based investigations of ice bead packings, we examined the potential of spherical model snow. In the tumbling of frozen water droplets, we found a method to produce suitable, uniform ice spheres: the standard deviation of the size distribution is <10 % and the SSA is close to the one of a volume-equivalent ideal sphere, which implies high sphericity. Spherical shape and monodiseperse size are the main requirements for the experimental discrete element counterparts and critical for model validation. The sphericity, derived from the SSA, was constant for samples of different sintering times, implying the preservation of the spherical shape throughout the experiments (Figure 5B). The particle size can be modified by the tumbling time, and smaller particles with an optical diameter of natural snow crystals can be produced as well. The qualitative evaluation of the crystallography indicates that the ice beads consist of one to 10 crystals. The growth of monocrystals would probably be favored under warmer conditions when the water freezes slower. This could be of interest for further sintering and optical experiments, or mechanical tests with the incorporation of the crystal orientation. So far, most “spherical ice particles” presented in the literature (Kuroiwa, 1961; Chen and Baker, 2010; Molaro et al., 2019) were produced by spraying water into liquid nitrogen and were not characterized in a similar way, which allows only qualitative comparison. A multicrystalline ice structure of particles with a 4 mm diameter was shown in SEM images (Chen et al., 2013), and on microscopy images these particles look less spherical than the ones presented here. Hobbs and Mason (1964) report about mono- and poly-crystalline, mono-disperse spheres with a diameter within one percent in the range of 20–300 μm. No measure for the sphericity was given. Therefore, we believe that the mechanical tumbling method presented here is an interesting alternative to produce idealized model snow comprising spheres.
Besides the particle characterization, a well-working image processing with particle identification is the basis for our analysis of microstructure and contacts, as well as the reconstruction toward mapping onto models. To this end, a watershed algorithm could successfully be applied to the 3D CT images to identify the particles and characterize the samples in terms of the number of particles and contacts. The contact size, as second relevant contact parameter besides the number of contacts, is expected to change with sintering time. This was observed in the experiments through increasing compressive strength, but could not be derived from the images, which were analyzed regarding the watershed sizes (number of voxels of the watersheds, which were counted as contacts). The constant watershed sizes must be due to the image resolution of 18 μm and the fact that these narrow parts in the microstructure are most sensitive to binary segmentation, which comes along with a loss of information. However, the image processing can be applied for a complete reconstruction of the samples. Besides the contacts and number of particles, the position of all particles and contacts could be determined. Together with the high sphericity and quasi-monodispersity, this renders the system an ideal candidate for model validation: experimental samples can be reconstructed as input for (DEM) models for a close comparison.
4.2. Relation Between Microstructure and Mechanics
The structural analysis of the CT images showed the reproducibility of the ice bead samples, with a standard deviation of the structural parameters of <10 %. The variation of density and elastic modulus of the RG snow samples was higher than for the ice bead samples. The densities of the ice bead samples lie in the range of a close random packing, which allows little structural variation. Yet, the effect of the sample compaction by tapping can be seen in higher densities and more contacts. The differences between the tapped and poured structures are small and without a sharp transition. But they are also mirrored in the mechanical properties, the simulated elastic modulus, and the experimentally measured compressive strength. While in the present paper the tapping was only employed as a proof of concept, a more systematic tapping method (using e.g., vibrations with a given frequency) may open the door for targeted manipulation of the packings.
Two main contact parameters were manipulated in the ice bead samples—the number of contacts by tapping and the size of the contacts through variation of the sintering time—and can be related to the mechanical response. The effect of sintering was not resolved in the CT images and consequently in the elastic modulus, for which a relationship with the contact density and ice volume fraction was observed. The compressive strength is related to both parameters, even though only indirectly. Since the sintering time did not change the other structural parameter (SSA, density, contact density) that potentially affect the compressive strength, the increasing strength can be ascribed to the increase of the contact size. As the contact size matters but could not be quantified, no relation with contact density and compressive strength could be derived.
The Elastic moduli E were determined by voxel-based FEM simulations of 3D CT images. With a voxel size of 18 μm the image resolution was too low to resolve details of the sintering effect, as particularly the bond area is sensitive to the image resolution. Thus, no relation of E with sintering time was observed (Figure 7A). E is dominated by the particle geometry and structural arrangement of the sample. While in snow science E is usually related to the ice volume fraction ϕ (Mellor, 1975; Kochle and Schneebeli, 2014; Wautier et al., 2015; Srivastava et al., 2016), for the ice beads, we could additionally relate it to the contact density νc, which is shown in the colors of Figure 7B. Regarding the relation with the ice volume fraction ϕ, the results of the RG snow samples are in very good agreement with the fits of Kochle and Schneebeli (2014) and Gerling et al. (2017) who utilized the same method. Their empirical power-law [E = 2·10−8 · ρ3.98 (MPa)] fits with RMSE = 0.021 GPa our results for the RG snow samples. However, it overestimates E of the ice beads, as does the fit of Kochle and Schneebeli (2014). In both studies, the fits are restricted to a certain density range. Kochle and Schneebeli (2014) even specify two fits for two ranges, which underlines the restricted validity. As their ranges do not cover the ice volume fractions of the ice bead samples, the fits are not expected to describe the elastic moduli of the beads. Yet, lower E are presumed toward higher ϕ, as E must saturate at some point to the value of solid ice. The ranges of both, ice volume fraction and elastic moduli, are clearly separated for RG snow and ice beads, but the ranges of these parameters within the respective systems are small. The RG snow samples line up on the fit, i.e., clearly increasing E with ϕ. The ice bead samples, in contrast, are rather clustered. Partially this can be explained by looking at the contact density νc, as resolved in the magnification (Figure 7B), for which an increasing relation with E is expected (Gaume et al., 2017) and seen in the results of the poured samples. For tapped samples, the relation is rather vague, due the uncertainty intervals of all parameters and their small ranges. The higher variability of the tapped samples compared to the poured, is already observed in the relation of ϕ and νc (Figure 6) as well as in the relation of E and ts (Figure 7A). This might be due to the sensitivity of the applied tapping method to small variations, whereas the pouring of the particles is better constraint.
The compressive strengths σ were extracted from the experimental stress-strain curves which are difficult to interpret on the first sight (Figure 8). The focus in this study was on a mechanical characteristic that allows for comparison of different sintering times and sample types, rather than on the fracture mechanism itself. Such a characteristic was found in the highest peak within the first 10% of strain and referred to as compressive strength, after an alternative evaluation of the smoothed curves and the deformational energy confirmed the results. The relation of compressive strength and sintering time (Figure 9) shows the reproducibility of the experiments, despite the large scatter, which however is typical for snow. The requirements for the representative elementary volume (REV) are met for the ice beads with 32 rp and np ∈ (1, 000, 1, 200) at the lower limit, which was found in 30 rp (Wiacek and Molenda, 2016) or np ≥ 1, 000 particles (Gaume et al., 2017). In contrast, the requirements are clearly fulfilled for the RG snow samples. Yet, the experimental results have a similarly high scatter, which is considered to be the (reproducible) variability of the compressive strength. On the contrary, the scatter of the structural parameters is comparably small, within ±10%. This indicates the relevance of the exact arrangement of the particles and the formation and mechanical importance of force bearing chains in snow structures (Kry, 1975).
Taking the highest peak of the stress-strain curves as compressive strength, as a characteristic of the sample, renders the comparison of different samples and sintering times possible (Figure 9). The compressive strengths of the ice bead samples reflect the variation of both contact parameters: tapped samples with higher contact densities exceed the poured samples; and for the poured samples an increasing strength with sintering times between 1 and 5 days was observed, assigned to the change of the contact size. A quantitative relation of strength, contact density, and contact size cannot be discussed, lacking information about the evolution of the sintered contacts. The relation of compressive strength and sintering time was examined in confined compression experiments and also related to the particle size (Jellinek, 1959). A similar relation with time was found as we observed in the RG snow, but the increase of compressive strength with particle size is in contrast to our results. Reasons for this are discussed in the next paragraph.
4.3. Effect of Sintering on Compressive Strength and Sintering Anomaly of Ice Beads
In the relation of compressive strength and sintering time, large differences of RG snow and ice beads were observed. This relation has been investigated for snow in confined compression experiments (Jellinek, 1959), where an exponential fit was applied () that represented well the monotonic increase of the compressive strength with the age of snow. To the similarly progressing curve of the RG snow, however, we fitted a power-law in analogy to van Herwijnen and Miller (2013). The exponent b is related to the standard sintering theory and links the locally and globally increasing strength. The obtained exponent b = 0.3 for the RG snow compares well to their ones for comparable snow (natural and nature identical rounded grains), considering the different densities. According to the standard sintering theory, the bond-to-grain ratio develops in time following the power-law:
with the temperature dependent B that captures geometrical and material properties. Assuming vapor transport as the dominant sintering mechanism for the regarded time scales (Hobbs and Mason, 1964; Blackford, 2007; Chen and Baker, 2010), the exponents are n = 5 and m = 3 and the bond-to-grain ratio should grow in time with . Hence, the relation of compressive strength and sintering time is due to the locally growing bonds and for the RG snow in good agreement with the literature.
Compared to the RG snow, the ice beads sinter much slower and weaker. First compression tests were initially performed after 1 day, but most of the ice bead samples fragmented when the outer wall of the sample holder was removed and could not be used for compression tests. In contrast, the RG snow could be tested after only 5 min. This difference can only partially be explained by the particle size. The size dependence of the sintering rate is prescribed by Equation (1) that predicts decreasing sintering rates for increasing grain sizes, as do the simulation results of van Herwijnen and Miller (2013).
The ice bead samples evolve similarly as RG snow but only for sintering times up to 5 days, with weaker but still increasing strength. Unexpectedly, the 10 days samples were weaker than the 5 days samples, for both sample classes. This result presently lacks a sound theoretical explanation. However, the CT images and observations reported in the literature indicate that due to the porous nature of the bonds the growth is not monotonic. The results of the structural analysis and the elastic moduli—that show no variation with sintering time—do not indicate any remarkable differences in the structures of the 10 days-samples, as they are not conspicuous, e.g., in the relation between E and νc. Moreover, different temperatures or large fluctuations of the temperature during the sintering process can be excluded from the temperature measurement of the 5 and 10 days tapped sintering process. In both cases the temperature fluctuations were restricted to ±0.5°C. The sintering theory behind Equation (1) describes the growth of a solid neck between two particles in contact, as it developed for the RG snow. In additional CT images with higher resolution (6 μm), we observe porous bonds, several column-like structures form the contact between two particles (Figure 10). A very similar observation is described by Chen and Baker (2010), for polycrystalline ice spheres of a 4 mm diameter under temperature-gradient and quasi-isothermal (–10°C) conditions, and by Adams et al. (2008) for natural snow crystals (sieved with a 0.99 mm sieve). Chen and Baker (2010) reported the growth of several “protrusions” from one particle to the other, forming a porous bond. Interestingly, they report a retreat of the protrusions after growth of 6 days, but only if the protrusions could not get in contact with the opposite sphere (if the spheres were initially not in contact but separated by a small gap). The described images of the bonds were taken after 6 (maximum extension of the protrusions) and 12 days (retreated protrusions), which matches the time frame of our observation, the weakening of the compressive strength. Their observation is an optical one and no mechanical tests were performed. The retreat is reported only for initially separated particles. Our results show their mechanical relevance, i.e., weaker sintering of large ice particles and indicate that the reversal of bonding also takes place when the particles were in contact, i.e., that the porosity of an existing bond can increase in time. These results may help to explain the empirical observations of weakly sintered spring snow on ski slopes or roads, consisting of large and round grains, the weak layer potential of hail and graupel or even spherical ice particles in the food industry.
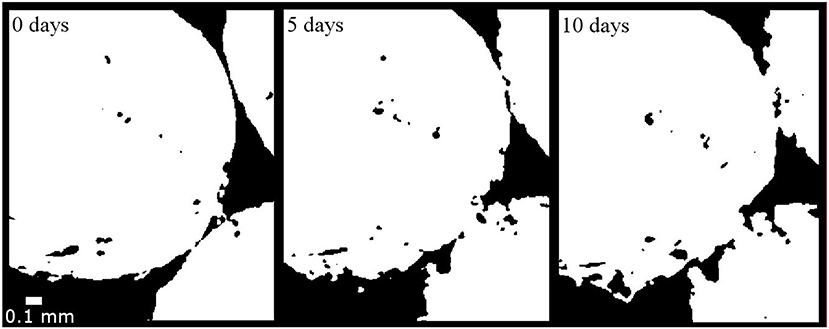
Figure 10. High resolution (6 μm) CT scans of ice beads, after 0, 5, and 10 days sintering. The 2D cross-sections of the binary images show porous bonds between the particles and their evolution.
The porously growing bonds seem to be related to the particle size, as it has only been observed in 4 mm particles so far (Chen and Baker, 2010). In other studies of sintering of ice spheres with diameters between 20 and 300 μm the growth of a solid neck was observed, as predicted by the theory (Kuroiwa, 1961; Hobbs and Mason, 1964). The size of our particles with 2–2.2 mm is in between. Though unexpected, our results fit the former observations, which indicate some effects for the sintering of large spheres that are not captured by sintering theory. The onset of these effects lies supposedly between particle sizes of 0.3 and 2 mm. Further investigation of this seems worthwhile to explore the size dependence and the mechanisms for these protrusions.
5. Conclusion
In this paper we presented a novel tumbling method for producing model snow that comprises highly spherical ice beads. We characterized the spheres and analyzed the structures and mechanics of sintered sphere assemblies. This showed that the investigated ice beads are well suited for snow model comparison, due to their clearly defined size, high sphericity and the well-working structural analysis by means of CT-imaging. The tumbling method presented here enables the production of uniform ice beads in different size ranges. Smaller and larger spherical ice particles than the ones presented here can be generated as well. The microstructures of the samples were characterized and related to the mechanical properties, by examining CT images of the samples that were used in the compression experiments. Microstructural variation was generated by densification of some samples and by variation of the sintering time. The sintered bonds of the ice beads developed with a complex geometry, contrasting the predictions from the standard sintering theory. This was observed by optical inspection of the CT images, as well as in the evolution of compressive strength with sintering time. In the compression tests, the ice bead samples exhibited after 10 days sintering lower strength than after 5, in contrast to the monotonic increase of the reference snow and the expectation from theory. The sintering artifacts, revealed in the CT images, impede the quantification of the contact size. Although unexpected in our experiments, similar observations are documented in the literature and indicate that the artifacts could be circumvent by utilizing smaller particles to allow for a complete quantification of the contact parameters (number and size of bonds). Despite these complications, the ice beads qualified also in the mechanical tests for model snow: until 5 days the ice beads developed a similar relation of strength and sintering time as the reference snow and the sintering-independent results of the elastic moduli, conform very well with the expectations from literature. Overall we believe that model snow comprising spheres with low variability in size and shape may be well exploited for applications such as DEM to address open questions regarding the calibration of contact parameters and the mapping of snow microstructure onto simplified geometries.
Data Availability
The datasets for this study can be found at https://doi.org/10.16904/envidat.83.
Author Contributions
This work was led by CW. The laboratory experiments, including CT scans, were conducted by CW and SS. FEM simulations were done by HL. Construction and testing of the tumbling machine for ice bead production, 3D CT image analysis and the writing of the manuscript was done by CW. The data was analyzed and interpreted by all authors.
Funding
This work has been funded by the Swiss National Science Foundation (Project SnowDEM).
Conflict of Interest Statement
The authors declare that the research was conducted in the absence of any commercial or financial relationships that could be construed as a potential conflict of interest.
Acknowledgments
The authors would like to acknowledge Matthias Jaggi for laboratory support on the compression experiments and on the crystal analysis of the ice beads.
Supplementary Material
The Supplementary Material for this article can be found online at: https://www.frontiersin.org/articles/10.3389/feart.2019.00229/full#supplementary-material
Video S1. Unconfined compression experiment of an ice bead poured sample after 10 days sintering.
References
Adams, E., M. Jepsen, S., and Close, B. (2008). A bonding process between grains in mechanically disaggregated snow. Ann. Glaciol. 48, 6–12. doi: 10.3189/172756408784700770
Blackford, J. R. (2007). Sintering and microstructure of ice: a review. J. Phys. D Appl. Phys. 40, R355–R385. doi: 10.1088/0022-3727/40/21/R02
Chandel, C., Srivastava, P. K., and Mahajan, P. (2014). Micromechanical analysis of deformation of snow using x-ray tomography. Cold Reg. Sci. Tech. 101, 14–23. doi: 10.1016/j.coldregions.2014.01.005
Chen, S., and Baker, I. (2010). Structural evolution during ice-sphere sintering. Hydrol. Process. 24, 2034–2040. doi: 10.1002/hyp.7787
Chen, S., Baker, I., and Frost, H. (2013). Surface instability and mass transfer during the bonding of ice spheres. Philos. Magaz. 93, 3177–3193. doi: 10.1080/14786435.2013.805274
Fierz, C., Armstrong, R. L., Durand, Y., Etchevers, P., Greene, E., Mcclung, D., et al. (2009). “The international classification for seasonal snow on the ground,” in IHP-VI Technical Documents in Hydrology (UNESCO/IHP).
Garboczi, E. (1998). “Finite element and finite diierence programs for com- puting the linear electric and elastic properties of dig- ital images of random materials.” Report NISTIR.
Gaume, J., Löwe, H., Tan, S., and Tsang, L. (2017). Scaling laws for the mechanics of loose and cohesive granular materials based on baxter's sticky hard spheres. Phys. Rev. E 96:032914. doi: 10.1103/PhysRevE.96.032914
Gaume, J., van Herwijnen, A., Chambon, G., Birkeland, K. W., and Schweizer, J. (2015). Modeling of crack propagation in weak snowpack layers using the discrete element method. Cryosphere 9, 1915–1932. doi: 10.5194/tc-9-1915-2015
Gerling, B., Löwe, H., and van Herwijnen, A. (2017). Measuring the elastic modulus of snow. Geophys. Res. Lett. 44, 11,088–11,096. doi: 10.1002/2017GL075110
Hagenmuller, P., Chambon, G., Lesaffre, B., Flin, F., and Naaim, M. (2013). Energy-based binary segmentation of snow microtomographic images. J. Glaciol. 59, 859–873. doi: 10.3189/2013JoG13J035
Hagenmuller, P., Chambon, G., and Naaim, M. (2015). Microstructure-based modeling of snow mechanics: a discrete element approach. Cryosphere 9, 1969–1982. doi: 10.5194/tc-9-1969-2015
Hagenmuller, P., Matzl, M., Chambon, G., and Schneebeli, M. (2016). Sensitivity of snow density and specific surface area measured by microtomography to different image processing algorithms. Cryosphere 10, 1039–1054. doi: 10.5194/tc-10-1039-2016
Hagenmuller, P., Theile, T. C., and Schneebeli, M. (2014). Numerical simulation of microstructural damage and tensile strength of snow. Geophys. Res. Lett. 41, 86–89. doi: 10.1002/2013GL058078
Hildebrand, T., Laib, A., Müller, R., Dequeker, J., and Rüegsegger, P. (1999). Direct three-dimensional morphometric analysis of human cancellous bone: Microstructural data from spine, femur, iliac crest, and calcaneus. J. Bone Min. Res. 14, 1167–1174.
Hobbs, P. V., and Mason, B. J. (1964). The sintering and adhesion of ice. Philos. Magaz. 9, 181–197.
Johnson, J. B., and Hopkins, M. A. (2005). Identifying microstructural deformation mechanisms in snow using discrete-element modeling. J. Glaciol. 51, 432–442. doi: 10.3189/172756505781829188
Kabore, B. W., and Peters, B. (2018). Micromechanical model for sintering and damage in viscoelastic porous ice and snow. Part I: theory. arXiv: 1808.04394.
Kaempfer, T. U., Hopkins, M. A., and Perovich, D. K. (2007). A three-dimensional microstructure-based photon-tracking model of radiative transfer in snow. J. Geophys. Res. Atmos. 112, 1–14. doi: 10.1029/2006JD008239
Kingery, D. W. (1960). Regelation, surface diffusion, and ice sintering. J. Appl. Phys. 31, 833–838.
Kochle, B., and Schneebeli, M. (2014). Three-dimensional microstructure and numerical calculation of elastic properties of alpine snow with a focus on weak layers. J. Glaciol. 60, 705–713. doi: 10.3189/2014JoG13J220
Kry, P. R. (1975). The relationship between the visco-elastic and structural properties of fine-grained snow. J. Glaciol. 14, 479-500.
Mede, T., Chambon, G., Hagenmuller, P., and Nicot, F. (2018). A medial axis based method for irregular grain shape representation in dem simulations. Granular Matter 20. doi: 10.1007/s10035-017-0785-7
Michael, M., Nicot, F., and Peters, B. (2015). Advanced micromechanical description of snow behaviour — PART I — mechanical and numerical modelling. Int. J. Sol. Struct.
Molaro, J. L., Choukroun, M., Phillips, C. B., Phelps, E. S., Hodyss, R., Mitchell, K. L., et al. (2019). The microstructural evolution of water ice in the solar system through sintering. J. Geophys. Res. Plan. 124, 243–277. doi: 10.1029/2018JE005773
Mulak, D., and Gaume, J. (2019). Numerical investigation of the mixed-mode failure of snow. Comput. Mech. 6, 439–447. doi: 10.1007/s40571-019-00224-5
Riche, F., Schneebeli, M., and Tschanz, S. (2012). Design-based stereology to quantify structural properties of artificial and natural snow using thin sections. Cold Reg. Sci. Technl. 79–80, 67–74. doi: 10.1016/j.coldregions.2012.03.008
Schleef, S., Jaggi, M., Löwe, H., and Schneebeli, M. (2014). Instruments and methods: An improved machine to produce nature-identical snow in the laboratory. J. Glaciol. 60, 94–102. doi: 10.3189/2014JoG13J118
Schneebeli, M. (2004). Numerical simulation of elastic stress in the microstructure of snow. Ann. Glaciol. 38, 339–342. doi: 10.3189/172756404781815284
Shapiro, H. L., Johnson, J., Sturm, M., and Blaisdell, G. (1997). Snow Mechanics: Review of the State of Knowledge and Applications, 40.
Spettl, A., Bachstein, S., Dosta, M., Goslinska, M., Heinrich, S., and Schmidt, V. (2016). Bonded-particle extraction and stochastic modeling of internal agglomerate structures. Adv. Powder Technl. 27, 1761–1774. doi: 10.1016/j.apt.2016.06.007
Srivastava, P. K., Chandel, C., Mahajan, P., and Pankaj, P. (2016). Prediction of anisotropic elastic properties of snow from its microstructure. Cold Reg. Sci. Technl. 125, 85–100. doi: 10.1016/j.coldregions.2016.02.002
Theile, T., and Schneebeli, M. (2011). Algorithm to decompose three-dimensional complex structures at the necks: tested on snow structures. Image Process. IET 5, 132–140. doi: 10.1049/iet-ipr.2009.0410
Theile, T., Szabo, D., Luthi, A., Rhyner, H., and Schneebeli, M. (2009). Mechanics of the ski–snow contact. Tribol. Lett. 36, 223–231. doi: 10.1007/s11249-009-9476-9
van Herwijnen, A., and Miller, D. A. (2013). Experimental and numerical investigation of the sintering rate of snow. J. Glaciol. 59, 269-274. doi: 10.3189/2013JoG12J094
Wadell, H. (1935). Volume, shape, and roundness of quartz particles. J. Geol. 43, 250–280. doi: 10.1086/624298
Wang, X., and Baker, I. (2013). Observation of the microstructural evolution of snow under uniaxial compression using x-ray computed microtomography. J. Geophys. Res. Atmos. 118, 12,371–12,382. doi: 10.1002/2013JD020352
Wautier, A., Geindreau, C., and Flin, F. (2015). Linking snow microstructure to its macroscopic elastic stiffness tensor: a numerical homogenization method and its application to 3-d images from x-ray tomography. Geophys. Res. Lett. 42, 8031–8041. doi: 10.1002/2015GL065227
Keywords: snow mechanics, microstructure, sintering, ice spheres, CT image analysis, compression experiments, discrete element modeling
Citation: Willibald C, Scheuber S, Löwe H, Dual J and Schneebeli M (2019) Ice Spheres as Model Snow: Tumbling, Sintering, and Mechanical Tests. Front. Earth Sci. 7:229. doi: 10.3389/feart.2019.00229
Received: 29 March 2019; Accepted: 20 August 2019;
Published: 06 September 2019.
Edited by:
Guillaume Chambon, National Research Institute of Science and Technology for Environment and Agriculture (IRSTEA), FranceReviewed by:
Ian Baker, Dartmouth College, United StatesSandra Piazolo, University of Leeds, United Kingdom
Antoine Wautier, National Research Institute of Science and Technology for Environment and Agriculture (IRSTEA), France
Copyright © 2019 Willibald, Scheuber, Löwe, Dual and Schneebeli. This is an open-access article distributed under the terms of the Creative Commons Attribution License (CC BY). The use, distribution or reproduction in other forums is permitted, provided the original author(s) and the copyright owner(s) are credited and that the original publication in this journal is cited, in accordance with accepted academic practice. No use, distribution or reproduction is permitted which does not comply with these terms.
*Correspondence: Carolin Willibald, Y2Fyb2xpbi53aWxsaWJhbGRAc2xmLmNo