 Daniele Trippanera
 Joël Ruch
 Luca Passone1
 Sigurjón Jónsson
- 1Physical Science and Engineering Division, King Abdullah University of Science and Technology, Thuwal, Saudi Arabia
- 2Department of Earth Sciences, University of Geneva, Geneva, Switzerland
Dike intrusions produce faulting at the surface along with seismic swarms and possible eruptions. Understanding the geometry and kinematics of dike-induced fractures can provide relevant information on what controls magma emplacement and the associated hazards. Here, we focus on the Harrat Lunayyir volcanic field (western Saudi Arabia), where in 2009 a dike intrusion formed a NNW-SSE oriented, ten-kilometer-long and up to one-meter deep graben. This widens from ∼2 km in the SSE to ∼5 km in the NNW, showing a well-defined border normal fault to the west but a diffused fracture zone to the east. We conducted a fixed-wing drone survey to create high resolution (∼3.4 cm) ortho-rectified images and DEMs of the western fault and of a portion of the eastern fracture zone to determine the fracture geometry and kinematics. We then integrated these results with field observations and InSAR data from the 2009 intrusion. Both fault zones contain smaller segments (hundreds of meters long) consisting of normal faults and extension fractures, showing two dominant orientation patterns: NNW-SSE (N330° ± 10°) and NW-SE (N300° ± 10°). The NNW-ESE oriented segments are sub-parallel to the inferred 2009 dike strike (N340°), to pre-historical Harrat Lunayyir eruptive fissures (N330°) and to the overall Red Sea axis (N330°). This suggests that these segments reflect the present-day off-rift stress field close to the Red Sea shoulder. However, the NW-SE oriented segments are oblique to this pattern and exhibit en–echelon structures, suggesting different processes such as: (1) a transfer (or soft-linkage) between dike-parallel fault segments, (2) a topographic control on the fault propagation and (3) a possible reactivation of inherited regional faults. Vertical fault offsets obtained by the drone survey along the western fault vary with the local lithology and these data are not consistent everywhere with the offsets derived from the 2009 InSAR measurements. Field evidence within lava flows also shows the occurrence of previous slipping event(s) on the fault before the 2009 intrusion. Collectively, we suggest that the mismatch between the drone and InSAR datasets is related to the different spatial and temporal resolutions offered by the two techniques.
Introduction
Magmatic divergent plate boundaries are affected episodically by dike intrusions. These intrusions are usually parallel to the plate boundary and orthogonal to the main regional minimum compressive stress (σ3) occurring both inside or outside (off-axis) of the rift axis. By using geophysical data such as seismicity, GPS and InSAR, several dike intrusions have been directly observed in the last decades in different regions on both oceanic and continental crusts, e.g., in Krafla (1975–1984) and Bárðarbunga (2014–2015) in Iceland (e.g., Tryggvason, 1984; Rubin, 1992; Buck et al., 2006; Gudmundsson et al., 2014; Sigmundsson et al., 2015; Hjartardóttir et al., 2016; Ruch et al., 2016), Asal Ghoubbet (1978), Dallol (2004) and Dabbahu (2005) in Afar (e.g., Wright et al., 2006; Ebinger et al., 2008, 2010; Grandin et al., 2009, 2010; Hamling et al., 2009; Keir et al., 2009; Nobile et al., 2012), Lake Natron (2007) in the East African Rift System of Northern Tanzania (e.g., Calais et al., 2008; Biggs et al., 2009), Jebel at Tair Island and Zubair Archipelago (2011–2013) in the Red Sea (Jónsson and Xu, 2015; Xu et al., 2015; Eyles et al., 2018), and Harrat Lunayyir (2009) in western Saudi Arabia (e.g., Baer and Hamiel, 2010; Pallister et al., 2010; Jónsson, 2012; Xu et al., 2016). Some of these dike intrusions breached the surface, resulting in fissure eruptions, such as at Krafla and Bárðarbunga in Iceland, whereas others arrested at a few hundred meters from the surface without emitting magma, such as at Lake Natron in Tanzania and Harrat Lunayyir in Saudi Arabia. However, in all the mentioned cases, the dike intrusions resulted in diffuse fracture movements at the surface with formation and/or reactivation of normal faults that formed grabens above the upper dike tip (e.g., Biggs et al., 2009; Jónsson, 2012; Trippanera et al., 2015a,b; Acocella and Trippanera, 2016; Hjartardóttir et al., 2016; Xu et al., 2016). Such regional extension combined with multiple dike intrusions along divergent boundaries contributes to the formation of well-developed rift structures, where the plate extension focuses and most of the volcanic and seismic activity occurs (e.g., Gudmundsson, 2000; Buck, 2006; Calais et al., 2008; Corti, 2009; Ebinger et al., 2010, 2013; Wright et al., 2012; Acocella, 2014; Urbani et al., 2015; Acocella and Trippanera, 2016). Therefore, understanding the structure and kinematics of rifts, and directly observing rifting events and episodes are of great importance for both volcanic and seismic hazard assessments and for determining how and where magma is propagating.
The surface and the roots of continental and oceanic rift systems have been extensively studied by means of fieldwork and satellite image mapping, revealing a common structure and fault geometry (e.g., Walker, 1958, 1974; Gudmundsson, 1987a,b, 1995; Gudmundsson and Backstrom, 1991; Forslund and Gudmundsson, 1992; Tentler, 2005; Tentler and Mazzoli, 2005; Paquet et al., 2007; Tentler and Temperley, 2007; Corti, 2009; Eriksson et al., 2014; Trippanera et al., 2015a; Urbani et al., 2015). However, in such places, fieldwork is usually limited to local observations along a small section of the rifts, which are often tens of kilometers in length. Satellite optical imagery can be used to obtain a continuous overview of an entire fault or graben, but satellite images only have ground resolution of around 0.5 m at best (e.g., Hjartardóttir et al., 2009, 2016; Dumont et al., 2017). This method can be useful to understand the overall geometry and patterns of the major structures, but higher resolution images are needed to improve characterization of the kinematics of faults and map minor fractures.
The InSAR technique has also been used to map surface displacements induced by dike intrusions over a large area (hundreds of km2) with a temporal resolution of days to months. However, large displacement gradients can lead to phase decorrelation and thus strong near-field deformation often remains poorly resolved (e.g., Pallister et al., 2010; Figure 1). This problem can sometimes be solved by pixel offset-tracking, which can be used to map large near-field displacements and retrieve the overall fault displacement field, e.g., as occurred in the Bárðarbunga rifting event in 2014–2015 (Ruch et al., 2016). However, a resolution gap still exists between satellite data and field observations, which we here propose to fill by using drone observations.
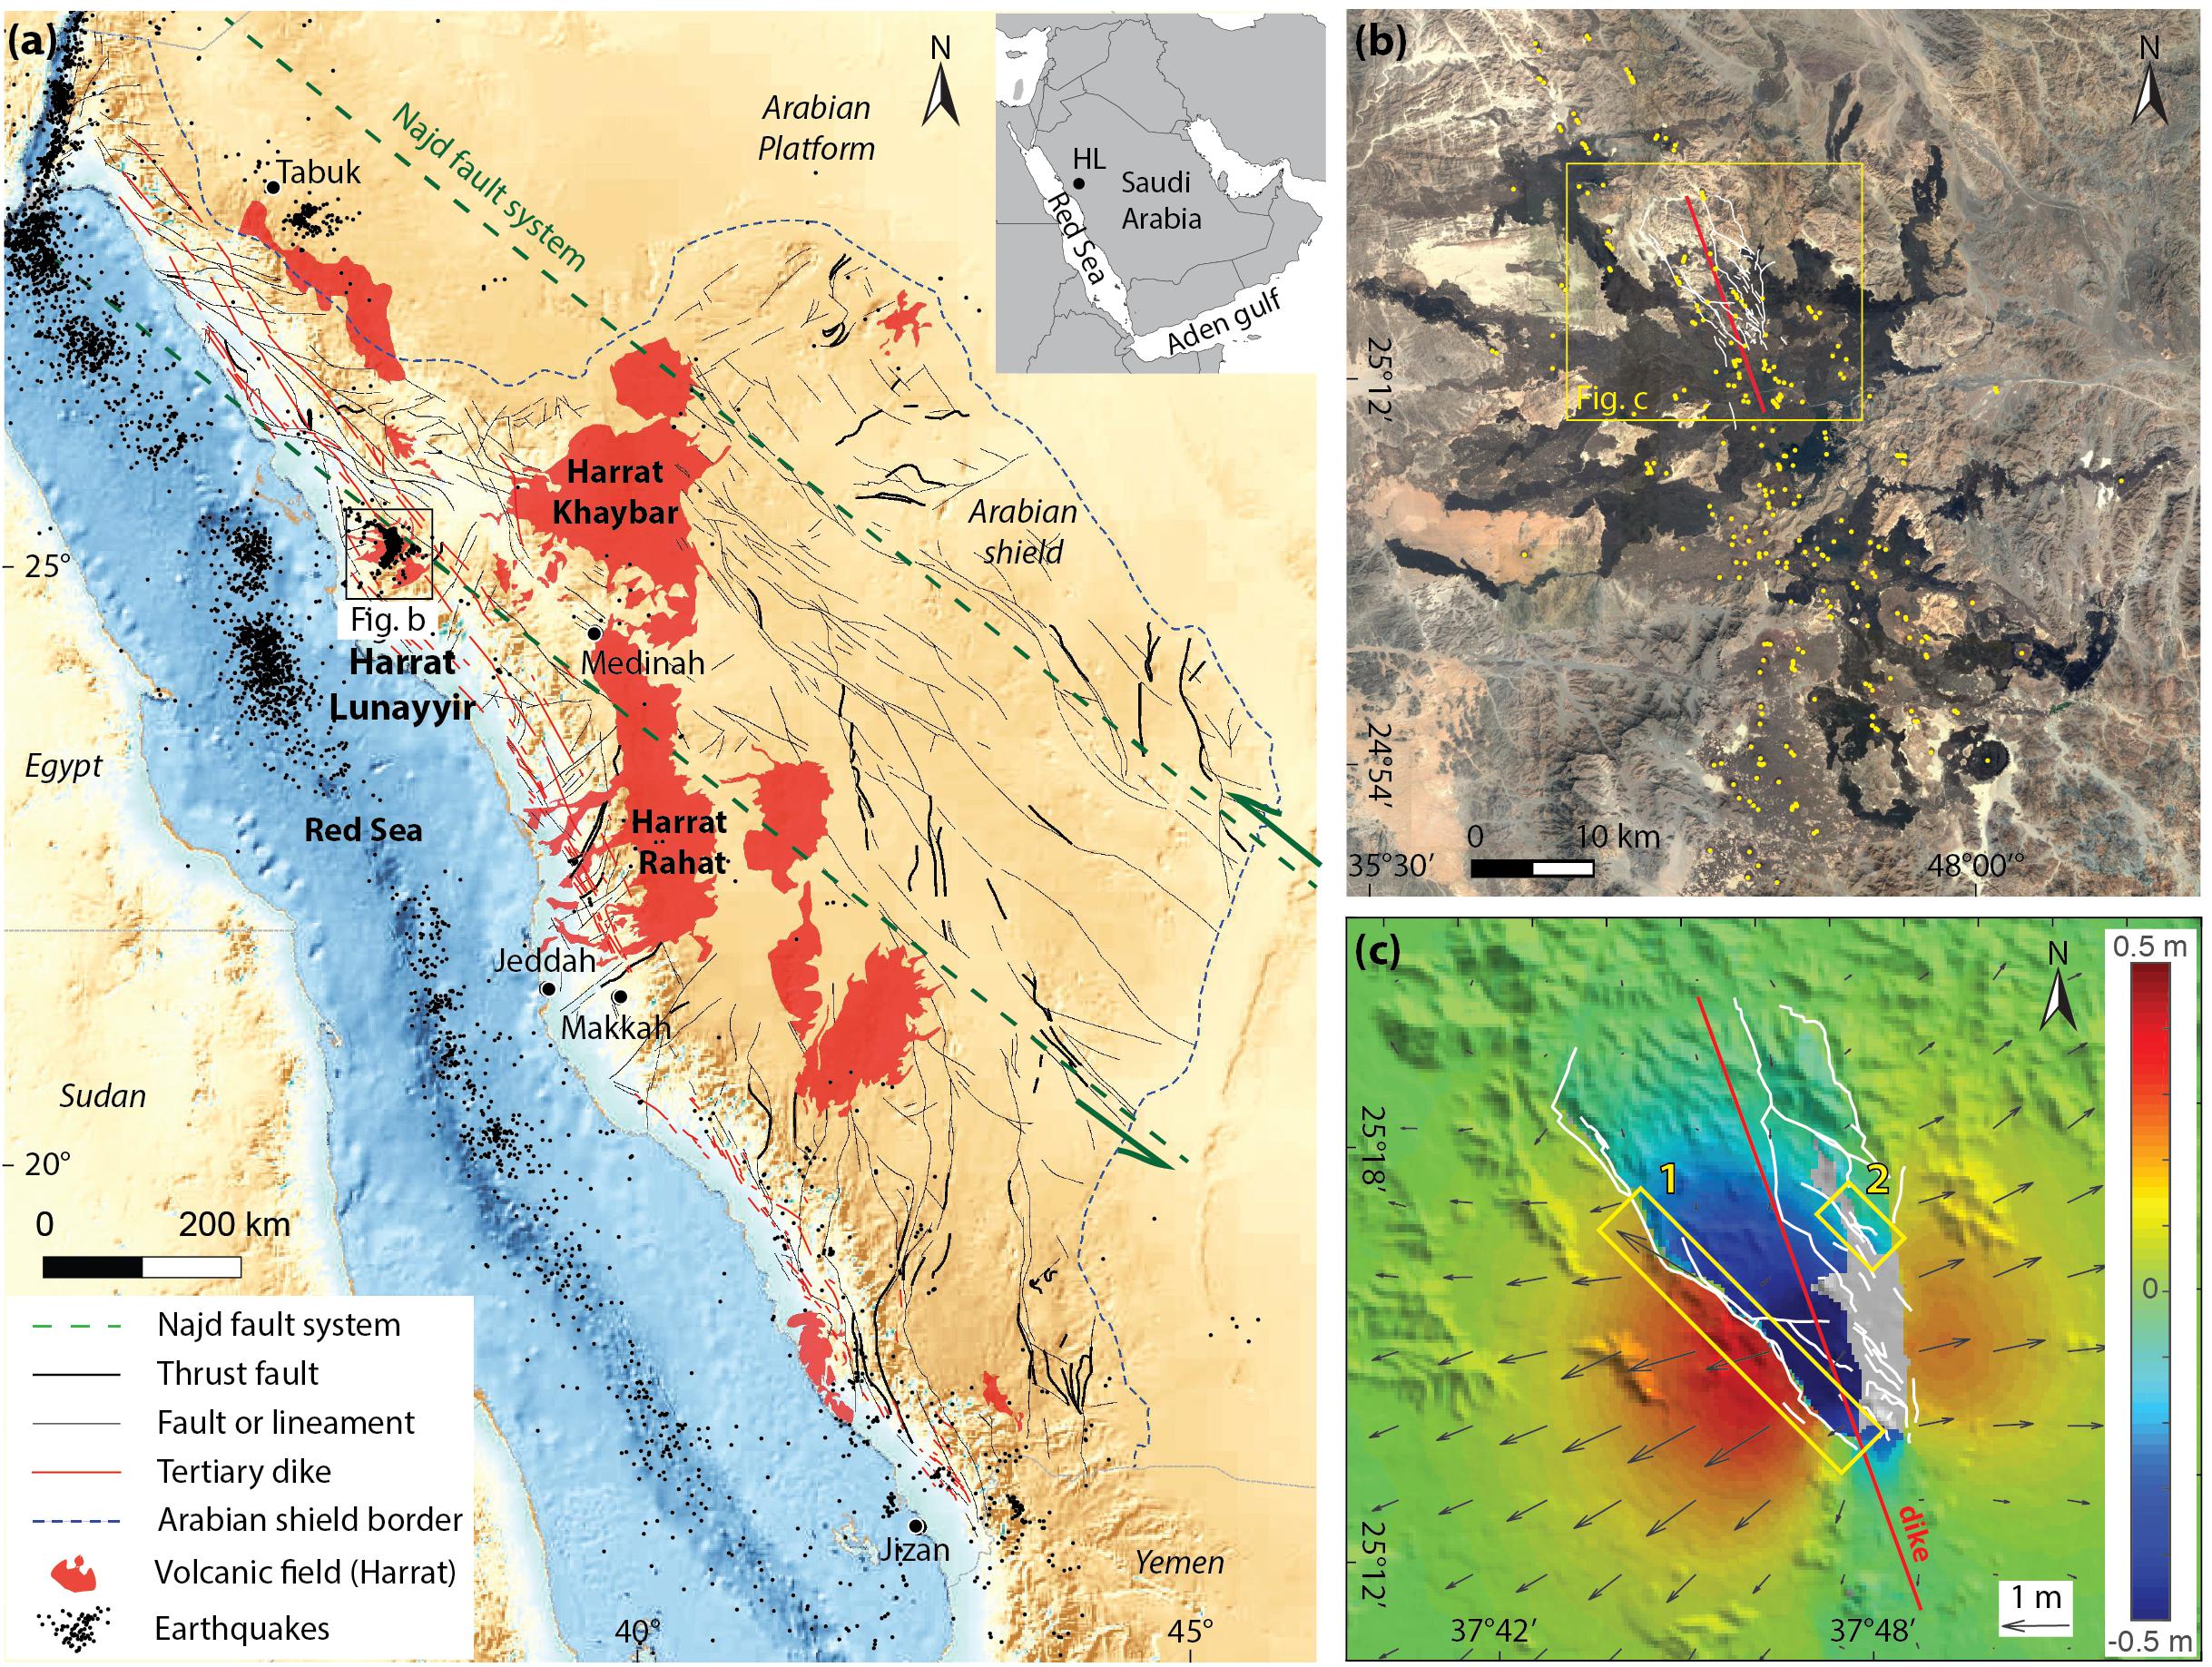
Figure 1. Geological setting of Harrat Lunayyir and the 2009 dike intrusion. (a) Map of western Saudi Arabia and the Red Sea showing earthquakes (M > 2) 2007–2016 (small black dots), faults and lineaments (black and red lines) in the Arabian shield (Beziat and Bache, 1985) and the outlines (green dashed lines) of the left-lateral Najd fault zone (Stern, 1985). The inset shows the location of the Harrat Lunayyir volcanic field (HL) within Saudi Arabia. (b) Satellite image of Harrat Lunayyir showing volcanic cones (yellow dots), the inferred 2009 dike trace (red line; Pallister et al., 2010) and mapped surface fractures (white lines; Jónsson, 2012). Dark colors on the satellite image are quaternary lava flows. (c) 3D surface displacements induced by the 2009 dike intrusion as estimated from InSAR data (Jónsson, 2012) with arrows showing horizontal displacements and background colors vertical displacements. Yellow rectangles indicate the drone survey areas along the western fault (1) and the eastern fracture zone (2).
Recently, the use of drones and photogrammetry has greatly enhanced the possibility of surveying larger areas than those typically covered by field observations, with higher resolution (few centimeters of ground sampling distance) than can be achieved by satellite images (James and Robson, 2012; James and Varley, 2012; Sze et al., 2015; Rocca, 2016; Di Felice et al., 2018; Walter et al., 2018; Bonali et al., 2019). In this work, we used a fixed-wing drone for structural mapping; we flew the drone over dike-induced brittle fractures in the Harrat Lunayyir volcanic area in western Saudi Arabia. Several studies have been carried out in this area, mainly based on ground deformation and seismicity (e.g., Al-Zahrani et al., 2012; Hansen et al., 2013, Zahran et al., 2017), InSAR (Baer and Hamiel, 2010; Pallister et al., 2010; Jónsson, 2012), aeromagnetic data and gravimetry (Zahran et al., 2017; Aboud et al., 2018) and on fieldwork data (Pallister et al., 2010; Al Shehri and Gudmundsson, 2018). However, these fieldwork studies covered only a portion of the main faults, and InSAR did not have the resolution to map minor structures and to precisely characterize the vertical displacement distribution along the major faults. Therefore, by using drones we obtain higher resolution digital elevation models along selected faulted areas, thus filling the gap between fieldwork and satellite datasets. We then compare and test observed differences between the InSAR and our drone data.
Geological Setting
The western portion of the Arabian Plate is formed by Upper Proterozoic metavolcanics and plutons of granitic composition constituting the Arabian Shield (Stern and Johnson, 2010). The Arabian Shield is affected by several regional fault systems (with poorly known kinematics), inherited by the long geologic history of the Arabian Plate. The NW-SE oriented Najd fault system is an example (Figure 1a). The Najd fault is a 400 km wide and 1200 km long left-lateral shear zone that can probably be found in northern Egypt also (Sultan et al., 1988; Stern et al., 1990; Stern and Johnson, 2019). The development of this fault system has been assigned to 540–620 Ma, after the collision that built up the Nubian-Arabian shield 620–640 Ma ago (Moore, 1979; Stern, 1985; Agar, 1987; Al-Husseini, 2000; Johnson and Woldehaimanot, 2003; Stern and Johnson, 2010, 2019; Bosworth and Stockli, 2016). The activity of the Najd fault system, which consists of three main parallel shear zones (Al-Husseini, 2000), led to the formation of several secondary faults with different kinematics (from normal to thrust) and, in the past, this system has been a preferential path for magma intrusions (Moore, 1979). Nowadays, the Najd system does not appear to be active as seismicity is mostly focused far away along the borders of the Arabian plate. In particular, seismicity in the west mainly occurs along the Red Sea rift axis and on the Dead Sea Transform fault system (Figure 1a).
Several volcanic fields (called Harrats) are located on top of the Shield and were formed by activity of monogenic cones. The distance of the Harrats from the Red Sea ranges from only a few kilometers to ∼400 km (Figure 1a). A pre-rifting (∼31 Ma) and a syn-rifting (starting from ∼23–24 Ma) stage have been identified for the magmatism of the Harrats that are still considered active (Bohannon, 1986; Bosworth et al., 2005; Bosworth and Stockli, 2016; Stern and Johnson, 2019; Stockli and Bosworth, 2019). Moreover, during the late Oligocene and early Miocene a 1800 km-long swarm of several mafic dikes intruded parallel to the Red Sea, from Sinai in the north to the city of Jizan in the South (Figure 1a; Bohannon, 1986; Brown et al., 1989, Bosworth et al., 2005; Bosworth and Stockli, 2016; Zanoni et al., 2019).
The origin of the intraplate Arabian volcanism is attributed to a mantle plume propagating northward from the Afar triple junction (Camp and Roobol, 1992; Chang et al., 2011). The most prominent volcanic fields are the large NNW-SSE oriented Harrat Rahat and Harrat Khaybar (Figure 1a). Indeed, the last known eruption in Saudi Arabia occurred in 1256 A.D. close to the city of Medina, at the northern edge of Harrat Rahat (Downs et al., 2018).
The Harrat Lunayyir volcanic area is smaller than Harrat Rahat and Harrat Khaybar (Camp et al., 1991; Németh and Moufti, 2017; Downs et al., 2018), and is located closer to the Red Sea coastline (Figures 1a,b). The area is mainly formed of Tertiary and Quaternary basalts (Al-Amri et al., 2012; Sanfilippo et al., 2018; Vigliotti et al., 2018). The quaternary historic to pre-historic units contain lava flows, scoria cones and ash fall deposits from four eruption sites, the latest of which probably erupted ∼1000 years ago (Al-Amri et al., 2012). Less recent Quaternary basalts consist of scoria cones and lava flows and sedimentary units (e.g., wadi gravels, aeolian sands, pond silts, etc.) are found deposited on top of the volcanic products (Al-Amri et al., 2012).
Although the most recent eruption of Harrat Lunayyir is poorly understood, the northern Harrat Lunayyir area was recently affected by an intense magmatic and seismic activity in 2007 and 2009 (Pallister et al., 2010; Hansen et al., 2013; Zahran and El-Hady, 2017). The most important activity occurred in 2009, when a swarm of ∼30.000 earthquakes occurred between April and May. This activity peaked on May 19th when a Mw = 5.7 earthquake struck, as well as several Mw ≥ 4.0 earthquakes (Pallister et al., 2010). A diffuse surface fracturation associated with the seismic swarm was observed both by InSAR and in the field (Figure 1c; Baer and Hamiel, 2010; Pallister et al., 2010; Jónsson, 2012). A > 10 km long graben with NNW-SSE orientation formed, with an increasing width from south (2 km) to north (5 km). The western border fault of the graben is continuous for more than 10 km and probably continues further south-east in the sub-surface (Aboud et al., 2018). On the contrary, the eastern section of the graben is less well defined (Figure 1c). Spotted field observations on cemented alluvium highlighted that the western border normal fault slipped as much as 0.98 m, resulting from 0.78 m of vertical displacement and 0.45 m of extension (Pallister et al., 2010). Within the graben, several minor fractures and normal faults formed (Baer and Hamiel, 2010; Jónsson, 2012), creating an opening across the graben estimated at 1.5 m and a total subsidence of 0.8 m in the graben center (Baer and Hamiel, 2010; Pallister et al., 2010). Inversion of InSAR data, showing uplift to the sides and subsidence within the graben, suggested an intrusion of a 10 km long dike with N340° orientation (Figure 1c), a maximum opening of 4 m at 4–6 km depth and with its top edge 1–2 km below the surface (Pallister et al., 2010). However, a shallower and thicker dike has also been suggested with its top only a few hundred meters below the surface and with a thickness of 6–12 m (Al Shehri and Gudmundsson, 2018). Despite suggestions that the dike opening reflects a low rock-mass strength (tensile strength of 1–3 MPa) in the Harrat Lunayyir area (Jónsson, 2012), it has also been proposed that additional extensional regional loading would have been needed to induce such a large and diffuse surface fracturation (Al Shehri and Gudmundsson, 2018).
In agreement with field evidence, most of the focal mechanisms related to the 2009 earthquake swarm indicate normal faulting. Only a few and isolated strike-slip events have been observed (Baer and Hamiel, 2010; Pallister et al., 2010; Al-Zahrani et al., 2012). Analog models suggest that this particular graben geometry can result from a dike intrusion with an asymmetric along strike profile resulting in different dike depths (Xu et al., 2016; Corbi et al., 2019). These models also suggest a possible change in normal fault kinematics in the south where the dike is shallower, to trans-tensional in the north where the dike is deeper and the graben is wider (Xu et al., 2016).
One of the main questions concerning the 2009 dike intrusion addresses the reason why the dike didn’t reach the surface and cause an eruption. Several processes might have prevented further upward dike propagation, e.g., dike depressurization along with compression near its top induced by the graben normal faulting (Xu et al., 2016), reduction in dike overpressure due to magma degassing, a too low regional spreading rate (<1 cm/yr), magma drainage from the pre-existing fracture network (see e.g., Bonforte et al., 2019), a stress barrier due to a stiff basaltic layer (Abdelfattah et al., 2017), or other crustal heterogeneities above the propagating dike (Al Shehri and Gudmundsson, 2018).
A seismic tomography model of Harrat Lunayyir suggests the presence of repeated magmatic intrusions located a few kilometers south of the 2009 intrusion site at a depth of ∼15 km and becoming shallower toward N and NNE (Hansen et al., 2013). This link between deeper volcano-tectonic features to the south (faults or magma) becoming gradually shallower to the north has also been highlighted by the distribution of relocated earthquakes that occurred during the 2009 event (Hansen et al., 2013). After the 2009 seismic swarm, seismicity at Harrat Lunayyir reached another peak in 2014. The 2014 earthquakes were mostly located in the upper lithospheric mantle (depths 42–48 km), 30 km southeast of the 2009 dike intrusion and aligned along a N283° direction (Blanchette et al., 2018). Recently (2017–2018), two new seismic swarms of a few hundred earthquakes of Ml ≤ 3.8 took place ∼40 km to the northwest and to the west of Harrat Lunayyir without any detectable surface deformation (Nobile et al., 2019).
Aeromagnetic maps covering the whole Harrat Lunayyir area suggest the presence of shallow and deep faults that have NE-SW and NW-SE orientations. The NE-SW oriented faults may be related to transform systems from the Red Sea spreading center, whereas the NW-SE oriented faults, which are among the predominant directions in the shield area, could be associated with the Najd fault system (Figure 1a). The intersection of the two systems might have led to magma upwelling, possibly defining the Harrat Lunayyir location (Al-Zahrani et al., 2012).
Materials and Methods
We combined high resolution drone mapping, field observations and optical satellite imagery to produce a detailed structural analysis of the main western graben fault and of a portion of the eastern fracture zone formed during the 2009 dike intrusion in the northern Harrat Lunayyir volcanic area (Figure 1c). In April 2017, we collected the drone data using a fixed wing UAV fitted with a RangeVideo RVJet airframe modified by the FalconViz company1. The main advantages of using a fixed wing drone are longer flight times (up to 75 min in a single flight) and higher speeds (up to 55 km/h) compared to quad- or hexa-copters. This allowed to cover a 10 km long and 0.6 km wide swath (5.9 km2) along the western fault and a 3 km2 area on the eastern fracture zone in only 2 days, with an average ground sampling distance (GSD) of 3.4 cm (see additional material for further details). Due to topographical variations along the western fault, we used a custom software to adapt the flight height above the surface in order to maintain a flying altitude between 70 and 90 m above the ground. We scanned the areas with parallel transects acquiring a total of ∼7000 images with 70% of front and 60% of side overlap.
We used the Pix4d® software2 to construct full 3D (Digital Elevation Models, DEM) and 2D surface images (ortho-photos) of the surveyed areas. To minimize the image distortion and optimize their ortho-rectification, we used a kinematic GPS to place and measure 13 and 6 ground control points (GCPs) along the western fault and the eastern fracture zone, respectively. For example, for the western fault the GCPs revealed an overall geolocation error bias of 0.35, 0.83, and 57.56 meters in x, y, and z, respectively (Supplementary Material). After post-processing, we finally obtained an RMS error of 0.018, 0.016, and 0.088 meters in x, y, and z, respectively.
We used the obtained DEM and the ortho-photos to map fractures (Figure 2) and perform classical morphologic and structural analysis by calculating, e.g., slope, roughness or aspect maps, swath topographic profiles, etc., to unravel the deformation patterns and the fault geometry (e.g., Wilson et al., 2007 and references therein for example). We further extracted a few fault kinematic indicators looking at asperity fits between two sections of open fractures, both in the drone maps and in the field (Figure 2). However, this analysis was successful only at a few locations along the fracture network, since erosion of poorly consolidated material had erased most of the potential indicators.
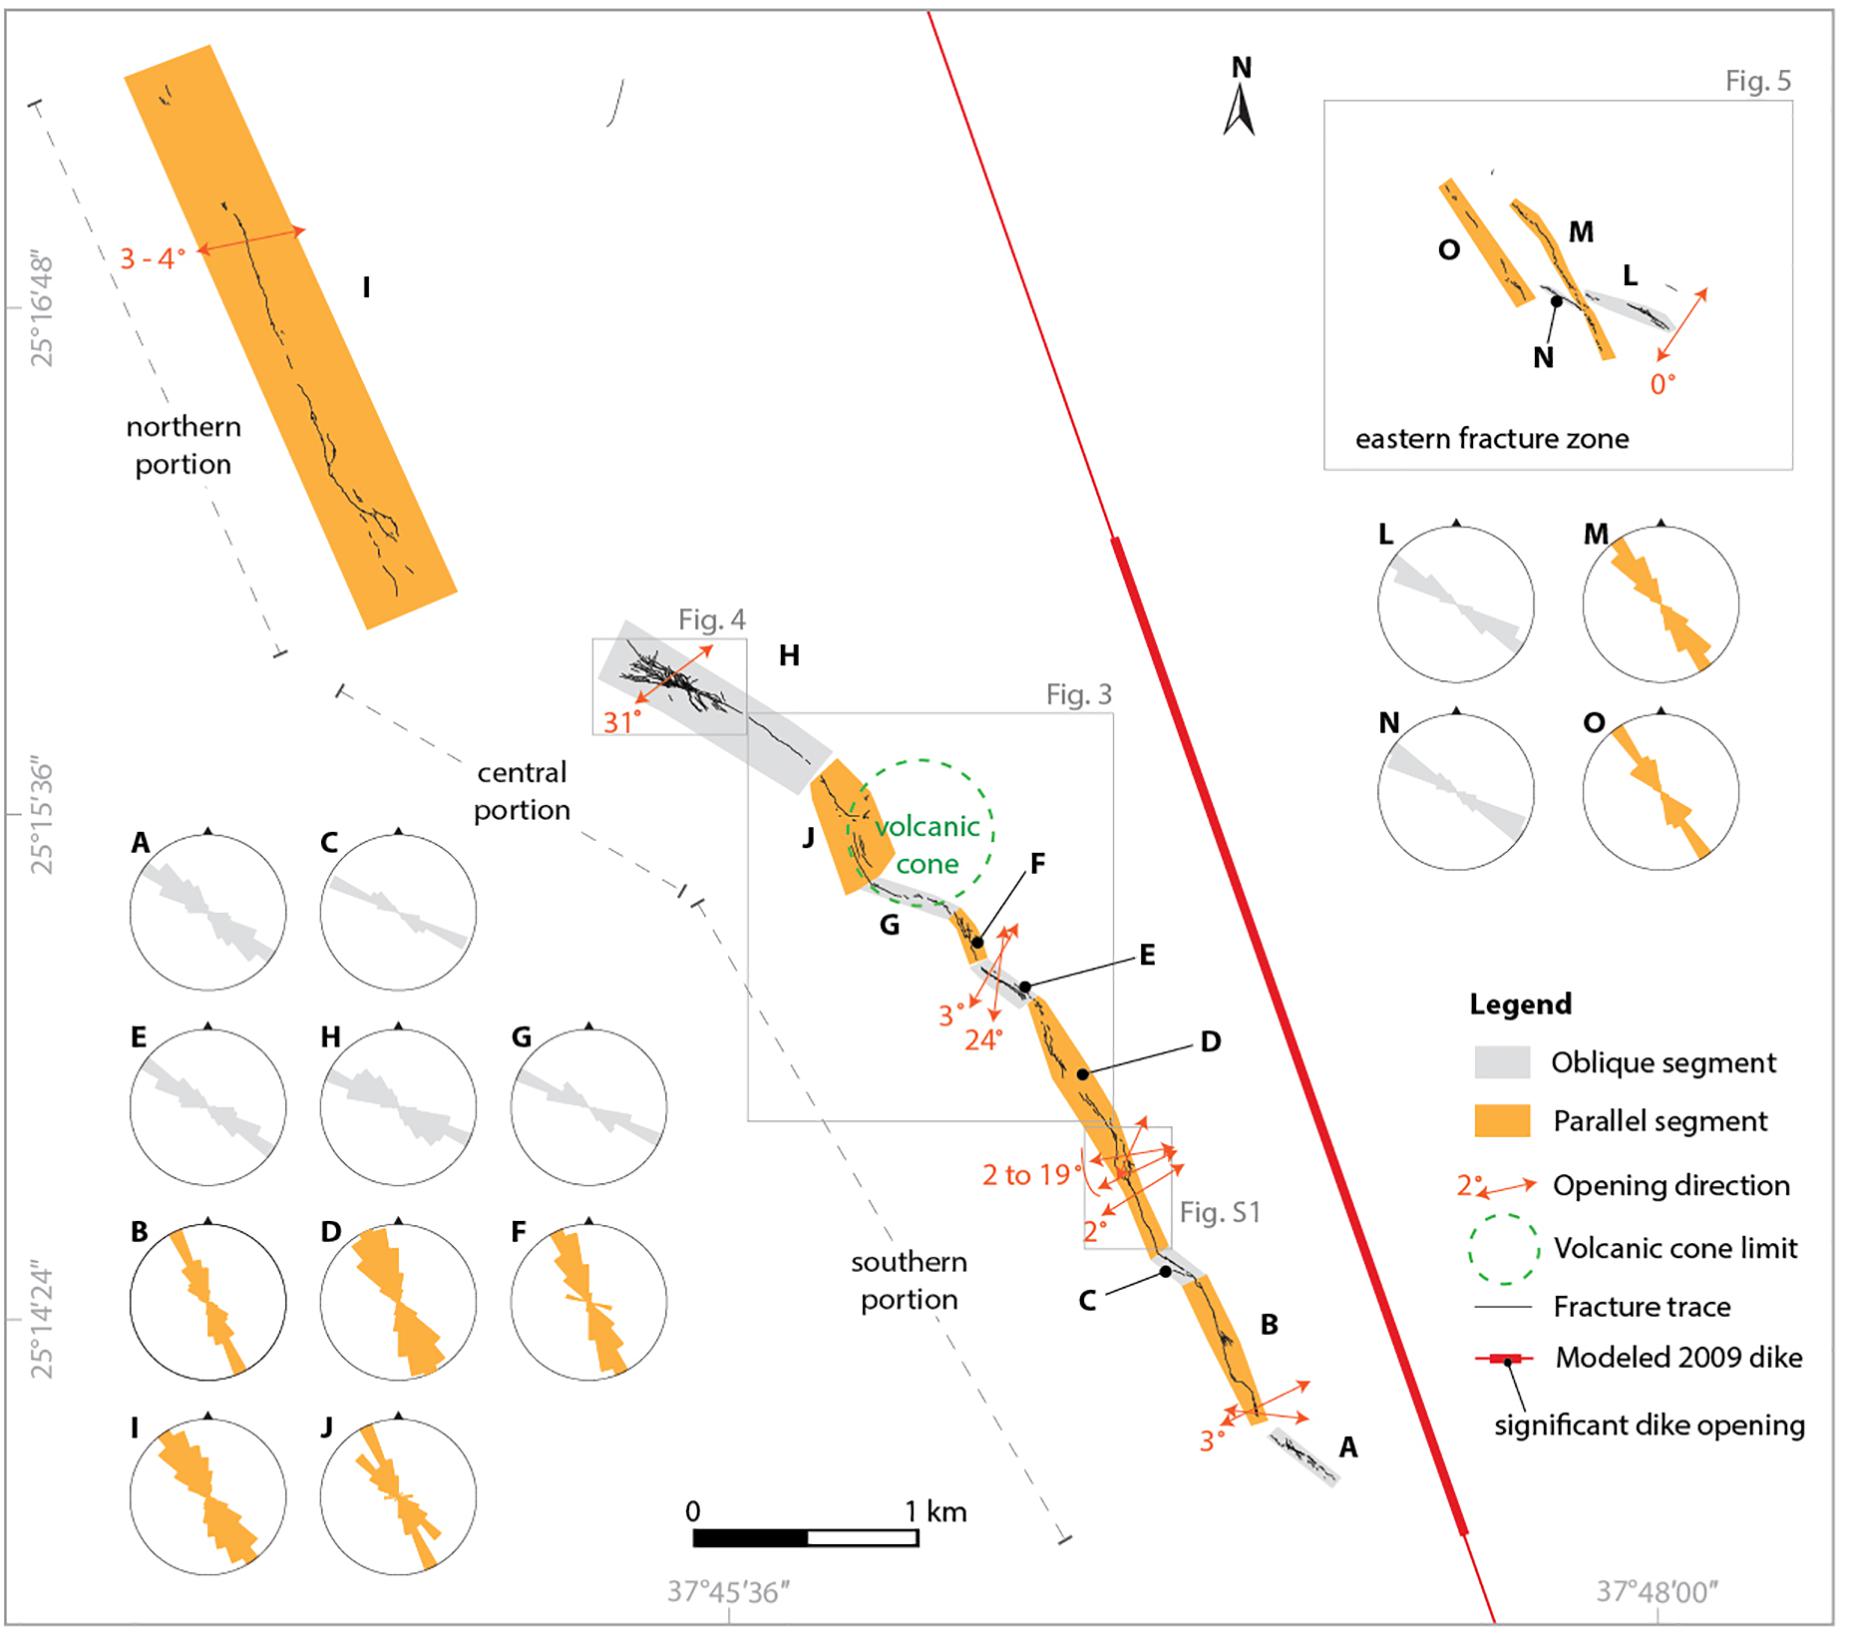
Figure 2. Surface fractures (normal faults and open fractures; black lines) mapped from using the high-resolution drone dataset. Dike parallel (orange) and oblique (light gray) segments are highlighted and labeled with capital letters. Corresponding rose diagrams show the frequency of fracture orientations in each segment. See Table 1 for more details.
In order to integrate and validate the drone data, we carried out two structural field surveys in April 2017 and February 2018. In these field surveys, we aimed at better characterizing the fault geometry and kinematics (e.g., orientation, vertical displacement, opening direction, footwall, and hanging-wall geometry) on selected outcrops along the western fault to compare with topographic profiles extracted from the drone observations. We observed the typology of rocks (hard rocks such as basaltic lava flows, unconsolidated deposits such as volcanic tephra, or silt deposits) in the field in order to compare typology with the ortho-photos. In addition, we also used kinematic GPS to map the complex fracture pattern in detail at one location (Figure 3d).
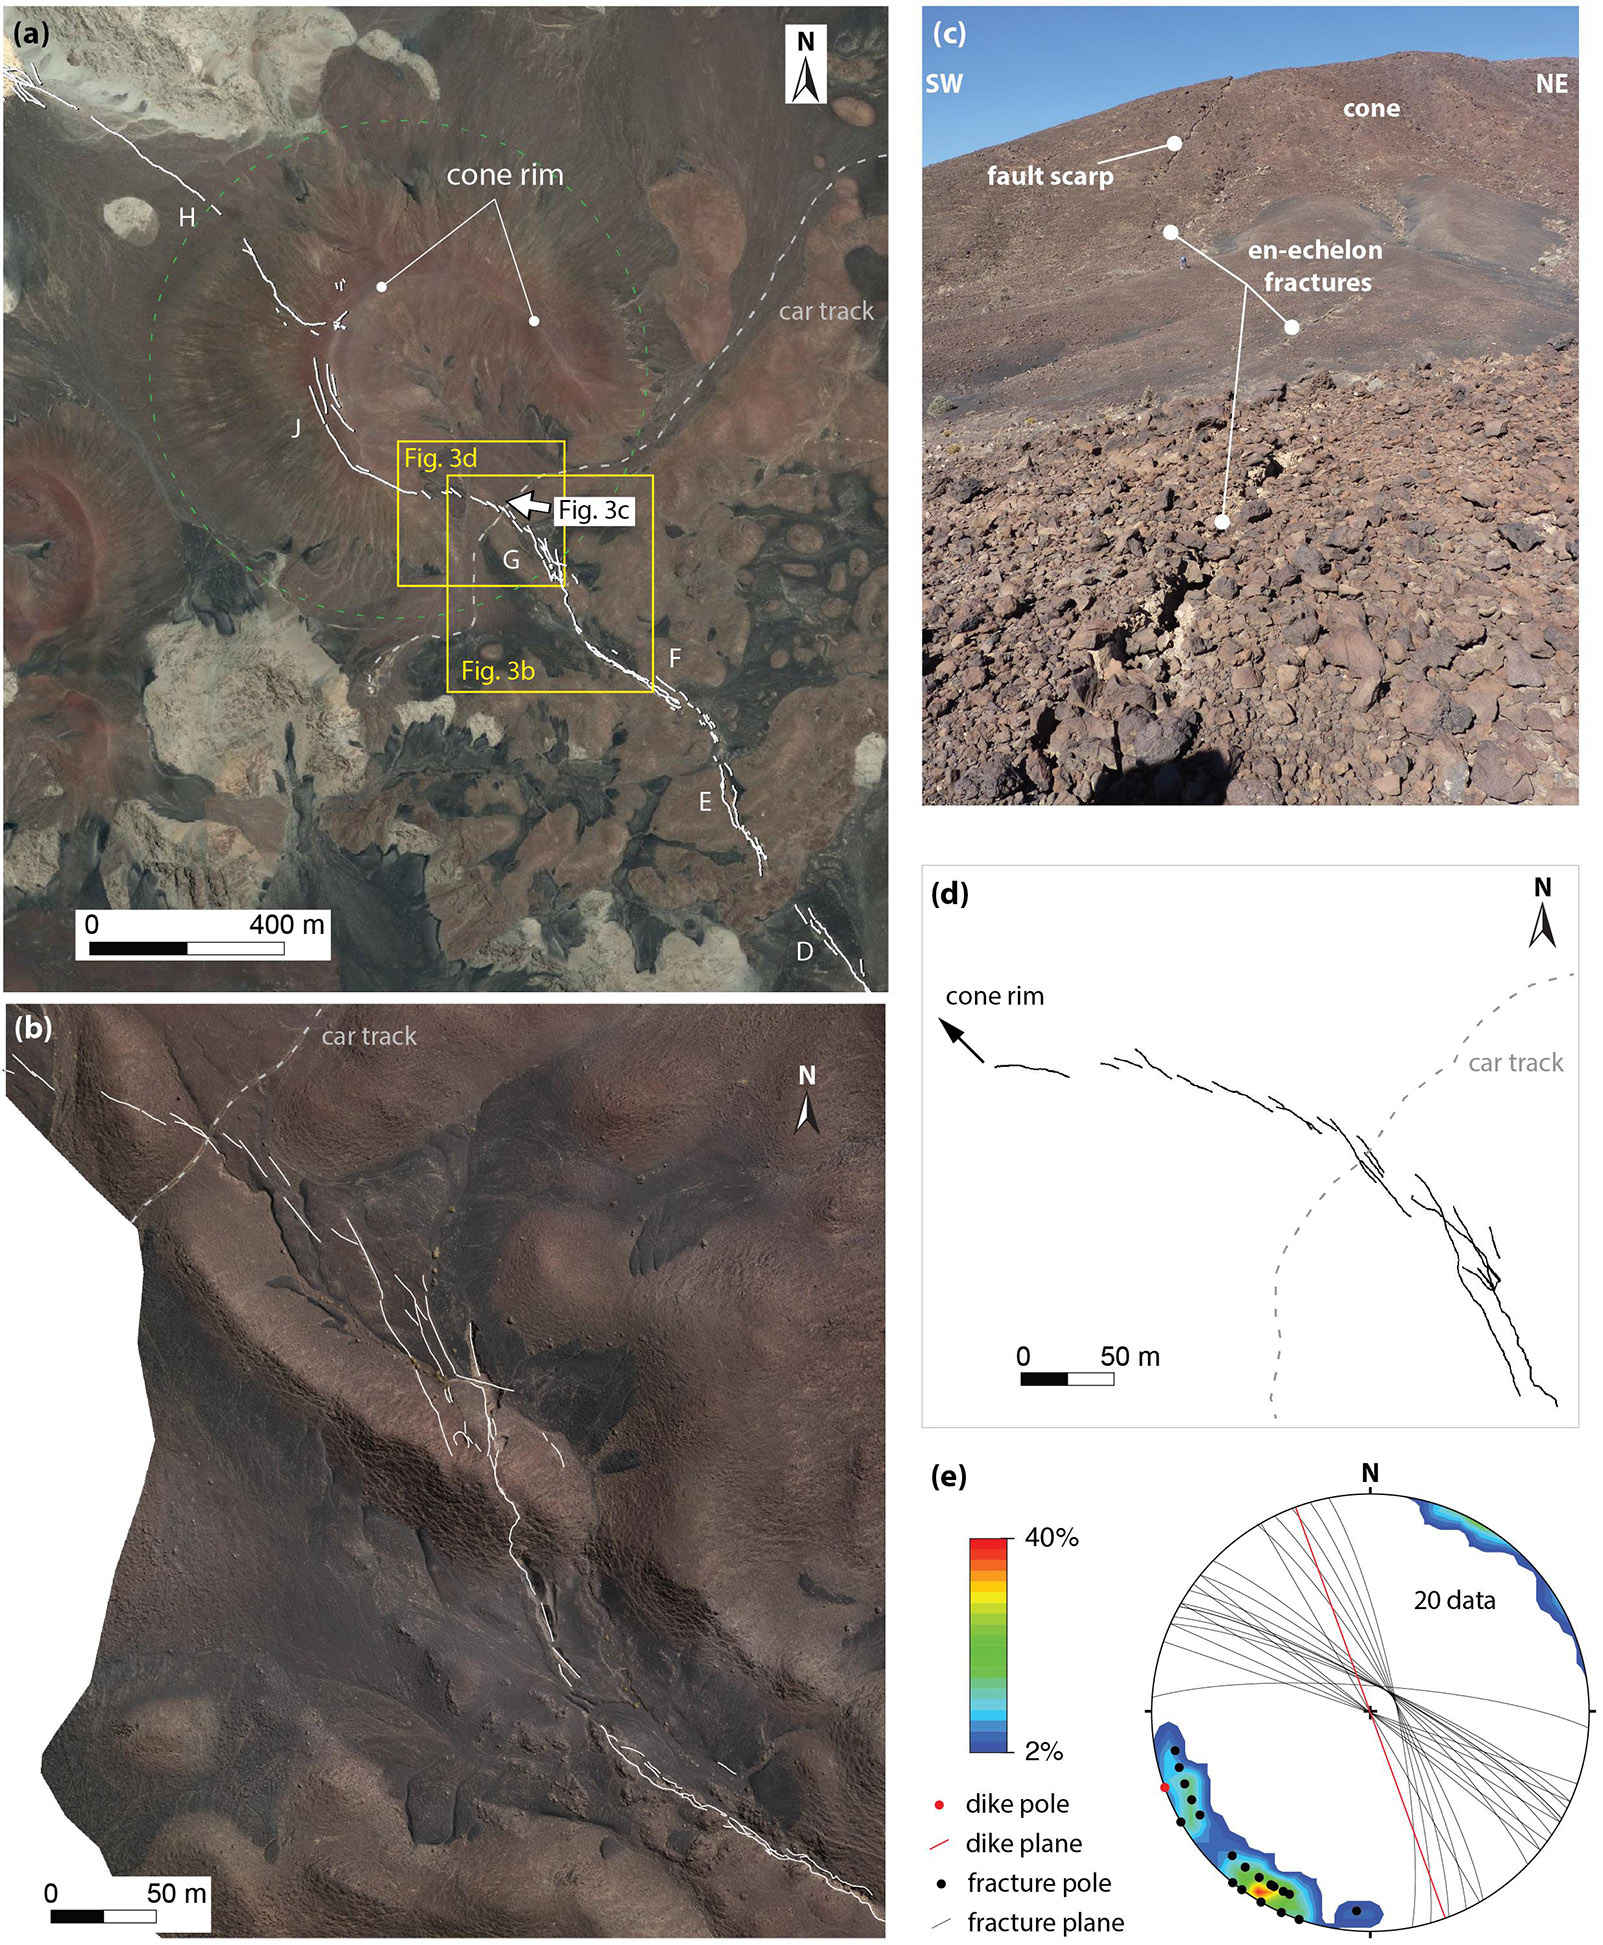
Figure 3. Fracture patterns of the western fault where it intersects a scoria cone. (a) Mapped fractures (white lines) on a background satellite image (Bing Map) (map area coverage shown in Figure 2). Green dashed circle indicates the approximate base of the cone. (b) En-echelon fracture patterns (white lines) just south of the cone. The background is the drone ortho-photo combined with the digital elevation model. (c) Photo taken in the field toward the cone showing the surface expression of the western fault where it intersects the southern slopes of the cone (photo location and azimuth indicated by an arrow in Figure 3a). (d) Fracture patterns (black lines) south of the cone mapped using kinematic GPS. (e) Stereonet of field measurements showing fracture planes and the associated poles. The pole color density was obtained with the 1% area method (%value = n(100)/N where n is the number of points falling within an area of the plot and N is the total number of points). The stereonet was obtained using the Stereonet software by Allmendinger et al. (2012) and Cardozo and Allmendinger (2013).
Finally, we compared our results with vertical and horizontal displacement maps of the 2009 dike intrusion obtained by InSAR data (Jónsson, 2012). This comparison allowed us to appreciate, for the first time, the main advantages in combining drone imagery, InSAR observations and fieldwork for structural geology purposes.
Results
Fault Pattern
The horizontal distance between the western fault and the inferred dike trace increases from south (∼0.45 km) to north (∼3.30 km). However, our high-resolution dataset reveals that the fault does not consist of a single continuous rupture. Some parts (e.g., segments D, E, F and G in Figure 3 and Supplementary Figure S1) are composed of several parallel open fractures, smaller discontinued normal faults, secondary narrow grabens (tens of meters wide) and elongated sink-holes defining faulted areas that are tens to a few hundred meters wide. Based on fracture orientations, we identified a total of 10 segments. These are eight smaller segments located along the southern portion of the fault (segments A to J; Figure 2), with one covering part of the central portion (segment H) and another corresponding to the northern portion of the fault (segment I). Interestingly, these segments are divided into two orientation trends that are either parallel or oblique to the strike of the modeled dike (orange and gray areas in Figure 2 and Table 1).
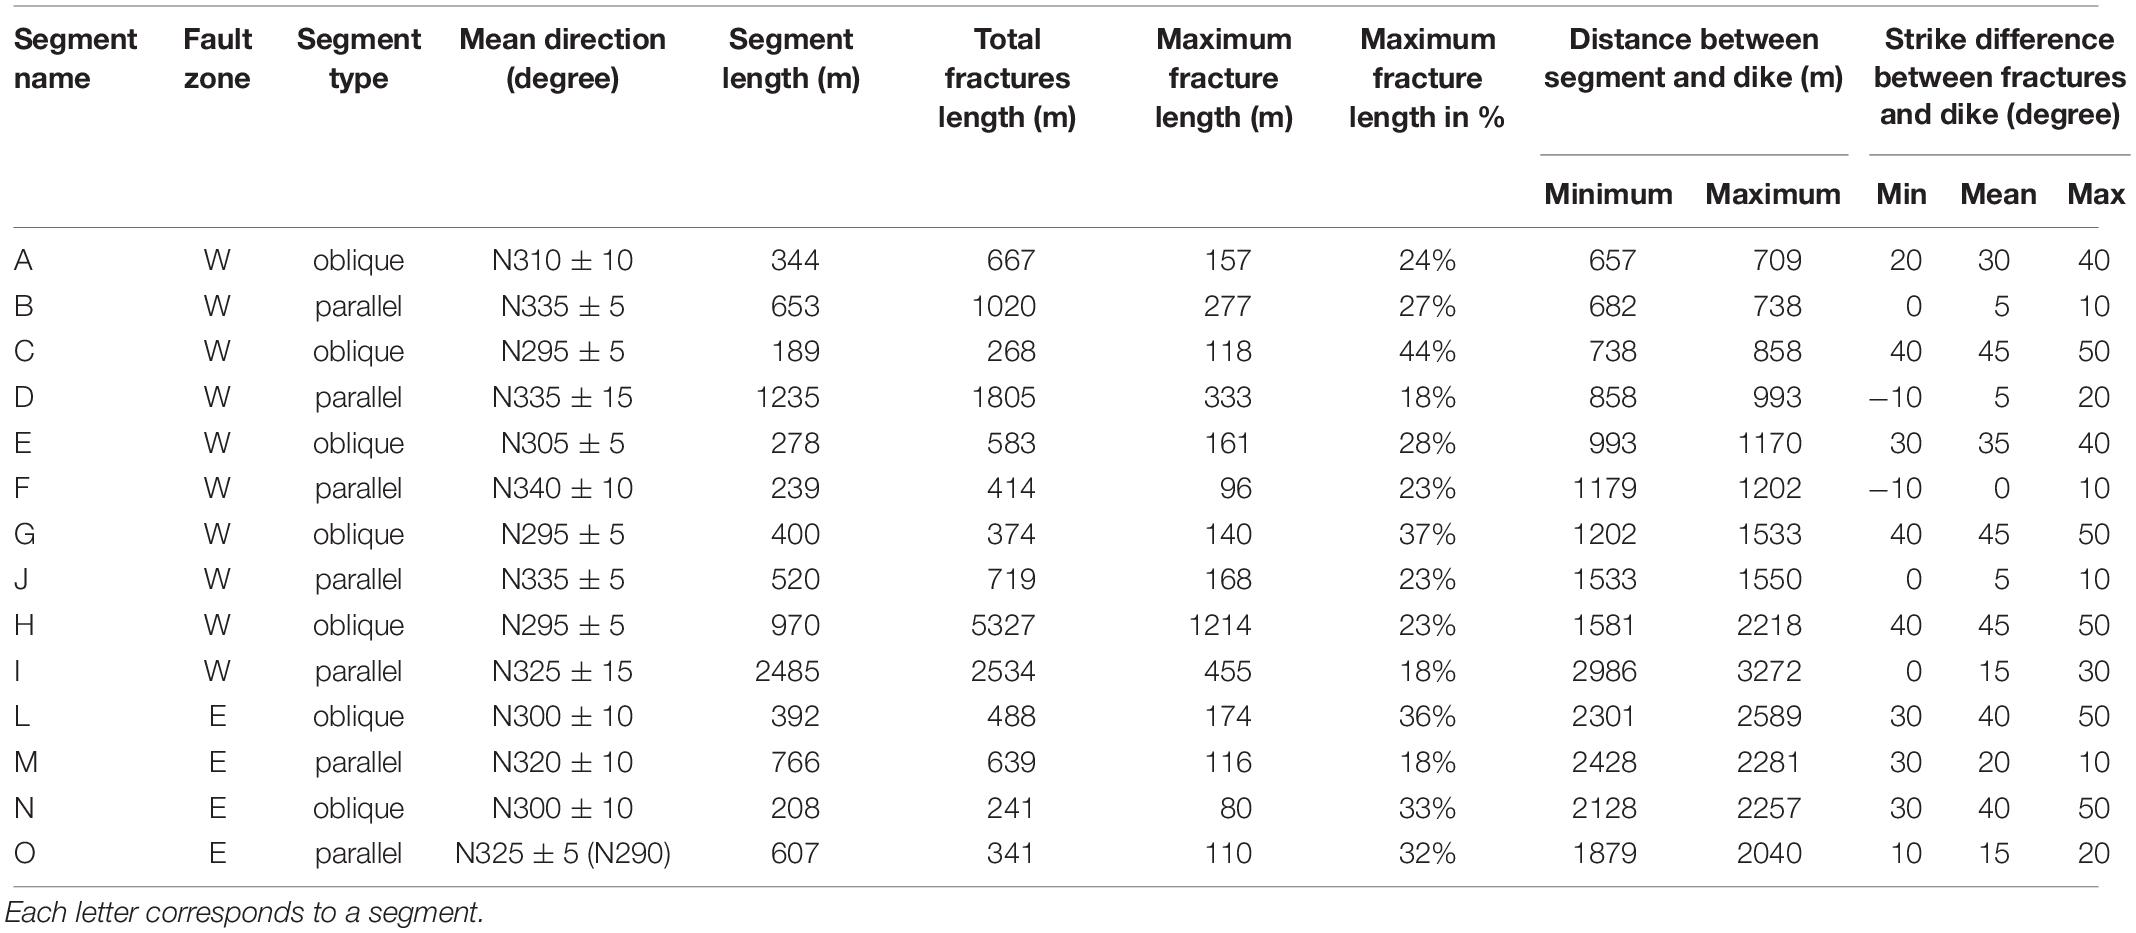
Table 1. Summary of rose diagrams of Figure 1.
In the eastern fracture zone, we observed several open fractures a few hundred meters long and a few meters wide (Figure 2); we did not observe any normal faulting. Here, we grouped the fractures in four segments whose strikes are consistent with those of the western fault, again with two main orientations (Figure 2 and Table 1). The frequencies and mean directions of all the segments are summarized in Table 1. The strike difference between the dike and the dike parallel segments (mean fracture orientations) ranges from 0 to 15°along the western fault and from 15 to 20° in the eastern fracture zone. The strike difference increases for the oblique segments to 30°–45° along the western fault and ∼40° in the eastern fracture zone (Figure 2 and Table 1).
Fracture Kinematics
Some of the oblique segments show a left-stepping en-echelon fracture pattern. In particular, we identified four areas in which this pattern is more evident; two of them are located along the western fault (segments H and G) whereas the other two are located along the oblique segments of the eastern fracture zone (segments L and M). The area along the western fault (segment G) is located where the fault intersects a 150-m high scoria cone (Figures 3a,b) and cuts across surrounding lava flows and scoria deposits (Figure 3c). Close to the cone, we mapped the fault pattern with both drone images (Figure 3b) and ground-based kinematic GPS (Figure 3d). From south to north, the fault gradually changes in strike when approaching the cone from a NNW-SSE to a WNW-ESE direction at the top of the western rim of the cone. In the WNW-ESE oriented portion of segment G, the fault is divided into smaller fractures (a few meters long, up to 10–15 cm wide, <10 cm vertical offsets) arranged in a left-stepping en-echelon pattern (Figures 3b,d). Field measurements of 20 fracture orientations in this area highlight that these focus at ∼N300° and ∼N330° (Figure 3e), in agreement with the overall orientation of oblique and dike parallel segments.
To the north of the cone, the fault bends to a WNW-ESE orientation (segment H). Here, at the northern tip of the segment (Figure 2), the fault passes through a small basin filled with compacted silt deposits where it spreads into three main faults and several minor fractures, forming a horse tail structure (Figures 4a,b). The major faults show an overall vertical displacement toward NNE varying from 1 m to 40 cm (Figure 4c). A detailed analysis of the pattern of small fractures close to the center of the basin shows the presence of left-stepping en-echelon fractures at different scales (Figures 4d,e). These fractures are of different lengths and this seems to reflect a different degree of fracture merging: from several short-isolated fractures (∼10–15 m long), to fewer longer segments (∼30 m long) to a single continuous and larger open fracture (Figure 4e). A similar smaller and shallow basin filled with fine silt sediments is also present in the eastern fracture zone (Figure 5). This is crossed by an oblique segment (segment L) showing largely eroded open fractures with no vertical displacements and arranged in a left stepping en-echelon pattern (Figure 5b).
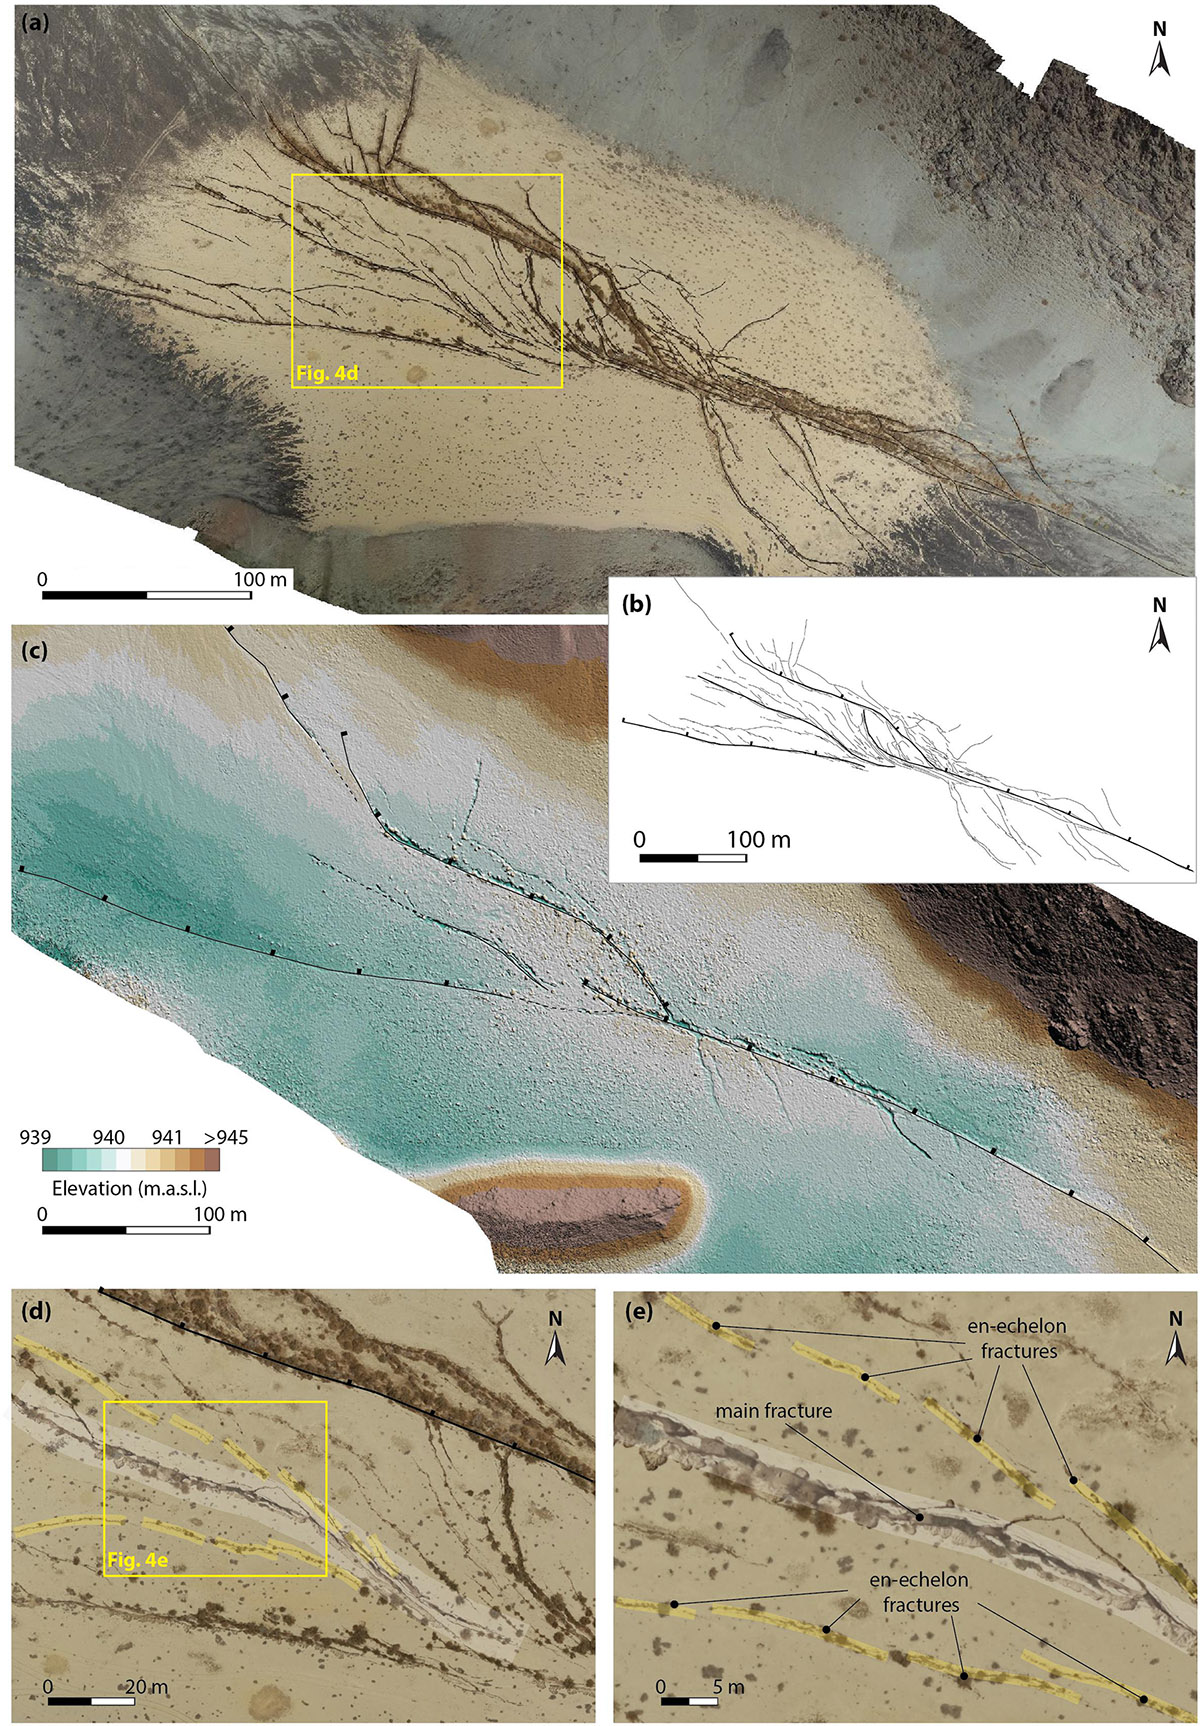
Figure 4. Fracture patterns of the western fault (segment H) where it crosses a silt basin (map coverage shown in Figure 2). (a) Drone ortho-photo of the basin that is filled with compacted silt / fine sand having a light brown color. (b) Mapped fracture patterns within the basin with the main faults highlighted as thicker lines. (c) Digital elevation model showing higher vertical displacement at the main faults. (d,e) Close-ups of the central area of the basin with en-echelon fractures highlighted with a transparent yellow color, whereas a major continuous open fracture is highlighted in white.
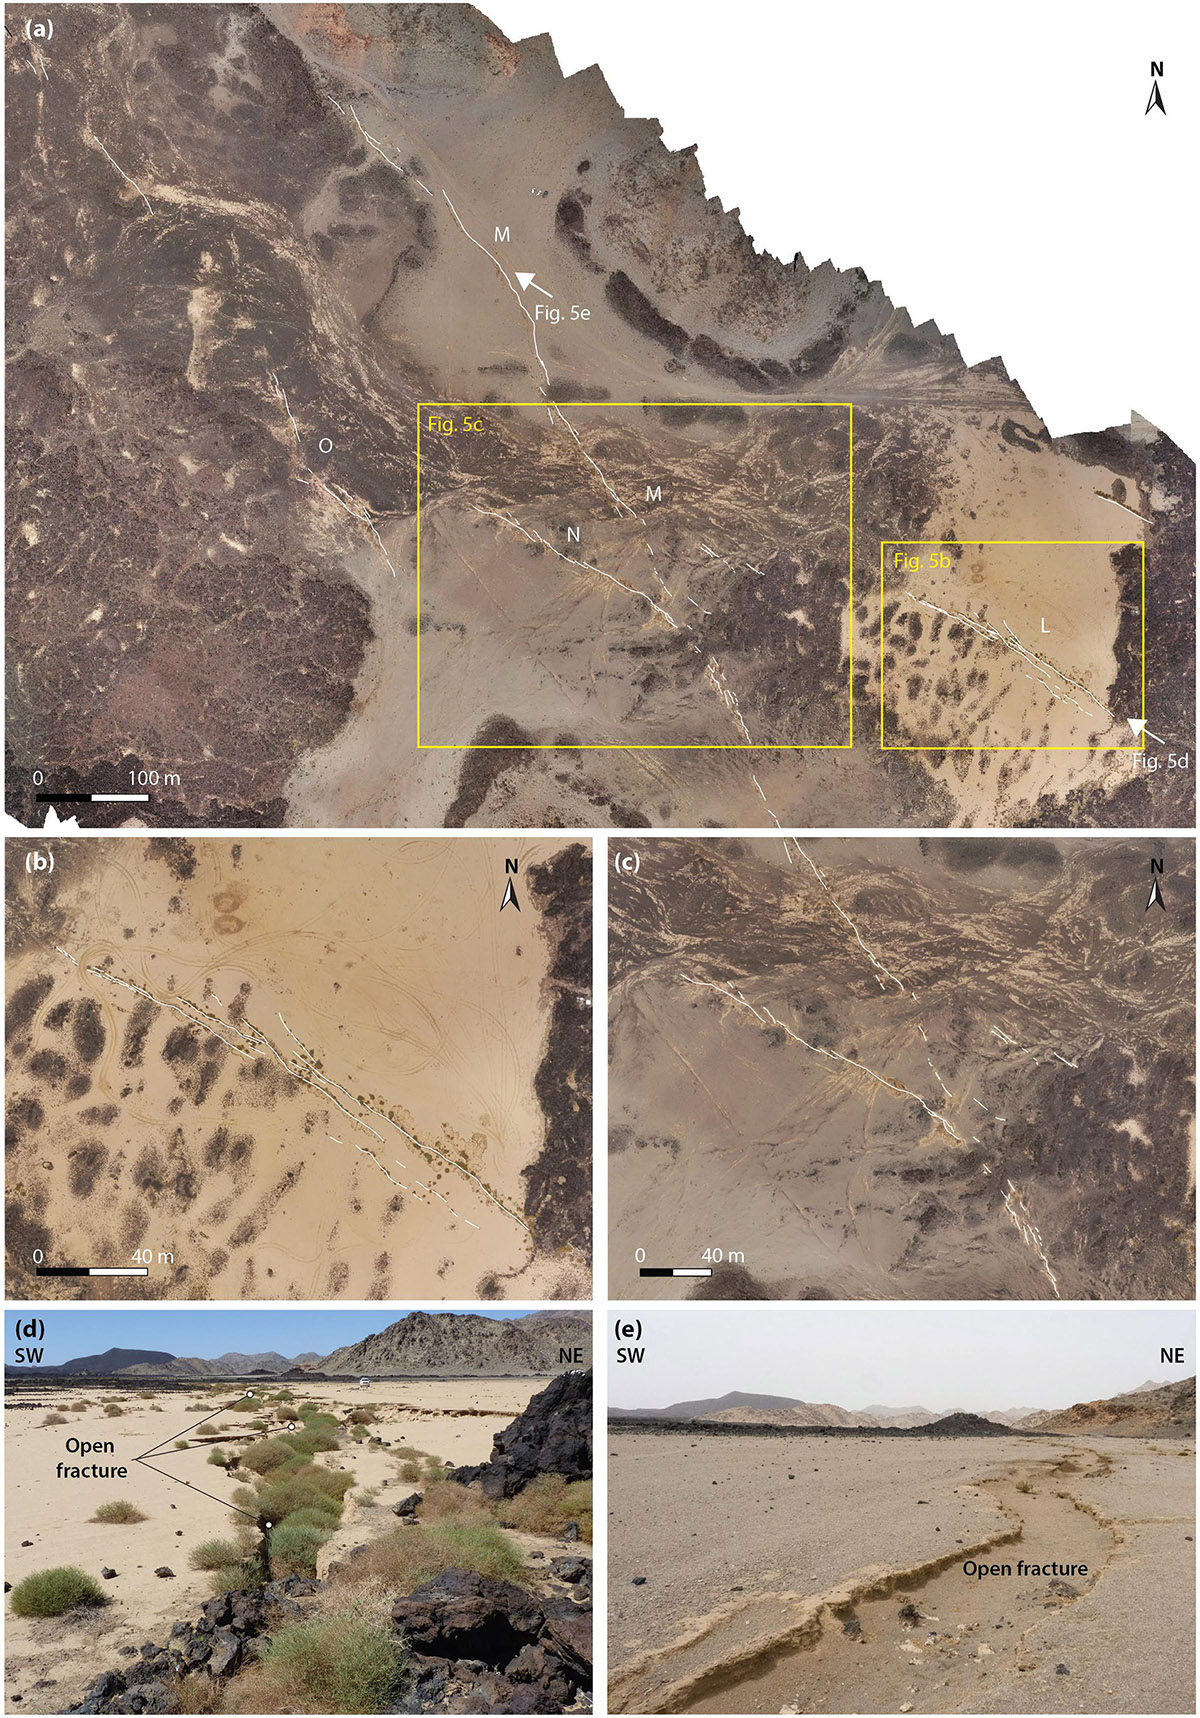
Figure 5. Fracture patterns in the eastern fracture zone. (a) Overview of the eastern fracture zone showing mapped fractures (white lines) along segments L-O (area coverage shown in Figure 2). (b) Close-ups of segment L and (c) segments M and N. (d,e) Field photos of open fractures. The photo locations and azimuths indicated by white arrows in (a).
To estimate the opening direction to characterize the kinematics of the faults and the open fractures, we identified some matching margins on the fracture sides, mostly from the ortho-photos and at a few locations in the field. However, our estimations are limited in number (15 measurements in total) due to the erosion that affected soft and unconsolidated deposits, and to the high degree of heterogeneity of the scoria deposits and old lava flows (Figure 2). Although we observed very different opening directions in some locations, we found almost pure opening kinematics of the brittle fractures (deviation from pure opening <15°) consistently along the whole western fault and at the only spot in the eastern fracture zone that we measured (Figure 2). We measured the highest deviation from a pure opening (31°) in the central segment of the western fault (segment H) in the silt filled basin. In this case, the opening direction indicates a dextral trans-tensive kinematic (Figure 2).
Fault Geometry and Vertical Offsets Along the Western Fault
The fault geometry along the western fault shows a high spatial variability, also between adjacent locations that are only a few meters apart, depending on the topography and the ground composition. We report three main examples in Figure 6. The fault may have a simple “one-step” (or “multiple-steps”) morphology with a clear vertical offset between a flat footwall and a flat hanging-wall with no or large opening (up to 2 m) in-between. We observed this geometry on the cemented alluvium deposits (Figure 6a; same location as Pallister et al., 2010) and on lava flows where the slope angle of the fault scarp is almost sub-vertical (Figures 7a–d). In particular, at the center of segment G in correspondence with a lava flow, we found one of the largest vertical offsets (up to 3.5 m; Figures 7c,d). However, the fault scarp outcrop in Figure 7c shows two distinct colors of the rocks suggesting that at least two distinct slipping events occurred on this portion of the fault, with the more recent portion (white in Figure 7c) likely representing the slip that occurred during the 2009 dike intrusion (Figure 7c).
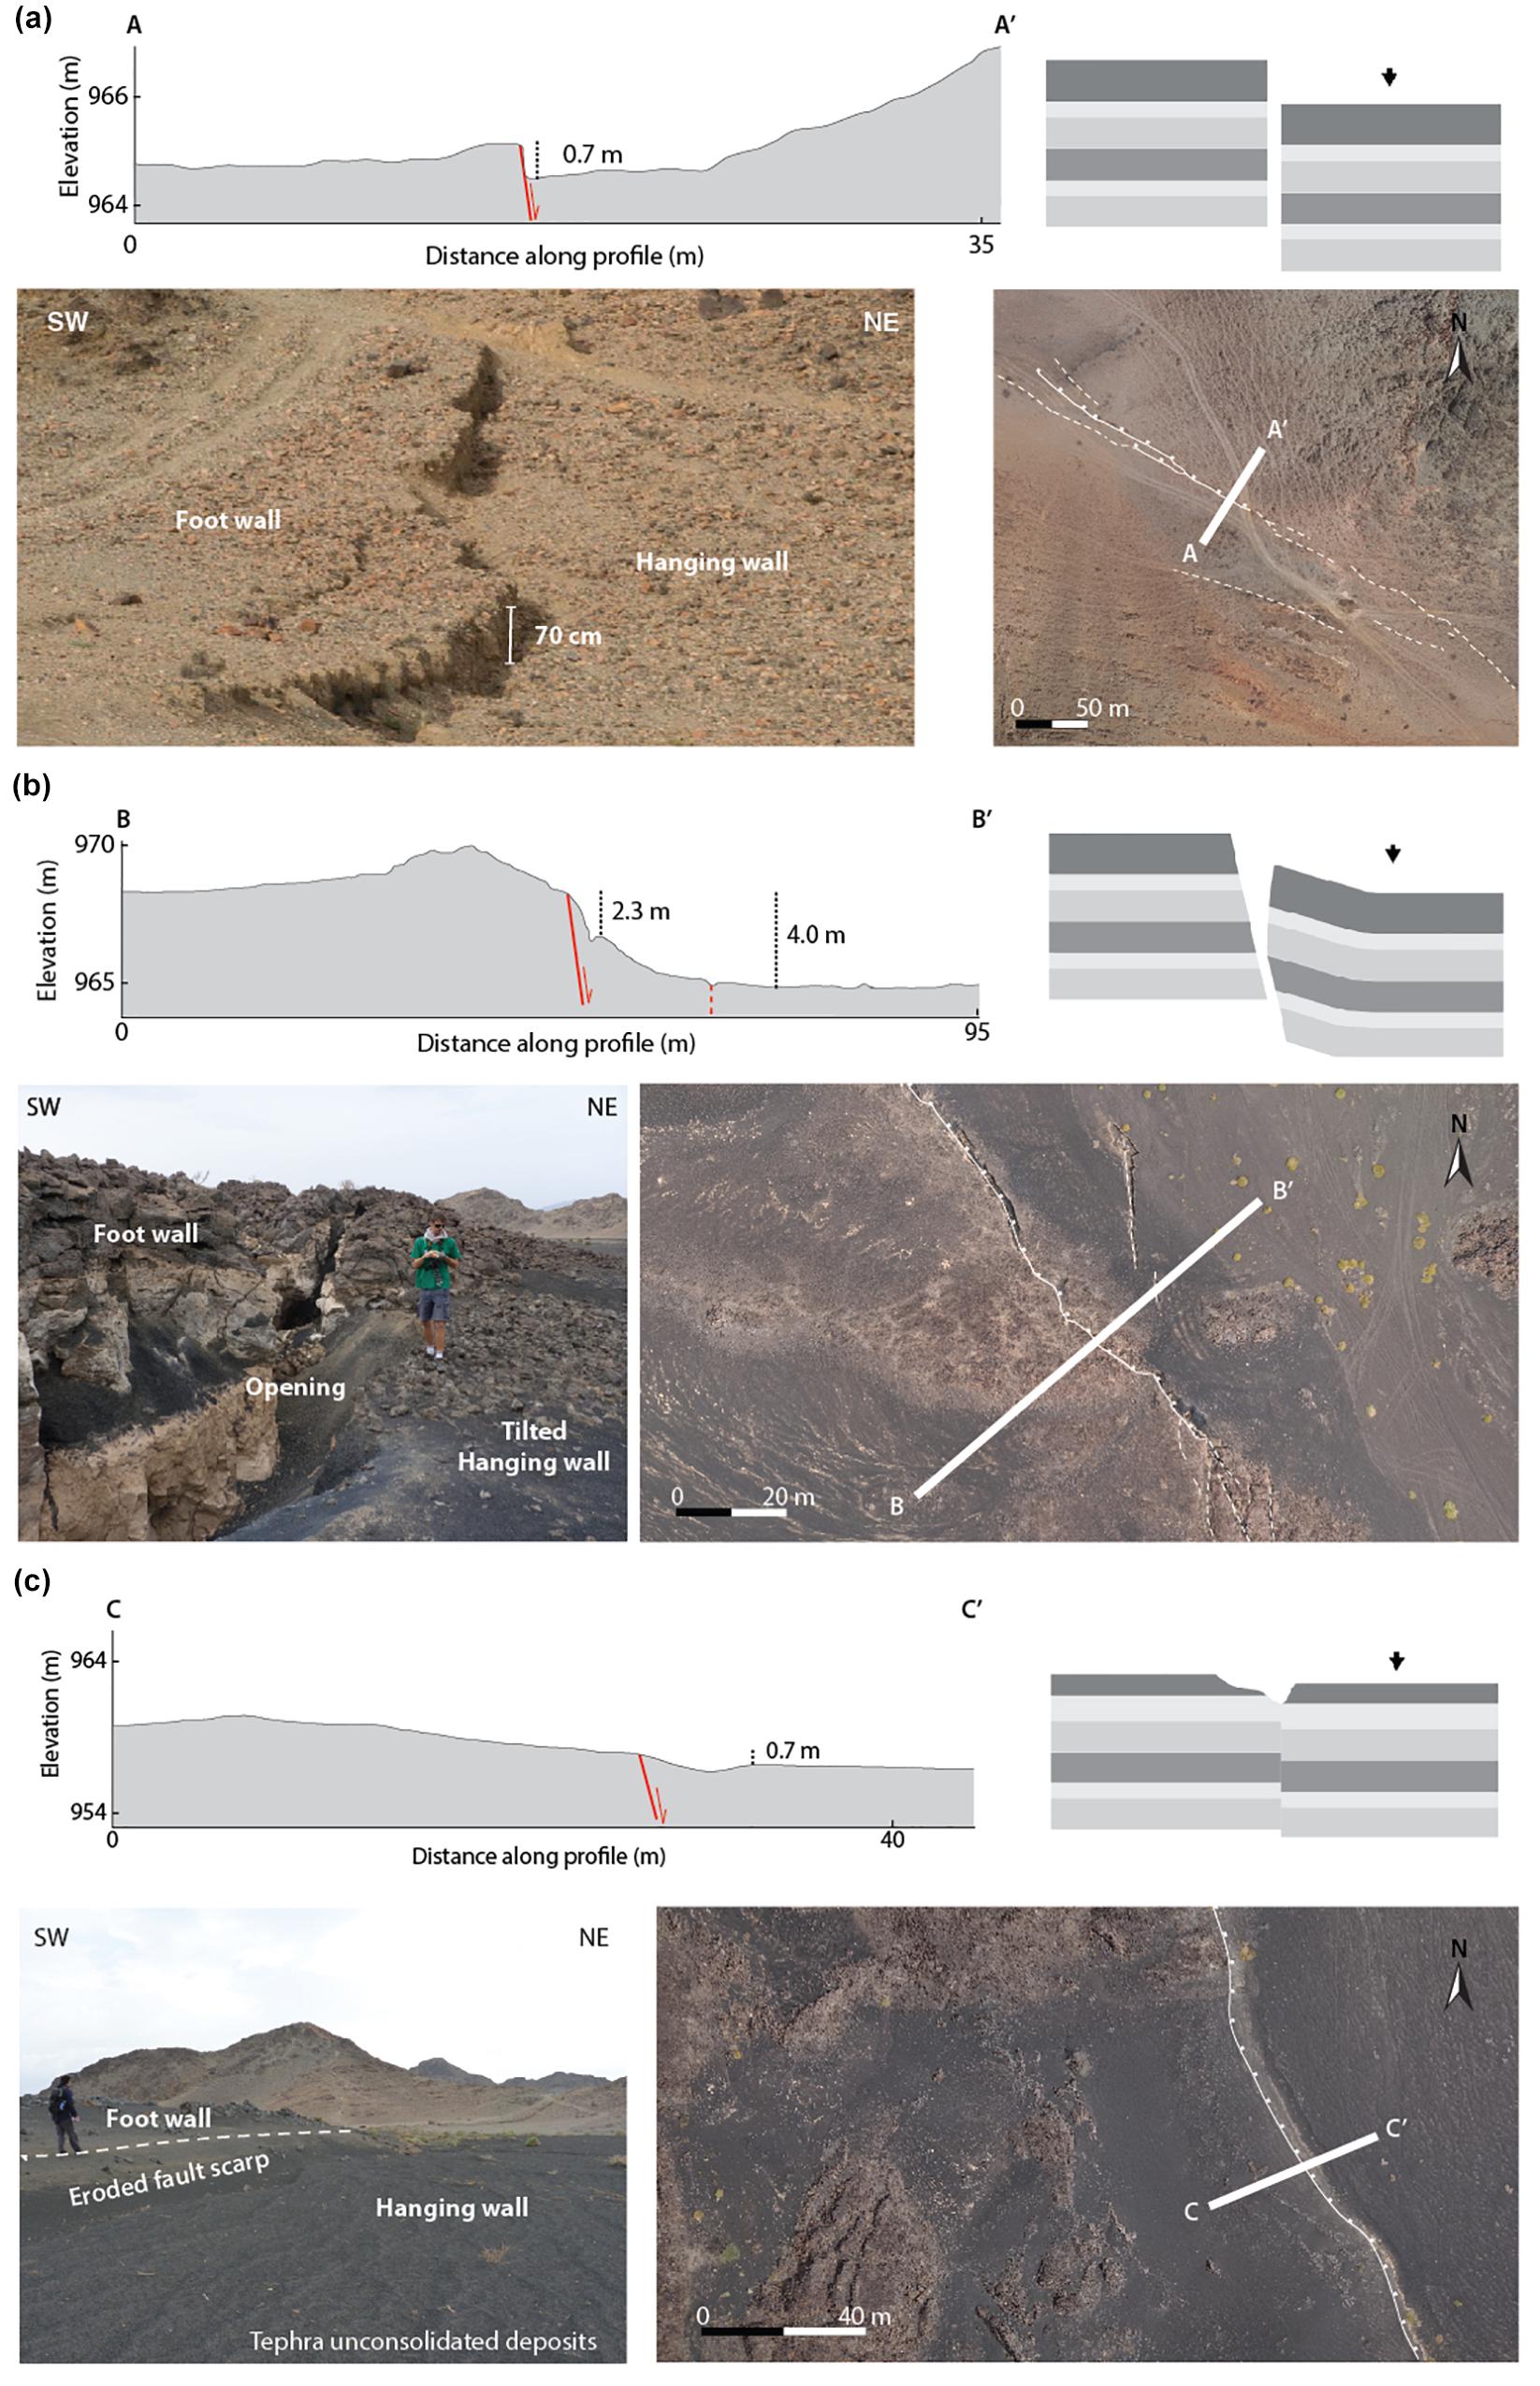
Figure 6. Examples of fault offsets and geometries at three different locations along the western fault. The fault affects different lithotypes: cemented alluvium (a), lava flow (b), tephra (c). For each location, we show the topography across the fault (from the drone DEM), a schematic model of the fault geometry, a field photo of the fault outcrop, an ortho-photo indicating the local rock lithology, the mapped fractures and the location of the topography profile.
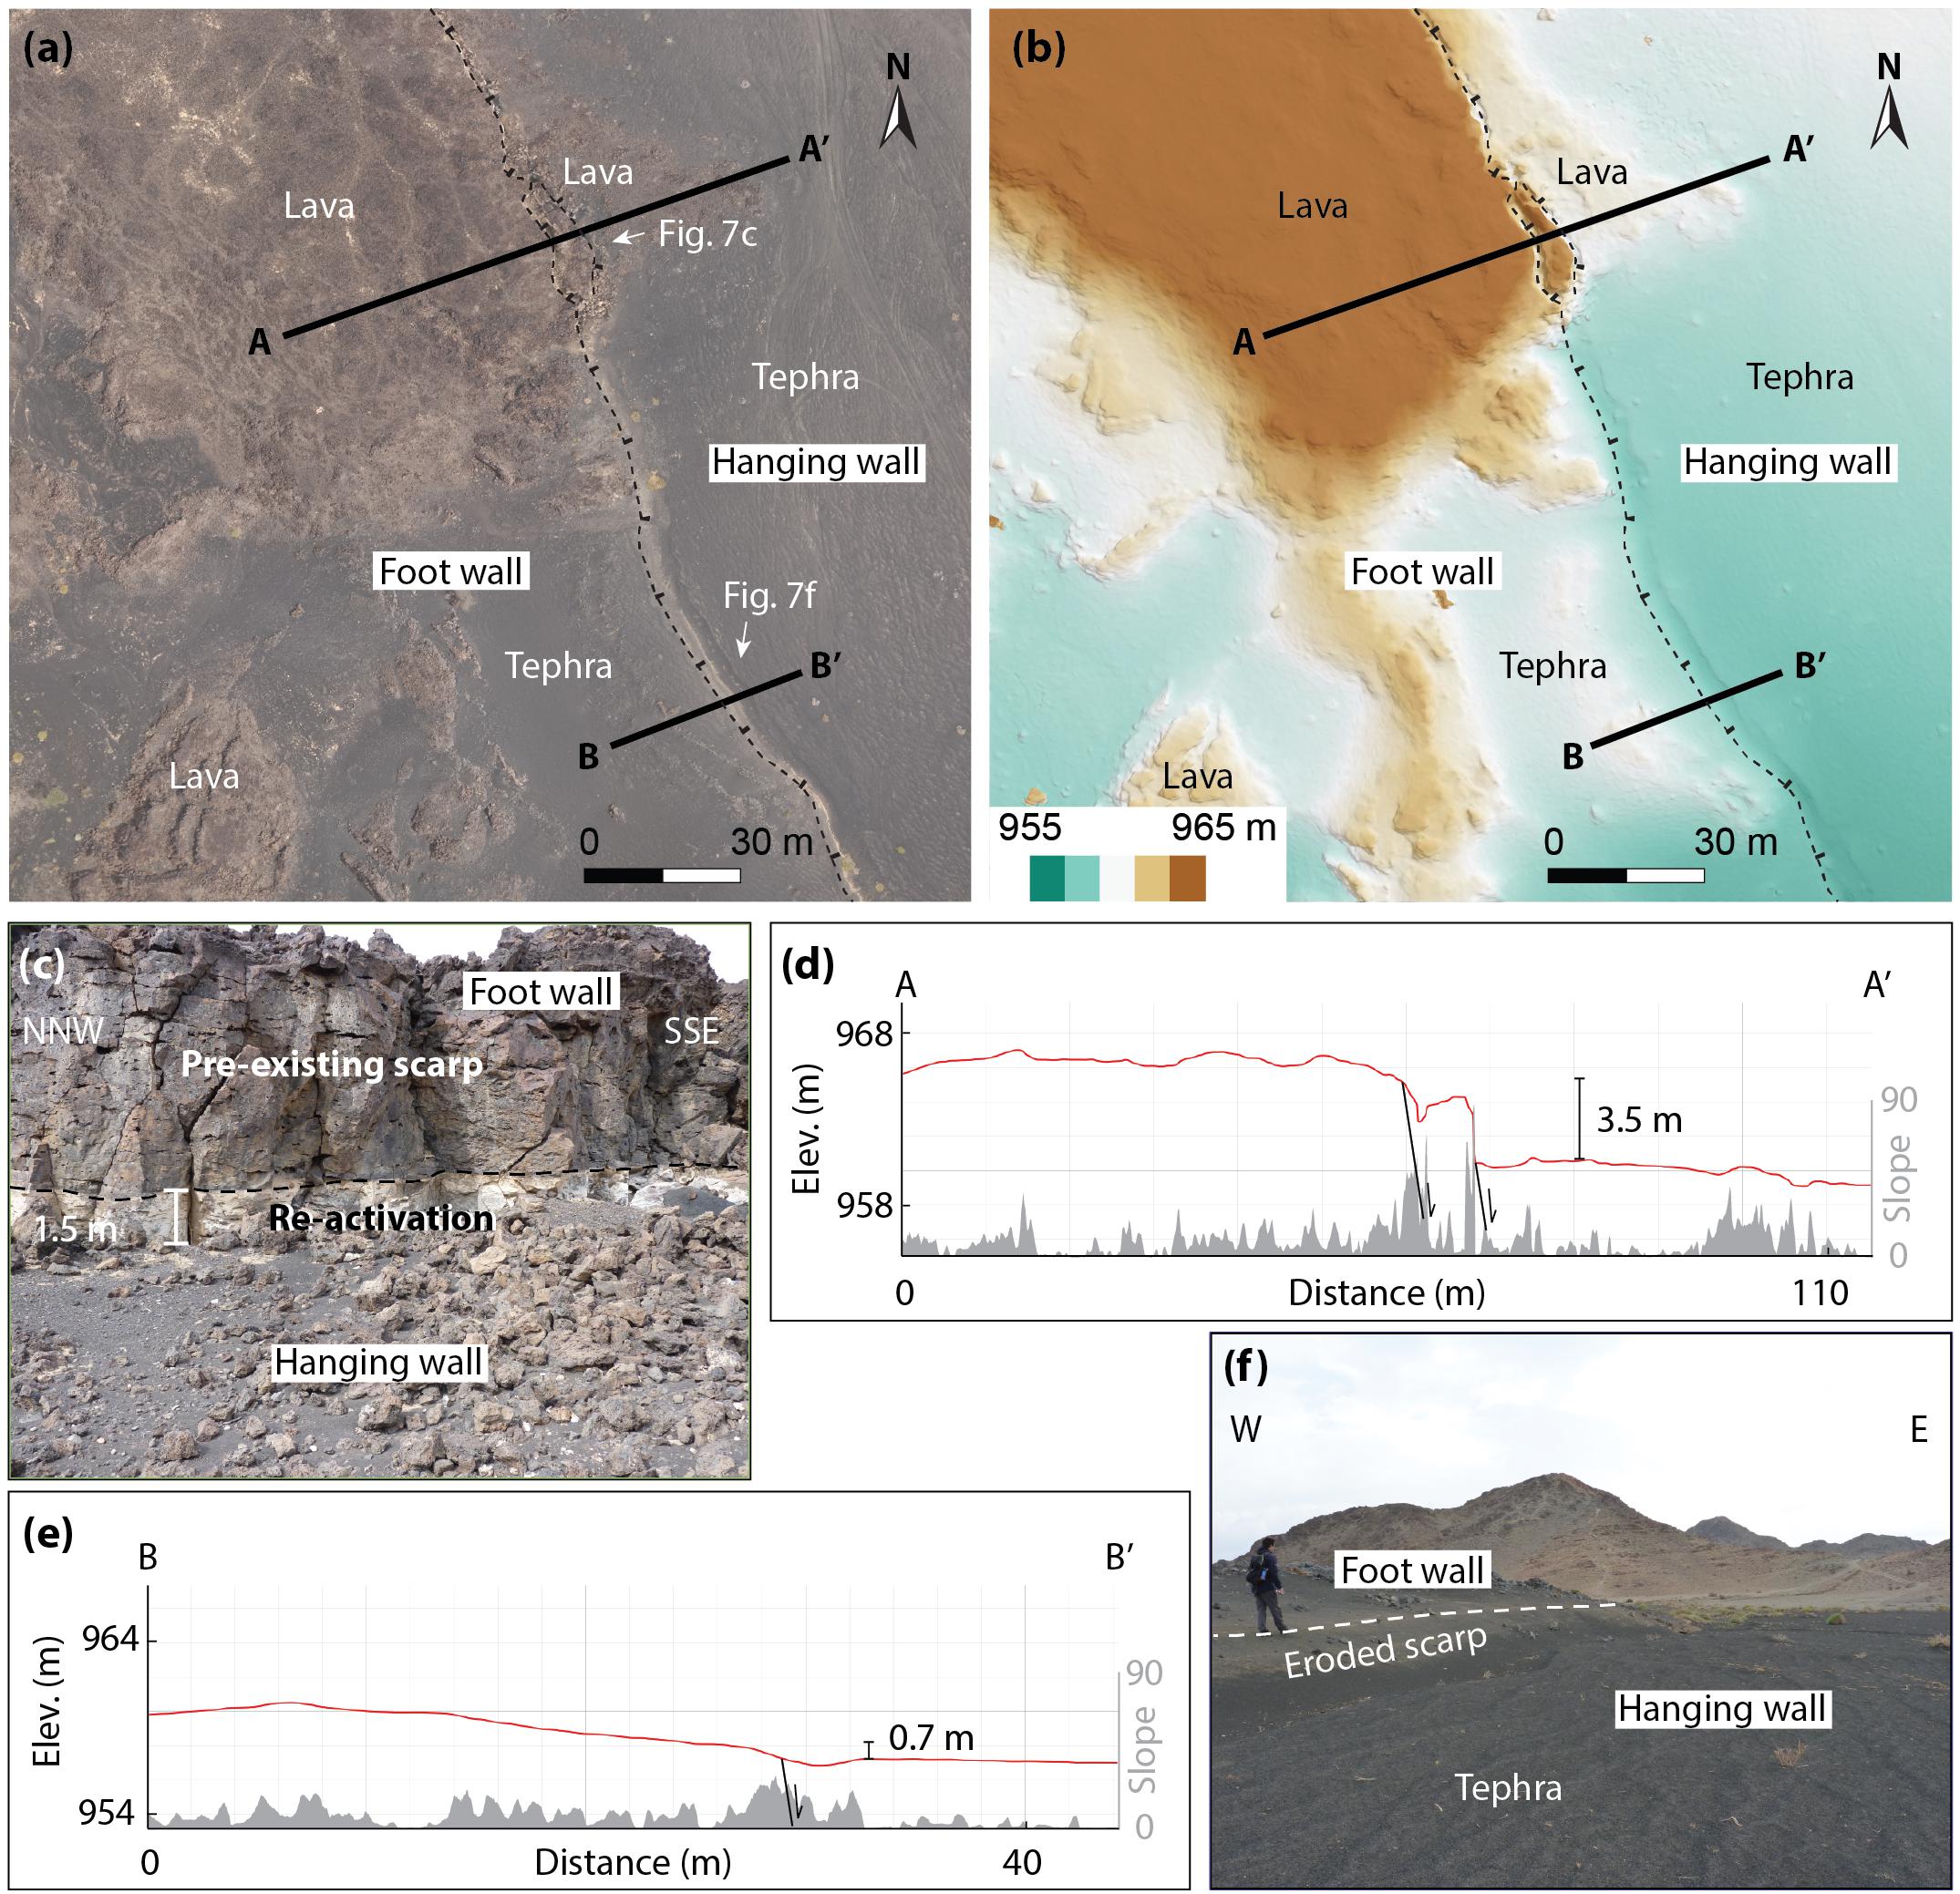
Figure 7. Fault offsets and geometry in different lithologies for a portion of segment G along the western fault. (a) Ortho-photo and (b) DEM with the fault shown as a dashed line. Locations and azimuths of photos in (c) and (f) are indicated by white arrows. (c) Photo showing a pre-existing fault scarp (darker color) above a recently emerged portion of the fault (lighter color scarp) and a (d) topographic profile (red line) and slope values (gray) for A-A.’ (e,f) same as (c,d). In (f), the picture has been horizontally flipped in order to be consistent with the profile in (e).
At a few other locations of segment D, again within a thick lava flow, the fault geometry is more complex. The almost flat footwall is separated by an open fracture (up to 3–4 m wide) from a tilted hanging-wall (up to ∼25°; Figure 6b). This geometry is similar to those found at the faults that cut lava flows in the active Icelandic and Main Ethiopian Rifts (e.g., Gudmundsson, 1987a,b; Gudmundsson and Backstrom, 1991; Tentler, 2005; Tentler and Mazzoli, 2005; Rowland et al., 2007; Trippanera et al., 2015a). At these locations of segment D, we also measured the highest vertical offsets along the western faults (locally reaching up to 4.5 m) that are probably a result of multiple slipping events, as in the previous example (but in this case not directly observable in the field).
On the contrary, we observed a smoother morphology where the fault cuts across poorly consolidated sedimentary or tephra deposits (Figures 6c, 7e,f). In these cases, the fault scarp is already highly eroded with a few meters wide channel developed between the footwall and the hanging-wall resulting in a low slope value of the eroded fault scarp (Figure 7e).
In addition to these geometries, the deformation along the fault may also be more distributed (e.g., Supplementary Figure S1) where the fault is divided into several open fractures without any vertical offset, or where it forms a narrow (a few meters wide) graben-like geometry, or where an elongated sink-hole has collapsed.
To quantify the overall vertical throw distribution along the western fault, we measured the median fault throw along 100 topographic profiles crossing the fault using our high-resolution DEM (Figure 8). To calculate the median, we used the swath profile function in QGis software and we elaborated the results using Matlab. By using this function, we avoided calculating the throw at a single line and instead obtained a median profile throw value representing a wider area (10–100 m). This helped to avoid scatter due to single pixels and provided a more reliable throw estimation. To compare our results with InSAR, we also calculated the throw at the same profiles from the 3D ground displacement map estimated from InSAR data (from Jónsson, 2012) of the 2009 rifting event. Both InSAR and drone data show overall higher displacement values in the central portion of the fault with a gradual decrease toward north. This is in agreement with the increasing distance between the fault and the inferred dike position (Figure 8A). However, the vertical throws measured using the drone DEM are highly variable along the fault compared to those from the InSAR data, which are more homogeneous. The difference between the drone and the InSAR estimates is generally large (varying from zero up to ∼3 m). Where the fault cuts lava flows and shows evidence of multiple slipping events, we observed the highest scatter in the drone data, the largest differences compared to the InSAR data and the highest median throw values (up to 3.5 m). In contrast, where the fault cuts poorly cemented sedimentary or volcanic deposits such as unconsolidated rocks (tephra or sedimentary deposits and silt in Figure 8A), the throw values from the drone DEM were almost homogeneous and generally smaller than those of InSAR data (Figure 8A).
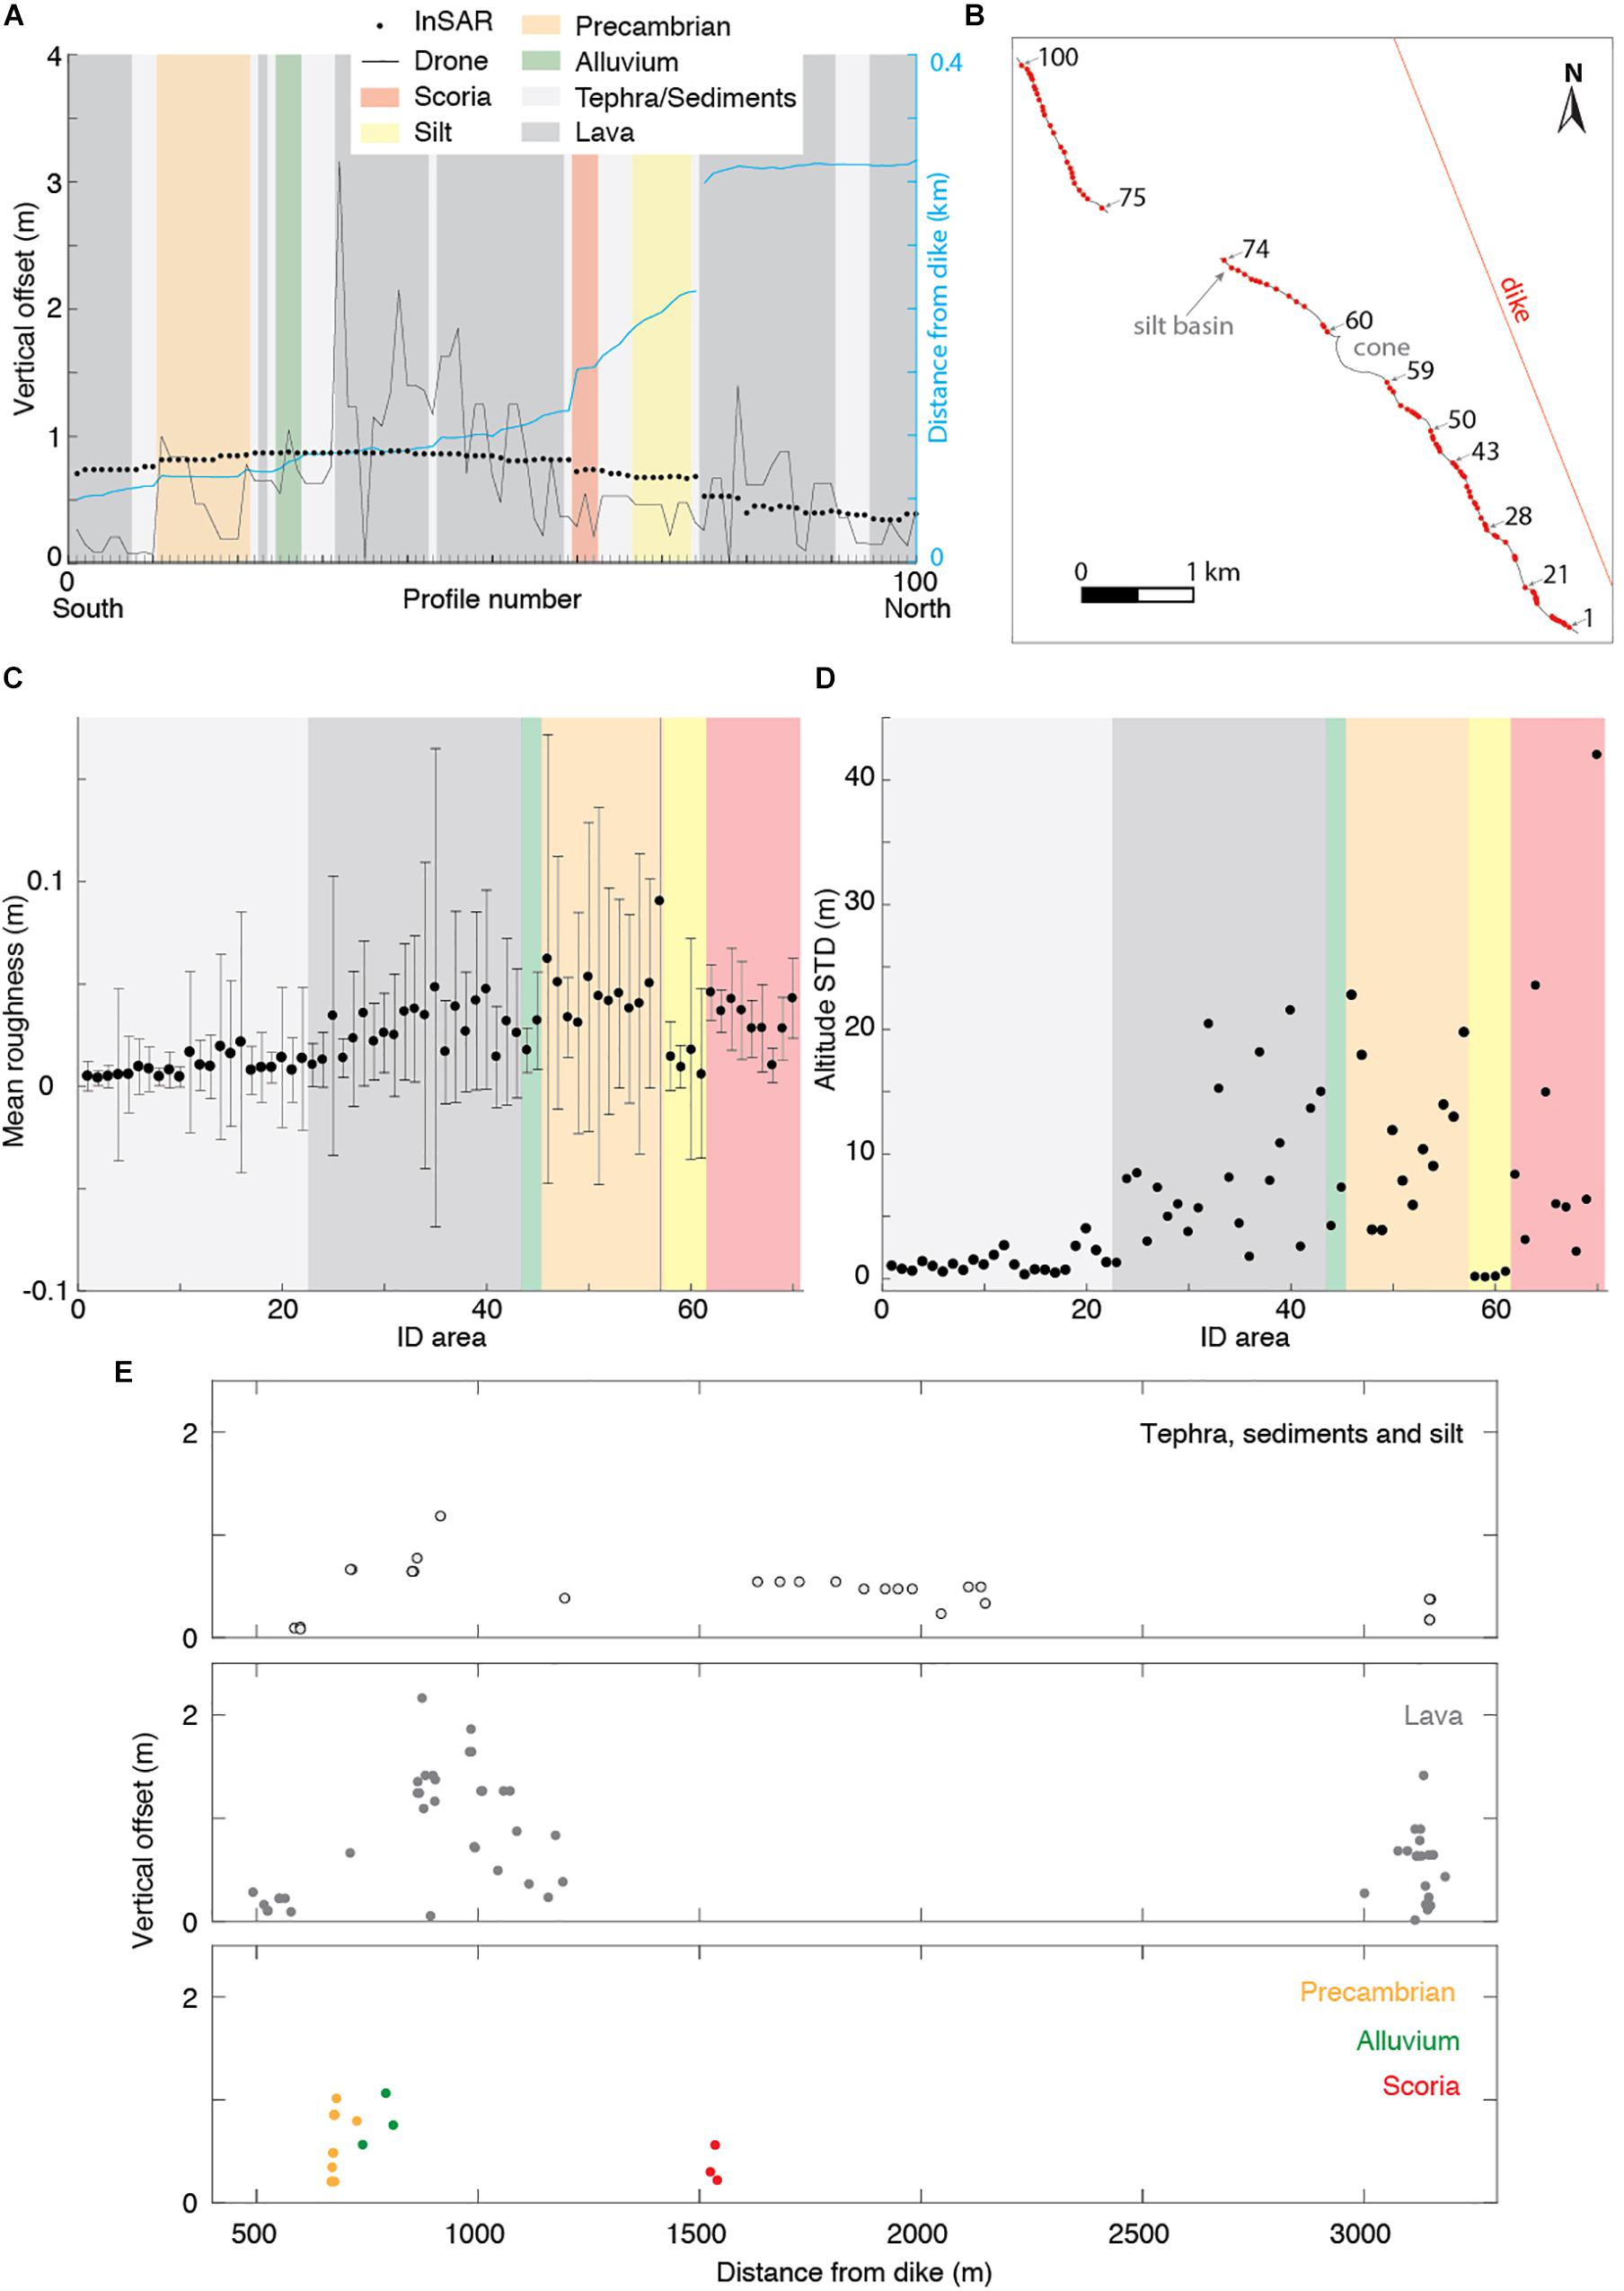
Figure 8. Comparison between vertical offsets measured from the drone-derived high-resolution DEM and vertical displacements due to the 2009 dike intrusion estimated from InSAR data. (A) Vertical offsets at 100 locations along the fault from south to north with the background color indicating the lithology (“Alluvium” indicates the cemented colluvium from Pallister et al. (2010); for “sediments,” we mean unconsolidated sediments) and the light blue line is the distance between the fault and the inferred dike location (interrupted where the fault is not cropping out, i.e., between the segments H and I, see Figure 2). (B) Map of the 100 measurement locations (red dots) along the fault (black line) with some numbered for reference. (C) Mean values of surface roughness (error bars show standard deviation) and (D) standard deviations of elevation for 70 selected areas with different lithologies (ID is the identification number of each area) with the color background as in (A). For area locations and further details refer to Supplementary Figure S5 and Supplementary Table S1. (E) Vertical offsets measured (using the drone DEM) along the fault for different lithotypes as a function of distance from the dike.
To characterize the overall terrain irregularity for each lithotype, we used roughness terrain analysis based on our high-resolution DEM. The roughness was obtained by finding the maximum and minimum elevation value within a 3 × 3 pixel square surrounding each location and calculating the difference between these maximum and minimum values (Wilson et al., 2007). We extracted the mean roughness values over 70 different areas defined by uniform lithotype (Supplementary Figure S5 and Supplementary Table S1). As expected, the roughness changes according to the lithology type (Figure 8C) with higher roughness and roughness standard deviation (error bars) values on lava flows and Precambrian rocks (Figure 8C). Moreover, for the same areas, we also calculated the standard deviation of the altitude (Figure 8D) to understand the topographic variability for each lithotype. Whereas the variability is low (STD between 0 and 5 m) for unconsolidated deposits (tephra, sedimentary deposits, and silt), the variability is scattered and overall higher (>5 m) for hard rocks (e.g., lavas and Precambrian). In particular, the higher roughness values and topographic variability of lavas in Harrat Lunayyir are expected because these are usually a’a’ type lavas (Al-Amri et al., 2012), which typically give rise to an overall irregular surface composed of several lava blocks of different dimensions. Precambrian rocks, instead, are usually granitic in composition, forming a high and steep topography resulting in a rough surface. Lower and more homogeneous roughness values are associated with unconsolidated deposits (e.g., within the silt basin of segment H), which also show limited topographic variations in the field (Figures 8C,D).
To better understand the effect of the lithotype on the fault throws, we separately plotted the fault throws measured by using drone data for each lithotype as a function of the distance from the dike (Figure 8E). Fault throws are more variable closer to the dike irrespective of the lithotype. However, with increasing distance from the dike, the fault throws become homogeneous in unconsolidated sediments whereas within lava flows they remain highly scattered (Figure 8E).
Discussion
Fracture Patterns
We grouped all fractures within the dike-parallel and oblique segments mapped with the drone imagery into two separate plots and weighted the orientation frequency by the length of each fracture (Figures 9A,B). Fractures within dike-parallel segments are mostly N330° ± 10° oriented (37% of the data; up to 66% when considering an error of ± 20°), but those in the dike-oblique segments are rotated ∼30°, focusing around N295° ± 5° (24% of the data; up to 72% when considering an error of ± 20°; Figures 9A,B). To examine whether our fracture orientation dataset reflects larger scale structures seen in Harrat Lunayyir and the surrounding region, we compared it with orientations of: (1) all the fractures mapped from InSAR data of the 2009 intrusion (Figures 1c, 9C; Baer and Hamiel, 2010; Jónsson, 2012); (2) eruptive fissures (or crater rows; Figure 9D); (3) aeromagnetic lineations (Figure 9E; Zahran et al., 2017) identified in and around the Harrat Lunayyir volcanic field (Figure 1b); (4) regional Oligo-Miocene dikes (Figures 1a, 9F; USGS map 1963; Bosworth et al., 2005; Bosworth and Stockli, 2016); and (5) regional faults and lineaments mapped in the northern Arabian shield (Figures 1a, 9G; Beziat and Bache, 1985).
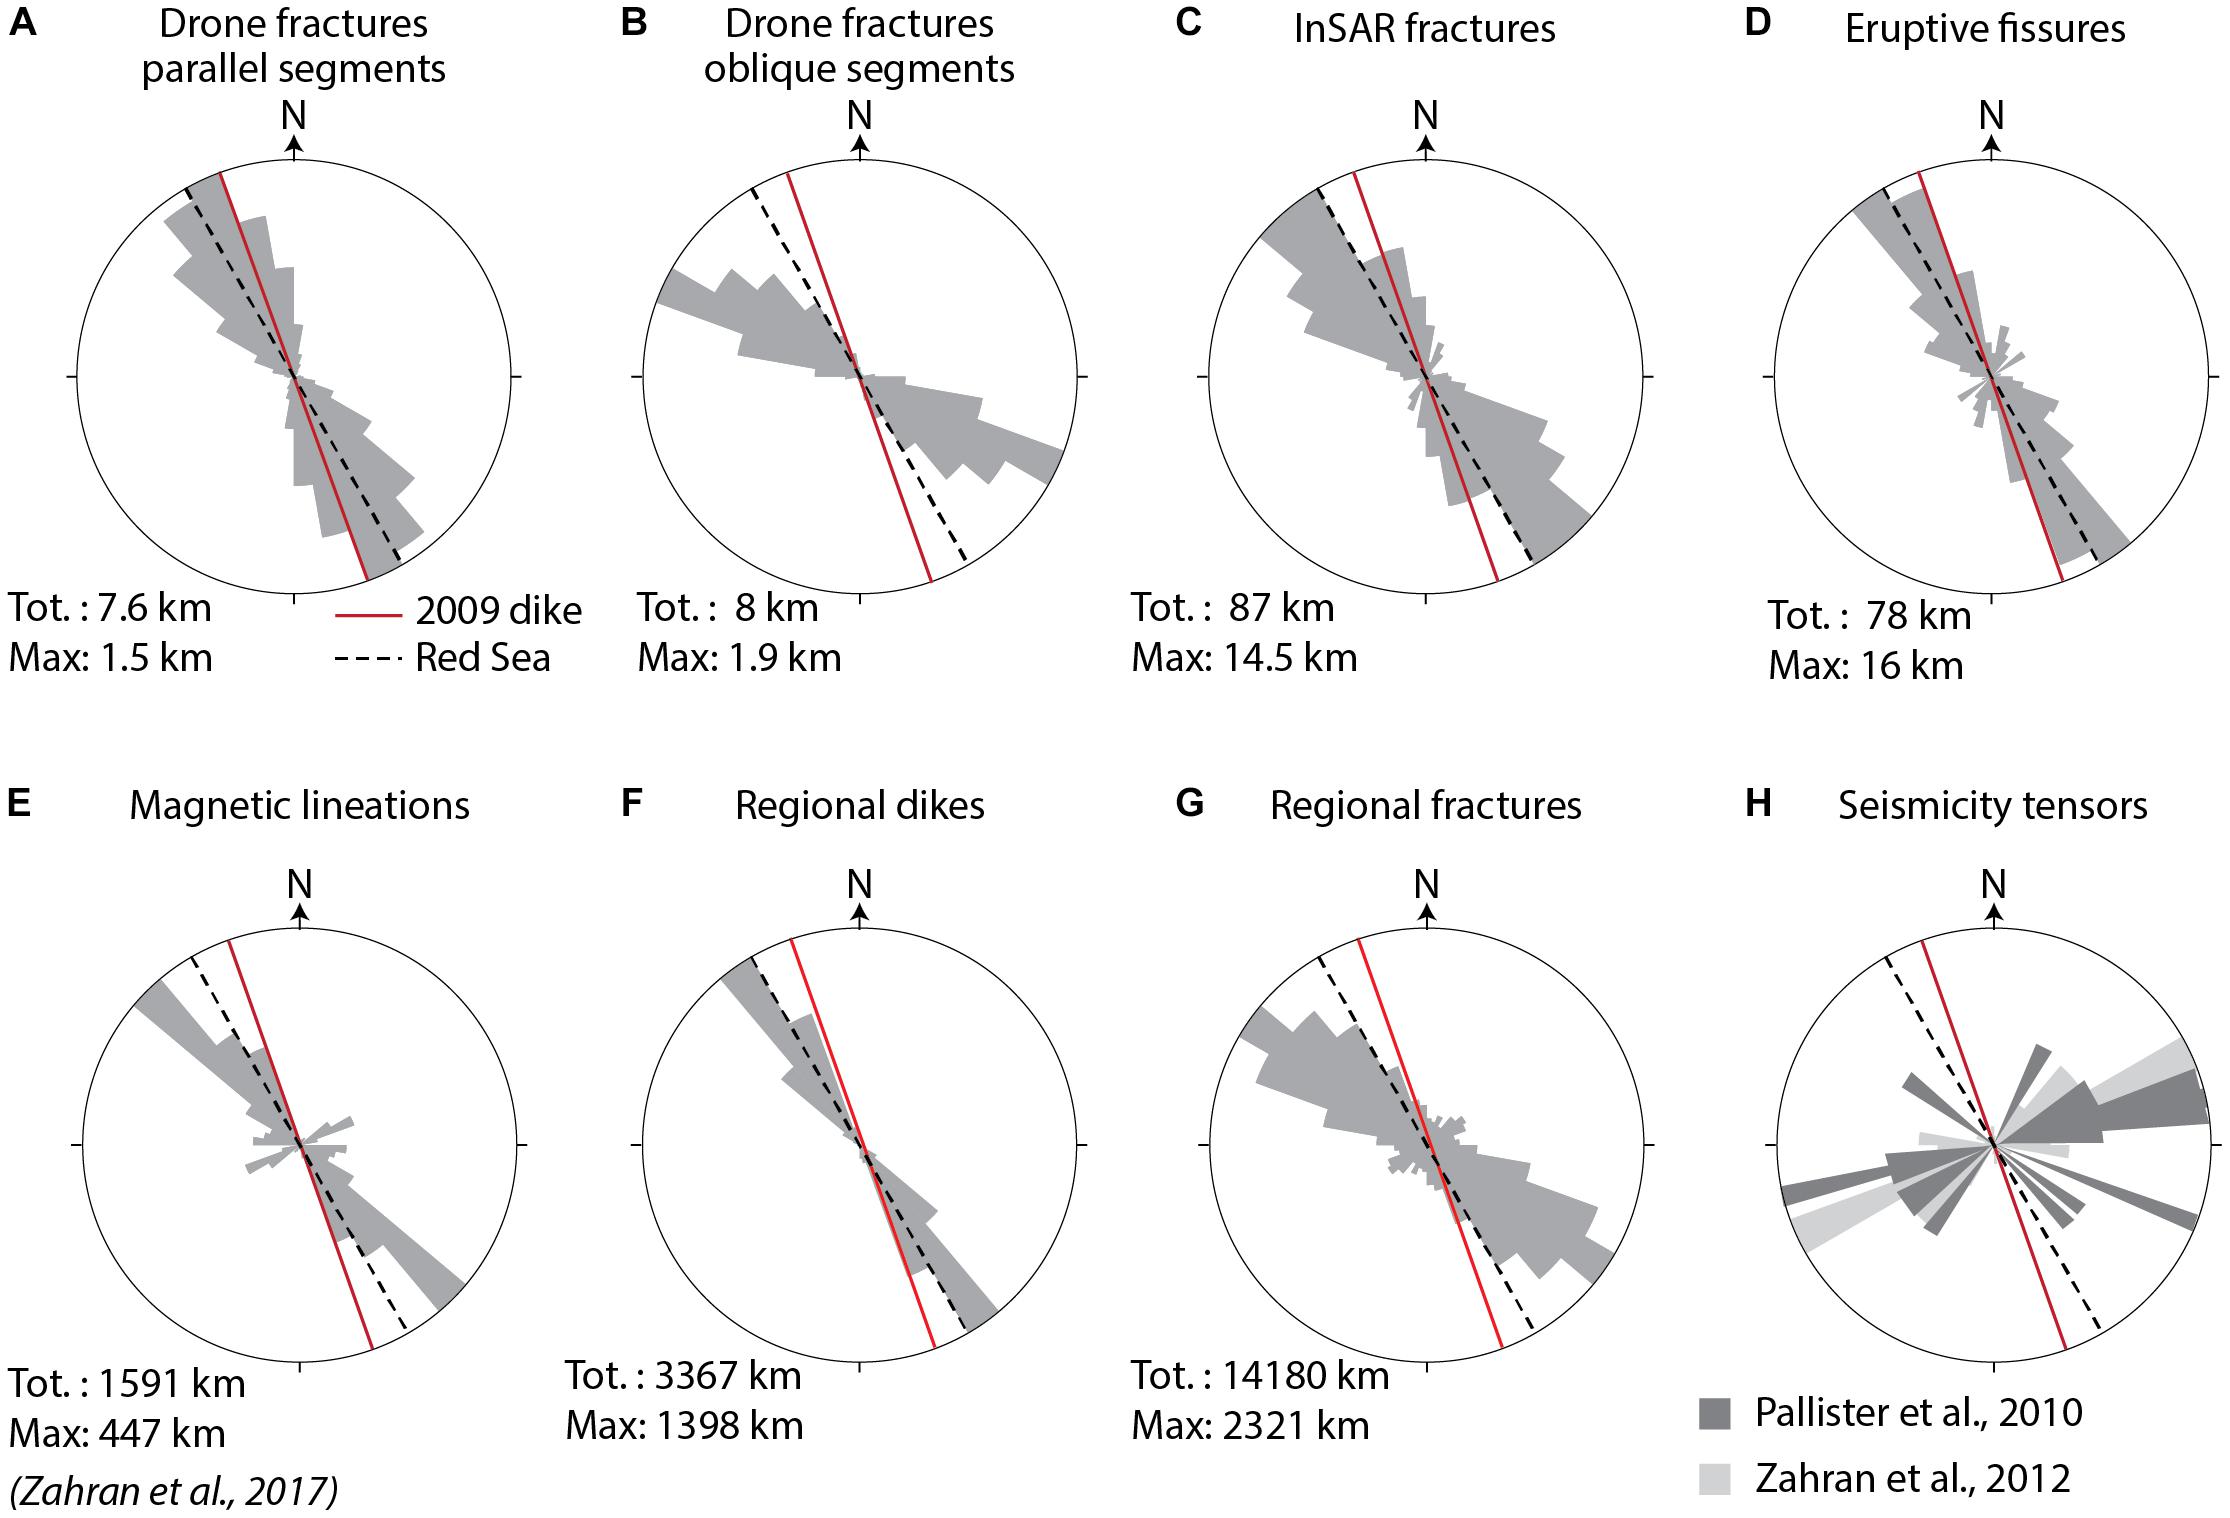
Figure 9. Rose diagrams showing orientations of (A) fractures in dike-parallel; (B) in oblique segments; (C) fractures extracted from InSAR data (Jónsson, 2012) in the north-western Harrat Lunayyir of the 2009 dike intrusion (see also Figures 1b,c); (D) eruptive fissures (or crater rows) belonging to the Harrat Lunayyir volcanic field and mapped by using BingMaps and Google Earth images (see also Figure 1b); (E) magnetic lineations in the whole Harrat Lunayyir volcanic field (Zahran, 2017; Zahran et al., 2017); (F) coastal tertiary regional dikes (mapped from USGS map 1963); (G) regional faults and undefined lineaments in the northern (from 23°00′ to 28°00′ N) Arabian Shield (Beziat and Bache, 1985; Figure 1a). Total length (Tot.) and maximum length of fractures for the highest frequency azimuth (Max) are reported for each rose diagram. (H) Tensional stress axis orientation obtained by using focal mechanisms from earthquakes with M4.0 to M5.4 during the seismic crisis associated with the 2009 intrusion event (Pallister et al., 2010) or 84 earthquakes related to the May 19th 2009 swarm (Al-Zahrani et al., 2012). Red solid and black dashed lines, respectively indicate the inferred 2009 dike strike (N340°, Pallister et al., 2010) and the overall Red Sea orientation (N330°).
The InSAR dataset did not have enough resolution to clearly distinguish between dike parallel and oblique fractures (in Figure 1c) but did show that 34% of the data focus in the NNW-SSE direction (N320° ± 10°; up to 75% of the data in the range N320° ± 30°), which is similar to the orientation of fractures mapped from the drone images within the dike parallel segments (Figure 9C). Eruptive fissures and crater rows within the Harrat Lunayyir volcanic field that we mapped from satellite images (Google Earth and Bing Maps; Figure 1b) also show the same trend (40% are N330° ± 10° oriented; 60% when considering ± 20°). Aeromagnetic lineations (enclosed in the areas of 24°30′N – 26°00′N and 37°00′E – 38°30′E; Zahran et al., 2017) show two main orientations (Figure 9E): one NW-SE (N315° ± 5° for 28% of data) possibly related to the Najd fault system, and the other NNW-SSE (N330° ± 10° for 30% of the data) probably related to the old regional gabbro dikes parallel to the Red Sea (called “coastal dikes”; Zahran et al., 2017). The presence of Red Sea parallel regional dikes under Harrat Lunayyir agrees with surface observations along the entire Saudi Arabian coastline where the Oligo-Miocene rift-parallel “coastal” dikes (N325° ± 15° oriented for 88% of data; Figure 9F) formed at the onset of Red Sea rifting (∼24–23 Ma; Figure 1a; Bosworth et al., 2005; Bosworth and Stockli, 2016). Overall, these data suggest that the main volcano-tectonic trend in Harrat Lunayyir is NNW-SSE, broadly parallel to the overall Red Sea trend (∼N330°, Figure 10A) and only slightly different from the fracture pattern orientation of the central Red Sea axis (Figure 10A; Augustin et al., 2014). This observation is consistent with the fact that magma-induced faults and open fractures usually form parallel to dike intrusions, which in turn are parallel to the overall orientation of a rift and perpendicular to the minimum compressive stress σ3.
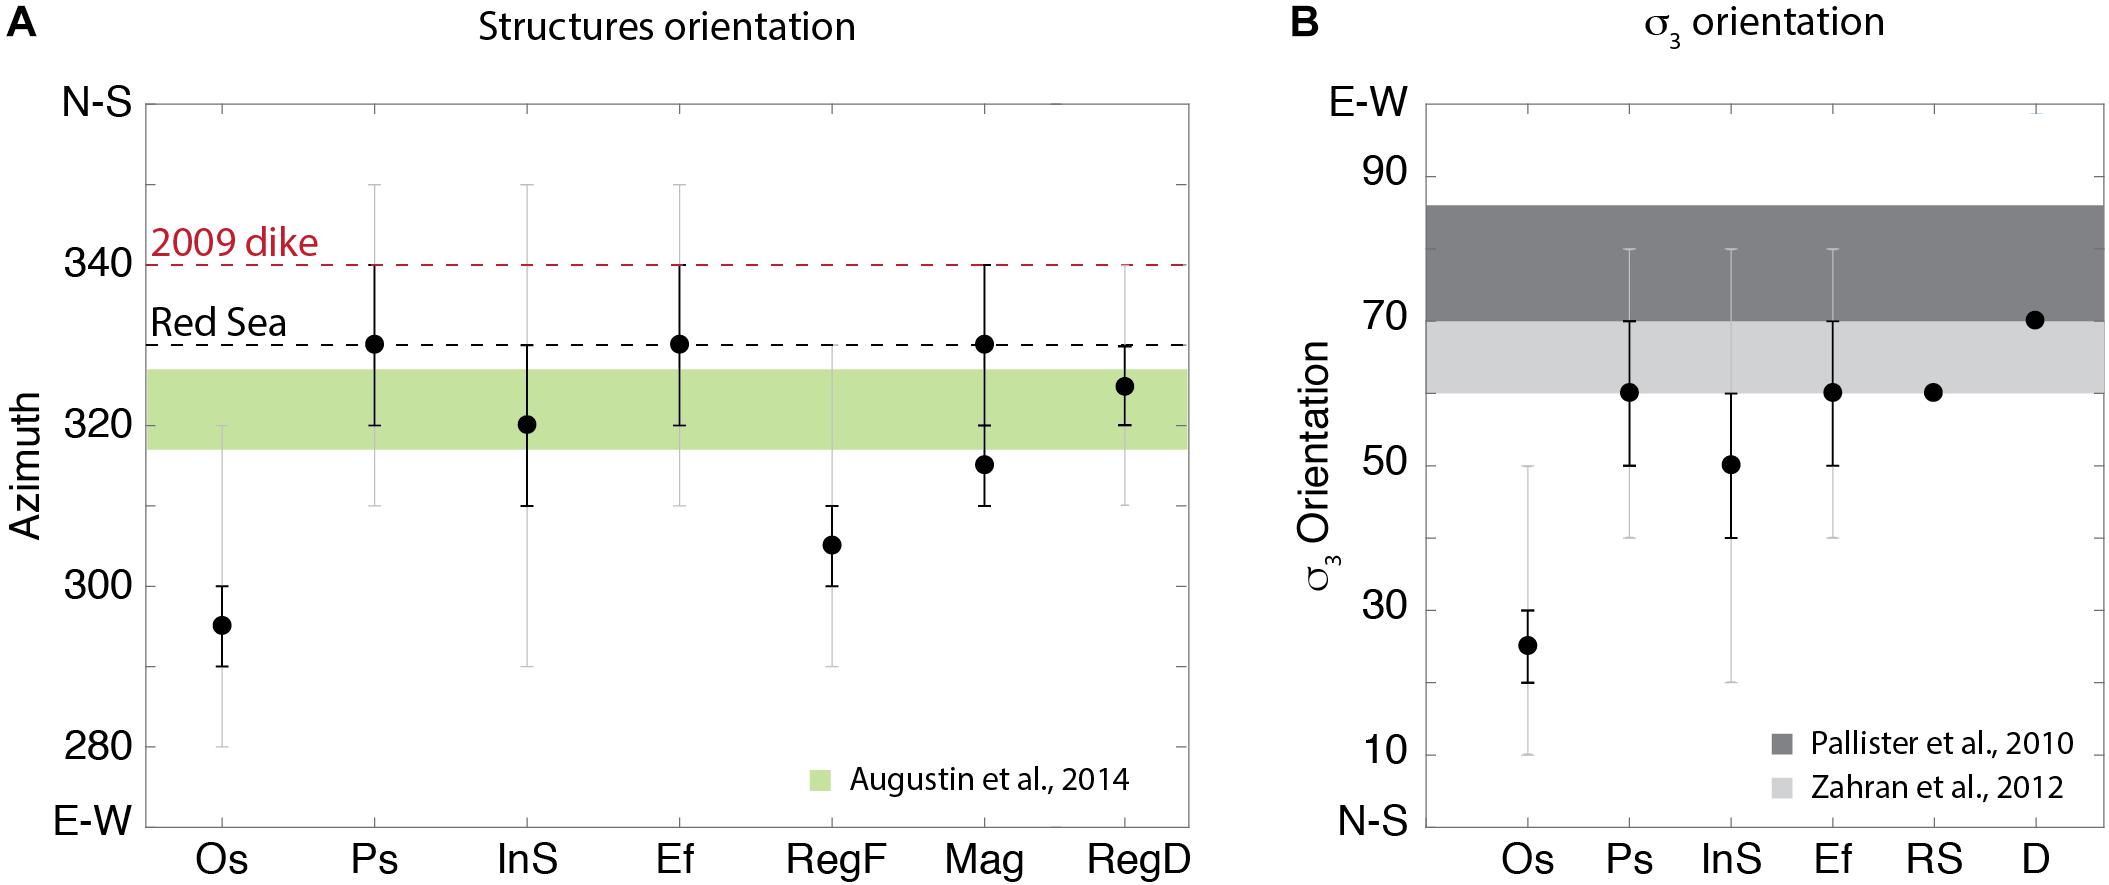
Figure 10. Comparison of (A) magmatic and tectonic structure orientations and (B) minimum compressional stress directions inferred using orientations of magmatic and tectonic structures along with tension axes of focal mechanisms from Pallister et al., 2010 (dark gray) and Zahran, 2017 (light gray). In (A), the green area indicates the orientation of 736 fractures mapped by Augustin et al. (2014) in the central Red Sea (from latitude 23°N to 19°N), the red and black dashed lines indicate the 2009 dike and the overall Red Sea orientation, respectively. Symbols: Os, fractures mapped within oblique segments by using drone data; Ps, fractures mapped within dike parallel segments by using drone data; InS, fractures obtained by InSAR data; Ef, eruptive fissure (or crater rows) from the Harrat Lunayyir volcanic field; RegF, regional faults in the northern Arabian Shield; Mag, aeromagnetic lineations (Zahran, 2017; Zahran et al., 2017); RegD, regional Tertiary dikes; D, 2009 dike; RS, Red Sea. The mean azimuth value in each dataset is indicated by the black dot. Error bars indicate the azimuth range for a given number of features (in %) in each dataset. Black error bars include: 24% of features for Os, 37% for Ps, 34% for InS, 40% for Ef, 16% for RegF, 28% and 30% for Mag, and 42% for RegD. Light gray error bars include: 72% of features for Os, 66% for Ps, 75% for InS, 60% for Ef, 54% for RegF, and 88% for RegD.
The NW-SE fracture trend of the dike-oblique segments, on the other hand, does not appear to be clearly linked to existing structures, which raises questions about the origin of the dike-oblique segments. Xu et al. (2016) used analog modeling of a dike intrusion to investigate the geometry and kinematics of fractures formed in 2009 at Harrat Lunayyir (Figure 11a). They used an analog dike that was arch-shaped and asymmetrical along the strike and thus closer to the surface, nearer to the dike’s central part than its tips. The dike shape was inferred from the InSAR-modeled dike and the seismicity of the 2009 event, which are both shallower under the southern part of the graben than under the northern part (Mukhopadhyay et al., 2013; Xu et al., 2016; Abdelfattah et al., 2017). In the analog model, the fractures formed at the surface as a consequence of the dike opening; the fractures were closer to the dike where the dike was shallower but further away where the dike was deeper. The faults formed gradually by merging the small dike-parallel fractures and they increased in length (along the strike) as the analog dike width increased (Supplementary Figure S1). Connections between dike-parallel segments were provided early in the model run by dike oblique fractures (Supplementary Figure S1 and Figure 10A). The fracture pattern observed in the analog model is similar to that of the western fault in Harrat Lunayyir. This suggests that the oblique segments formed to link dike-parallel segments which, in turn, formed at different distances from the dike because of its variable depth. The linkage along the strike of propagating faults has been widely observed in rifts with structures such as open fractures, zones of no fracturation and relay ramps, which are expressions of soft linkage in accommodation zones between shifted (in map view) normal faults (e.g., Peacock, 2002; Peacock and Parfitt, 2002; Tentler, 2005; Fossen and Rotevatn, 2016).
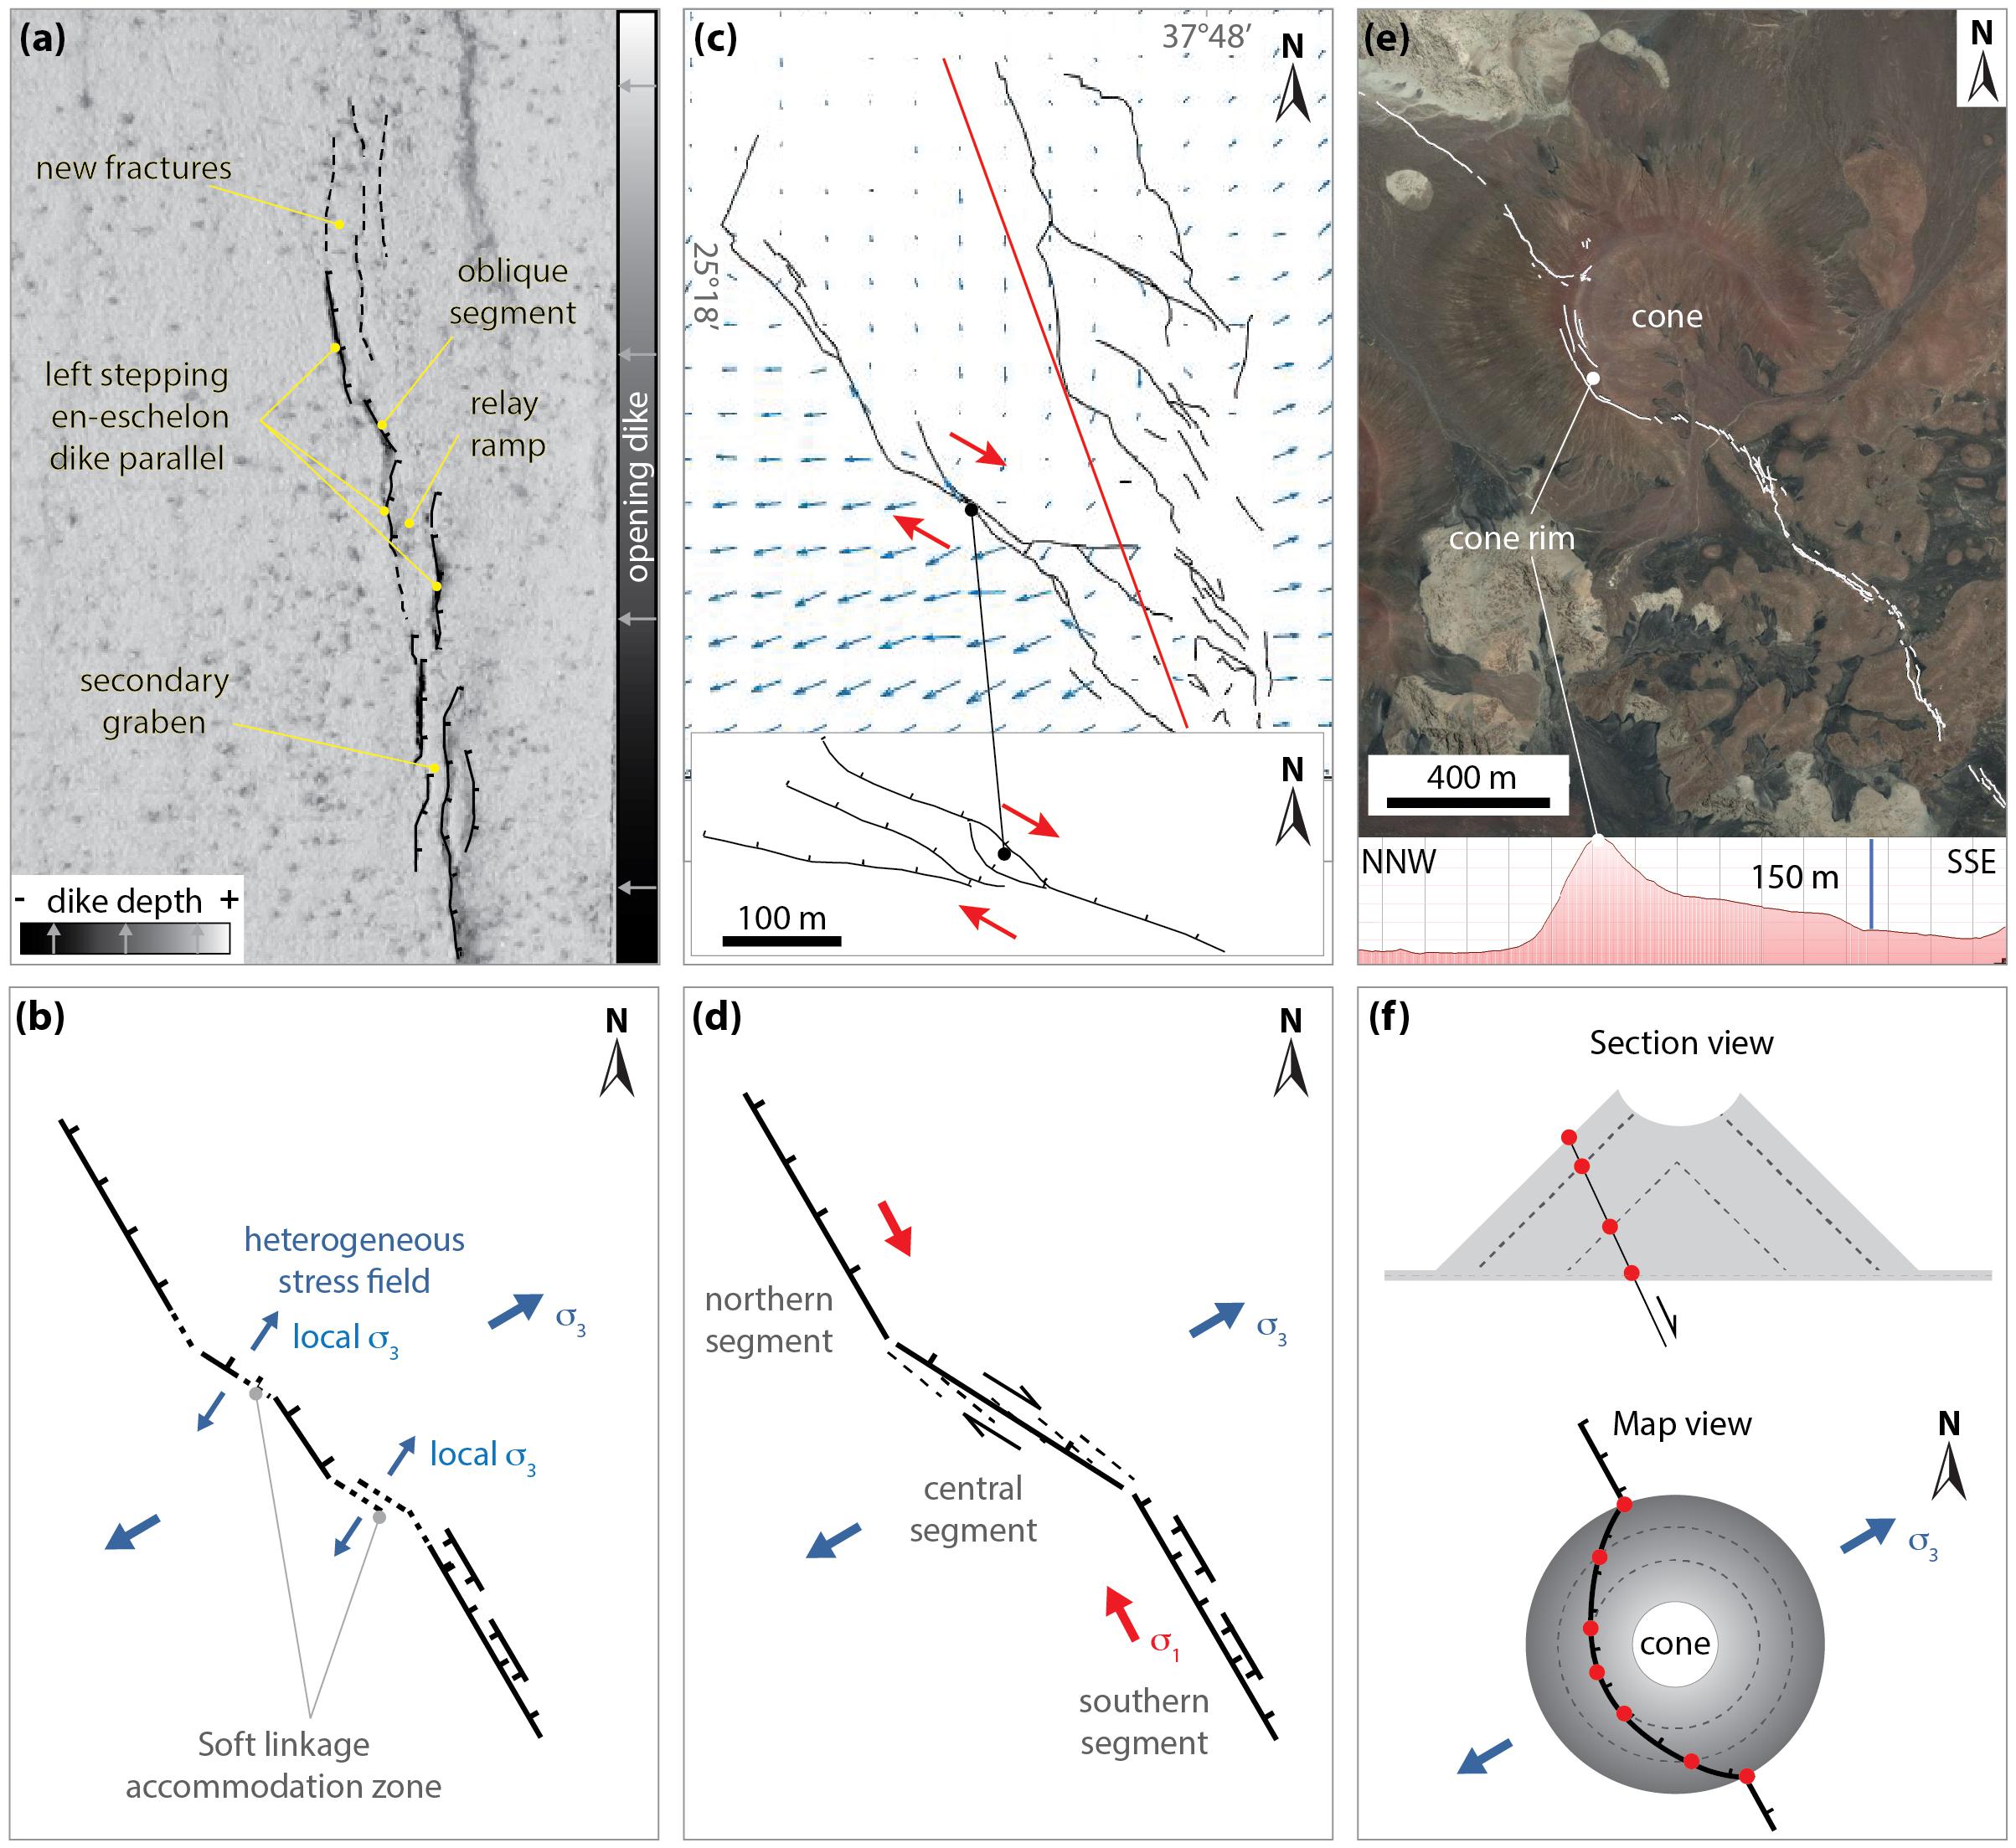
Figure 11. Kinematic interpretation of the western fault pattern. (a) Fracture pattern (black lines) in map view from the analog model by Xu et al. (2016); dataset from Corbi et al., 2019 EPOS repository), (b) Schematic figure of the accommodation zone in which σ3 can be locally re-oriented at the tips of the overlapping faults. (c) Horizontal displacement vectors (blue arrows) and fractures (black lines) mapped using InSAR data in the area affected by the 2009 dike intrusion (Jónsson, 2012). The inset shows the main fault branches near the northern tip of segment H (see also Figure 4b). Red arrows indicate the inferred sense of the shear component of motion. (d) Schematic model of the major segments of the western fault (see also Figure 2) along with the inferred σ3 orientation. Black solid lines represent the dike parallel faults whereas dashed lines are en-echelon fractures on the oblique segment. (e) Western fault pattern (white line) and topography along the fault where it passes through the volcanic cone. (f) Schematic model of the topographic effect induced by a cone on an ideal 75° normal fault. Section view (above) of the fault intersecting a cone of different heights (dashed lines), with red dots indicating locations where the fault reaches the surface. Map view (below) showing the fault surface rupture across the cone (gray shaded) and the overall σ3 orientation.
Based on the information above, detailed mapping of the fault segmentation appears to be of crucial importance to understand the relationship between dike intrusions and the associated fracture patterns. Indeed, based on a lower-resolution Bing Map dataset, Al Shehri and Gudmundsson (2018) suggested that since the overall strike of the western fault is not parallel to the dike strike; thus, it could not have formed as a direct consequence of the 2009 dike intrusion. However, our drone mapping shows that the apparent overall strike of the western fault is mainly a result of many offset fault segments where each segment is parallel to the dike and thus compatible with the expected strike of a dike-induced fault. In addition, the same authors also suggested that the dike itself could not account for the formation of new fractures within the whole northern Harrat Lunayyir and that an additional influence of the regional extensional tectonics is required. This implies that the graben formed before the 2009 dike intrusion as a result of the continuous tectonic stretching of the upper crust (Al Shehri and Gudmundsson, 2018). The concept of a large deformed area with pre-existing fractures is supported both by our field observations (Figure 7) and by the fact that the western faults seem to be longer than what is visible at the surface (Aboud et al., 2018). However, our field observations of the reactivated fault plane also suggest that the last slip event of the western fault (about 1.5 m) occurred over a short time interval (dike-driven slip), which is in agreement with the InSAR data that show the whole fractured area was reactivated during the 2009 event (Baer and Hamiel, 2010; Jónsson, 2012), thus supporting strong dike – fault interactions. However, if one dike is not sufficient to form such a large fracture zone (Al Shehri and Gudmundsson, 2018), repeated dike intrusions may account for the gradual growing of the graben and repeated fault reactivation, which would also explain the higher vertical displacement (Figure 8A) and longer length (Aboud et al., 2018) of the western fault. This process is common in slow spreading rifts, where repeated dike intrusions at depth enhance the graben growth at the surface by reactivating pre-existing faults and creating new ones (e.g., Mastin and Pollard, 1988; Biggs et al., 2009, 2013; Nobile et al., 2012; Trippanera et al., 2015a,b; Urbani et al., 2015; Wauthier et al., 2015; Acocella and Trippanera, 2016; Hjartardóttir et al., 2016; Ruch et al., 2016). The presence of several NNW-SSE aligned eruptive fissures in the Harrat Lunayyir provide further proof that repeated similar dike intrusions have occurred over time. From this perspective, the dike opening simulated in the analog model performed by Xu et al. (2016) may possibly be associated with the intrusion of a swarm of dikes with similar geometry, rather than a single dike, which gradually shaped the asymmetric graben. In addition, a fault slip due to magma migration at depth during the inter-diking periods cannot be excluded (Dumont et al., 2017). In this case the tectonic stretching may have played a key role in creating the conditions (in terms of strain deficit accumulation) to focus the dike swarm along the NNW-SSE direction while dike intrusions may easily reactivate the graben faults and create new fractures in the nearfield.
In contrast to the western fault, the portion of the eastern fracture zone covered by our drone survey is composed of isolated fractures that do not connect different parts of a single fault. Several isolated NW-SE oriented fractures are also present to the east of the dike, both to the north and south of our survey area (Figure 1c). This orientation is comparable with the strike of regional faults and lineaments (54% of the data N310° ± 20°, or 16% of the data N305° ± 5° considering an area from 23°00′N to 28°00′N; Figures 9G, 10A) of the Najd fault system affecting the Arabian Shield (Figure 1a; Moore, 1979; Stern, 1985; Agar, 1987; Sultan et al., 1988; Al-Husseini, 2000; Johnson and Woldehaimanot, 2003; Bosworth et al., 2005; Stern and Johnson, 2010) and probably encompassing the Harrat Lunayyir area (Zahran et al., 2017). This indicates that during the dike intrusion small patches of pre-existing old structures may have been reactivated. While at a regional scale these faults are largely aseismic, some recent activity has been detected close to one such NW-SE oriented structure ∼70 km northwest of Harrat Lunayyir (Youssof et al., 2018). This suggests that changes in co-diking stress possibly triggered a slip at depth on old inherited regional structures, breaching the surface along the NW direction.
Stress Estimation and Fracture Kinematics
Considering a purely extensional kinematic of the NNW-SSE oriented structures, the estimated orientation of the present-day minimum horizontal compressive stress (σ3) would be ENE-WSW (N60° ± 10° considering both fractures mapped from drone images within the dike-parallel segments and eruptive fissures and crater rows in the whole Harrat Lunayyir). This orientation is in agreement with the σ3 direction inferred from focal mechanisms of earthquakes (Mw 4.0 to Mw 5.4) that occurred during the 2009 dike intrusion (Figure 9H; N78° ± 8° in Pallister et al., 2010 and N65° ± 5° in Al-Zahrani et al., 2012), and the expected σ3 (N70°) for the dike with N340° orientation (Figure 10B). Moreover, since the age of the volcanic products in Harrat Lunayyir varies from Tertiary to Quaternary (Al-Amri et al., 2012), the focusing of the eruptive fissures and crater rows in the same direction suggests that the principal stress directions in the area have remained stable for millions of years.
The angle between the orientation of the dike-oblique fractures (NW-SE oriented) and the estimated direction of the σ3 is 20° – 40°, but not 90° as would be expected for pure opening kinematics. This suggests that dextral shear stresses could be present on these dike-oblique fractures (Figure 10B). However, in the case of linkage structures, the local stress field in fault-overlap areas may be rotated (stress heterogeneous zones), due to the influence of along-strike fault propagation (Figure 11b; Crider and Pollard, 1998; Rowland and Sibson, 2001; Fossen and Rotevatn, 2016; Zwaan et al., 2016). Thus, prominent lateral shear on the oblique fault planes is not required. In fact, we detected no clear evidence in the field of right-lateral shear displacement on the oblique segments linking dike-parallel faults. However, segment H within the central portion of the western fault (Figures 2, 11c) represents a major oblique feature (∼45° from the dike strike) that goes through a silt basin. This feature expresses a left-stepping en-echelon pattern at a small scale (Figures 4d,e), similar to that of a pull-apart at an embryonic stage (Figures 4a,b). Our observations suggest the presence of some dextral shear motion along this central segment of the fault; an interpretation that agrees with the horizontal displacement field derived from the InSAR data (Figures 11c,d; Jónsson, 2012).
We also observed a clear left-stepping en-echelon pattern where the western fault crosses the monogenic volcanic cone (Figures 3, 11e). In this particular case, the fault trace in the map view bends toward the crater rim suggesting an effect of the topography of the cone (Figure 11f). A similar effect has been observed both in analog models and in nature; for example, along the eruptive fissure of Lakagígar (Iceland), the graben induced by the dike intrusion widens in correspondence with the higher topography of Laki hill (Figure 11b; Trippanera et al., 2015b) and no shear is required on these fault planes.
Ultimately, we suggest that the fault pattern of Harrat Lunayyir is mainly controlled by the present-day stress field with a σ3 oriented roughly ENE-WSW. We suggest that the fault pattern is also influenced by several local and regional factors that are, in order of importance: the depth to the upper tip of the dike (or dike swarm) (Figure 12); the linkage between propagating fractures (Figure 11a); the presence of high topographic areas (Figures 11e,f) and the presence of NW-SE inherited structures.
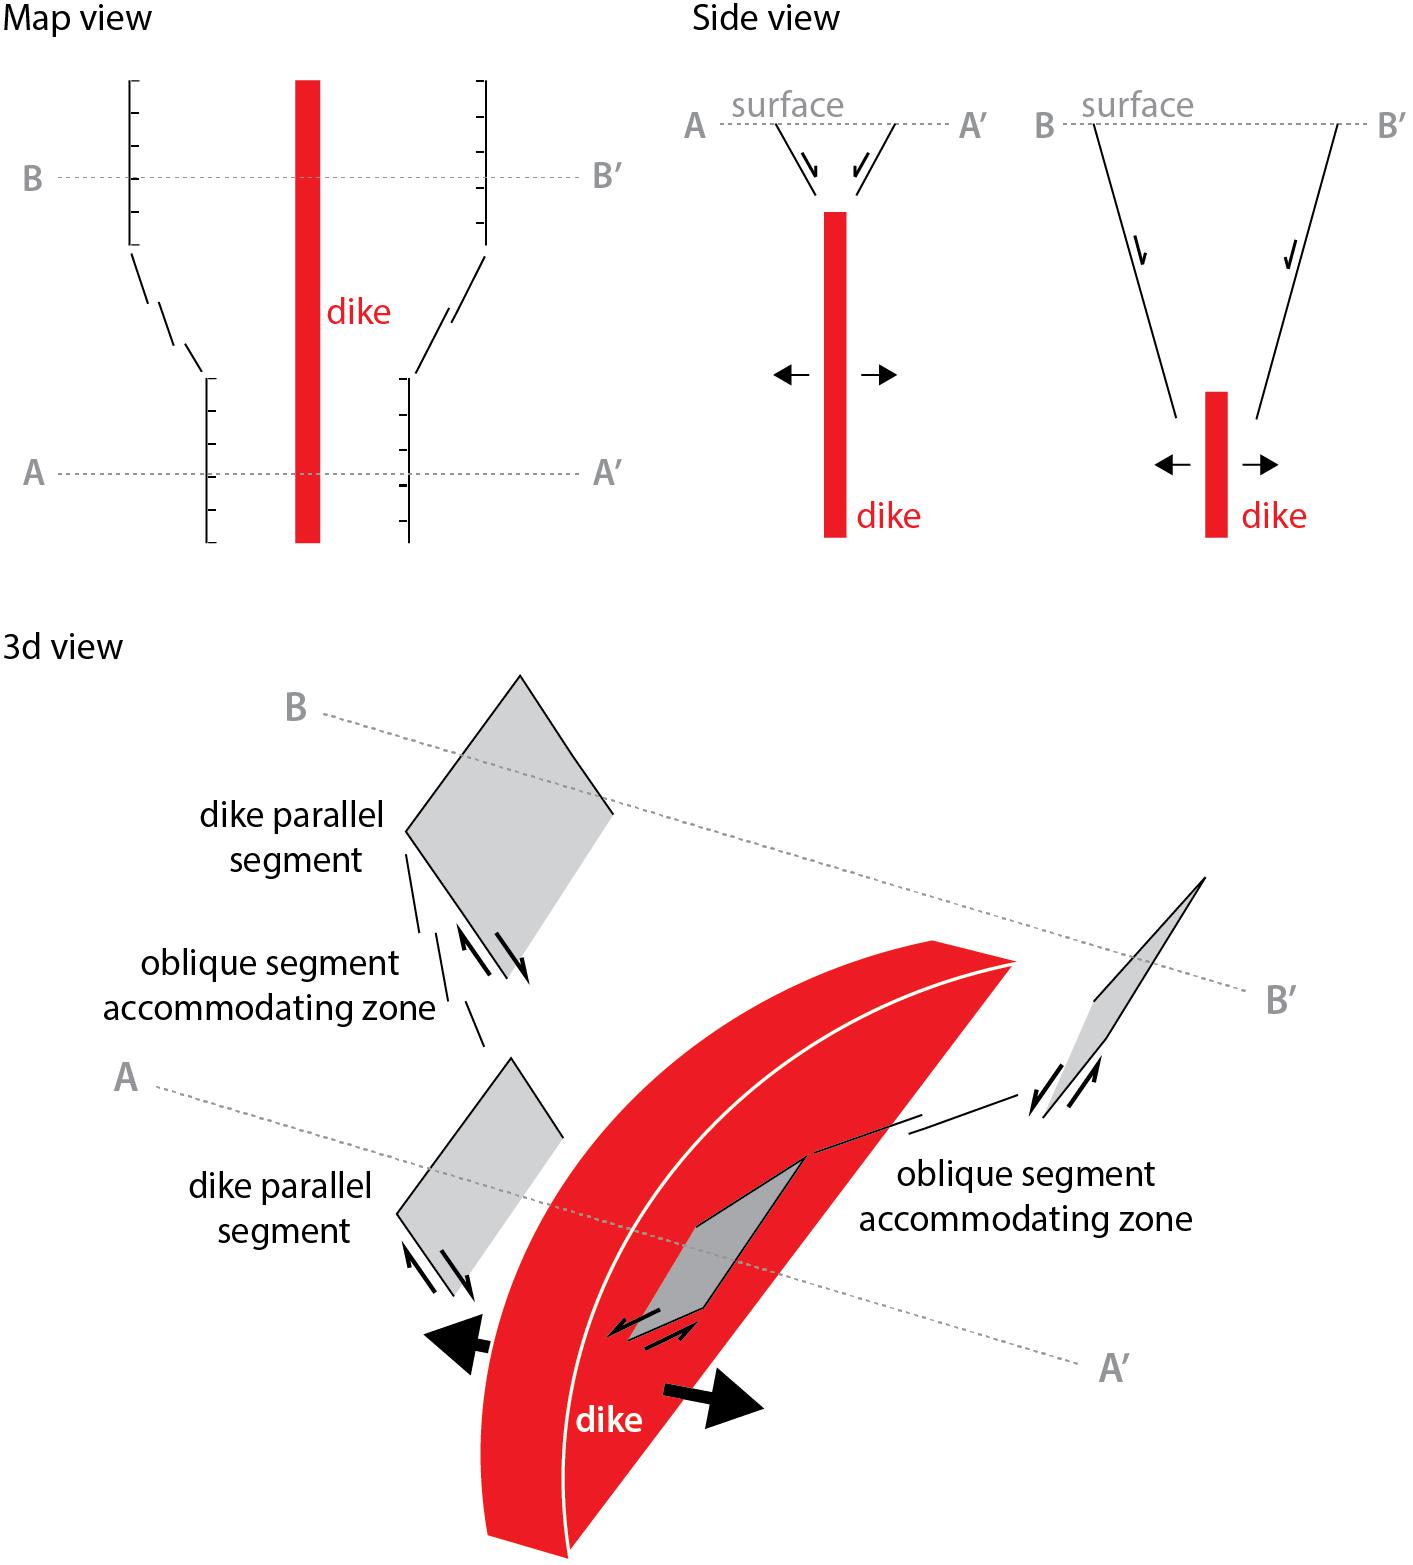
Figure 12. Schematic model showing the relationships between dike depth and new or reactivated tectonic segments both parallel and oblique to the dike strike. The top of the dike is arc shaped (3D view) with its upper tip at shallower depth under profile A-A′ than under profile B-B′ (side view panel). Shallow dike tips induce narrow grabens at the surface, while deep tips cause wide grabens, resulting in horizontal shifts between dike parallel segments, connected by oblique segments (map view panel). The oblique segments form an accommodation zone between the shifted dike parallel segments.
Vertical Offsets
The vertical offsets along the western fault are highly variable and large discrepancies exist between our drone data and the InSAR derived offsets at several locations (Figure 8A). The origin of these discrepancies is mainly related to the different spatial and temporal resolution of the two techniques. While the resolution of InSAR imaging can reach ∼1 m or even better for some sensors, the data are usually spatially averaged, yielding a final pixel size of tens of meters that is about three orders of magnitude larger than that of the drone imagery (a few centimeters).
Thanks to the high resolution of the drone dataset we revealed that the fault-scarp geometry and its vertical offsets are highly dependent on the local lithology (Figures 6, 7). In particular, the higher variability and the largest fault offset values correspond to lava flows. The morphology of these flows is usually undulated with small-scale local topography highs (as suggested by the variable roughness values and high standard deviation of elevation values; Figures 8C,D), which can lead to apparent vertical fault offset values that are highly variable (Tentler and Mazzoli, 2005; Rowland et al., 2007; Tentler and Temperley, 2007).
Considering the temporal resolution, the InSAR data capture only the displacement related to the 2009 dike intrusion (i.e., the changes over days to months) whereas the drone data provide the current topography and thus, the cumulative vertical offsets of the fault that is likely related to multiple intrusion events, possible post-diking deformation and long-term tectonic stretching (Al Shehri and Gudmundsson, 2018). Our field observations clearly show that a 3–4 m fault scarp expressed in a lava flow along the western fault was not formed entirely during the last intrusion event, but was reactivated during the 2009 intrusion with additional 1–2 m of slip (Figure 7c). These latter values are closer to the maximum offset seen in the InSAR data (Pallister et al., 2010). This observation of fault reactivation has not been reported by previous studies (Pallister et al., 2010) but it is in agreement with Al Shehri and Gudmundsson (2018), who suggested that only the fractures in the very near field of the 2009 dike are newly formed fractures. The evidence of a pre-existing graben fault, subjected to reactivation, also agrees with data from seismic sections showing that several buried faults are present in northern Harrat Lunayyir (Zahran, 2017), and these faults are arranged in a graben-like configuration with large vertical offsets.
The inhomogeneity of the lava flows cut by fault throws is due to a combination of several factors, such as the irregular surface with blocks of various dimensions, small scale undulation due to the flow, the presence of pre-existing cooling joints and the cumulative slip of pre-existing, partially buried, reactivated faults. In contrast, the unconsolidated deposits are strongly affected by wind and water erosion, resulting in a retro-gradation of the fault scarp (Figures 7e,f) and in an overall flat and smooth surface, as suggested by the homogeneous roughness values and the low standard deviation of the altitude (Figure 8). The drone-derived fault offsets on unconsolidated deposits may be slightly underestimated after 10 years of erosion compared to those measured by InSAR in 2009 (Figure 8A). Therefore, our results suggest a strong interplay between the lithology and the temporal evolution of displacements in shaping the fault geometry and producing the final amount of vertical offset at the surface.
Using high spatial resolution drone images combined with InSAR data acquired during the 2009 dike intrusion and during fieldwork, we were able to observe the along fault offset variations due to the lithology, and to isolate the displacement induced by a single episode from the cumulative deformation in place following thousands of years of activity. This study verifies the use of drones and InSAR as two complementary tools that allow us to unravel deformation in volcanic areas covering different spatial and temporal scales.
Conclusion
In this work, we performed a drone-based structural mapping survey to map an extensive dike- induced fault and fracture zone in western Saudi Arabia. We integrated high-resolution drone data with classical structural field observations and compared our results with InSAR data and other regional tectonic information. The drone survey allowed us to obtain a 3.4 cm ground resolution dataset, i.e., much higher resolution than that of InSAR, and to cover larger areas than typically covered by classical fieldwork alone. The use of drones therefore fills a resolution gap between field and satellite observations.
By applying our integrated approach to the fractures induced by the 2009 dike intrusion in the northern portion of the Harrat Lunayyir volcanic area, we have reached the following conclusions:
• The fracture pattern induced by the 2009 dike intrusion has two dominant structural orientations consisting of dike-parallel (NNW-SSE: ∼N330°) and oblique segments (NW-SE: ∼N300°).
• The NNW-SSE dike-parallel segments represent the main tectono-magmatic deformation trend in the Harrat Lunayyir area, indicating that σ3 is oriented WSW-ENE (∼N70°E).
• The NW-SE oblique segments are accommodating zones, allowing a soft linkage between spatially shifted NNW-SSE segments, whose shifts are due to differences in dike depth along its strike.
• The possibility that inherited regional NW-SE oriented structures were reactivated by the dike intrusion cannot be excluded.
• The 2009 dike intrusion induced a fault slip of up to 1.5 m on the western fault. Cumulative slip on reactivated faults was detected in several places and was found to be as large as ∼4 m, indicating that the fault zone has been activated in multiple rifting events in the past.
Data Availability
All datasets generated for this study are included in the manuscript and/or the Supplementary Files.
Author Contributions
DT wrote the manuscript, acquired the data in the field, and analyzed the data. JR was the PI of the project, acquired the data in the field, and contributed to the manuscript writing. LP acquired the data in the field, processed the drone images, and contributed to the manuscript writing. SJ was the PI of the project and contributed to the manuscript writing.
Funding
The research reported in this publication was supported by the King Abdullah University of Science and Technology (KAUST), BAS/1/1353-01-01.
Conflict of Interest Statement
The authors declare that the research was conducted in the absence of any commercial or financial relationships that could be construed as a potential conflict of interest.
Acknowledgments
We would like to thank the FalconViz, a KAUST startup company (www.falconviz.com) for providing drones and making the drone survey possible under challenging geographic and climatic conditions. In particular, we would like to acknowledge Hussam Altalhi, Ahmad Hasanat, and Jarvis Cline (all from FalconViz) for their work in the field and for processing the drone images to DEMs and orthophotos. We thank Rémi Matrau (KAUST), Laura Parisi (KAUST), Henriette Sudhaus (University of Kiel), Matthieu Ribot (IPGP) and the seismotectonics students from KAUST for their help in the field, and Fabio Corbi (Roma Tre University) for providing data and fruitful discussions about the analog models.
Supplementary Material
The Supplementary Material for this article can be found online at: https://www.frontiersin.org/articles/10.3389/feart.2019.00168/full#supplementary-material
FIGURE S1 | Maps of a selected portion of segment G along the western fault showing the DEM, the ortho-photo blended with hillshade information, terrain roughness and slope. The stereonet shows pole density (with 1% area method: %value = n(100)/N where n is the number of points falling in an area of the plot and N is the total number of points) of faults and open fractures measured in the field at this location. The black dot is the 2009 dike pole. The stereonet plot was generated using the Stereonet software by Allmendinger et al. (2012) and Cardozo and Allmendinger (2013).
FIGURE S2 | Evolution of deformation patterns induced by an arc-shaped analog dike (modified from Xu et al., 2016). The extent of dike opening increases from (a) 0.32 cm to (f) 0.6 cm. See Xu et al. (2016) and the dataset by Corbi et al. (2019) for further details.
FIGURE S3 | The drone ortho-photo of the surveyed area along the western fault after blending it with hillshade information using the QGis software. Refer to the Pix4d software report for further details on the western fault data processing.
FIGURE S4 | The drone ortho-photo of the surveyed area in the eastern fracture zone after blending it with hillshade information using the QGis software.
FIGURE S5 | Map of sampled areas used to calculate the roughness and the topography standard deviation for different lithotypes (see also Figures 8C,D). Numbers identify each area. See Supplementary Table S1 for more details.
TABLE S1 | Mean, median and standard deviation (STD) of roughness and elevation for each area of Supplementary Figure S5.
Footnotes
References
Abdelfattah, A. K., Mogren, S., and Mukhopadhyay, M. (2017). Mapping b-value for 2009 harrat lunayyir earthquake swarm, western Saudi Arabia and Coulomb stress for its mainshock. J. Volcanol. Geother. Res. 330, 14–23. doi: 10.1016/j.jvolgeores.2016.12.001
Aboud, E., Shareef, A., Alqahtani, F. A., and Mogren, S. (2018). Using a 3D gravity inversion technique to image the subsurface density structure in the Lunayyir volcanic field, Saudi Arabia. J. Asian Earth Sci. 161, 14–24. doi: 10.1016/j.jseaes.2018.05.002
Acocella, V. (2014). Structural control on magmatism along divergent and convergent plate boundaries: overview, model, problems. Earth Sci. Rev. 136, 226–288. doi: 10.1016/j.earscirev.2014.05.006
Acocella, V., and Trippanera, D. (2016). How diking affects the tectonomagmatic evolution of slow spreading plate boundaries: overview and model. Geosphere 12, 867–883. doi: 10.1130/GES01271.1
Agar, R. A. (1987). The Najd fault system revisited; a two-way strike-slip orogen in the Saudi Arabian Shield. J. Struct. Geol. 9, 41–48. doi: 10.1016/0191-8141(87)90042-3
Al Shehri, A., and Gudmundsson, A. (2018). Modelling of surface stresses and fracturing during dyke emplacement: application to the 2009 episode at harrat lunayyir, Saudi Arabia. J. Volcanol. Geother. Res. 356, 278–303. doi: 10.1016/j.jvolgeores.2018.03.011
Al-Amri, A. M., Fnais, M. S., Abdel-Rahman, K., Morgen, S., and Al-Dabbagh, M. (2012). Geochronological dating and stratigraphic sequences of Harrat Lunayyir, NW Saudi Arabia. Int. J. Phys. Sci. 7, 2791–2805. doi: 10.5897/IJPS12.178
Al-Husseini, M. I. (2000). Origin of the arabian plate structures: amar collision and Najd Rift. GeoArabia 5, 527–542.
Allmendinger, R. W., Cardozo, N., and Fisher, D. (2012). Structural Geology Algorithms: Vectors and Tensors in Structural Geology. Cambridge: Cambridge University Press.
Al-Zahrani, H. A., Fnais, M. S., Al-Amri, A. M., and Abdel-Rahman, K. (2012). Tectonic framework of lunayyir area, northwest Saudi Arabia through aftershock sequence analysis of 19 May, 2009 earthquake and aeromagnetic data. Int. J. Phys. Sci. 7, 5821–5833. doi: 10.5897/IJPS12.356
Augustin, N., Devey, C. W., Van der Zwan, F. M., Feldens, P., Tominaga, M., Bantan, R. A., et al. (2014). The rifting to spreading transition in the Red Sea. Earth Planet. Sci. Lett. 395, 217–230. doi: 10.1016/j.epsl.2014.03.047
Baer, G., and Hamiel, Y. (2010). Form and growth of an embryonic continental rift: InSAR observations and modelling of the 2009 western Arabia rifting episode. Geophys. J. Int. 182, 155–167. doi: 10.1111/j.1365-246X.2010.04627.x
Beziat, P., and Bache, J. J. (1985). Metallic Mineral Deposits Map of the Arabian Shield Kingdom of Saudi Arabia. DMMR – BRGM Joint Special Publication.
Biggs, J., Amelung, F., Gourmelen, N., Dixon, T. H., and Kim, S. W. (2009). InSAR observations of 2007 Tanzania rifting episode reveal mixed fault and dyke extension in an immature continental rift. Geophys. J. Int. 179, 549–558. doi: 10.1111/j.1365-246X.2009.04262.x
Biggs, J., Chivers, M., and Hutchinson, M. C. (2013). Surface deformation and stress interactions during the 2007–2010 sequence of earthquake, dyke intrusion and eruption in northern Tanzania. Geophys. J. Int. 195, 16–26. doi: 10.1093/gji/ggt226
Blanchette, A. R., Klemperer, S. L., Mooney, W. D., and Zahran, H. M. (2018). Two-stage Red Sea rifting inferred from mantle earthquakes in Neoproterozoic lithosphere. Earth Planet. Sci. Lett. 497, 92–101. doi: 10.1016/j.epsl.2018.05.048
Bohannon, R. G. (1986). Tectonic configuration of the western arabian continental margin, southern Red Sea. Tectonics 5, 477–499. doi: 10.1029/TC005i004p00477
Bonali, F. L., Tibaldi, A., Marchese, F., Fallati, L., Russo, E., Corselli, C., et al. (2019). UAV-based surveying in volcano-tectonics: an example from the Iceland rift. J. Struct. Geol. 121, 46–64. doi: 10.1016/j.jsg.2019.02.004
Bonforte, A., Guglielmino, F., and Puglisi, G. (2019). Large dyke intrusion and small eruption: the December 24, 2018 Mt. Etna eruption imaged by Sentinel-1 data. Terra Nova 1–8. doi: 10.1111/ter.12403
Bosworth, W., Huchon, P., and McClay, K. (2005). The red sea and gulf of aden basins. J. Afr. Earth Sci. 43, 334–378. doi: 10.1016/j.jafrearsci.2005.07.020
Bosworth, W., and Stockli, D. F. (2016). Early magmatism in the greater red sea rift: timing and significance. NRC Res. Press 1176, 1158–1176. doi: 10.1139/cjes-2016-0019
Brown, G. F., Schmidt, D. L., and Huffman, A. C. (1989). Geology of the Arabian Peninsula; Shield Area of Western Saudi Arabia (Reston, VA: U.S. Geological Survey). doi: 10.3133/pp560a
Buck, W. R. (2006). The role of magma in the development of the Afro-arabian rift system. Geol. Soc. 259, 43–54. doi: 10.1144/GSL.SP.2006.259.01.05
Buck, W. R., Einarsson, P., and Brandsdóttir, B. (2006). Tectonic stress and magma chamber size as controls on dike propagation: constraints from the 1975–1984 Krafla rifting episode. J. Geophys. Res. 111:B12404. doi: 10.1029/2005jb003879
Calais, E., d’Oreye, N., Albaric, J., Deschamps, A., Delvaux, D., Déverchère, J., et al. (2008). Strain accommodation by slow slip and dyking in a youthful continental rift, East Africa. Nature 456, 783–787. doi: 10.1038/nature07478
Camp, V. E., and Roobol, M. J. (1992). Upwelling asthenosphere beneath western Arabia and its regional implications. J. Geophys. Res. 97:15255. doi: 10.1029/92JB00943
Camp, V. E., Roobol, M. J., and Hooper, P. R. (1991). The Arabian continental alkali basalt province: Part II. Evolution of harrats khaybar, ithnayn, and kura, kingdom of Saudi Arabia. Geol. Soc. Am. Bull. 103, 363–391. doi: 10.1130/0016-7606(1991)103<0363:tacabp>2.3.co;2
Cardozo, N., and Allmendinger, R. W. (2013). Spherical projections with OSXStereone. Comput. Geosci. 51, 193–205. doi: 10.1016/j.cageo.2012.07.021
Chang, S. J., Merino, M., Van Der Lee, S., Stein, S., and Stein, C. A. (2011). Mantle flow beneath arabia offset from the opening Red Sea. Geophys. Res. Lett. 38, 1–5. doi: 10.1029/2010GL045852
Corbi, F., Xu, W., Rivalta, E., and Sigurjon, J. (2019). Supplement to: graben formation and dike arrest during the 2009 Harrat Lunayyir dike intrusion in Saudi Arabia: insights from InSAR, stress calculations and analog experiments. GFZ Data Serv. doi: 10.5880/fidgeo.2019.003
Corti, G. (2009). Earth-science reviews continental rift evolution: from rift initiation to incipient break-up in the main ethiopian rift, East Africa. Earth Sci. Rev. 96, 1–53. doi: 10.1016/j.earscirev.2009.06.005
Crider, J. G., and Pollard, D. D. (1998). Fault linkage: three-dimensional mechanical interaction faults. J. Geophys. Res. 103, 24373–24391. doi: 10.1038/ncomms3340
Di Felice, F., Mazzini, A., Di Stefano, G., and Romeo, G. (2018). Drone high resolution infrared imaging of the Lusi mud eruption. Mar. Pet. Geol. 90, 38–51. doi: 10.1016/j.marpetgeo.2017.10.025
Downs, D. T., Stelten, M. E., Champion, D. E., Dietterich, H. R., Nawab, Z., Zahran, H., et al. (2018). Volcanic history of the northernmost part of the harrat rahat volcanic field, Saudi Arabia. Geosphere 14, 1253–1282. doi: 10.1130/GES01625.1
Dumont, S., Klinger, Y., Socquet, A., Doubre, C., and Jacques, E. (2017). Magma influence on propagation of normal faults: evidence from cumulative slip profiles along Dabbahu-Manda-Hararo rift segment (Afar, Ethiopia). J. Struct. Geol. 95, 48–59. doi: 10.1016/j.jsg.2016.12.008
Ebinger, C., Ayele, A., Keir, D., Rowland, J. V., Yirgu, G., Wright, T., et al. (2010). Length and timescales of rift faulting and magma intrusion: the afar rifting cycle from 2005 to present. Annu. Rev. Earth Planet. Sci. 38, 439–466. doi: 10.1146/annurev-earth-040809-152333
Ebinger, C., Van Wijk, J., and Keir, D. (2013). The time scales of continental rifting: implications for global processes. Geol. Soc. Am. 2500, 1–26. doi: 10.1130/2013.2500(11)
Ebinger, C. J., Keir, D., Ayele, A., Calais, E., Wright, T. J., Belachew, M., et al. (2008). Capturing magma intrusion and faulting processes during continental rupture: seismicity of the Dabbahu (Afar) rift. Geophys. J. Int. 174, 1138–1152. doi: 10.1111/j.1365-246X.2008.03877.x
Eriksson, P. I., Riishuus, M. S., and Elming, S. -Å. (2014). Magma flow and palaeo-stress deduced from magnetic fabric analysis of the Alftafjorthur dyke swarm: implications for shallow crustal magma transport in Icelandic volcanic systems. Geol. Soc. 396, 1–26. doi: 10.1144/SP396.6
Eyles, J. H., Illsley-Kemp, F., Keir, D., Ruch, J., and Jonssón, S. (2018). Seismicity associated with the formation of a new island in the Southern Red Sea. Front. Earth Sci. 6:141. doi: 10.3389/feart.2018.00141
Forslund, T., and Gudmundsson, A. (1992). Structure of tertiary and pleistocene normal faults in Iceland. Tectonics 11, 57–68. doi: 10.1029/91tc01536
Fossen, H., and Rotevatn, A. (2016). Earth-science reviews fault linkage and relay structures in extensional settings — a review. Earth Sci. Rev. 154, 14–28. doi: 10.1016/j.earscirev.2015.11.014
Grandin, R., Socquet, A., Binet, R., Klinger, Y., Jacques, E., de Chabalier, J.-B., et al. (2009). September 2005 manda hararo-dabbahu rifting event, Afar (Ethiopia): constraints provided by geodetic data. J. Geophys. Res. 114, 1–20. doi: 10.1029/2008JB005843
Grandin, R., Socquet, A., Jacques, E., Mazzoni, N., De Chabalier, J. B., and King, G. C. P. (2010). Sequence of rifting in Afar, Manda-Hararo rift, Ethiopia, 2005-2009: time-space evolution and interactions between dikes from interferometric synthetic aperture radar and static stress change modeling. J. Geophys. Res. 115, 2005–2009. doi: 10.1029/2009JB000815
Gudmundsson, A. (1995). Infrastructure and mechnics of volcanic system in Iceland. J. Volcanol. Geother. Res. 64, 1–22. doi: 10.1016/0377-0273(95)92782-q
Gudmundsson, A., Lecoeur, N., Mohajeri, N., and Thordarson, T. (2014). Dike emplacement at Bardarbunga, Iceland, induces unusual stress changes, caldera deformation, and earthquakes. Bull. Volcanol. 76, 1–7. doi: 10.1007/s00445-014-0869-8
Gudmundsson, Å. (1987a). Geometry, formation and development of tectonic fractures on the Reykjanes Peninsula, southwest Iceland. Tectonophysics 139, 295–308. doi: 10.1016/0040-1951(87)90103-x
Gudmundsson, Å. (1987b). Tectonics of the thingvellir fissure swarm, SW Iceland. J. Struct. Geol. 9, 61–69. doi: 10.1016/0191-8141(87)90044-7
Gudmundsson, Å. (2000). Dynamics of volcanic system in Iceland: sxample of tectonism and volcanism at juxtaposed hot spot and mid-ocean ridge systems. Annu. Rev. Earth Planet. Sci. 28, 107–140. doi: 10.1146/annurev.earth.28.1.107
Gudmundsson, Å., and Backstrom, K. (1991). Structure and development of the Sveinagja graben, Northeast Iceland. Tectonophysics 200, 111–125. doi: 10.1016/0040-1951(91)90009-h
Hamling, I. J., Ayele, A., Bennati, L., Calais, E., Ebinger, C. J., Keir, D., et al. (2009). Geodetic observations of the ongoing Dabbahu rifting episode: new dyke intrusions in 2006 and 2007. Geophys. J. Int. 178, 989–1003. doi: 10.1111/j.1365-246X.2009.04163.x
Hansen, S. E., Deshon, H. R., Moore-Driskell, M. M., and Al-Amri, A. M. S. (2013). Investigating the P wave velocity structure beneath harrat lunayyir, northwestern Saudi Arabia, using double-difference tomography and earthquakes from the 2009 seismic swarm. J. Geophys. Res. EPlanet. 118, 4814–4826. doi: 10.1002/jgrb.50286
Hjartardóttir, Á. R., Einarsson, P., Gudmundsson, M. T., and Högnadóttir, T. (2016). Fracture movements and graben subsidence during the 2014 Bárdarbunga dike intrusion in Iceland. J. Volcanol. Geother. Res. 310, 242–252. doi: 10.1016/j.jvolgeores.2015.12.002
Hjartardóttir, Á. R., Einarsson, P., and Sigurdsson, H. (2009). The fissure swarm of the Askja volcanic system along the divergent plate boundary of N Iceland. Bull. Volcanol. 71, 961–975. doi: 10.1007/s00445-009-0282-x
James, M. R., and Robson, S. (2012). Straightforward reconstruction of 3D surfaces and topography with a camera: accuracy and geoscience application. J. Geophys. Res. 117, 1–17. doi: 10.1029/2011JF002289
James, M. R., and Varley, N. (2012). Identification of structural controls in an active lava dome with high resolution DEMs: volcn de Colima, Mexico. Geophys. Res. Lett. 39, 1–5. doi: 10.1029/2012GL054245
Johnson, P. R., and Woldehaimanot, B. (2003). Development of the arabian-nubian shield: perspectives on accretion and deformation in the northern East African Orogen and the assembly of Gondwana. Geol. Soc. 206, 289–325. doi: 10.1144/GSL.SP.2003.206.01.15
Jónsson, S. (2012). Tensile rock mass strength estimated using InSAR. Geophys. Res. Lett. 39, 1–5. doi: 10.1029/2012GL053309
Jónsson, S., and Xu, W. (2015). “Volcanic eruptions in the southern Red Sea during 2007–2013,” in The Red Sea. Springer Earth System Sciences, eds N. Rasul and I. Stewart (Berlin: Springer), 175–186. doi: 10.1007/978-3-662-45201-1_10
Keir, D., Hamling, I. J., Ayele, A., Calais, E., Ebinger, C., Wright, T. J., et al. (2009). Evidence for focused magmatic accretion at segment centers from lateral dike injections captured beneath the Red Sea rift in Afar. Geology 37, 59–62. doi: 10.1130/G25147A.1
Mastin, L. G., and Pollard, D. D. (1988). Surface deformation and shallow dike intrusion processes at Inyo Craters, Long Valley, California. J. Geophys. Res. 93, 13221–13235. doi: 10.1029/jb093ib11p13221
Moore, J. M. (1979). Primary and secondary faulting in the Najd Fault system, kingdom of Saudi Arabia. USGS Open File ReportOpen File Rep. 79, 1–22.
Mukhopadhyay, B., Mogren, S., Mukhopadhyay, M., and Dasgupta, S. (2013). Incipient status of dyke intrusion in top crust - evidences from the Al-Ays 2009 earthquake swarm, harrat lunayyir, SW Saudi Arabia. Geo. Nat. Hazards Risk 4, 30–48. doi: 10.1080/19475705.2012.663794
Németh, K., and Moufti, M. R. (2017). Geoheritage values of a mature monogenetic volcanic field in intra-continental settings: harrat khaybar. Kingdom of Saudi Arabia. Geoheritage 9, 311–328. doi: 10.1007/s12371-017-0243-2
Nobile, A., Pagli, C., Keir, D., Wright, T. J., Ayele, A., Ruch, J., et al. (2012). Dike-fault interaction during the 2004 dallol intrusion at the northern edge of the Erta Ale Ridge (Afar, Ethiopia). Geophysical Res. Lett. 39, 2–7. doi: 10.1029/2012GL053152
Nobile, A., Youssof, M., Trippanera, D., Zaharan, H. M., and Mai, M. (2019). Are recent seismic swarms around Harrat Lunayyir (Saudi Arabia) associated with magmatic intrusions? Geophys. Res. Abstr. 21:EGU2019-11243.
Pallister, J. S., McCausland, W. A., Jónsson, S., Lu, Z., Zahran, H. M., Hadidy, S., et al. (2010). Broad accommodation of rift-related extension recorded by dyke intrusion in Saudi Arabia. Nat. Geosci. 3, 705–712. doi: 10.1038/ngeo966
Paquet, F., Dauteuil, O., Hallot, E., and Moreau, F. (2007). Tectonics and magma dynamics coupling in a dyke swarm of Iceland. J. Struct. Geol. 29, 1477–1493. doi: 10.1016/j.jsg.2007.06.001
Peacock, D. C. P. (2002). Propagation, interaction and linkage in normal fault systems. Earth Sci. Rev. 58, 121–142. doi: 10.1016/s0012-8252(01)00085-x
Peacock, D. C. P., and Parfitt, E. A. (2002). Active relay ramps and normal fault propagation on kilauea volcano, Hawaii. J. Struct. Geol. 24, 729–742. doi: 10.1016/S0191-8141(01)00109-2
Rocca, R. (2016). “Low cost 3d mapping using a commercial drone/UAV: Application in structural geology,” in Proceedings of the International Conference and Exhibition, Barcelona, doi: 10.1190/ice2016-6462962
Rowland, J. V., Baker, E., Ebinger, C. J., Keir, D., Kidane, T., Biggs, J., et al. (2007). Fault growth at a nascent slow-spreading ridge: 2005 Dabbahu rifting episode, Afar. Geophys. J. Int. 171, 1226–1246. doi: 10.1111/j.1365-246X.2007.03584.x
Rowland, J. V., and Sibson, R. H. (2001). Extensional fault kinematics within the taupo volcanic zone, New Zealand: soft-linked segmentation of a continental rift system. New Zeal. J. Geol. Geophys. 44, 271–283. doi: 10.1080/00288306.2001.9514938
Rubin, A. M. (1992). Dike-induced faulting and graben subsidence in volcanic rift zones. J. Geophys. Res. 97, 1839–1858. doi: 10.1029/91JB02170
Ruch, J., Wang, T., Xu, W., Hensch, M., and Jónsson, S. (2016). Oblique rift opening revealed by reoccurring magma injection in central Iceland. Nat. Commun. 7:12352. doi: 10.1038/ncomms12352
Sanfilippo, A., Cai, M. Y., Jácome, A. P. G., and Ligi, M. (2018). “Geochemistry of the lunayyir and khaybar volcanic fields (Saudi Arabia): insights into the origin of cenozoic Arabian Volcanism,” in Geological Setting Palaeoenvironment and Archaeology of the Red Sea, eds M. A. Najeeb Rasul and C. F. Ian Stewart (Berlin: Springer), 389–415. doi: 10.1007/978-3-319-99408-6_18
Sigmundsson, F., Hooper, A., Hreinsdóttir, S., Vogfjörd, K. S., Ófeigsson, B. G., Heimisson, E. R., et al. (2015). Segmented lateral dyke growth in a rifting event at Bárðarbunga volcanic system, Iceland. Nature 517, 191–195. doi: 10.1038/nature14111
Stern, R. J. (1985). The Najd fault system, Saudi Arabia and Egypt: a late precambrian rift-related transform system? Am. Geophys. Union Pap. 5, 497–511. doi: 10.1371/journal.pone.0206079
Stern, R. J., and Johnson, P. (2010). Continental lithosphere of the Arabian Plate: a geologic, petrologic, and geophysical synthesis. Earth Sci. Rev. 101, 29–67. doi: 10.1016/j.earscirev.2010.01.002
Stern, R. J., and Johnson, P. R. (2019). “Constraining the opening of the Red Sea: evidence from the neoproterozoic margins and cenozoic magmatism for a volcanic rifted margin,” in Geological Setting Palaeoenvironment and Archaeology of the Red Sea, eds M. A. Najeeb Rasul and C. F. Ian Stewart (Berlin: Springer), 53–79. doi: 10.1007/978-3-319-99408-6_4
Stern, R. J., Nielsen, K. C., Best, E., and Kröner, A. (1990). Orientation of late precambrian sutures in the Arabian-Nubian shield. Geology 18, 1103–1106.
Stockli, D. F., and Bosworth, W. (2019). “Timing of extensional faulting along the magma-poor central and northern Red Sea rift margin—transition from regional extension to necking along a hyperextended rifted margin,” in Geological Setting, Palaeoenvironment and Archaeology of the Red Sea, eds M. A. Najeeb Rasul and C. F. Ian Stewart (Berlin: Springer), 81–111. doi: 10.1007/978-3-319-99408-6_5
Sultan, M., Arvidson, R. E., Duncan, I. J., Louis, S., and Stern, R. J. (1988). Extension of the Najd shear system from Saudi Arabia to the central eastern desert of Egypt based on integrated field and lansat observations. Tectonics 7, 1291–1306. doi: 10.1029/tc007i006p01291
Sze, L. T., Cheaw, W. G., Ahmad, Z. A., Ling, C. A., Chet, K. V., Lateh, H., et al. (2015). “High resolution DEM generation using small drone for interferometry SAR,” in Proceeding of the 2015 International Conference on Space Science and Communication (IconSpace), Langkawi.
Tentler, T. (2005). Propagation of brittle failure triggered by magma in Iceland. Tectonophysics 406, 17–38. doi: 10.1016/j.tecto.2005.05.016
Tentler, T., and Mazzoli, S. (2005). Architecture of normal faults in the rift zone of central north Iceland. J. Struct. Geol. 27, 1721–1739. doi: 10.1016/j.jsg.2005.05.018
Tentler, T., and Temperley, S. (2007). Magmatic fissures and their systems in Iceland: a tectonomagmatic model. Tectonics 26, 1–17. doi: 10.1029/2006TC002037
Trippanera, D., Acocella, V., Ruch, J., and Abebe, B. (2015a). Fault and graben growth along active magmatic divergent plate boundaries in Iceland and Ethiopia. Tectonics 34, 2318–2348. doi: 10.1002/2015TC003991
Trippanera, D., Ruch, J., Acocella, V., and Rivalta, E. (2015b). Experiments of dike-induced deformation: insights on the long-term evolution of divergent plate boundaries. J. Geophys. Res. 120, 1–30. doi: 10.1002/2014JB011850
Tryggvason, E. (1984). Widening of the Krafla fissure swarm during the 1975-1981 volcano-tectonic episode. Bull. Volcanol. 47, 47–69. doi: 10.1007/BF01960540
Urbani, S., Trippanera, D., Porreca, M., Kissel, C., and Acocella, V. (2015). Anatomy of an extinct magmatic system along a divergent plate boundary: Alftafjordur, Iceland. Geophys. Res. Lett. 42, 6306–6313. doi: 10.1002/2015GL065087
Vigliotti, L., Cai, M. Y., Rasul, N. M. A., and Al-Nomani, S. M. S. (2018). “Palaeomagnetism and Geochronology of the Harrats Lunayyir and Khaybar Lava Fields, Saudi Arabia,” in Geological Setting, Palaeoenvironment and Archaeology of the Red Sea, eds M. A. Najeeb Rasul and C. F. Ian Stewart (Berlin: Springer), 417–435. doi: 10.1007/978-3-319-99408-6-19
Walker, G. P. L. (1958). Geology of the reydarfjordur area, eastern Iceland. Q. J. Geol. Soc. 114, 367–391. doi: 10.1144/gsjgs.114.1.0367
Walker, G. P. L. (1974). “The structure of eastern Iceland,” in Geodynamics of Iceland and the North Atlantic Area NATO, Advanced Study Institute Held in Reykjavík, Iceland, ed. L. Kristjansson (Dordrecht: D. Reidel), 177–188. doi: 10.1007/978-94-010-2271-2_12
Walter, T. R., Jousset, P., Allahbakhshi, M., Witt, T., Gudmundsson, M. T., and Hersir, P. (2018). Underwater and drone based photogrammetry reveals structural control at Geysir geothermal field in Iceland. J. Volcanol. Geother. Res. 1–9. doi: 10.1016/j.jvolgeores.2018.01.010
Wauthier, C., Smets, B., and Keir, D. (2015). Diking-induced moderate-magnitude earthquakes on a youthful rift border fault: the 2002 nyiragongo-kalehe sequence, D.T. congo. Geochem. Geophys. Geosyst. 16, 4280–4291. doi: 10.1002/2015GC006110
Wilson, M. F. J., Connell, B. O., Brown, C., Guinan, J. C., Grehan, A. J., Wilson, M. F. J., et al. (2007). Multiscale terrain analysis of multibeam bathymetry data for habitat mapping on the continental slope. Mar. Geodesy 30, 3–35. doi: 10.1080/01490410701295962
Wright, T. J., Ebinger, C., Biggs, J., Ayele, A., Yirgu, G., Keir, D., et al. (2006). Magma-maintained rift segmentation at continental rupture in the 2005 Afar dyking episode. Nature 442, 291–294. doi: 10.1038/nature04978
Wright, T. J., Sigmundsson, F., Pagli, C., Belachew, M., Hamling, I. J., Brandsdóttir, B., et al. (2012). Geophysical constraints on the dynamics of spreading centres from rifting episodes on land. Nat. Geosci. 5, 242–250. doi: 10.1038/ngeo1428
Xu, W., Jónsson, S., Corbi, F., and Rivalta, E. (2016). Graben formation and dike arrest during the 2009 harrat lunayyir dike intrusion in Saudi Arabia: insights from InSAR, stress calculations and analog experiments. J. Geophys. Res. B Solid Earth 121, 2837–2851. doi: 10.1002/2015JB012505
Xu, W., Ruch, J., and Jonssón, S. (2015). Birth of two volcanic islands in the southern Red Sea. Nat. Commun. 6:7104. doi: 10.1038/ncomms8104
Youssof, M., Mai, P. M., Parisi, L., Tang, Z., Zahran, H. M., and Salah, Y. (2018). Earthquake swarm in non-volcanic areas of western Saudi Arabia: comparison of observations and imaging. Geophys. Res. Abstr. 20:EGU2018–EGU 16036.
Zahran, H. M. (2017). Seismic hazard assessment in harrat lunayyir, western Saudi Arabia. Soil Dyn. Earthquake Eng. 100, 428–444. doi: 10.1016/j.soildyn.2017.06.009
Zahran, H. M., and El-Hady, S. M. (2017). Seismic hazard assessment for harrat lunayyir – a lava field in western Saudi Arabia. Soil Dyn. Earthquake Eng. 100, 428–444. doi: 10.1016/j.soildyn.2017.06.009
Zahran, H. M., El-Hady, S. M., and Abuelnaga, H. S. (2017). Aeromagnetic data over harrat lunayyir and surrounding areas, western Saudi Arabia. Arabian J. Geosci. 10:63. doi: 10.1007/s12517-017-2849-8
Zanoni, D., Rasul, N. M. A., Langone, A., and Khorshid, M. (2019). “Microstructure and geochemistry of magmatic dykes from the Arabian Margin, Red Sea,” in Geological Setting, Palaeoenvironment and Archaeology of the Red Sea, eds M. A. Najeeb Rasul and C. F. Ian Stewart (Berlin: Springer), 437–471. doi: 10.1007/978-3-319-99408-6_20
Keywords: fault, volcanic field, drone, photogrammetry, dike intrusion
Citation: Trippanera D, Ruch J, Passone L and Jónsson S (2019) Structural Mapping of Dike-Induced Faulting in Harrat Lunayyir (Saudi Arabia) by Using High Resolution Drone Imagery. Front. Earth Sci. 7:168. doi: 10.3389/feart.2019.00168
Received: 24 April 2019; Accepted: 17 June 2019;
Published: 09 July 2019.
Edited by:
Yosuke Aoki, The University of Tokyo, JapanReviewed by:
Marco Neri, National Institute of Geophysics and Volcanology, ItalyLuis E. Lara, Sernageomin, Chile
Copyright © 2019 Trippanera, Ruch, Passone and Jónsson. This is an open-access article distributed under the terms of the Creative Commons Attribution License (CC BY). The use, distribution or reproduction in other forums is permitted, provided the original author(s) and the copyright owner(s) are credited and that the original publication in this journal is cited, in accordance with accepted academic practice. No use, distribution or reproduction is permitted which does not comply with these terms.
*Correspondence: Sigurjon Jonsson, c2lndXJqb24uam9uc3NvbkBrYXVzdC5lZHUuc2E=