- School of Plant and Environmental Sciences, Virginia Tech, Blacksburg, VA, United States
Soil respiration measurements are widely used to quantify carbon fluxes and ascertain soil biological properties related to soil microbial ecology and soil health, yet current methods to measure soil respiration either require expensive equipment or use discrete spot measurements that may have limited accuracy, and neglect underlying response dynamics. To overcome these drawbacks, we developed an inexpensive setup for measuring CO2 called the soil microbial activity assessment contraption (SMAAC). We then compared the SMAAC with a commercial infrared gas analyzer (IRGA) unit by analyzing a soil that had been subjected to two different management practices: grass buffer vs. row crop cultivation with tillage. These comparisons were done using three configurations that detected (1) in situ soil respiration, (2) CO2 burst tests, and (3) substrate induced respiration (SIR), a measure of active microbial biomass. The SMAAC provided consistent readings with the commercial IRGA unit for all three configurations tested, showing that the SMAAC can perform well as an inexpensive yet accurate tool for measuring soil respiration and microbial activity.
Introduction
Increased soil respiration due to warmer temperatures may exacerbate global climate change (Rustad et al., 2000; Davidson and Janssens, 2006; Bond-Lamberty et al., 2018), as soils currently have an gross efflux of ∼60 Gt C yr-1 and represent one of the two largest terrestrial sources of carbon fluxes. Sequestering more carbon in soils has become a goal of climate mitigation efforts, such as the four per mille initiative (Minasny et al., 2017), and with particular emphasis on soils that have been degraded by human activities (Lal, 2004). Soil respiration measurements can help to inform such sequestration efforts, while also providing a means to monitor the health, and function of agricultural soils (Mondini et al., 2010; Allen et al., 2011). In the laboratory, soil respiration measurements are used to interpret soil microbial characteristics, for example using assays like SIR (Bradford et al., 2010), carbon mineralization (Song et al., 2014), and catabolic response profile (Casas et al., 2011).
Soil respiration is often assessed by measuring changes in carbon dioxide (CO2) concentration within a controlled volume over some period of time, and rely on either spot samples or integrated measurements. Spot samples are often analyzed using gas chromatography (GC) techniques (McGowen et al., 2018). Multiple GC measurements can also be combined for integrated measurements. However, these GC measurements can be costly, particularly when many samples are required. IRGA devices provide integrated flux measurements, and have been widely used to quantify soil respiration in forest (Gaudinski et al., 2000; Ladegaard-Pedersen et al., 2005; Don et al., 2009) and agricultural ecosystems (Smukler et al., 2012). IRGA-based measurements have also been used to study microbial community composition (Fierer et al., 2003), which represents one of the important properties related to soil function (Mukhopadhyay et al., 2014). While IRGA-based devices provide the most accurate flux data (Rowell, 1995), such sensors are often expensive, putting them beyond the means of many practitioners, and power-intensive, limiting their usefulness in the field.
Integrated measurements can also be collected using chemical titration with potassium hydroxide, KOH, or sodium hydroxide, NaOH (Haney R.L. et al., 2008). While titration methods are straightforward and can be done without expensive devices, there are concerns over the accuracy of the titration process (Haney R. et al., 2008). These methods often under-estimate soil respiration when compared to IRGA measurements (Ferreira et al., 2018). To add to this, titration methods often require substantial labor and laboratory space to conduct.
Finally, both spot and integrated samples can be analyzed using colorimetric techniques. For spot samples, colorimetric tubes can be used (Patil et al., 2010), while colorimetric paddles can provide integrated flux measurements (Sciarappa et al., 2016; Norris et al., 2018). Micro-respiration measurements, which quantify soil respiration and microbial community physiological profiles using indicator dyes in agar gel, also use colorimetric techniques (Campbell et al., 2003; Renault et al., 2013). Even though individual sampling units are relatively inexpensive, the materials are not re-usable and quickly become cost-prohibitive as the numbers of samples rise.
To address the above-mentioned shortcomings, we present an inexpensive Arduino-powered and IRGA-based CO2 measurement device, called the soil microbial activity assessment contraption (SMAAC). The SMAAC has considerable flexibility, as we demonstrate using three different configurations: (1) SMAAC-Field, where the device was used to quantify soil respiration in a field setting; (2) SMAAC-Burst, where the device was used to analyze CO2 evolution upon rapid re-wetting of air-dried soil; and (3) SMAAC-Biomass, where the device was used to quantify SIR. To validate these configurations, we compared the measurements provided by the SMAAC with those from a commercial field-portable IRGA system. These examples reveal that the SMAAC can perform well as an inexpensive yet accurate tool to measure soil respiration.
Materials and Methods
Soil Microbial Activity Assessment Contraption (SMAAC) Description and Calibration
The sensor platform consists of four main components (Figure 1).
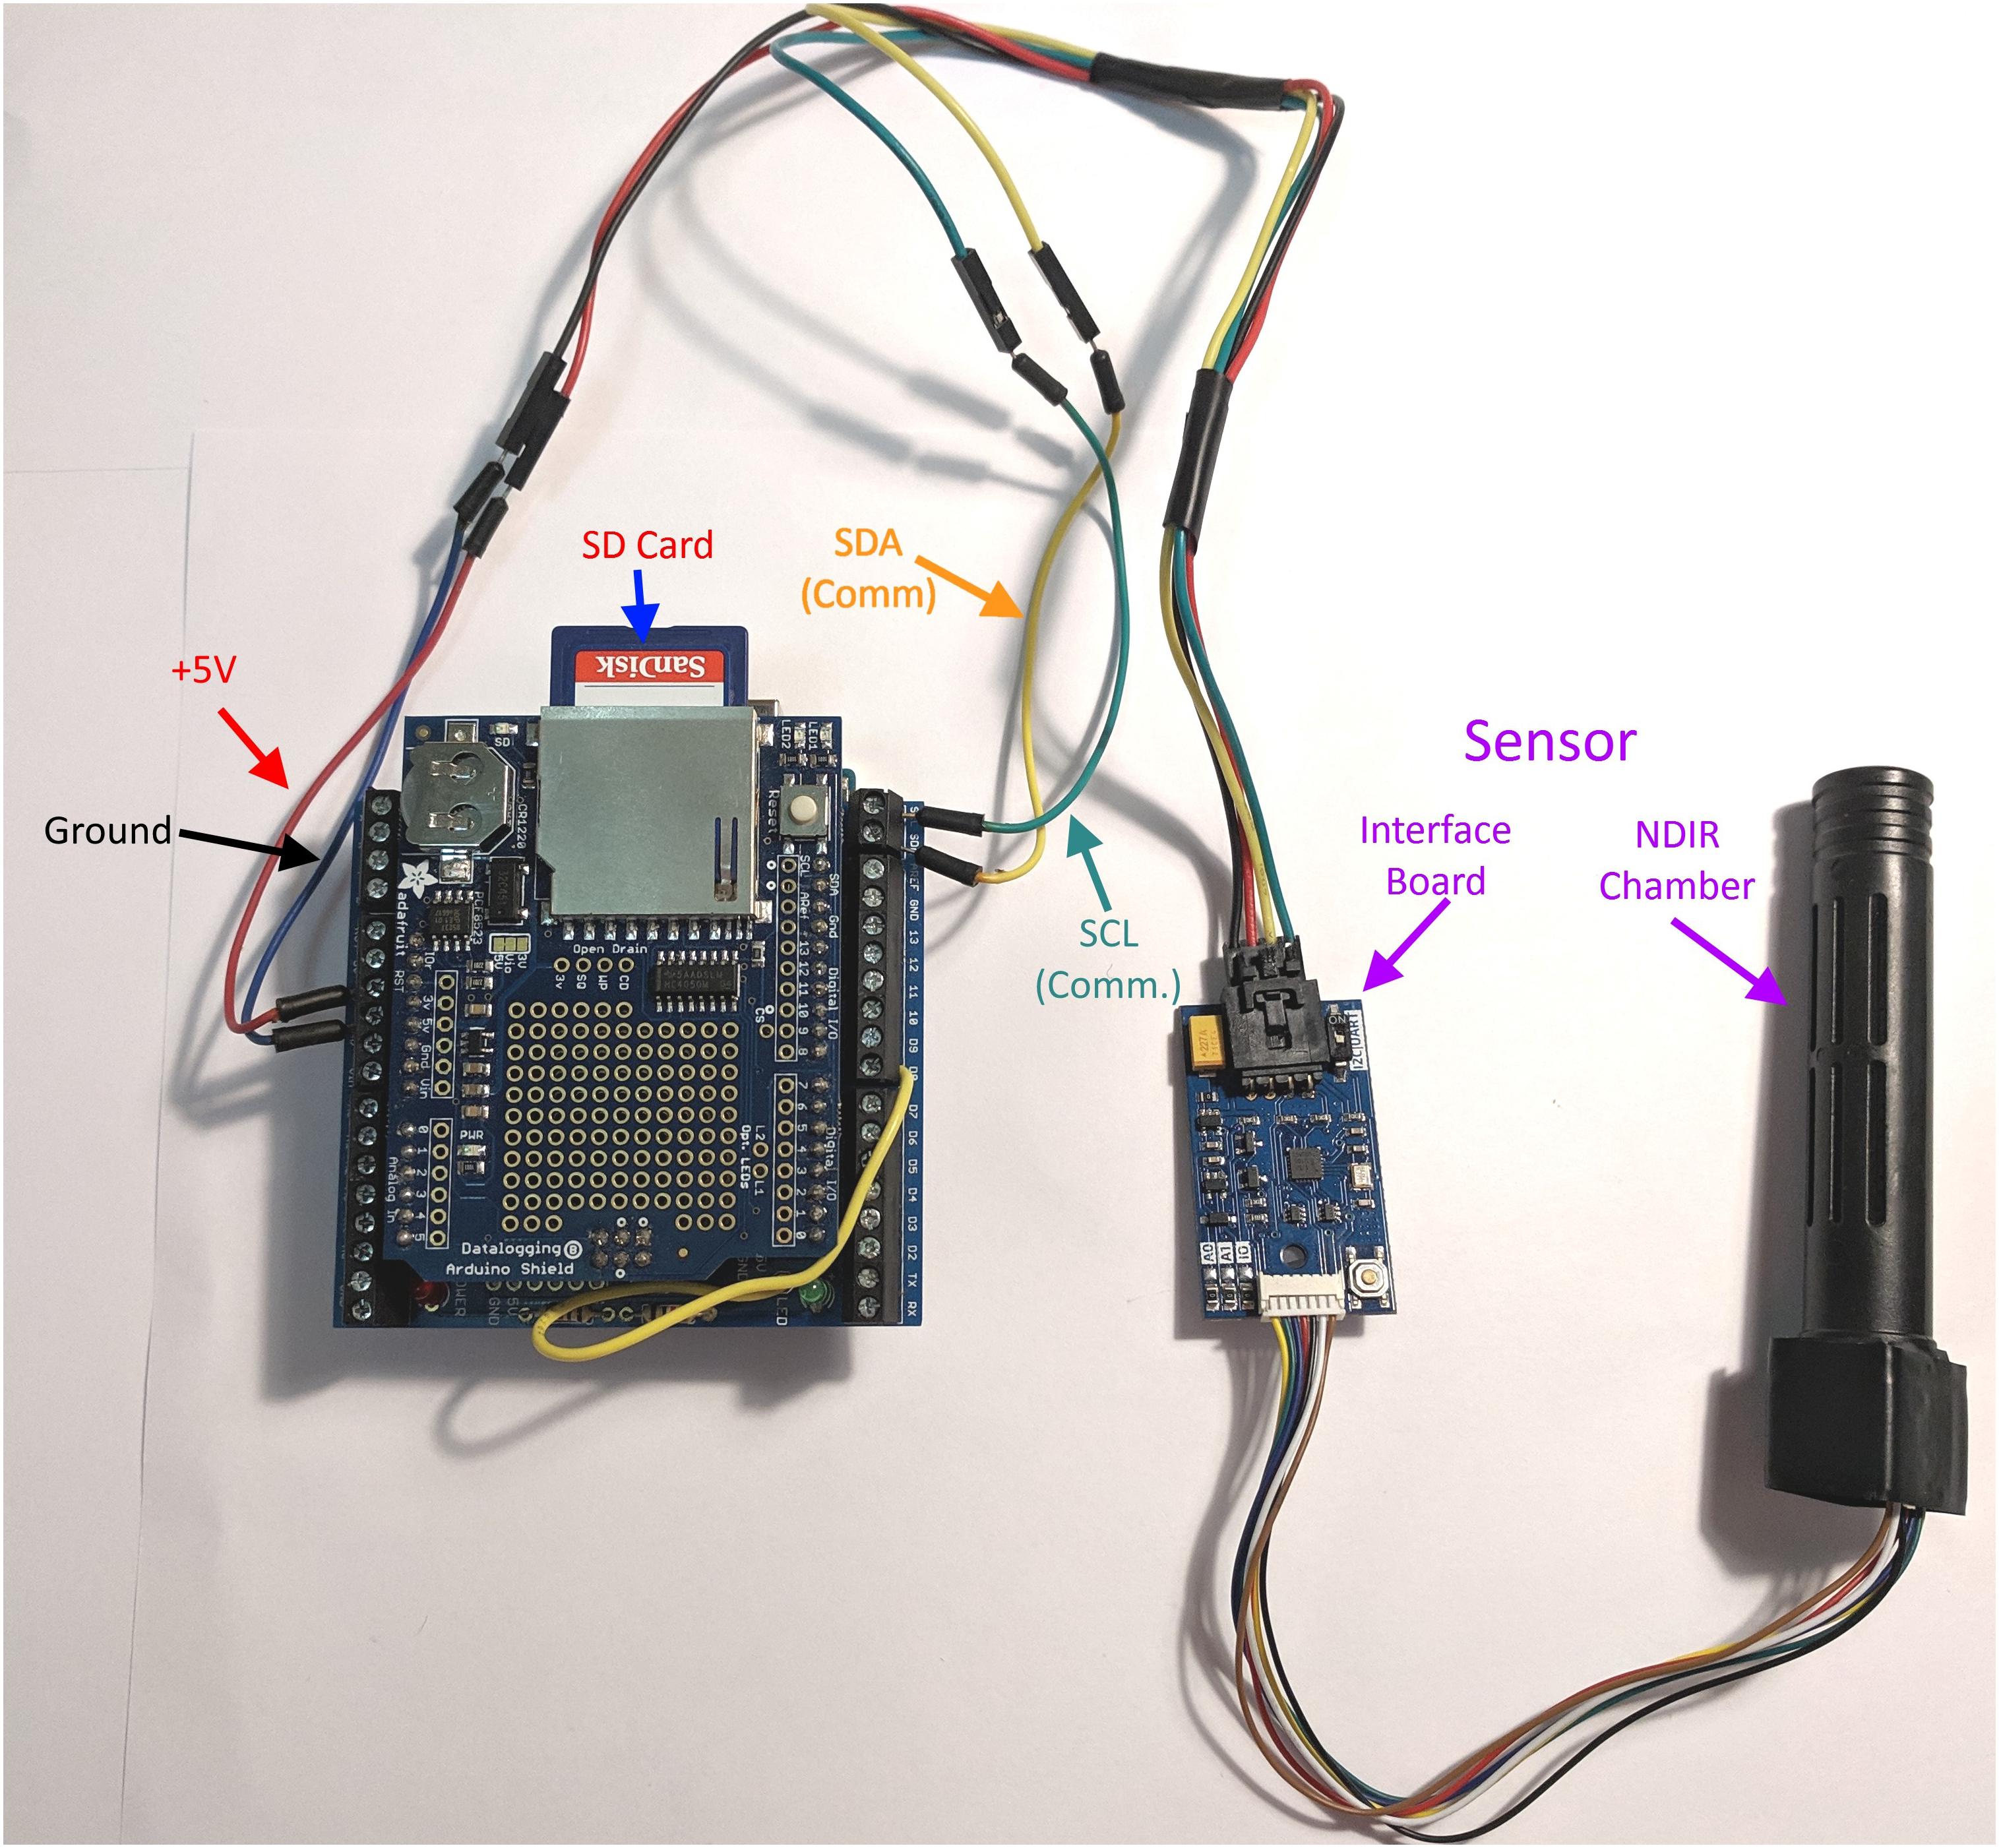
Figure 1. Schematic of the soil microbial activity assessment contraption (SMAAC). NDIR, non-dispersive infrared sensor used to detect CO2; SCL, serial clock line, used to synchronize data and commands between the Arduino and the interface board; SDA, serial data line, used to send and receive serial data and commands to the interface board.
(1) Arduino Uno (Arduino LLC, Ivrea, Italy).
(2) Adafruit Data Logger Shield (Adafruit Industries, New York, NY, United States).
(3) Sandbox Electronics 10,000 ppm CO2 sensor (Sandbox Electronics, China).
(4) 5 V DC power source.
The Arduino Uno is an open source/open hardware microcontroller based on the ATMEGA 328P. It has no storage space or accurate time-keeping abilities on its own, so the data logger shield contains a real time clock (RTC) and additional circuitry to store data on a removable SD card. The SMAAC was powered using four 1.5 V AA batteries. This configuration provided up to 21 h of readings at the rate of 20 readings per minute.
The CO2 sensor requires only 4 wires to communicate with the Arduino (+V, RX, TX, and Ground). The sensor uses I2C (Intra Integrated Circuit) serial protocol and determines CO2 concentration using non-dispersive infrared absorbance (NDIR). Example code for integrating this sensor with the Arduino is available at https://github.com/SandboxElectronics/NDIRZ16.
The CO2 sensor has an option to calibrate itself to 400 ppm CO2 based on ambient readings. To verify that this first-order calibration is accurate enough for scientific use, we checked the sensor accuracy using known CO2 standards (n = 2). Here, the sensor was installed via a rubber stopper into a 1 L jar (Figure 2a). The jar was filled with CO2-free air, and then 0.1 L of 1000 ppm CO2 gas was replaced within the jar (providing a 100 ppm concentration within the jar). This process was repeated a second time with 1000 ppm CO2 air, and also two times each with 2000 and 5000 ppm CO2 air (providing concentrations of 200 and 500 ppm within the jar). The results obtained from SMAAC for these standards were repeatable within ±20 ppm and accurate within the ±50 ppm sensor limit.
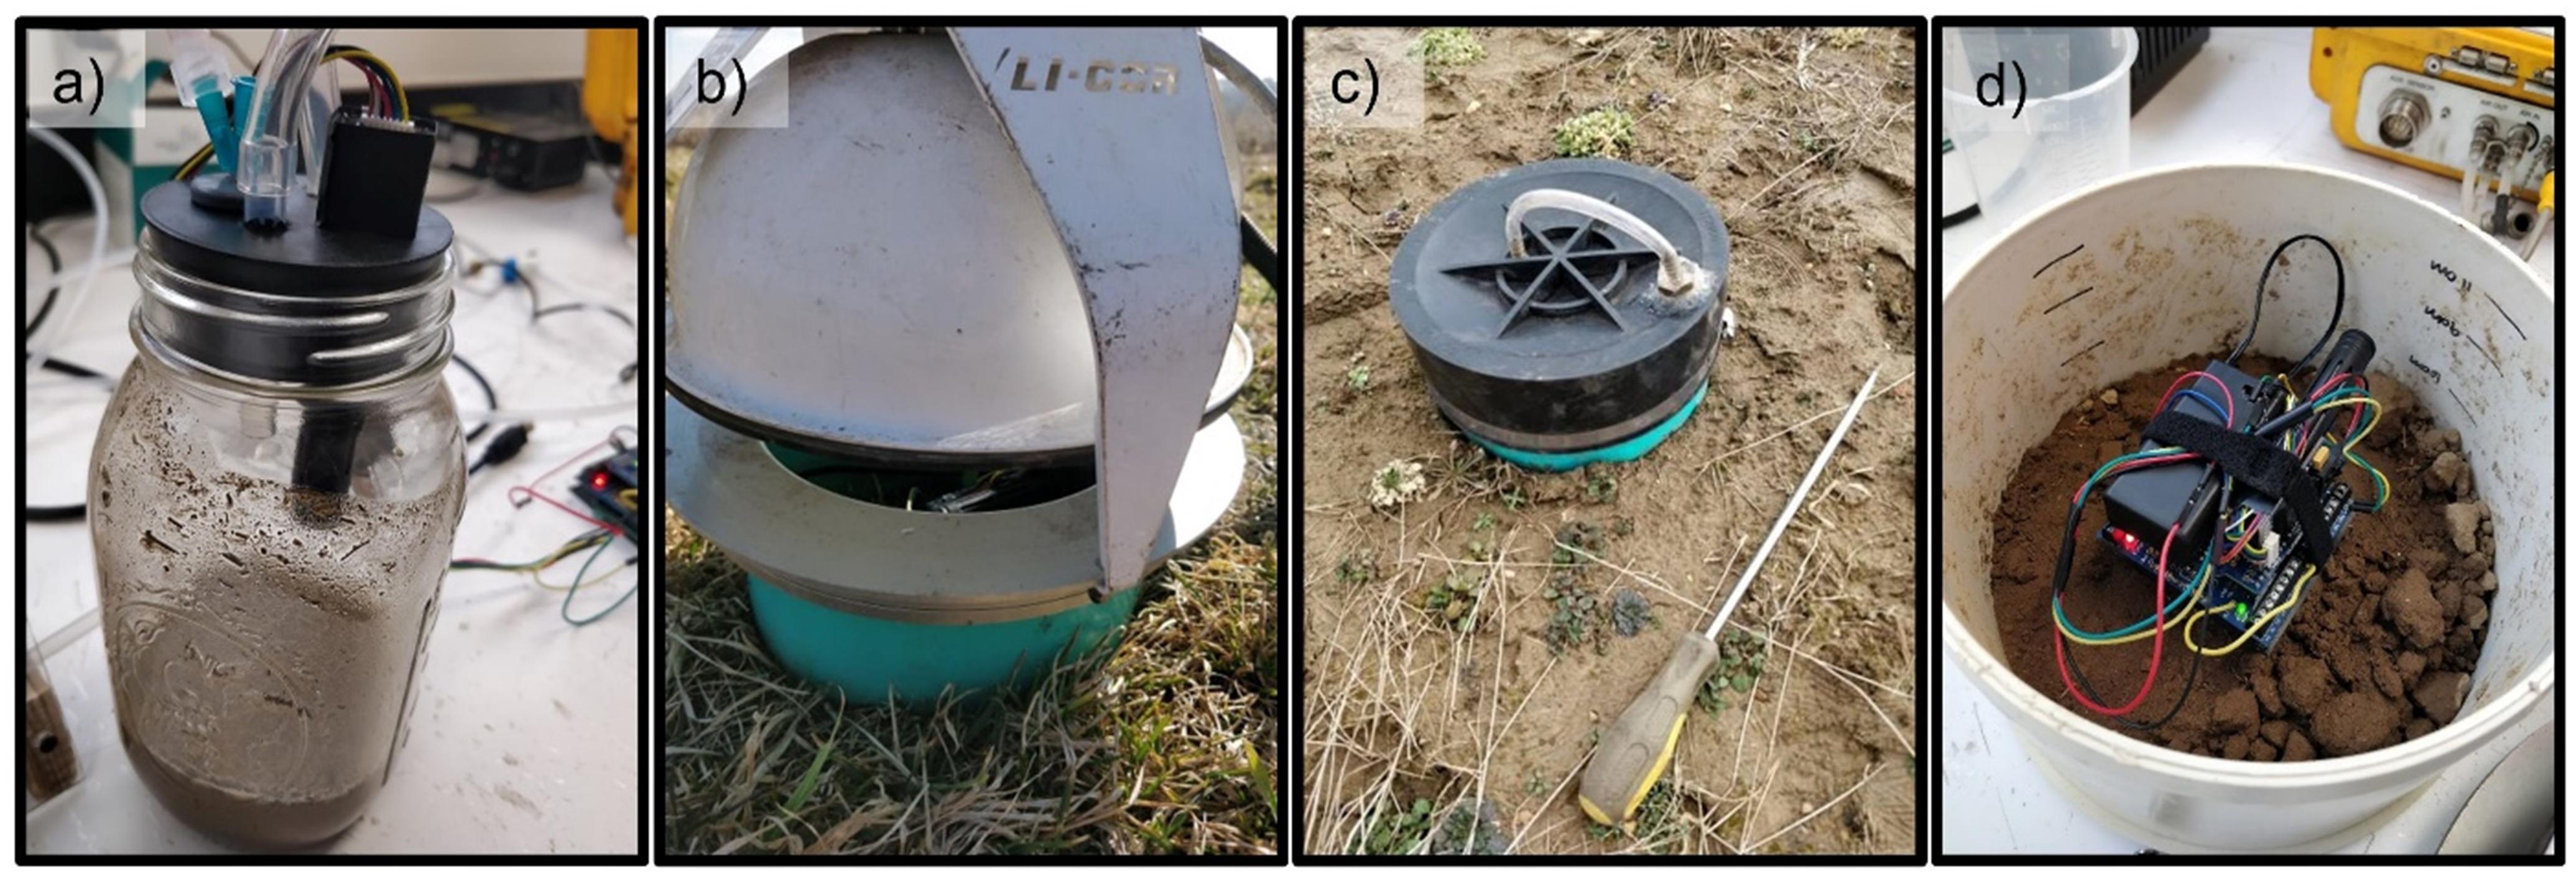
Figure 2. Measurement setups for: (a) SMAAC-Biomass substrate induced respiration (SIR) measurement; (b) SMAAC-Field flux measurement with SMAAC simultaneously located within the LI-COR 8100 sampling chamber; (c) SMAAC-Field flux measurement with SMAAC independent of the LI-COR unit; and (d) SMAAC-Burst laboratory CO2 burst measurement.
Soil Description
We tested the SMAAC with a Weaver series silt loam soil (Fine-loamy, mixed, active, and mesic Fluvaquentic Eutrudepts), located at Kentland Farm at Virginia Tech (37.198, -80.575). To include different soil microbial activity levels, we sampled two locations in adjacent fields that were managed using (1) perennial grass cover and (2) row crop cultivation with moldboard tillage. The pH of the grass-covered soil was 6.4 and of the tilled soil was 6.6, putting the soil at the upper pH limit for performing static chamber measurements [e.g., West and Sparling (1986) recommend pH ≤ 6.5]. We performed three tests in which the SMAAC measurements were compared to a commercially available self-contained IRGA unit (LI-COR 8100 with 20 cm diameter 8100–8103 survey chamber, LI-COR, Lincoln, NE, United States): SMAAC-Field, SMAAC-Burst, and SMAAC-Biomass.
Field and Laboratory Measurements
SMAAC-Field Soil Respiration Test
We used 200 mm (diameter) by 150 mm (height) PVC columns for the field measurements. We collected a 2-min CO2 respiration measurement first using the SMAAC located within the LI-COR 8100–8103 sampling chamber (i.e., SMAAC-simultaneous; Figure 2b). Note that the sampling chamber provided an air-tight seal around the PVC column during measurements. Immediately after this first measurement the LI-COR unit was removed and the ring was capped with an airtight rubber cap (i.e., SMAAC-independent; Figure 2c). The SMAAC then collected a second 2-min measurement. The CO2 flux [fCO2; (N L-2 t-1)] was estimated as:
where P0 is the pressure in the chamber [M L-1 t-2], assumed to be equal to atmospheric pressure, Vc is the volume of the sampling chamber plus any tubing and pumps [L3], R is the ideal gas law constant [M L2 N-1 T-1 t-2], T0 is the temperature of the air [T], A is the area of exposed soil [L2], and ΔC is the change in CO2 concentration on a molar basis [N N-1] per change in time Δt [t].
Four rings were sampled for each of the grass-covered and tilled soils (n = 4).
SMAAC-Burst CO2 Test
For the CO2 burst test, we placed 200 g of 4-mm sieved and air-dried soil from the two sites into a 200 mm diameter by 150 mm tall column. The water holding capacity for each soil sample was measured using the funnel method (Fierer et al., 2006). Water was added dropwise to each soil sample using a syringe until the sample reached 50% water holding capacity. Once the soil samples were wetted, the SMAAC was placed on the soil surface (Figure 2d). The LI-COR 8100 sampling hood was then placed on top. Both instruments collected readings several times a minute for at least 2 h. For each instrument, the readings collected were averaged per minute for graphing purposes (n = 4 per soil).
SMAAC-Biomass Substrate Induced Respiration (SIR)
We also compared LI-COR 8100 and SMAAC measurements during a test designed to mimic SIR measurements (Fierer et al., 2003; Strickland et al., 2010). Refrigerated soil samples from the fields were brought to room temperature overnight. We placed 80 g (equivalent dry mass) of 4-mm sieved soil samples into a 1 L glass jar (Figure 2a). We then added 0.16 L of autolyzed yeast solution made from 12 g of yeast extract (BD Biosciences, San Jose, CA, United States) in 1 L of DI water as a substrate. The mixture of soil and substrate was shaken with no cover for 10 min. We then sealed the jar using a rubber stopper that had the SMAAC sensor and a septum mounted through it. Using the septum, we flushed the headspace of the jar using CO2 free air for 7 min. Then the jar was maintained at 20°C for 4 h. After 4 h, we collected a gas sample through the septum using a syringe. This sample was injected into the LI-COR 8100 unit to quantify the CO2 concentration in the jar headspace. The 4-h CO2 reading from the SMAAC was also analyzed. Both measurements of headspace CO2 were converted to SIR units (μg C g-1 dry soil h-1) based on the dry mass of soil. Three replicates were analyzed for the grass buffer and moldboard plowed soils (n = 3).
Statistical Analyses
All statistical analysis and figures were done in R Version 3.5.0 (R Development Core Team., 2018). Analysis of variance (ANOVA) was used to compare the three types of measurements performed in the SMAAC-Field configuration (i.e., LI-COR, SMAAC-simultaneous, and SMAAC-independent). During the SMAAC-Burst and SMAAC-Biomass tests, the Student’s t-test was used to compare results from the LI-COR vs. the SMAAC. Measurements were analyzed separately for the grass-covered and tilled soils. α = 0.05 was used to test for significance throughout this study.
Results
SMAAC-Field Soil Respiration Test
For the SMAAC-Field respiration test, the LI-COR 8100 and SMAAC were used to quantify CO2 flux over a 2-min period, with the SMAAC both placed within (SMAAC-simultaneous) and without (SMAAC-independent) the LI-COR sampling chamber. Both instruments showed that the grass-covered soil had a higher CO2 flux than the tilled soil (Figure 3). The flux measured for the grass buffer soil by the LI-COR (4.1 × 10⁻⁴ μmol CO2 cm-2 s-1 ± 9.9 × 10⁻⁵ standard deviation, SD) was not significantly different than fluxes determined via the SMAAC-simultaneous (5.6 × 10⁻⁴ μmol CO2 cm-2 s-1 ± 2.7 × 10⁻⁴ SD) or SMAAC-independent (3.1 × 10⁻⁴ μmol CO2 cm-2 s-1 ± 7.2 × 10⁻⁵ SD) tests. For the tilled soil, the LI-COR flux (5.9 × 10⁻⁵ μmol CO2 cm-2 s-1 ± 1.9 × 10⁻⁵ SD) was again not significantly different from the fluxes measured during the SMAAC-simultaneous (5.9 × 10⁻⁵ μmol CO2 cm-2 s-1 ± 1.5 × 10⁻⁵ SD) and SMAAC-independent (4.7 × 10⁻⁵ μmol CO2 cm-2 s-1 ± 2.6 × 10⁻⁵ SD) tests.
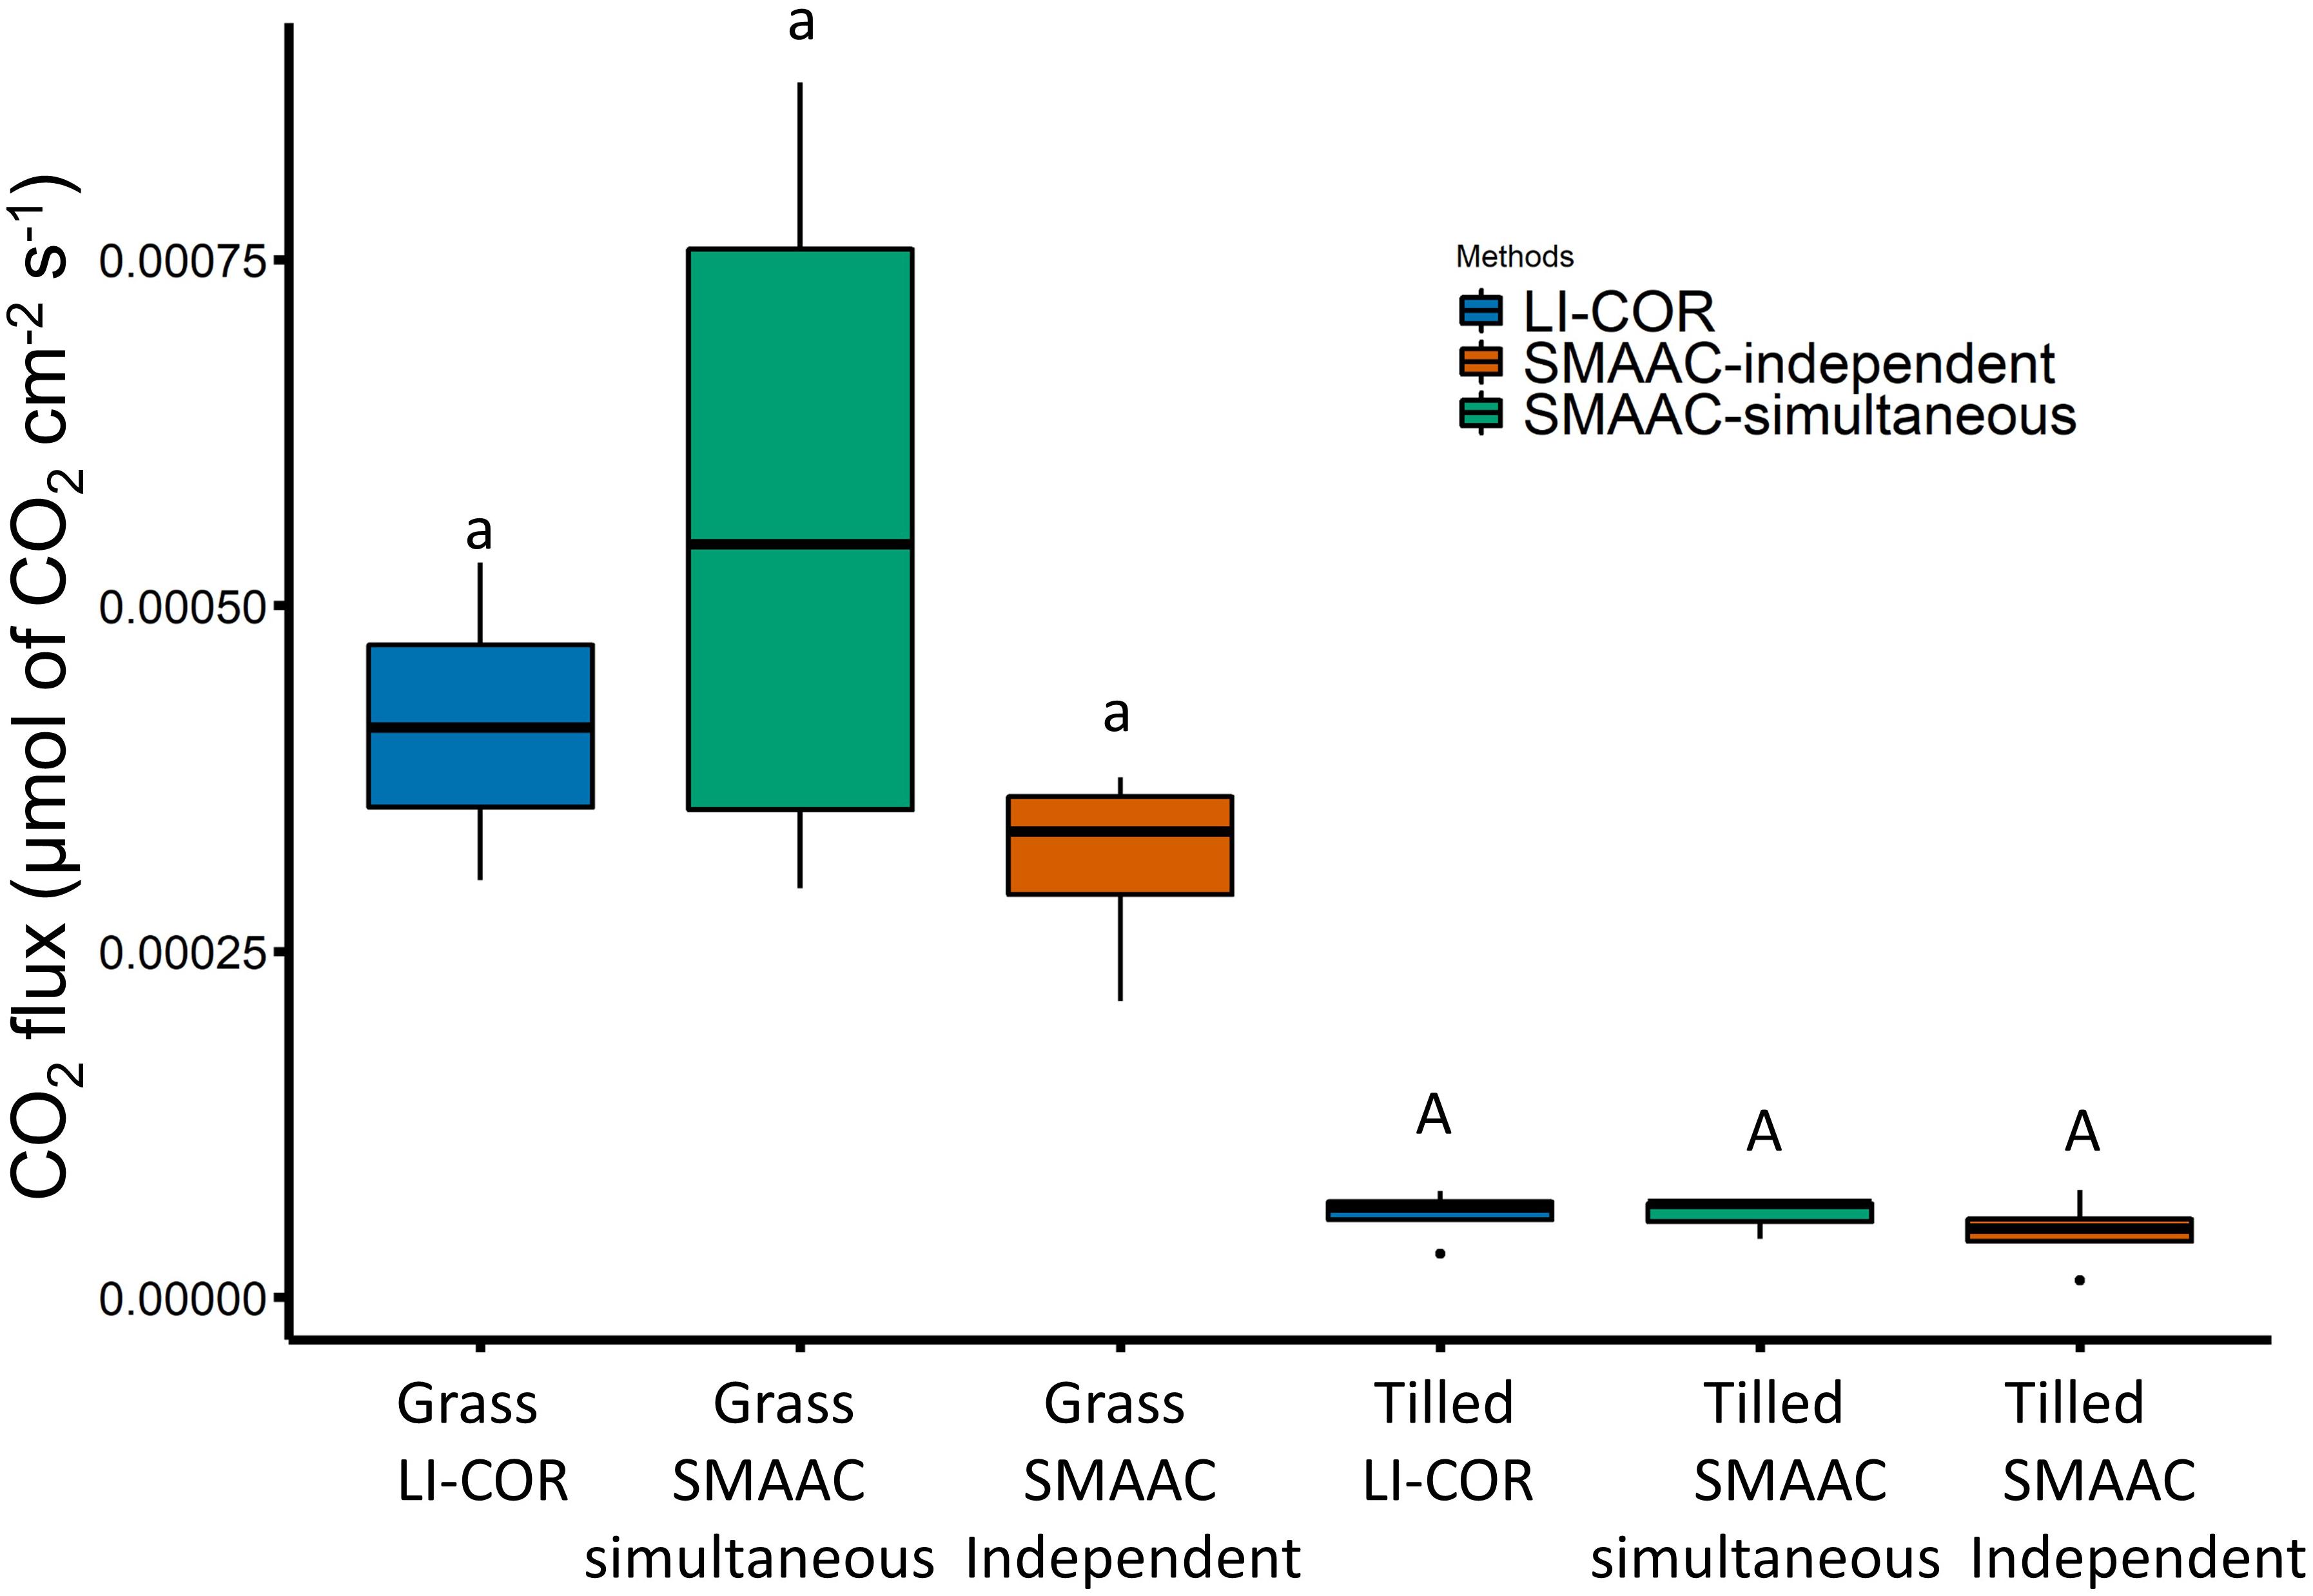
Figure 3. CO2 fluxes measured in the field by the LI-COR (blue), SMAAC-simultaneous (green), and SMAAC-independent (orange). Different small letters indicate grass-covered soil fluxes are statistically different; different capital letters indicate tilled soil fluxes are statistically different (ANOVA with Tukey’s HSD; P < 0.05).
SMAAC-Burst CO2 Burst Test
The SMAAC-Burst configuration produced consistent results compared to the LI-COR 8100 unit for both the grass-covered and tilled soils (Figure 4), with similar mean values and standard deviations calculated from the four physical replicates for each soil (Figure 4A). We observed relatively large fluctuations in CO2 emission rates, especially during the first 20 min of the experiment (Figure 4B). After this initial period, CO2 emission rates fluctuated more for SMAAC compared to LICOR, though the mean rates were generally consistent between methods (Figure 4B). Both instruments showed that the CO2 burst was larger in the grass-covered soil compared to the tilled soil (Figure 4).
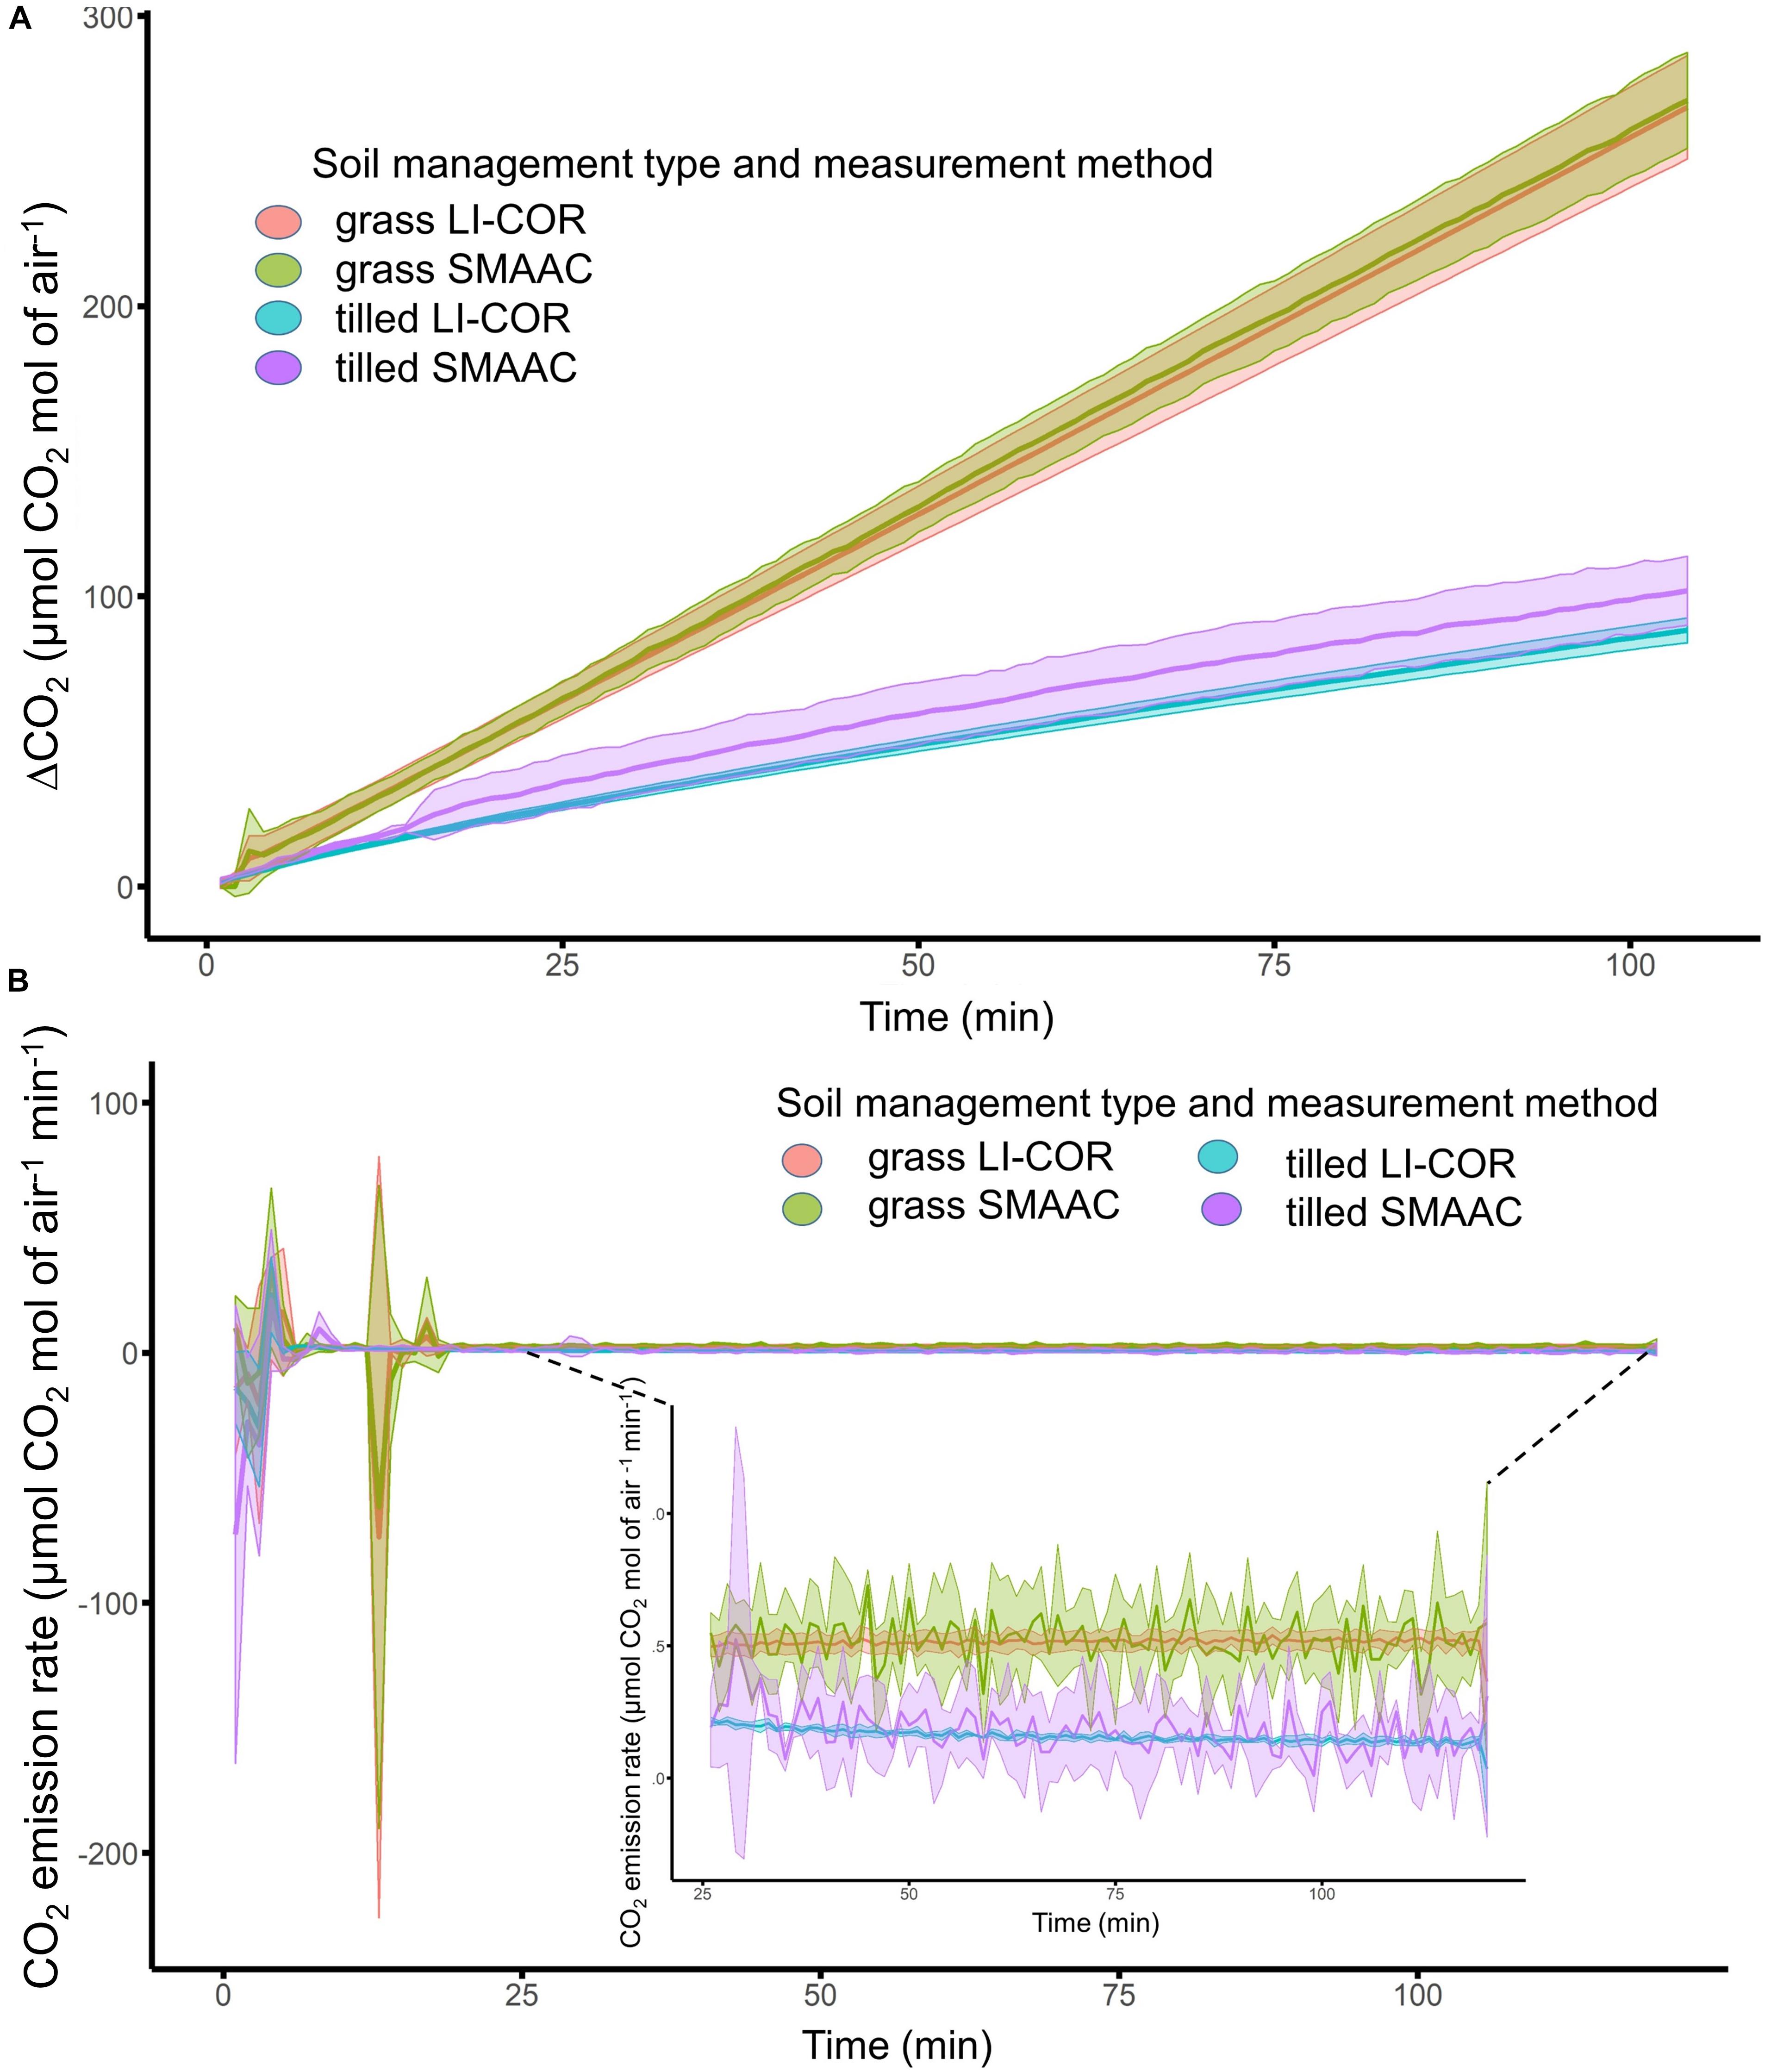
Figure 4. (A) Laboratory measurement of change in CO2 through time (min) for grass-covered and tilled soils, measured using a LI-COR 8100, and the SMAAC-Burst configuration. Solid lines represent mean values, and shaded areas represent standard deviations from the means. (B) CO2 emission rates for grass-covered and tilled soils, measured using the LI-COR, and the SMAAC-Burst configuration.
SMAAC-Biomass Substrate Induced Respiration Test
Results generated using both the LI-COR 8100 and the SMAAC-Biomass consistently showed that the grass-covered soil had higher SIR values than the tilled soil (Figure 5). The LI-COR (0.19 μg C g dry soil-1 h-1 ± 0.03 SD) and SMAAC (0.21 μg C g dry soil-1 h-1 ± 0.01 SD) measurements were not statistically different for the grass-covered soil (P ≥ 0.05). However, the LI-COR SIR value (0.09 μg C g dry soil-1 h-1 ± 0.005 SD) for the tilled soil was significantly higher than the SMAAC SIR value (0.05 μg C g dry soil-1 h-1 ± 0.005 SD; P = 0.0009).
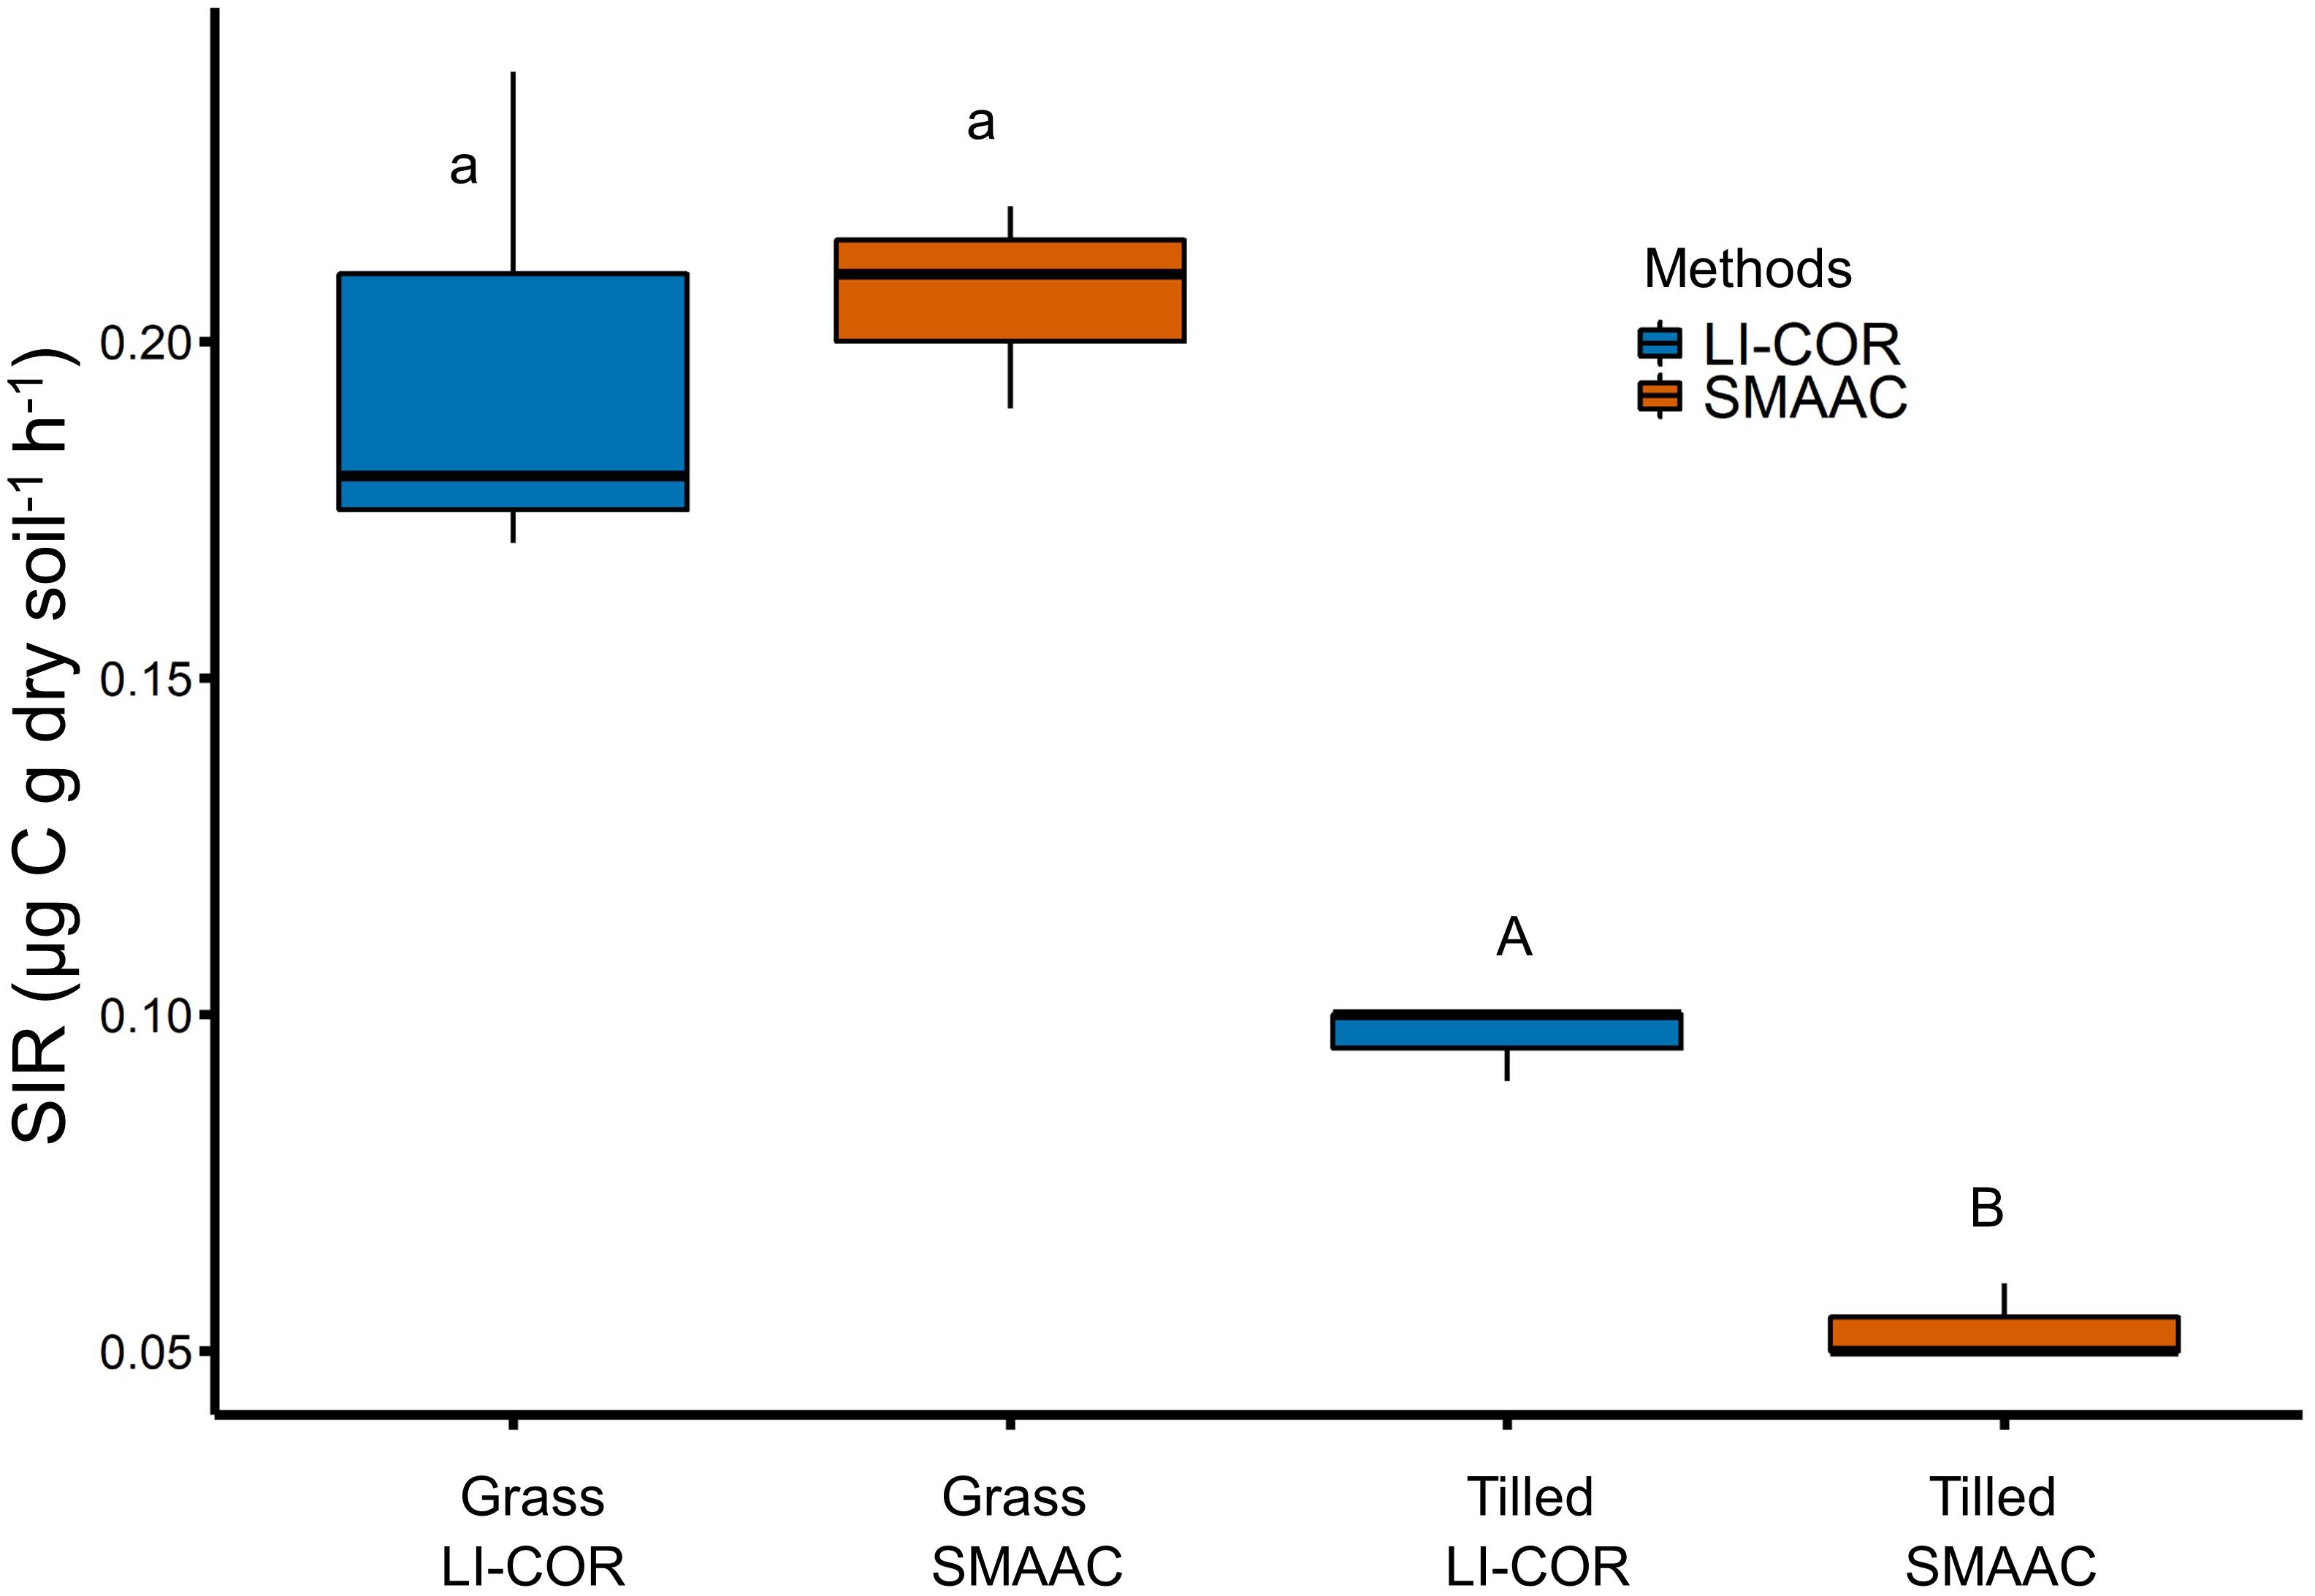
Figure 5. Substrate induced respiration measured by a LI-COR 8100 (blue) vs. the SMAAC-Biomass configuration (orange). Different small letters indicate grass-covered soil fluxes are statistically different; different capital letters indicate tilled soil fluxes are statistically different (Students t-test; P < 0.05).
Discussion
In this study we developed three configurations of an Arduino-based CO2 sensor that allowed us to assess soil microbial activity. Our instrument, deemed the SMAAC, was then compared against a commercial IRGA unit (LI-COR 8100). Overall, the SMAAC generated similar results to the commercial IRGA, with signficant differences only observed when SIR was quantified for the tilled soil (Figure 5). In this example, the SIR value from the SMAAC-Biomass configuration was approximately half of the value estimated by the LI-COR. The reason for the discrepancy may relate to the accuracy of the SMAAC IRGA sensor (50 ppm per the manufacturer). Even though our calibration analysis determined that the instrument provided consistent readings for CO2 concentrations between 100 and 500 ppm, the sensor accuracy implies that the error can exceed 10% for CO2 concentrations < 500 ppm. Using the sensor to measure low CO2 concentrations may therefore require extra precautions such as using longer run times, greater number of replicates, and more frequent calibration. We also note that we did not test the sensor beyond 1,000 ppm, so the calibration should also be assessed when using SMAAC to measure higher CO2 concentrations.
The SMAAC tended to show more measurement noise than the LI-COR when assessing CO2 fluxes, e.g., the field flux measurements from SMAAC-simultaneous vs. LI-COR setups in the grass-covered soil (Figure 3), or the emissions rates calculated for both soils with the SMAAC-Burst (Figure 4B). However, during the field flux measurements, the SMAAC-independent test had a slightly lower median flux and a smaller standard deviation than either the LI-COR or SMAAC-simultaneous. This result may reflect the influence of the LI-COR pump unit, which provided continuous circulation of air in the chamber. At the same time, our flux calculations (Eq. 1) assumed that the volume of the air, Vc, for the LI-COR and SMAAC-simultaneous setups was equal to the LI-COR sampling chamber plus the internal pump volume of the LI-COR. We did not account for the volume or the exposed surface area of the soil occupied by the SMAAC itself, thus potentially introducing minor error into the flux calculations for those tests. We also note here that the SMAAC and LI-COR both showed high variability in emissions during the initial 20 min of the CO2 burst test experiment. This result may reflect an equilibration period within the glass jar, particularly in response to the initial soil disturbance during wetting the soil and sealing the system.
The total cost of the SMAAC was ∼$150, making it at least two orders of magnitude less expensive than commercial IRGA units. Despite the low cost, the SMAAC still maintained reasonable accuracy in all three configurations tested, and performed repeatable measurements when compared with CO2 standards. The SMAAC is lighter weight and requires less power than commercial IRGA units, increasing its usefulness when performing extended measurements or working in remote locations. An additional benefit of the SMAAC comes from its small form factor: it can be placed directly inside the headspace of samples, thus eliminating the need to pull discrete gas samples using a syringe. Removing this step eliminates a potential source of error, particularly since many commercial IRGA pump units are not fully sealed.
The SMAAC may open new avenues of inquiry related to soil respiration measurements, both in terms of the configurations shown here as well as other possible configurations yet to be developed. For example, we focused our tests on closed chamber measurements, since those are commonly used to evaluate soil CO2 fluxes, and perform measurements such as SIR. The closed chamber measurements also lended themselves to direct comparison with the commercial IRGA unit. However, CO2 can also be measured using open systems (Norman et al., 1997; Alterio et al., 2006) or in continually flushed chambers (Chow et al., 2006). Using the SMAAC in open/purged systems thus represents an area of possible future development.
Similarly, since the SMAAC system is inexpensive and easy to assemble, multiple sensors could be used concurrently to better quantify spatial, and temporal variability in soil biological measurements, for example by analyzing multiple chambers simultaneously and thereby providing similar functionality as multiplexer units often offered with commercial IRGAs. Finally, direct continuous logging of CO2 evoluation during measurements may help generate new insights. For example, the grass-covered vs. tilled soil showed different temporal trends in the SMAAC-Burst test (Figure 4B), where the grass-covered soil produced a constant CO2 efflux rate over the 2-h test period vs. a decreasing CO2 efflux rate for the tilled soil. While the underlying mechanisms controlling these different responses remain beyond the scope of this current paper, it is nonetheless worth noting that it would not be possible to observe such trends without the high measurement frequency offered by IRGA-based instruments such as SMAAC.
Conclusion
The SMAAC developed in this study represents an low cost yet reliable way to measure CO2 fluxes from soils. The results obtained from the SMAAC were consistent with those from a commercial IRGA unit for both field and laboratory measurements. In this study we highlighted three SMAAC configurations that were designed to assess different aspects of soil microbial activity and function, yet the SMAAC also has the potential to generate additional applications and insights. As an example, by having the SMAAC-Burst and SMAAC-Biomass units placed inside the closed headspace above samples, we generated near-continuous measurements of CO2 evolution through time. Such CO2 trends may provide new understanding of soil microbial processes that is not possible via traditional discrete measurements. In conclusion, the SMAAC is a promising tool for measuring soil respiration and microbial activity that warrants usage by the broader scientific community.
Data Availability
The raw data supporting the conclusions of this manuscript will be made available by the authors, without undue reservation, to any qualified researcher.
Author Contributions
AJG contributed to designing and conducting the experiments, performing the analyses, and writing the first draft of the manuscript. BL contributed to making the sensor, conducting the experiments, and editing the manuscript. RS contributed to generating the main idea, providing guidance throughout the experiments and analysis, and writing and editing the manuscript.
Funding
This work was provided by the U.S. Department of Agriculture NRCS Conservation Innovation Grant #69-3A75-14-260 and also provided in part by the U.S. Department of Agriculture National Resources Conservation Service Virginia Agricultural Experiment Station and the Hatch Program of the National Institute of Food and Agriculture, U.S. Department of Agriculture. We also would like to thank Virginia Tech Open Access Subvention fund for support regarding publication fees.
Conflict of Interest Statement
The authors declare that the research was conducted in the absence of any commercial or financial relationships that could be construed as a potential conflict of interest.
Abbreviations
IRGA, infrared gas analyzer; SIR, substrate induced respiration; SMAAC, soil microbial activity and assessment contraption.
References
Allen, D. E., Singh, B. P., and Dalal, R. C. (2011). Soil health indicators under climate change: a review of current knowledge. Soil Health Clim. Change. 29, 25–45. doi: 10.1007/978-3-642-20256-8_2
Alterio, G., Giorio, P., and Sorrentino, G. (2006). Open-system chamber for measurements of gas exchanges at plant level. Environ. Sci. Technol. 40, 1950–1955. doi: 10.1021/es052094o
Bond-Lamberty, B., Bailey, V. L., Chen, M., Gough, C. M., and Vargas, R. (2018). Globally rising soil heterotrophic respiration over recent decades. Nature 560, 80–83. doi: 10.1038/s41586-018-0358-x
Bradford, M. A., Watts, B. W., and Davies, C. A. (2010). Thermal adaptation of heterotrophic soil respiration in laboratory microcosms. Glob. Change Biol. 16, 1576–1588. doi: 10.1111/j.1365-2486.2009.02040.x
Campbell, C. D., Chapman, S. J., Cameron, C. M., Davidson, M. S., and Potts, J. M. (2003). A rapid microtiter plate method to measure carbon dioxide evolved from carbon substrate amendments so as to determine the physiological profiles of soil microbial communities by using whole soil. Appl. Environ. Microbiol. 69, 3593–3599. doi: 10.1128/aem.69.6.3593-3599.2003
Casas, C., Omacini, M., Montecchia, M. S., and Correa, O. S. (2011). Soil microbial community responses to the fungal endophyte Neotyphodium in Italian ryegrass. Plant Soil 340, 347–355. doi: 10.1007/s11104-010-0607-8
Chow, A. T., Tanji, K. K., Gao, S., and Dahlgren, R. A. (2006). Temperature, water content and wet–dry cycle effects on DOC production and carbon mineralization in agricultural peat soils. Soil Biol. Biochem. 38, 477–488. doi: 10.1016/j.soilbio.2005.06.005
Davidson, E. A., and Janssens, I. A. (2006). Temperature sensitivity of soil carbon decomposition and feedbacks to climate change. Nature 440:165. doi: 10.1038/nature04514
Don, A., Rebmann, C., Kolle, O., Scherer-Lorenzen, M., and Schulze, E. D. (2009). Impact of afforestation-associated management changes on the carbon balance of grassland. Glob. Change Biol. 15, 1990–2002. doi: 10.1111/j.1365-2486.2009.01873.x
Ferreira, C. R. P. C., Antonino, A. C. D., Sampaio, E. V. D. S. B., Correia, K. G., Lima, J. R. D. S., Soares, W., et al. (2018). Soil CO2 efflux measurements by alkali absorption and infrared gas analyzer in the brazilian semiarid region. Revista Brasileira de Ciência do Solo 42:e0160563.
Fierer, N., Colman, B. P., Schimel, J. P., and Jackson, R. B. (2006). Predicting the temperature dependence of microbial respiration in soil: a continental-scale analysis. Glob. Biogeochem. Cycles 20:GB3026.
Fierer, N., Schimel, J. P., and Holden, P. A. (2003). Variations in microbial community composition through two soil depth profiles. Soil Biol. Biochem. 35, 167–176. doi: 10.1016/s0038-0717(02)00251-1
Gaudinski, J. B., Trumbore, S. E., Davidson, E. A., and Zheng, S. (2000). Soil carbon cycling in a temperate forest: radiocarbon-based estimates of residence times, sequestration rates and partitioning of fluxes. Biogeochemistry 51, 33–69.
Haney, R., Brinton, W., and Evans, E. (2008). Soil CO 2 respiration: comparison of chemical titration. CO 2 IRGA analysis and the Solvita gel system. Renew. Agri. Food Sys. 23, 171–176. doi: 10.1017/s174217050800224x
Haney, R. L., Brinton, W., and Evans, E. (2008). Estimating soil carbon, nitrogen, and phosphorus mineralization from short-term carbon dioxide respiration. Commun. Soil Sci. and Plant Anal. 39, 2706–2720. doi: 10.1080/00103620802358862
Ladegaard-Pedersen, P., Elberling, B., and Vesterdal, L. (2005). Soil carbon stocks, mineralization rates, and CO2 effluxes under 10 tree species on contrasting soil types. Can. J. Forest Res. 35, 1277–1284. doi: 10.1139/x05-045
Lal, R. (2004). Soil carbon sequestration impacts on global climate change and food security. Science 304, 1623–1627. doi: 10.1126/science.1097396
McGowen, E. B., Sharma, S., Deng, S., Zhang, H., and Warren, J. G. (2018). An automated laboratory method for measuring CO2 emissions from soils. Agri. Environ. Lett. 3, 2–3. doi: 10.2134/ael2018.02.0008
Minasny, B., Malone, B. P., McBratney, A. B., Angers, D. A., Arrouays, D., Chambers, A., et al. (2017). Soil carbon 4 per mille. Geoderma 292, 59–86. doi: 10.1016/j.scitotenv.2017.12.263
Mondini, C., Sinicco, T., Cayuela, M. L., and Sanchez-Monedero, M. A. (2010). A simple automated system for measuring soil respiration by gas chromatography. Talanta 81, 849–855. doi: 10.1016/j.talanta.2010.01.026
Mukhopadhyay, S., Maiti, S., and Masto, R. (2014). Development of mine soil quality index (MSQI) for evaluation of reclamation success: a chronosequence study. Ecol. Eng. 71, 10–20. doi: 10.1016/j.ecoleng.2014.07.001
Norman, J., Kucharik, C., Gower, S., Baldocchi, D., Crill, P., Rayment, M., et al. (1997). A comparison of six methods for measuring soil-surface carbon dioxide fluxes. J. Geophys. Res. Atmos. 102, 28771–28777. doi: 10.1029/97jd01440
Norris, R., Chim, B. K., Evanylo, G., Reiter, M., and Thomason, W. (2018). assessment of in-season soil nitrogen tests for corn planted into winter annual cover crops. Soil Sci. Soc. Am. J. 82, 1428–1436.
Patil, R. H., Colls, J. J., and Steven, M. D. (2010). Effects of CO2 gas as leaks from geological storage sites on agro-ecosystems. Energy 35, 4587–4591. doi: 10.1016/j.energy.2010.01.023
R Development Core Team. (2018). A language and Environment for Statistical Computing. Austria: R Foundation for Statistical Computing.
Renault, P., Ben-Sassi, M., and Berard, A. (2013). Improving the MicroResp substrate-induced respiration method by a more complete description of CO2 behavior in closed incubation wells. Geoderma 207, 82–91. doi: 10.1016/j.geoderma.2013.05.010
Rowell, M. J. (1995). Colorimetric method for CO2 measurement in soils. Soil Biol. Biochem. 27, 373–375. doi: 10.1016/0038-0717(94)00218-p
Rustad, L. E., Huntington, T. G., and Boone, R. D. (2000). Controls on soil respiration: implications for climate change. Biogeochemistry 48, 1–6. doi: 10.1111/gcb.13308
Sciarappa, W., Murphy, S., Quinn, V., Barresi, R. and Ward, D. (2016). Assessing soil health in highbush blueberry with the Solvita CO2 respiration test. Acta Hortic. 1180, 327-334
Smukler, S., O’Geen, A., and Jackson, L. (2012). Assessment of best management practices for nutrient cycling: A case study on an organic farm in a Mediterranean-type climate. J. Soil Water Conser. 67, 16–31. doi: 10.2489/jswc.67.1.16
Song, Y., Song, C., Tao, B., Wang, J., Zhu, X., and Wang, X. (2014). Short-term responses of soil enzyme activities and carbon mineralization to added nitrogen and litter in a freshwater marsh of Northeast China. Eur. J. Soil Biol. 61, 72–79. doi: 10.1016/j.ejsobi.2014.02.001
Strickland, M. S., Devore, J. L., Maerz, J. C., and Bradford, M. A. (2010). Grass invasion of a hardwood forest is associated with declines in belowground carbon pools. Glob. Change Biol. 16, 1338–1350. doi: 10.1111/j.1365-2486.2009.02042.x
Keywords: substrate induced respiration, soil microbial activity, soil health, environmental sensing, soil CO2
Citation: Joshi Gyawali A, Lester BJ and Stewart RD (2019) Talking SMAAC: A New Tool to Measure Soil Respiration and Microbial Activity. Front. Earth Sci. 7:138. doi: 10.3389/feart.2019.00138
Received: 01 March 2019; Accepted: 15 May 2019;
Published: 29 May 2019.
Edited by:
Rolf Hut, Delft University of Technology, NetherlandsReviewed by:
Ademir Araujo, Federal University of Piauí, BrazilClaudio Mondini, Council for Agricultural and Economics Research, Italy
Copyright © 2019 Joshi Gyawali, Lester and Stewart. This is an open-access article distributed under the terms of the Creative Commons Attribution License (CC BY). The use, distribution or reproduction in other forums is permitted, provided the original author(s) and the copyright owner(s) are credited and that the original publication in this journal is cited, in accordance with accepted academic practice. No use, distribution or reproduction is permitted which does not comply with these terms.
*Correspondence: Ayush Joshi Gyawali, YXl1c2hnN0B2dC5lZHU=
 Ayush Joshi Gyawali
 Brandon J. Lester
 Ryan D. Stewart