 Joseph Carlin
 Jason Addison
 Amy Wagner3
- 1Department of Geological Sciences, California State University, Fullerton, Fullerton, CA, United States
- 2U.S. Geological Survey, Geology, Minerals, Energy, and Geophysics Science Center, Menlo Park, CA, United States
- 3Department of Geological Science, California State University, Sacramento, Sacramento, CA, United States
Continental shelf environments are uniquely situated to capture some of the most dynamic processes on Earth including climatic variability and anthropogenic modifications to coastal systems. Understanding how these processes have affected sediment delivery and accumulation on the shelf in the past may provide insight into potential changes in the future. To address this, we investigated shelf sedimentation within Monterey Bay, California. Sediment cores were collected from four locations throughout the bay to capture both the modern and late Holocene sedimentological record using grain size analysis, and sediment chronologies determined from 210Pb, 137Cs, and 14C. From the grain size results we focused on the total percent sand, and established a Littoral Sand Fraction (LSF) index to assess sediment contribution from the littoral zone as a result coastal erosion. Grain size results from the multicores consistently showed an increase in sand over the past several decades (post 1970s). For the cores located within the bay proximal to three major rivers, the increase in sand corresponded to a general increase in the LSF over the same period. We attributed these trends to increased sediment contributions to the shelf due to accelerated coastal erosion in the region. This accelerated coastal erosion was likely the combined result of dam construction in the mid-twentieth century that limited fluvial supply to the coast, and a shift in climate toward wetter, stormier period. Applying these sediment characteristics back over the past ∼1,000 years we found that dry climatic periods resulted in deposits that were limited in total sand but enriched in littoral material suggesting elevated coastal erosion. During wet periods deposits were enriched in total sand but limited in littoral sand suggesting elevated fluvial supply and low erosion. Compared to the late Holocene record, the previous several decades represent a shift to a new regime, uncharacteristic of deposits over the past millennia, highlighting the impact humans have had on shelf sedimentation.
Introduction
Continental shelf stratigraphy integrates both terrestrial and marine process (Nittrouer, 1999). Typically, terrestrial sediment is supplied to the shelf by rivers, and often progresses through subsequent stages of deposition, remobilization from waves and currents, and redeposition before ultimate burial (Wright and Nittrouer, 1995). Mid-shelf areas specifically, are uniquely situated to be the ultimate sink for this terrestrially derived sediment that is subsequently modified by marine processes (e.g., Traykovski et al., 2000; Puig et al., 2001). Thus, once buried, these deposits maintain evidence of both the terrestrial processes that influenced sediment delivery, and marine processes that controlled secondary transport and deposition.
This combined terrestrial and marine influence is common across a variety of shelf settings. For example, along the Mississippi River margin in the northern Gulf of Mexico, fluvial flood deposits are initially constrained within the innershelf until increased wave energy during winter months remobilizes that sediment across the shelf (Corbett et al., 2004). Therefore, these mid-shelf deposits are dependent on both the fluvial supply from land and subsequent wave conditions (Corbett et al., 2007). This process is not always so stepwise (e.g., initial flood deposit followed later by wave remobilization), rather along some shelves the supply from flood and wave remobilization can occur almost simultaneously. For example, in the Adriatic Sea, floods within the small mountainous rivers draining the Apennine Mountains often correspond to energetic ocean conditions resulting in terrestrial sediment dispersal over greater distances, and the formation of a shelf clinoform with major depocenters disconnected from fluvial sources (Palinkas and Nittrouer, 2006; Palinkas, 2009). Thus, while shelf deposits are influenced by both terrestrial (flood) and marine (wave) processes, for shelves fed by small mountainous rivers these processes are often driven by the same storm event.
In the northeastern Pacific Ocean many continental shelves share similarities with the Apennine margin. Small mountainous rivers debouch into the ocean with high sediment loads during floods that correspond to energetic ocean conditions (Kniskern et al., 2011; Odigie and Warrick, 2017). The Eel River margin in northern California in particular has been extensively studied, highlighting the processes and the depositional characteristics that result from flood and energetic ocean coherence (e.g., Wheatcroft et al., 1997; Traykovski et al., 2000; Wheatcroft and Borgeld, 2000; Harris et al., 2005).
In central and southern California, the coastal ocean and watersheds can be subjected to more extreme conditions than the Eel River watershed and margin, as prolonged dry conditions are interrupted by extremely wet periods as a result of atmospheric rivers (Dettinger et al., 2011; Dettinger and Ingram, 2013) or El Niño events (Inman and Jenkins, 1999; Farnsworth and Milliman, 2003; Warrick and Farnsworth, 2009). For both atmospheric river and El Niño events, coherence between floods and energetic ocean conditions are common, such that the resulting damage from these extreme events is not just flooding, but coastal erosional as well (e.g., Storlazzi and Griggs, 2000; Sallenger et al., 2002; Barnard et al., 2011; Reynolds et al., 2018). In the case of El Niño events specifically, high precipitation and fluvial floods do not always accompany the elevated wave conditions driving coastal erosion, as was the case in southern California during the 2015–2016 El Niño (Barnard et al., 2017).
For regions like central and southern California where the climate is dynamic and extreme, sediment delivery to the shelf is a function of both the runoff on land and the remobilization from waves along the coast and innershelf areas. It is important therefore, to determine how sedimentation changes during stormy periods when runoff and wave activity are high. Further, it is important to know how shelf sedimentation changes when runoff is low, but wave activity might still be high, like during the 2015–2016 El Niño. Moreover, to better understand the potential future variability in the system with respect to climate change, we must determine what impact human modifications of drainage systems (e.g., dams) have on shelf sedimentation. These modifications have essentially limited runoff but left wave activity (and other coastal processes) largely unaffected. Given these knowledge gaps, the goal of this study was to characterize variability in shelf sedimentation over decadal to centennial time scales. In particular, we were interested in changes in sediment sources and delivery as related to climatic cycles over the late Holocene, and more recent human activity.
To accomplish this goal, we focused on the Monterey Bay continental shelf along the central California coast. Monterey Bay experiences dynamic ocean conditions including wave heights that can exceed 8 m during the winter from the North Pacific, very long period (>20 s) waves from the Southern Ocean during summer, and local wind waves from storms (Storlazzi and Field, 2000). Additionally, the region is subjected to both the net southward flowing California Current, and northward flowing Davidson Current (Griggs, 1974; Huyer et al., 1998), the latter of which dominantly drives fine-grain sediment transport along the mid-shelf (Eittreim et al., 2002; Xu et al., 2002). Terrestrial sediment is supplied to the system predominantly from three rivers, and to a lesser extend from smaller creeks and cliff erosion (Eittreim et al., 2002; Xu et al., 2002). The largest sediment supply is from the Salinas River, which like the Eel River in northern California, can deliver extreme sediment discharges to the ocean during flood events (Farnsworth and Milliman, 2003). These extreme fluvial discharges and dynamic ocean conditions are influenced by larger Pacific Ocean cycles such as El Niño Southern Oscillation (ENSO), Pacific Decadal Oscillation (PDO), and North Pacific Gyre Oscillation (NPGO) (Storlazzi and Griggs, 2000; Schwing et al., 2002; Di Lorenzo et al., 2008; Storlazzi and Reid, 2010; Chenillat et al., 2012; Jacox et al., 2014). From this study we hope to demonstrate the usefulness of physical sediment characteristics on the shelf in distinguishing past changes in terrestrial sediment fluxes to the ocean, and the impact humans have had on the system.
Materials and Methods
Sediment Core Collection and Ancillary Analyses
Five sediment cores from 4 locations were collected from throughout Monterey Bay in 2014 on the R/V Point Sur and 2017 on the R/V Shana Rae (Figure 1). Cores PS1410-04MC (37.046530°N, 122.404000°W, 100 m water depth) and PS1410-11MC (36.837017°N, 121.882150°W, 63 m water depth) are multicores (∼30 cm long) collected in 2014 using the R/V Point Sur. The site of PS1410-04MC is located north of Monterey Bay proper, seaward of Point Ano Nuevo, near the head of Ascension Canyon. The site of PS1410-11MC is located in central Monterey Bay, north of the Monterey Submarine Canyon, proximal to the present-day mouth of the Pajaro River. During this same cruise we also collected an ∼86 cm long gravity core, PS1410-08GC (36.701600°N, 121.905040°W, 85 m water depth) from southern Monterey Bay. In 2017 two additional multicores were collected using the R/V Shana Rae. The site of SR1707-07MC (36.873000°N, 122.034840°W, 69 m water depth) is located along the northern Monterey Bay shelf, approximately seaward of the city of Santa Cruz, CA. SR1707-02MC was collected from the same location (within 10 m) as PS1410-08GC from 2014. This core was specifically collected to overlap with the gravity core PS1410-08GC, providing intact surface intervals that may have been disturbed in the gravity corer during retrieval.
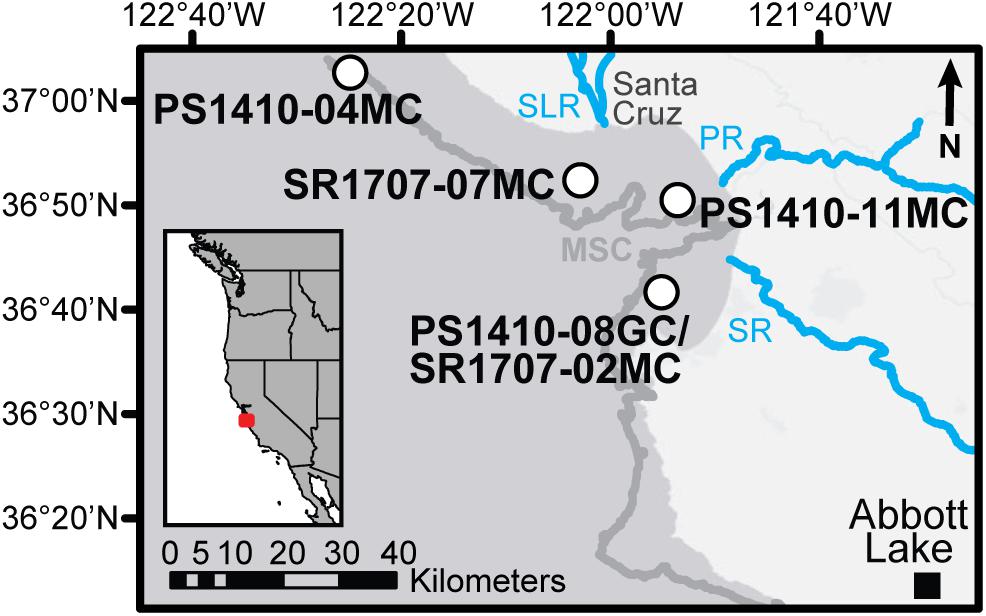
Figure 1. Map of the Monterey Bay study area. Core locations are shown as white dots, note that PS1410-08GC and SR1707-02MC were collected from the same location. The three major rivers draining into Monterey Bay (SLR – San Lorenzo River, PR – Pajaro River, and SR – Salinas River) are shown in blue. The 100 m isobath offshore is shown with the gray line, along with the location of the Monterey Submarine Canyon (MSC). The black square shows the location of Abbott Lake within the Salinas River watershed from which a regional hydroclimate record was utilized (Hiner et al., 2016).
For all the multicore sites, four sub-cores were simultaneously collected. The analysis assignment to each of the collected cores were as follows; one was reserved for non-destructive analyses such as multi-sensor core logging, and 3D computed tomography (CT) imaging (the results of these analyses will not be discussed in detail), one was designated for 210Pb and 137Cs analyses, one was utilized for grain size analysis, and one was designated as an archive, or used for analyses not associated with this study. For the gravity core, all logging, imaging, and analyses were performed on the same core. Multi-sensor core logging was performed on intact, full-round cores for the entire length of the core, at a 1 cm sampling interval using a GeoTek Multi-Sensor Core Logger (MSCL-S). For this study, only the gamma-ray wet bulk density data was used for PS1410-08GC to relate to the CT imagery. The CT imaging was performed on split, half-rounds for cores PS1410-04MC, PS1410-11MC, and PS1410-08GC, and on intact, full-round cores for SR1707-07MC, and SR1707-02MC using a GE LightSpeed Ultra medical CT scanner with a source radiation of 140 kV and 120 mA; the analysis was conducted in the SUPRI-A Lab at Stanford University. For PS1410-11MC, CT slices were taken every 1.25 mm for the length of the core, while for all other cores the slices were taken every 2.5 mm for the length of the core. All CT measurements are expressed as Hounsfield units, which is a measure of a material’s bulk radiodensity relative to that of water. CT image processing was performed using ImageJ software (Abràmoff et al., 2004). The CT images were used to assess sedimentary fabric throughout the cores.
Grain Size Analysis
Particle size distributions were measured on 1 cm contiguous intervals for the full length of all cores. Approximately 0.5 g of wet sediment was used for analysis. Each sample was pretreated with 30–90 ml of 30% H2O2 to remove organic matter, 10 ml of 1 M HCl to remove carbonates, and 10 ml of 1 M NaOH to remove biogenic silica. These pretreatments ensured that the subsequent grain size measurement reflects the particle size distribution of the lithogenic fraction only. Each sample was measured via laser diffraction using a Malvern Mastersizer 2000. Quality control for the instrument was routinely assessed by measuring a 1–16 μm tuff or silica carbide standard at the start of each daily measurement batch, after every 10th sample analyzed, and at the end of each measurement day.
Geochronology
Modern sediment ages were determined from 210Pb and 137Cs geochronologies. Core PS1410-11MC was subsampled into 0.5 cm intervals for the upper 20 cm of the core, and 1 cm intervals below 20 cm. PS1410-04MC was subsampled in 1 cm intervals throughout the whole length of the core, and cores SR1707-07MC and SR1707-02MC were both subsampled in 1 cm intervals for the upper 10 cm of the core and 2 cm intervals below 10 cm. The variability in subsampling was due to instrument demand over the study period, where times of low demand allowed for higher resolution subsampling. Each subsample was dried overnight in an 80°C oven, ground into a fine powder, and packed into petri dishes. Each dish was sealed and incubated for at least 20 days to ensure secular equilibrium 226Ra (supported 210Pb) and the measured daughter isotopes (214Pb and 214Bi) (Goodbred and Kuehl, 1998).
All subsamples were counted for at least 24 h on a High-Purity Broad Energy Germanium Gamma Detector (BE3825, Canberra Industries Inc.,) with a multi-channel analyzer (DSA-LX, Canberra Industries Inc.). The activity of total 210Pb was determined from the energy peak at 46.5 keV, with supported 210Pb determine by averaging the activities of the 214Pb peaks (295 keV and 351.9 keV) and the 214Bi peak (609 keV). Excess 210Pb (210Pbxs) was calculated for each sample by subtracting the measured supported 210Pb from the measured total 210Pb. All 210Pbxs activities were corrected for self-absorption following the methods of Cutshall et al. (1983). The activity of 137Cs was also determined for all samples from the energy peak at 661 keV. All radioisotope activities were decay-corrected to the date when the core was collected, and all errors were propagated from counting statistics.
Sediment cores SR1707-02MC and PS1410-08GC were located within 10 m of one another and were spliced together to create a composite record using the co-occurrence of a low-density bed identified in the CT scan results for the two cores (Figure 2A). An age-depth model for the composite depth scale was determined by combining the core-top ages of collection for both cores, the excess 210Pb geochronology results from SR1707-02MC (see section “SR1707-02MC”), and four AMS 14C benthic foraminifera dates from PS1410-08GC (Table 1). For this study, since both cores were collected from the shallow continental shelf (85 m water depth) region of Monterey Bay, we explicitly assume benthic foram dates are equivalent to planktic foram dates. The AMS 14C samples were manually calibrated using CALIB (v.7.0.4; Reimer et al., 2013) with the MARINE13 curve (Stuiver and Reimer, 1993) using a marine reservoir correction of ΔR = 280 ± 50 years. Age-depth modeling was performed using CLAM (v.2.2; Blaauw, 2010), and was programmed to use the 2σ calibration range of each date with weighting by calibrated probabilities, 100,000 Monte Carlo-style iterations, and calendar age-point estimates for depths were based on the weighted average of all non-reversing age-depth curves.
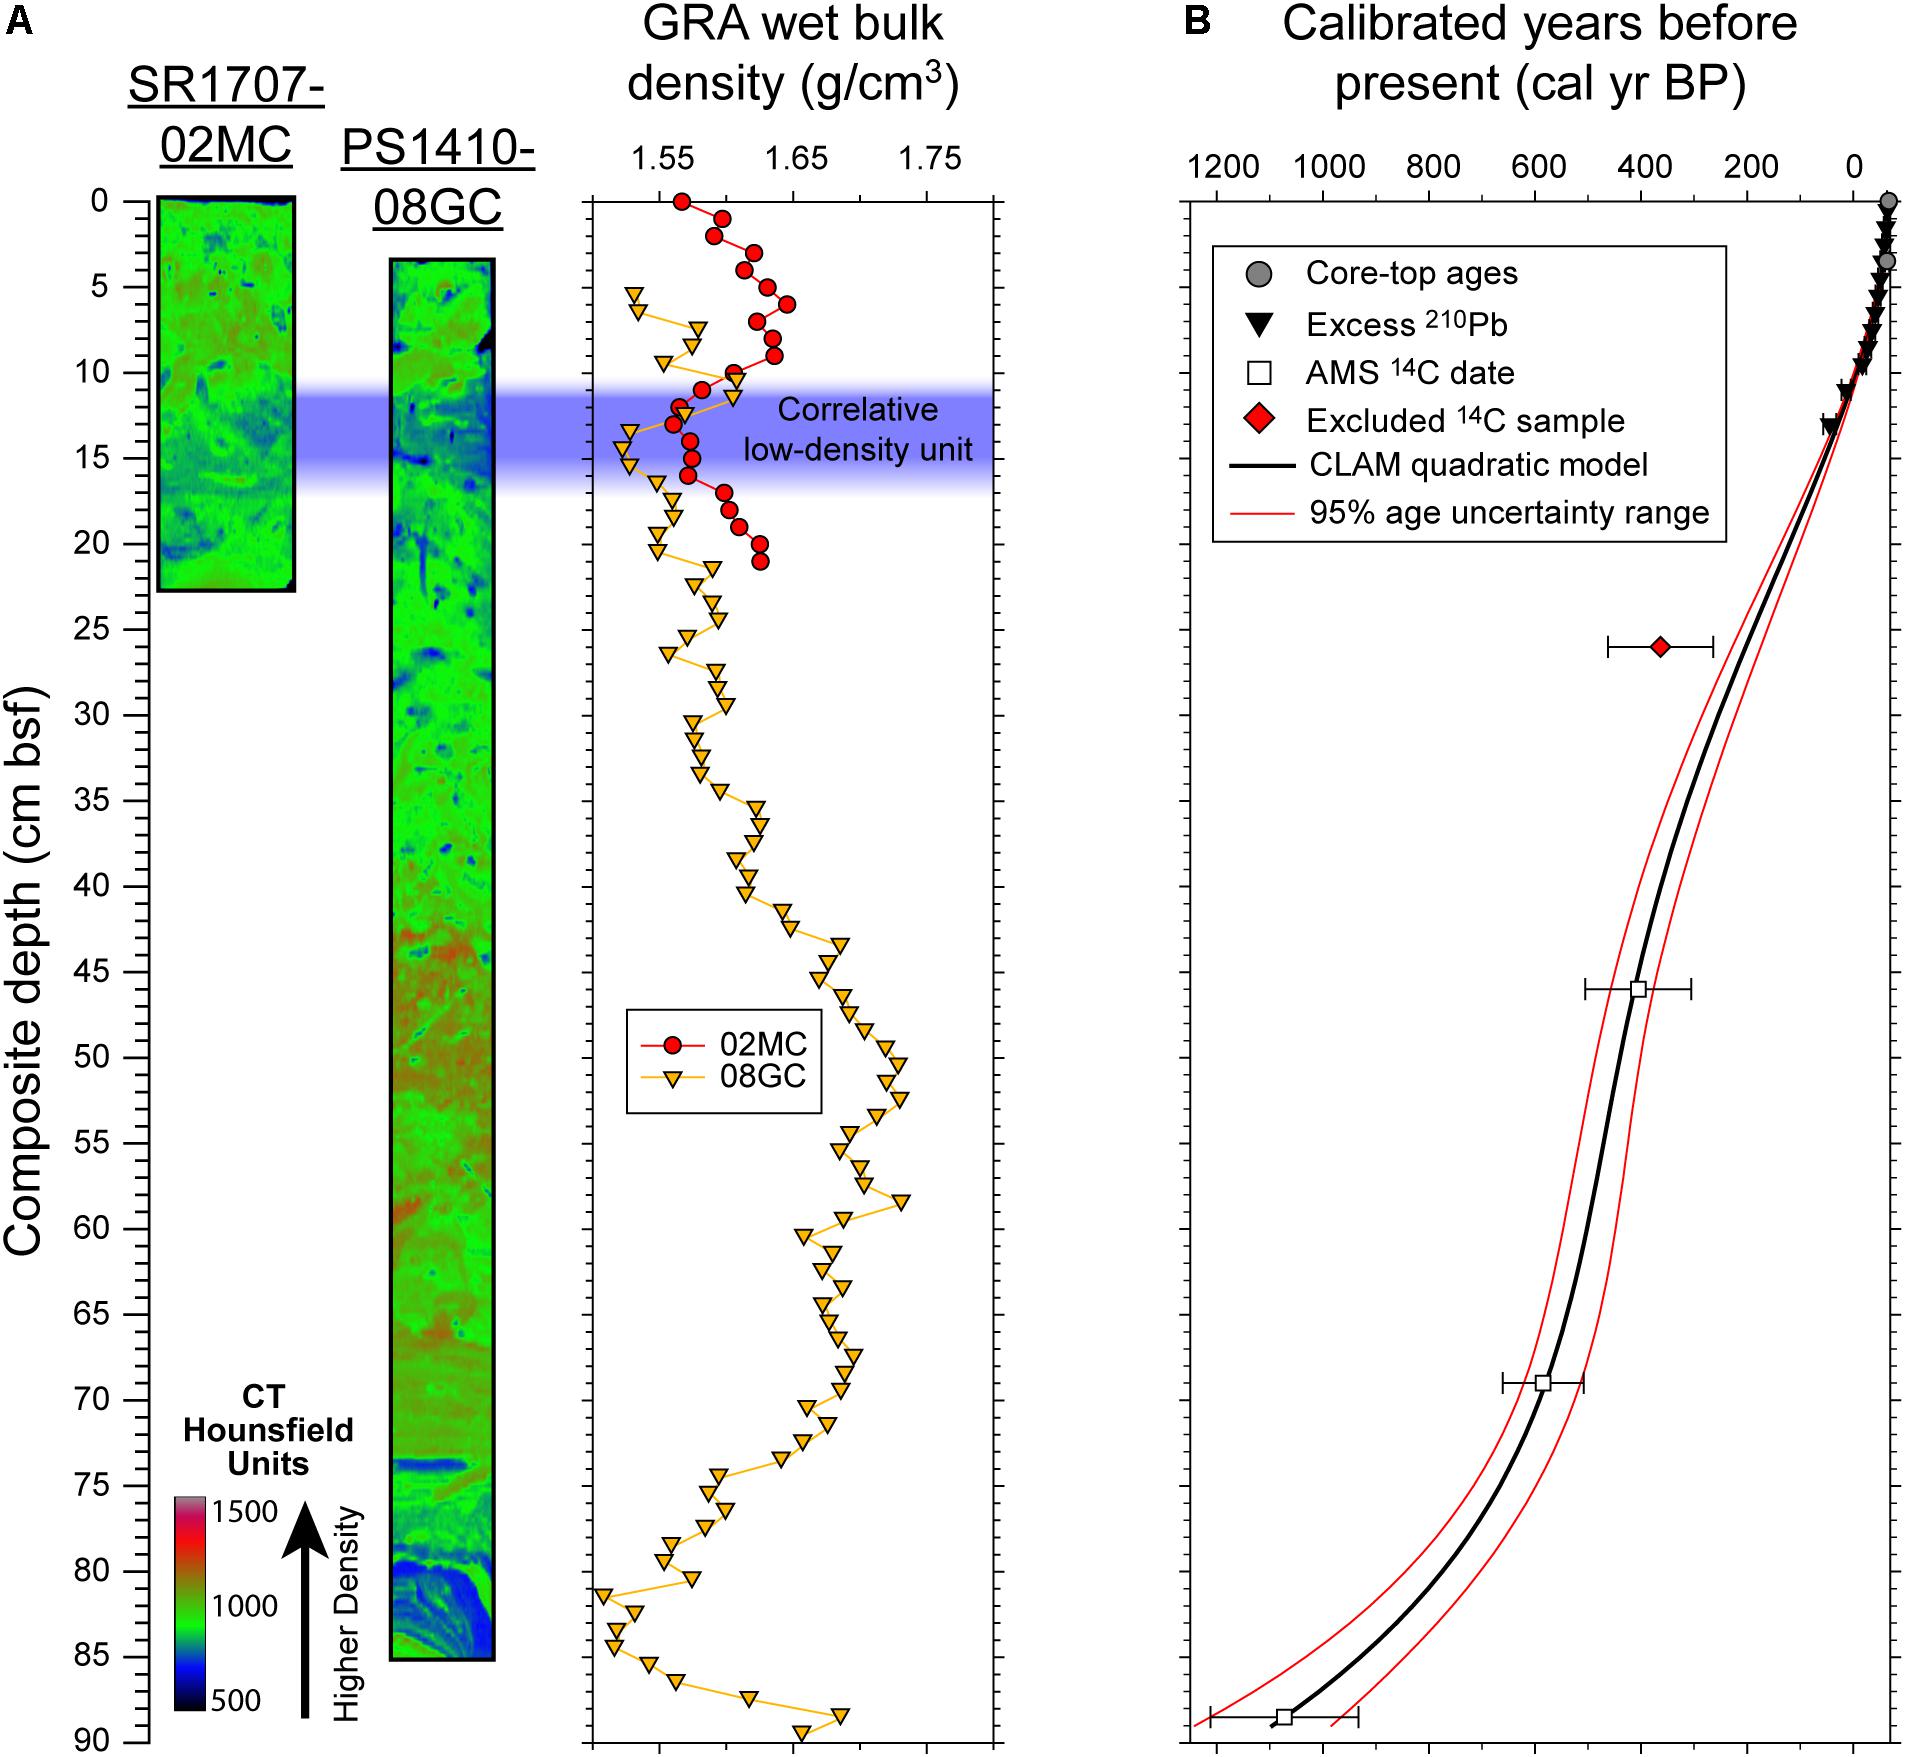
Figure 2. (A) Stratigraphic correlation of SR1707-02MC and PS1410-08GC using CT imaging and GRA wet bulk density. The presence of a low-density horizon allows for the alignment of 08GC to the 02MC datum. (B) CLAM quadratic regression age model and 95% uncertainty range. Ages are expressed as years Before Present (BP) where “present” is referenced to 1950 CE.
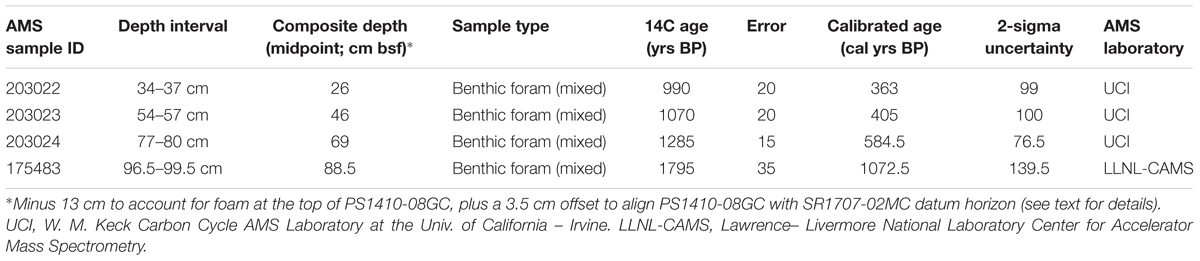
Table 1. Radiocarbon samples for PS1410-08GC.
Results
PS1410-04MC
PS1410-04MC was the only core located outside of Monterey Bay proper along the open coast north of the bay near Pt. Ano Nuevo (Figure 1). The results for PS1410-04MC are shown in Figure 3. PS1410-04MC is 35 cm long and the CT image (Figure 3A) shows the core is generally well-mixed, with an indistinct mottled texture and few discernable sedimentary structures. There is one large, low-density, distinct mottle spanning depths from ∼20–33 cm. Results from the grain size analyses are shown in Figures 3B–I. Figure 3B shows the full particle size distributions for all samples down core. From this data we see that most of the sediment falls between ∼20–200 μm, and the distributions are generally consistent up core. There are two noticeably finer layers around 30 cm and 20 cm, while above 14 cm there are tighter distributions centered around ∼60 μm marked by values >7% (darker red colors) in Figure 3B.
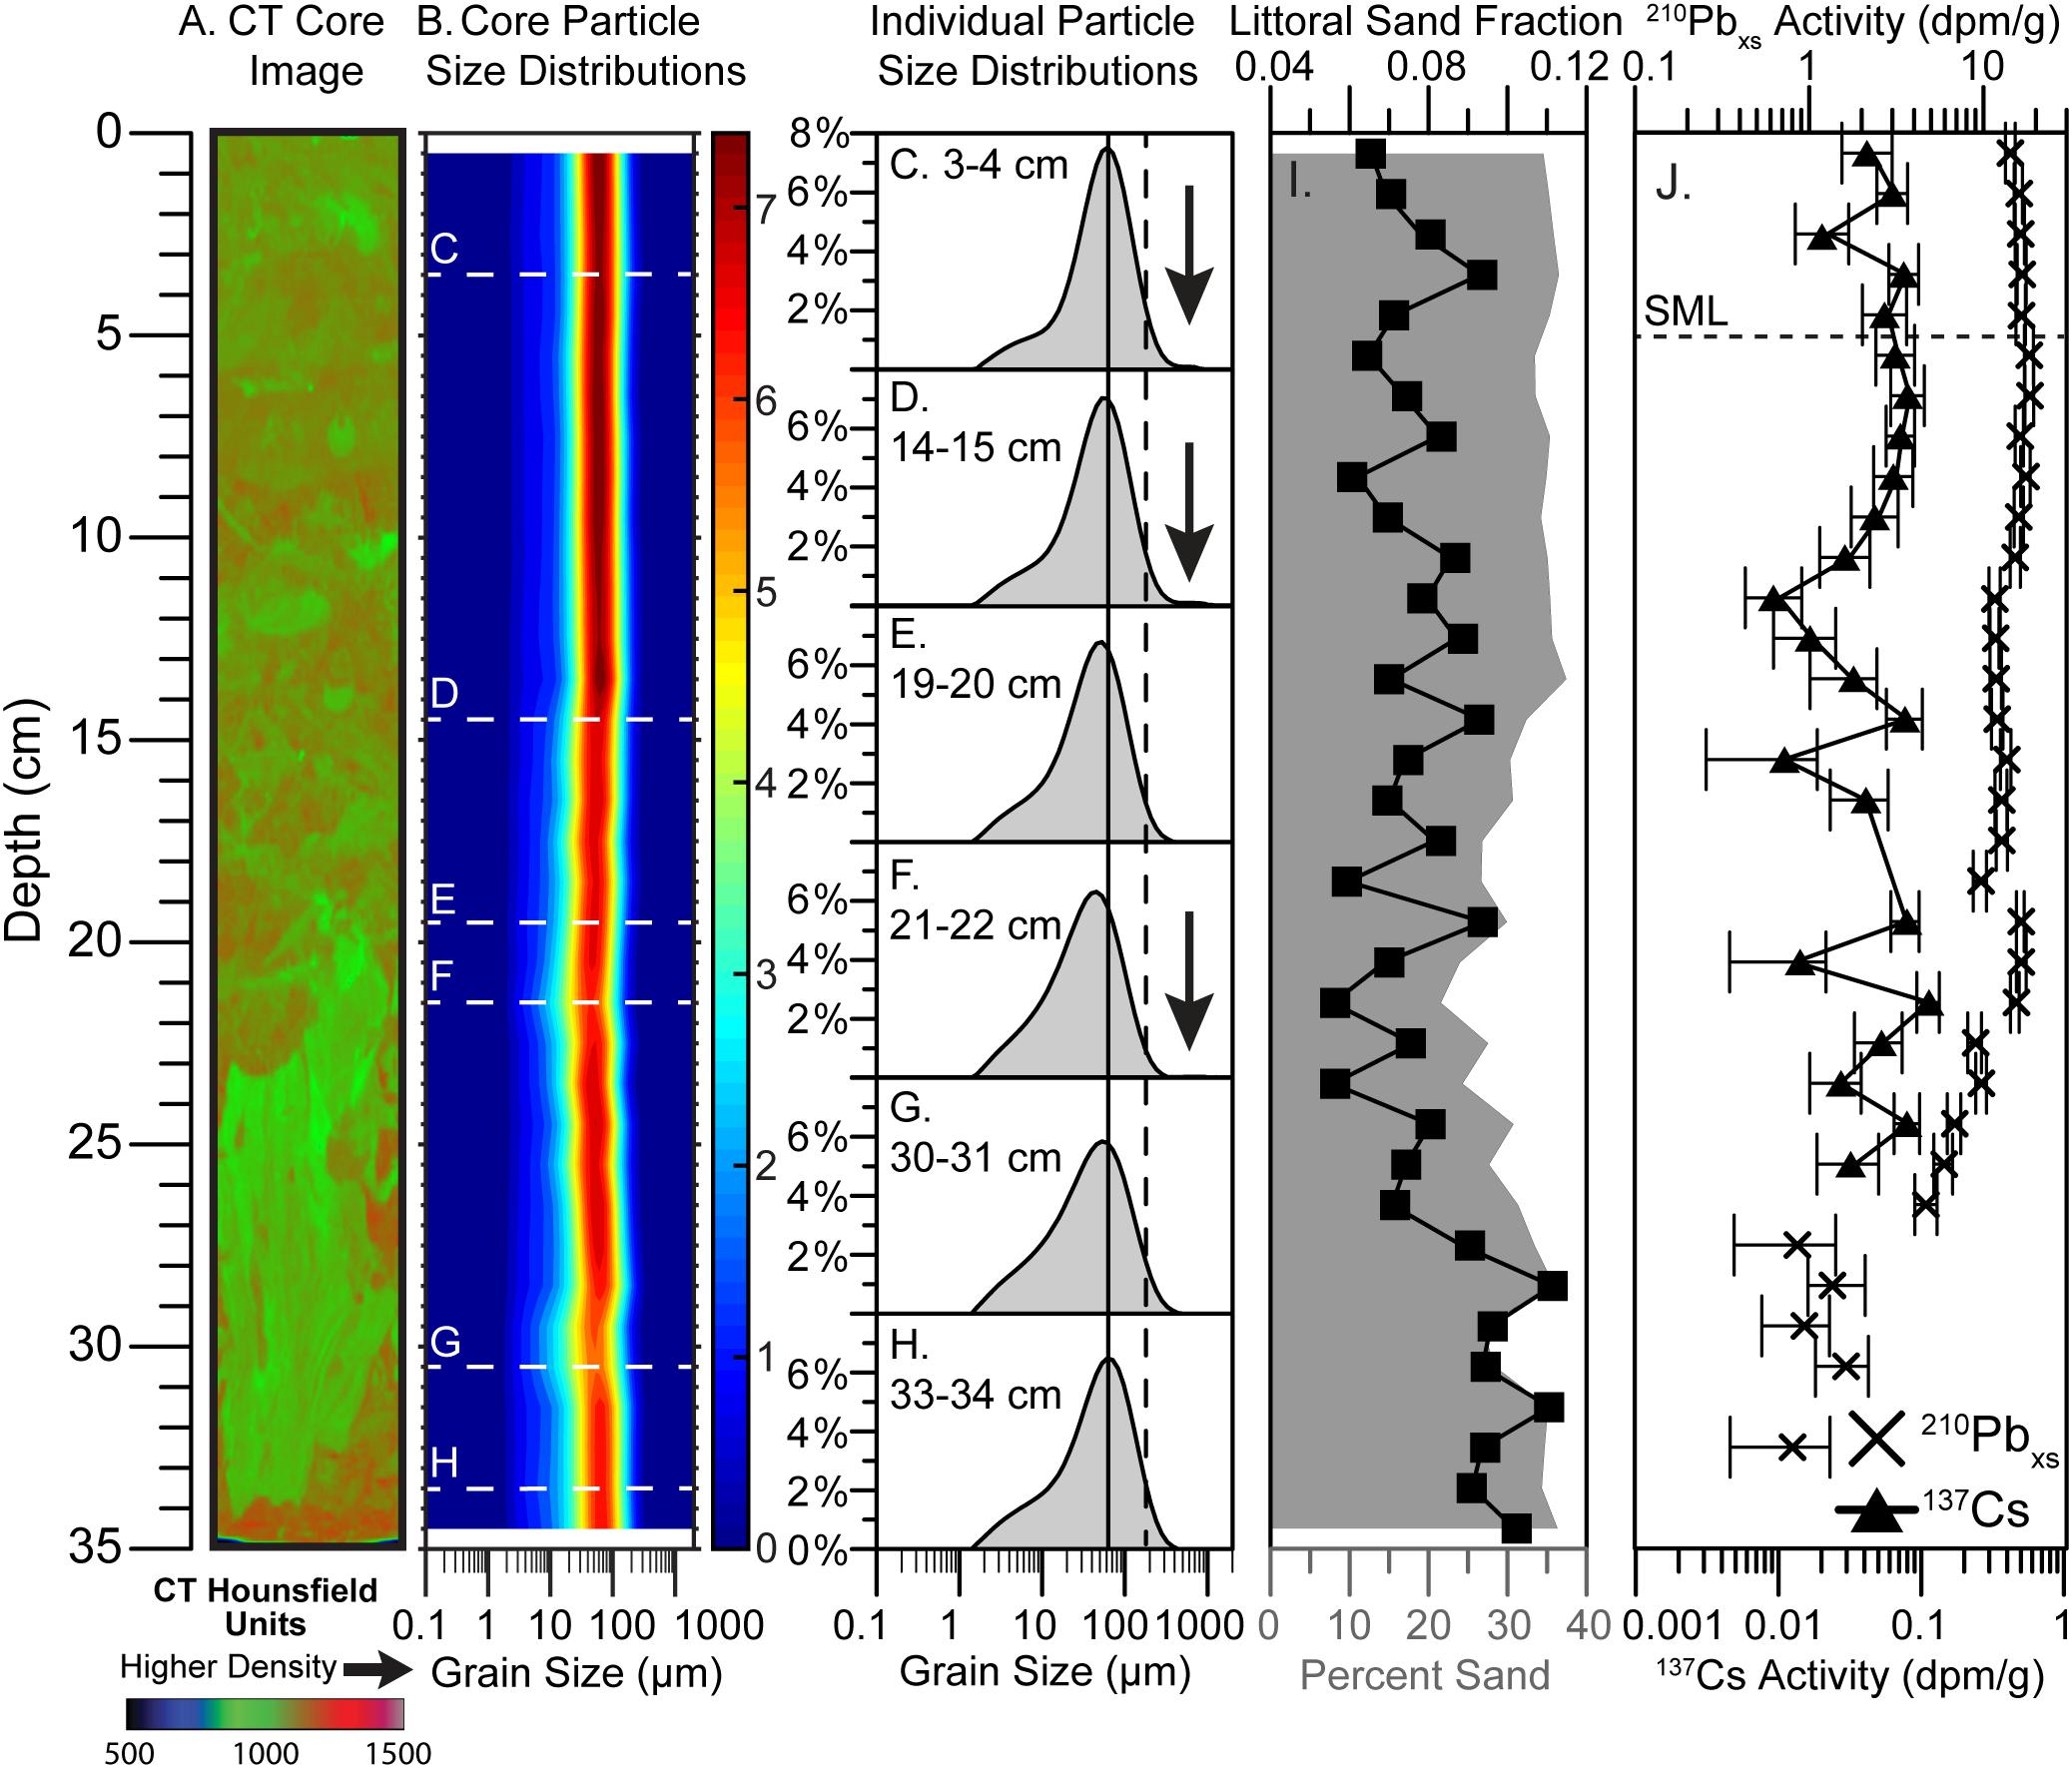
Figure 3. Results from PS1410-04MC (see Figure 1 for location). (A) CT image of the core where cooler colors (blues and greens) are relatively lower density deposits, and warmer colors (reds) are higher density. (B) Down core total grain size distribution for all samples. In this plot the y-axis is depth down the core, x-axis is particle size, and the colors represent the volume present of the sample that fall within those size classifications, where warmer colors are higher percentages and cooler colors are lower percentages. The warmest color region across any depth horizon represents the mode for the sample. Representative individual sample particle size distributions (PSD) are shown in (C–H), where the depths of these PSD are highlighted in (B) as white dashed lines. The solid black vertical line in (C–H) notes the silt/sand boundary at 63 μm and the dashed black vertical line notes the Monterey Bay littoral cutoff diameter at 180 μm (see text for explanation). Black arrows in the plot point to samples with increases in material coarser than the littoral cutoff diameter. The raw measurement size bins for the instrument were used to create the distributions in (B–H). (I) Down core results from the grain size analysis with total percent sand (gray area) and the littoral sand fraction (black squares – see text for explanation). (J) Down core results for the 210Pbxs (black Xs) and 137Cs (black triangles). The dashed horizontal line is the inferred depth of the Surface Mixed Layer (SML) based on the 210Pbxs results.
Figures 3C–H pull out representative samples from the overall core data to show individual sample particle size distributions (PSD). From these individual PSD we can see that the samples in the upper 14 cm (Figures 3C,D) with the observed tighter distributions have high, narrow peaks with the primary mode near the 63 μm silt/sand boundary, and a relatively smaller contribution in the fine silt and clay portion of the distribution below ∼20 μm. By contrast the finer layers (Figures 3F,G), show relative increases in the below ∼20 μm region. While the 30–31 cm sample (Figure 3G) has a mode that is still near the silt/sand boundary, the mode for the 21–22 cm sample (Figure 3F) by contrast is shifted to the left and clearly finer than the silt/sand boundary. Interestingly, in Figures 3C,D,F the PSD show a very coarse tail (noted by the black arrows, it may be difficult to see in 3F given the way that this figure laid out) where there is a small sub-population of grains coarser than ∼300 μm.
In Figure 3I we have plotted the total sand content (gray shaded) and the Littoral Sand Fraction (discussed in detail below). The total sand ranges between 20–40% throughout the core, and typically ∼35%. For the identified finer layer around 30 cm the total sand content dips to <30%, down from 35%. Around 20 cm is the lowest sand content at ∼20%, part of a broader decrease of sand up core beginning around 25 cm. Above 20 cm the sand then increases back up to ∼35% at a depth of 15 cm.
The 210Pbxs and 137Cs results are shown in Figure 3J. Overall, the 210Pbxs profile exhibits characteristics of both steady-state accumulation and non-steady-state accumulation. From the 210Pbxs data we estimate that the surface mixed layer (SML) extends down to ∼5 cm based on the near uniform activity with depth. Below the SML down to ∼10 cm the activity decreases with depth at relatively steep slope. From 10 cm down to ∼20 cm the activity is generally uniform to slightly increasing with depth. Below this section, activities again decrease with depth, although at a noticeably lower slope than above. From ∼25 cm to 32 cm in the core the activities are low (∼1 dpm/g), and generally decrease with depth with some fluctuations. No 210Pbxs was detected below 33 cm.
For 137Cs, activities vary between ∼0.01–0.1 dpm/g. There is no clear peak, the highest activities (0.11 ± 0.02 dpm/g) were measured at 22 cm, with comparable values at 15 cm and 25 cm (0.08 ± 0.02 dpm/g for both). The maximum penetration of 137Cs was 26 cm, which after adjusting for the SML thickness, would place the 1954 CE first-occurrence horizon at a depth of 21 cm.
SR1707-07MC
The results from SR1707-07MC are shown in Figure 4. This core serves as our northern Monterey Bay representative sample, and the sample closest to the mouth of the San Lorenzo River, which has the 3rd largest sediment input to the bay (Eittreim et al., 2002). Core SR1707-07MC is 17 cm long and lacks any bedding or layers. Rather, the core consists of indistinct mottling throughout (Figure 4A). Grain size results show the core is comprised of sandy-mud, with an overall relatively consistent PSD throughout the core (Figure 4B). In this core most particles fall between ∼30–150 μm. In the upper ∼6 cm of the core there is tighter distribution (values >8%, marked by dark red colors in Figure 4B) similar to what was observed in PS1410-04MC.
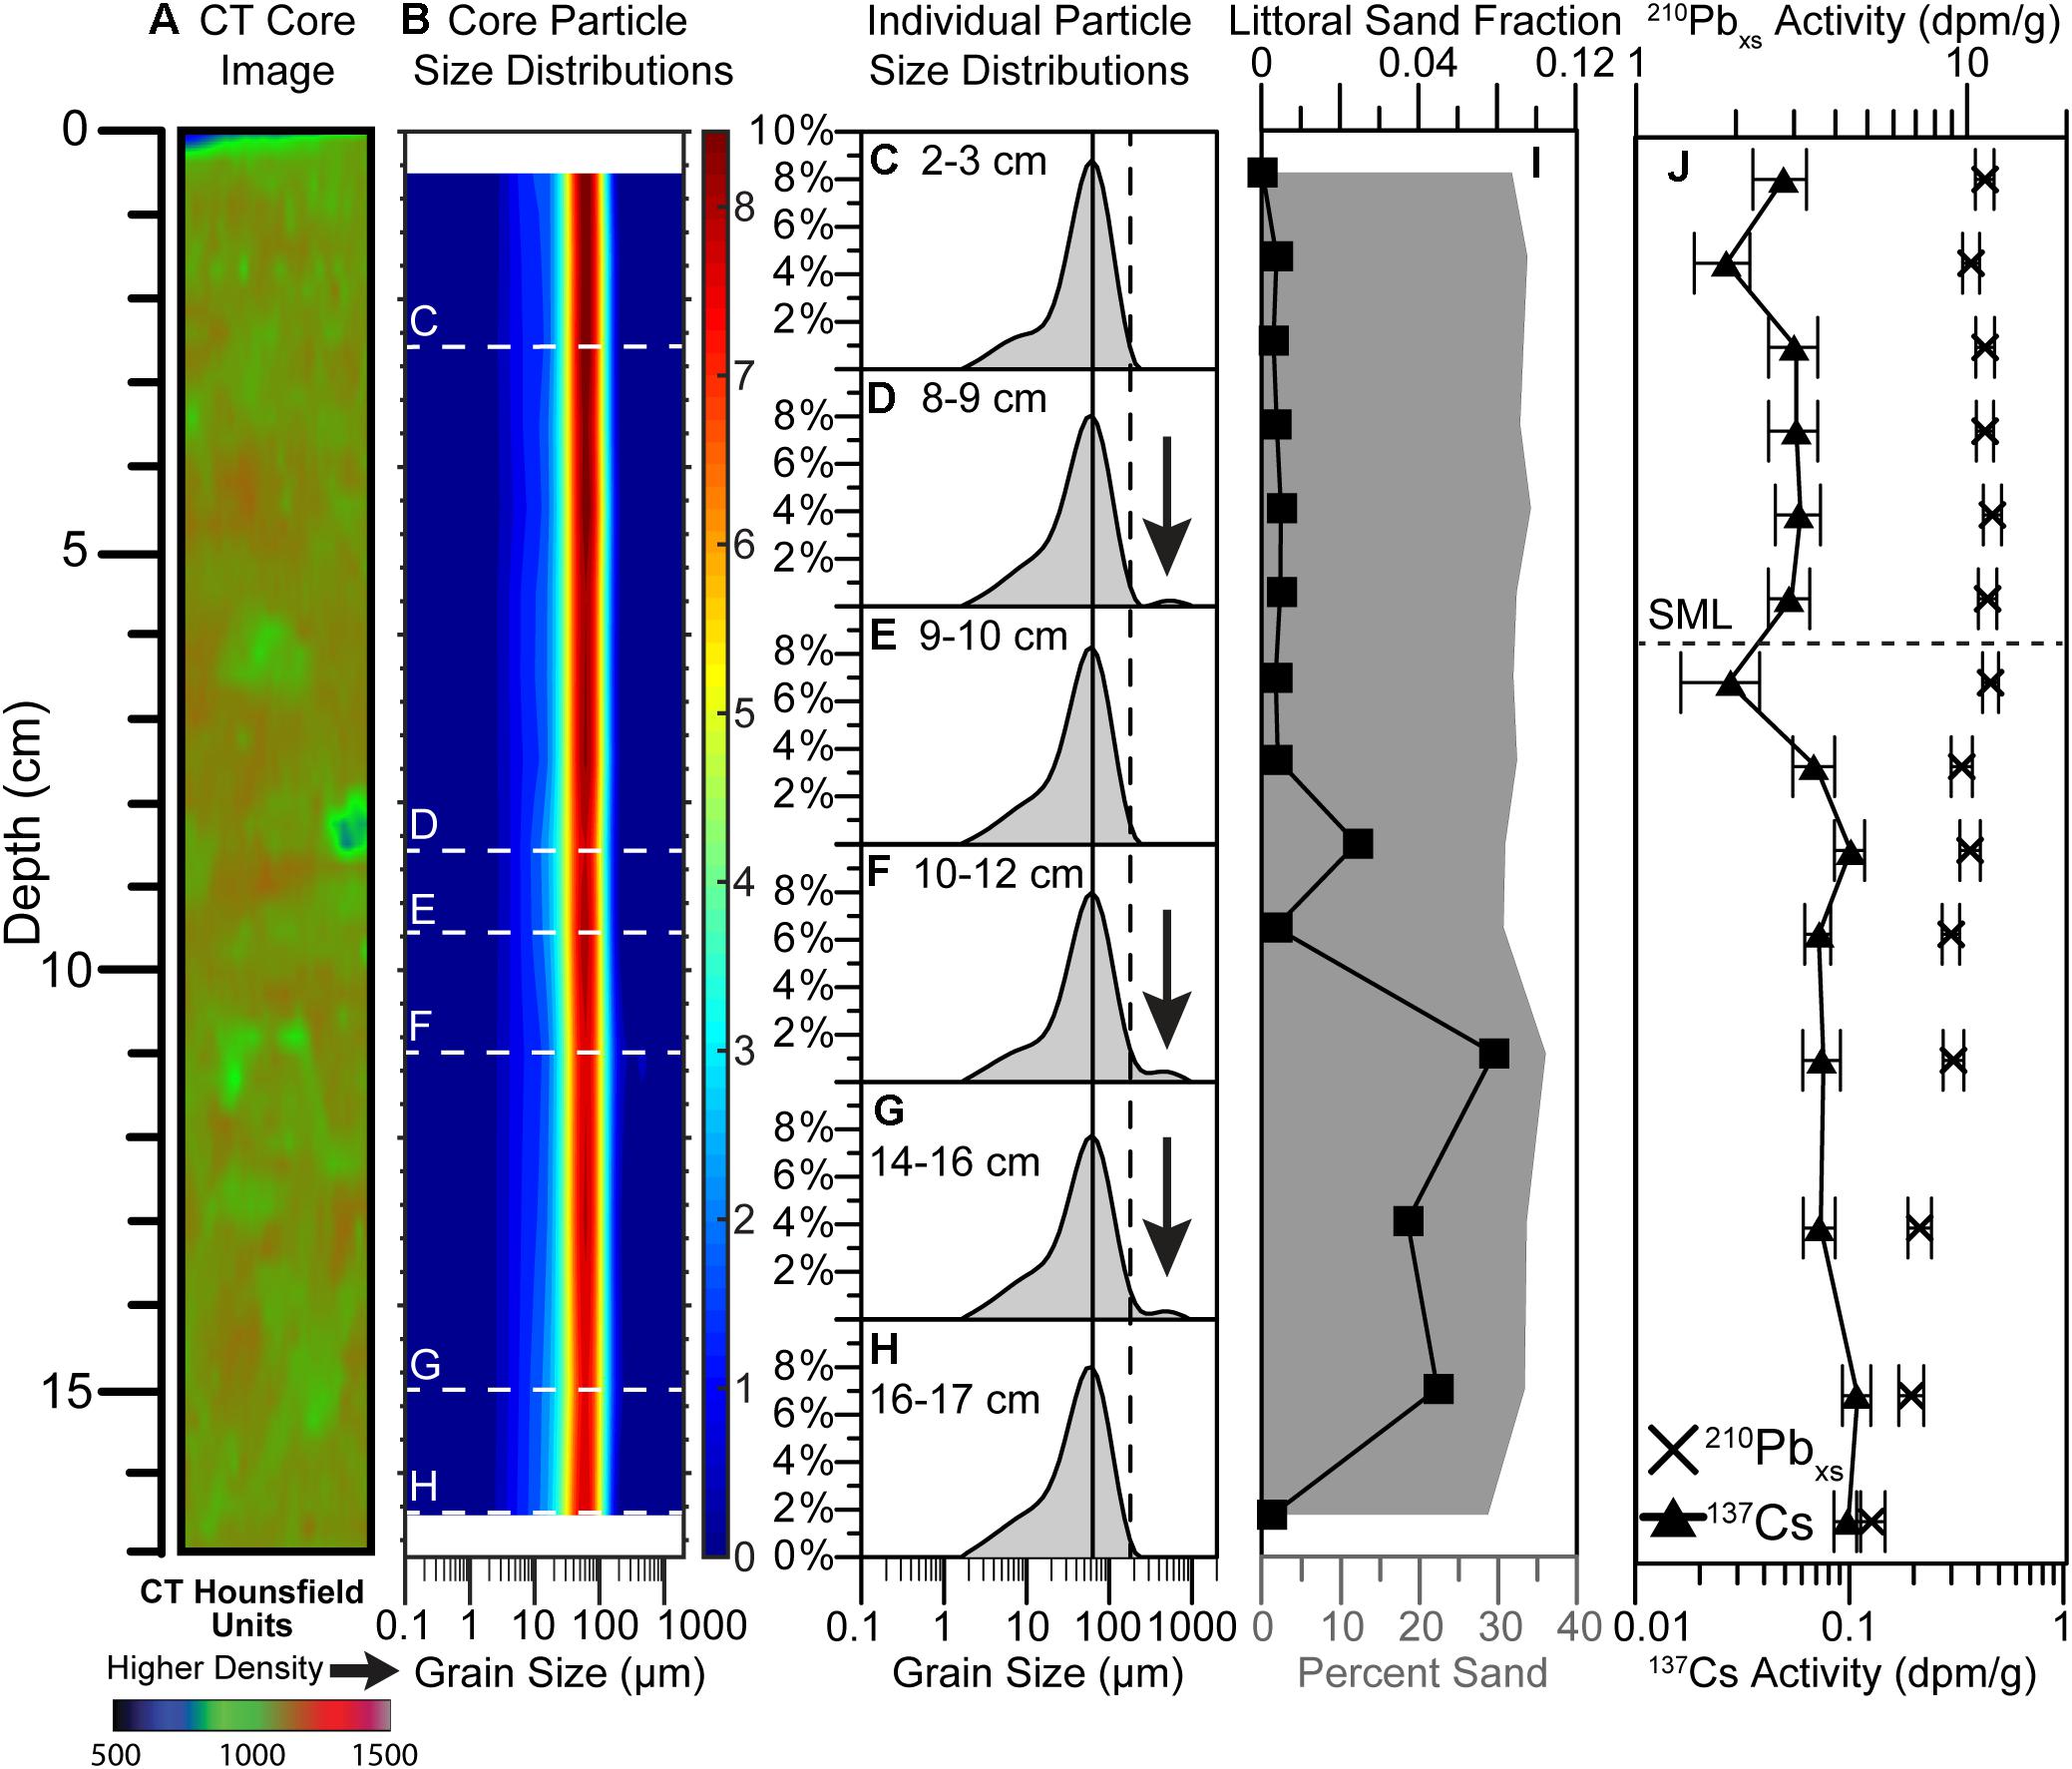
Figure 4. Results from SR1707-07MC (see Figure 1 for location). (A) CT image of the core where cooler colors (blues and greens) are relatively lower density deposits, and warmer colors (reds) are higher density. (B) Down core total grain size distribution for all samples. In this plot the y-axis is depth down the core, x-axis is particle size, and the colors represent the volume present of the sample that fall within those size classifications, where warmer colors are higher percentages and cooler colors are lower percentages. The warmest color region across any depth horizon represents the mode for the sample. Representative individual sample particle size distributions (PSD) are shown in (C–H), where the depths of these PSD are highlighted in (B) as white dashed lines. The solid black vertical line in (C–H) notes the silt/sand boundary at 63 μm and the dashed black vertical line notes the Monterey Bay littoral cutoff diameter at 180 μm (see text for explanation). Black arrows in the plot point to samples with increases in material coarser than the littoral cutoff diameter. The raw measurement size bins for the instrument were used to create the distributions in (B–H). (I) Down core results from the grain size analysis with total percent sand (gray area) and the littoral sand fraction (black squares – see text for explanation). (J) Down core results for the 210Pbxs (black Xs) and 137Cs (black triangles). The dashed horizontal line is the inferred depth of the Surface Mixed Layer (SML) based on the 210Pbxs results. Both 210Pbxs and 137Cs were detected at the base of this core.
From the individual PSD (Figures 4C–H) the shapes are comparable between all samples with modes proximal to the silt/sand boundary. The sample from 2–3 cm (Figure 4C) has a high, narrow peak with smaller contributions from the fine silt and clay sub-populations. This translates into the tight distribution and dark red colors noted in Figure 4B. For the other PSD shown there is a relative increase in the finer fractions (slightly less so at 10–12 cm in Figure 4F), but the mode for all samples remains relatively consistent. In Figures 4D,F,G we also observed the coarser sub-populations in the core (noted by the black arrow). As with PS1410-04MC, these sub-populations are coarser than ∼300 μm, but in this core these coarse tails are more clearly visible in the plots, and for the sample at 8–9 cm (Figure 4D) actually appear detached from full distribution curve.
For the total sand content (Figure 4I), the values are consistently ∼30% throughout the core. Total sand is slightly higher between 10–16 cm, closer to ∼35%. The total sand content is lowest between 7–9 cm, although this decrease is only slightly noticeable.
Both 210Pbxs and 137Cs were detected through the base of this short core (Figure 4J), suggesting that all deposits are at least younger than 1954 CE. Uniform activity with depth in the 210Pbxs profile places the base of the SML at a depth of 6 cm. Below the SML the 210Pbxs decreases with depth suggesting relatively steady-state accumulation.
PS1410-11MC
PS1410-11MC was collected from central Monterey Bay, proximal to the mouth of the Pajaro River, which is the second largest sediment input to the bay (Eittreim et al., 2002). The core is 32 cm long and contains variable sedimentary fabric throughout. From the CT image in Figure 5A, the upper ∼7 cm are indistinctly mottled, dominated by low-density mottles. From ∼7–17 cm higher-density mottles are more common. Core depths between ∼17–20 cm contain thin (sub-centimeter), regular, tabular, and lenticular layers. At a depth of 21 cm, there are three large (centimeter-scale) layers that extend down to ∼25 cm. The uppermost layer is relatively low-density, ∼3 cm thick, with a sharp upper contact, and slightly modified to diffuse lower contact. Below is a ∼1 cm thick relatively high-density layer with a sharp lower contact into a ∼2 cm low-density layer. This lowermost layer has an irregular lower contact that appears as if a large mottle has intruded from below into this distinct layer. Below 25 cm the core again is indistinctly mottled, dominated by lower-density sediment.
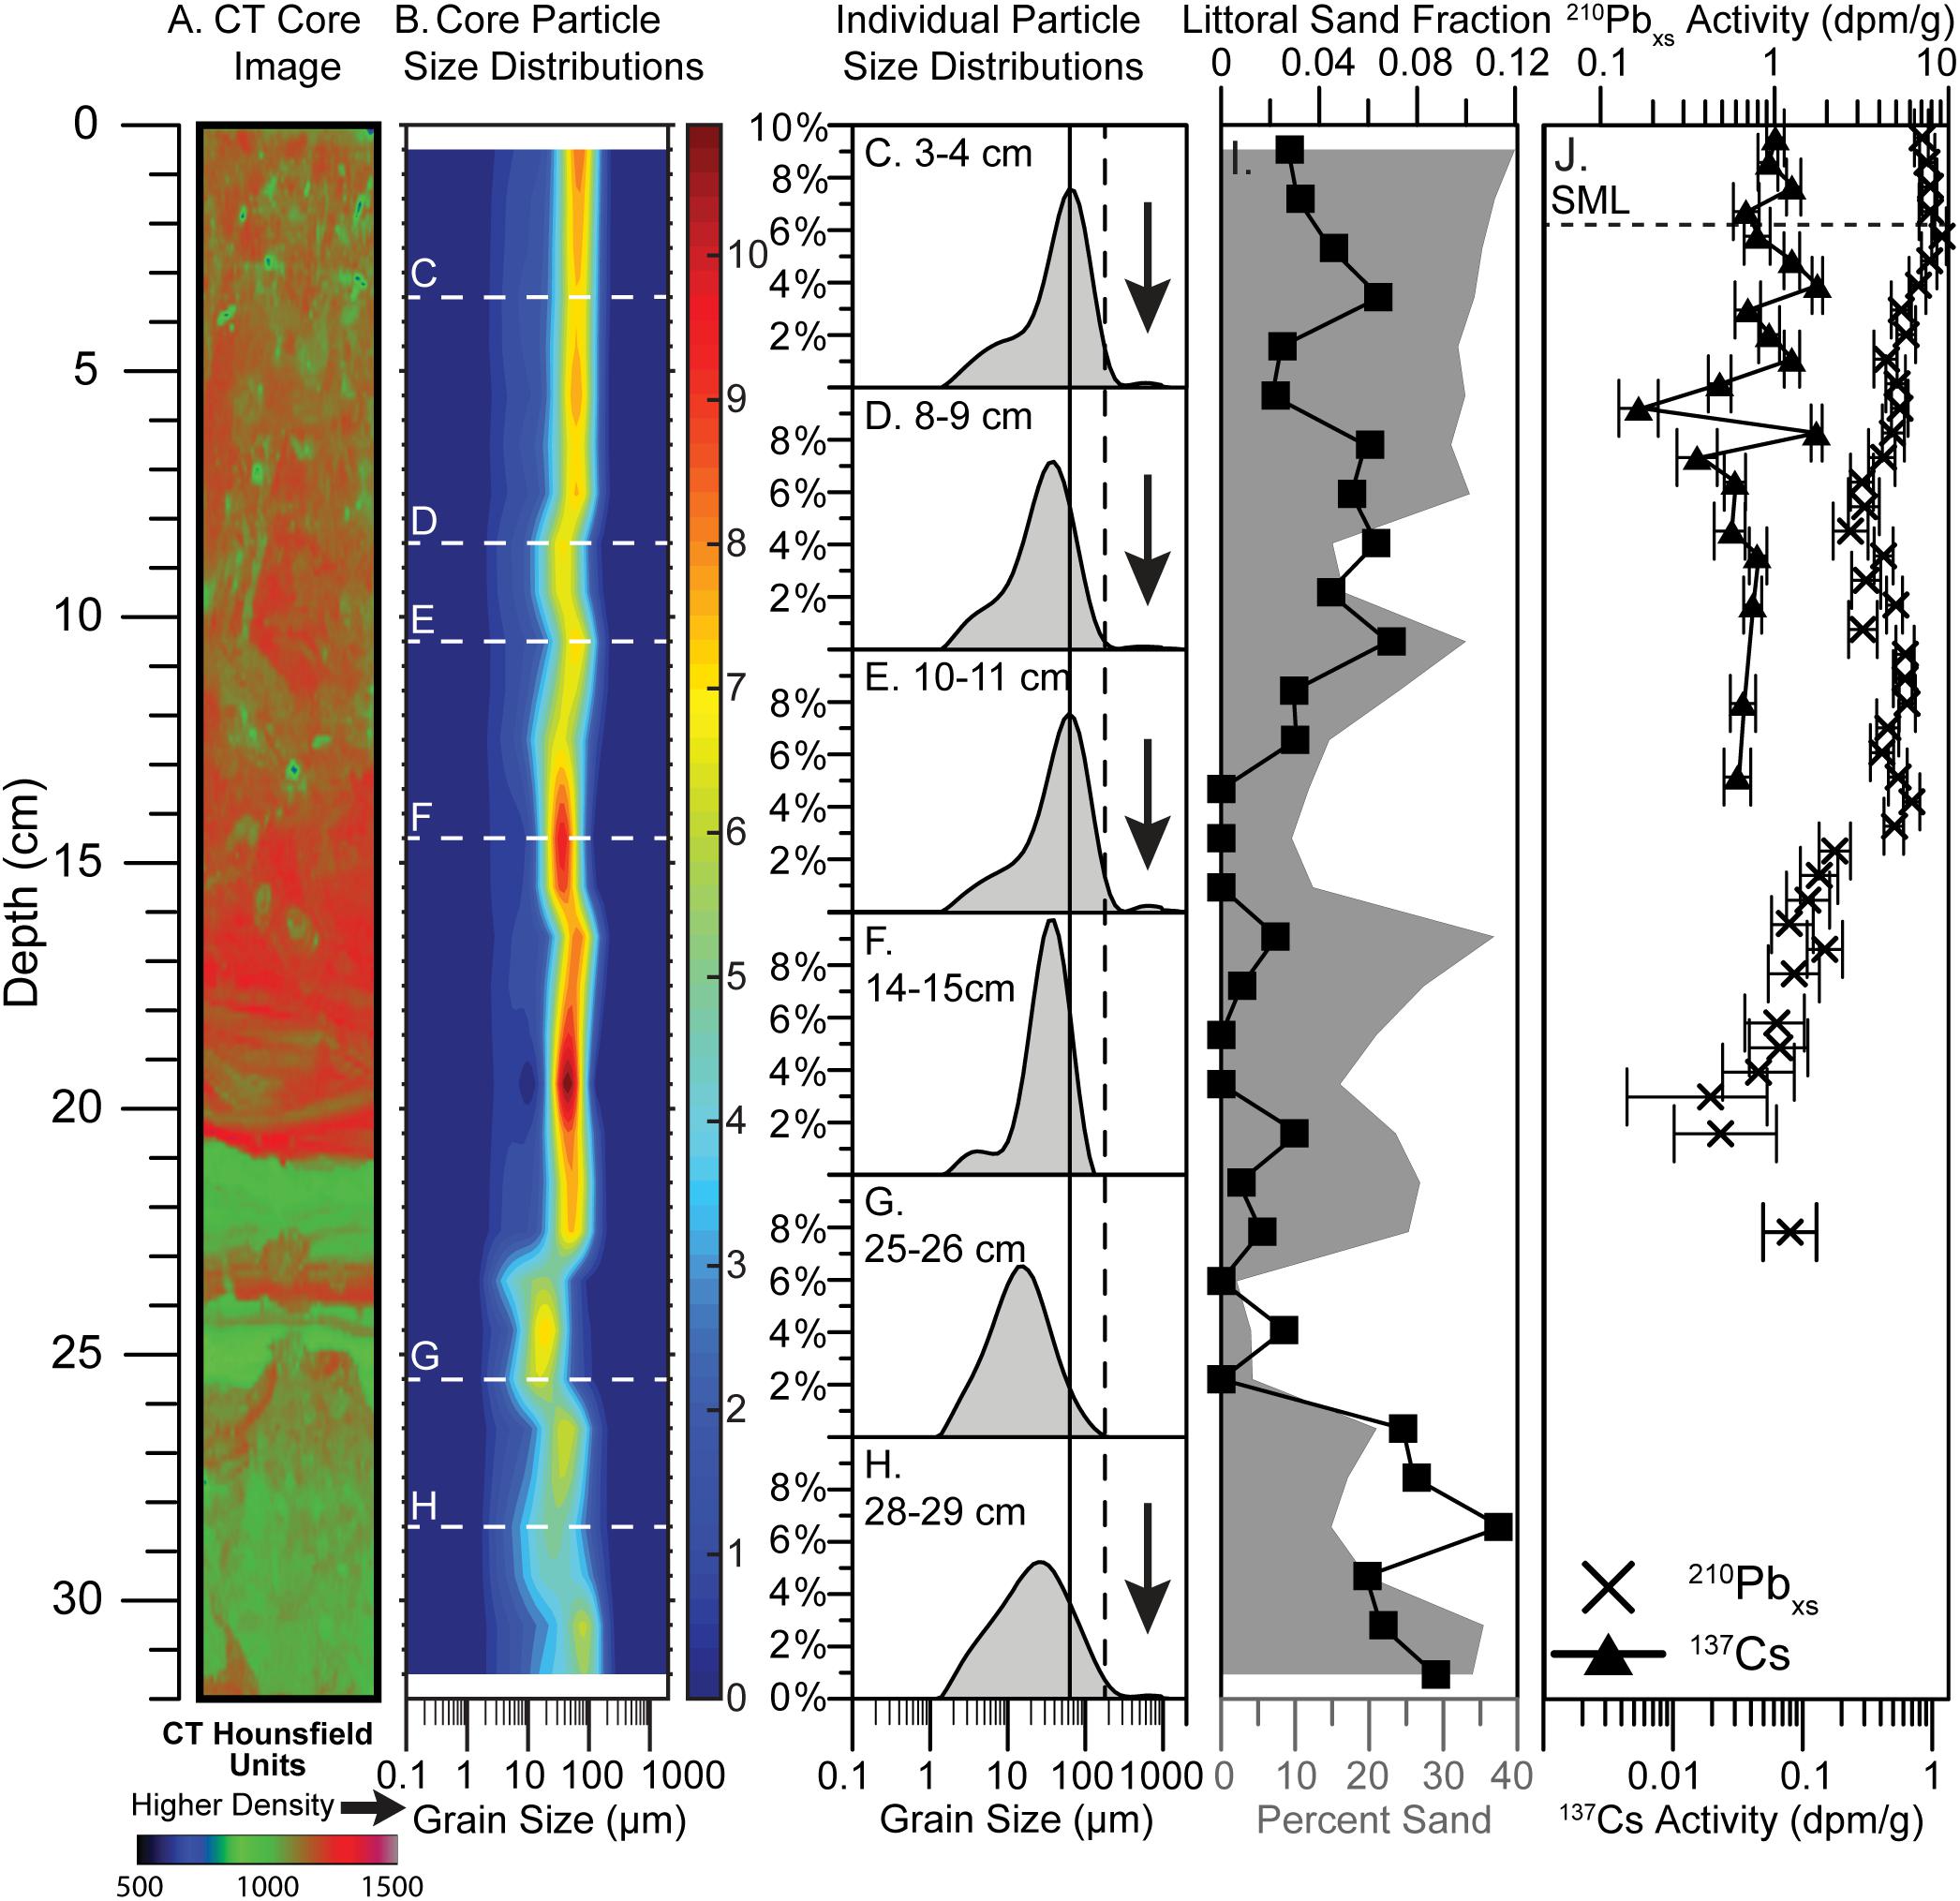
Figure 5. Results from PS1410-11MC (see Figure 1 for location). (A) CT image of the core where cooler colors (blues and greens) are relatively lower density deposits, and warmer colors (reds) are higher density. (B) Down core total grain size distribution for all samples. In this plot the y-axis is depth down the core, x-axis is particle size, and the colors represent the volume present of the sample that fall within those size classifications, where warmer colors are higher percentages and cooler colors are lower percentages. The warmest color region across any depth horizon represents the mode for the sample. Representative individual sample particle size distributions (PSD) are shown in (C–H), where the depths of these PSD are highlighted in (B) as white dashed lines. The solid black vertical line in (C–H) notes the silt/sand boundary at 63 μm and the dashed black vertical line notes the Monterey Bay littoral cutoff diameter at 180 μm (see text for explanation). Black arrows in the plot point to samples with increases in material coarser than the littoral cutoff diameter. The raw measurement size bins for the instrument were used to create the distributions in (B–H). (I) Down core results from the grain size analysis with total percent sand (gray area) and the littoral sand fraction (black squares – see text for explanation). (J) Down core results for the 210Pbxs (black Xs) and 137Cs (black triangles). The dashed horizontal line is the inferred depth of the Surface Mixed Layer (SML) based on the 210Pbxs results.
This variability in sedimentary fabric corresponds to variability in sediment texture as well. From Figure 5B the base of the core is characterized by a fining upward sequence between 23–32 cm, although in a more stairstep-like fashion, as the dominant size class fine from ∼20–100 to ∼10–60 μm. In this section of the core we do not observe any values >7% (red colors in Figure 5B), suggesting wider distributions of grain sizes. Above this section, from ∼13 to 23 cm, the sediment coarsens, marked by a relatively abrupt shift at ∼22 cm, and there is a tighter distribution generally spanning from ∼30 to 100 μm, with values >9% indicating more prominent peaks in the PSD. Above 13 cm to the top of the core, there is an overall gradual coarsening, although with a slightly finer layer ∼9 cm. The uppermost 4 cm show values >7–8% (orange and red-orange colors) suggesting increases in the mode within the distributions.
Unlike the previously discussed cores, the individual PSD for PS1410-11MC are characterized by a variety of shapes (Figures 5C–H). In the lowermost section that was described as fining upward, the PSD show relatively broad distributions with modes clearly finer than the silt/sand boundary (Figures 5G,H). For these two representative PSD the modes fall between ∼10 and 30 μm. The overlying section is illustrated by the sample from 14 to 15 cm (Figure 5F) that shows a shift in mode to the right, closer to but still finer than the silt/sand boundary. This distribution has a high, narrow peak with a small secondary broad peak within the clay to fine silt portion. For the samples above 14 cm (Figures 5C–E) the PSD show the coarsening upward sequence as the modes shift to the silt/sand boundary, although the relatively finer layer at 9 cm is shown in Figure 5D with the mode shifted back slightly to the left. As with the other cores, the coarse tail is present in Figures 5C,E,H, where for these uppermost samples this very coarse sub-population (>300 μm) appears detached from the larger distributions.
The total sand content also fluctuates throughout the core (Figure 5I). From the base of the core up to ∼23 cm, total sand content decreases from ∼35 to ∼5%. There is a sandier section above this from ∼15 to 23 cm where the total sand is between ∼20 and 40%. This sandier section is overlain by a gradual coarsening upward sequence from ∼15 and 40% total sand, with the finer layer at ∼9 cm being comprised of ∼20% sand.
The 210Pbxs profile (Figure 5J) consists of sections with uniform activity, and steady-state accumulation similar to PS1410-04MC. The SML extends to a depth 2 cm, below which activities decrease with depth down to ∼9 cm. Similar to PS1410-04MC, between 9 and 14 cm the activity is uniform to slightly increasing with depth. Below 14 cm activities again approximate steady-state accumulation, and no 210Pbxs was detected below 23 cm.
The 137Cs results are also similar to PS1410-04MC, with no distinct peak, maximum activity (0.13 ± 0.01 dpm/g) was at a depth of 3.5 cm with similar activity (0.13 ± 0.01 dpm/g) at a depth of 6.5 cm. Maximum penetration was to a depth of 15 cm, which places the 1954 CE time horizon at a depth of 13 cm after adjusting for the SML.
SR1707-02MC
The results for SR1707-02MC are shown in Figure 6. This core was retrieved from southern Monterey Bay, ∼10 km west-southwest of the Salinas River mouth. The core is 15 cm long, well-mixed, homogeneously low-density with a few smaller distinct mottles dispersed throughout (Figure 6A). The grain size results from this core (Figure 6B) show a gradual coarsening upward trend, with grain sizes concentrated between ∼10 and 70 μm at the base of the core and ∼20–200 μm at the top. Unlike most of the other cores discussed above, the highest values for a size class (i.e., darkest red colors) were observed at the base of the core (∼13–15 cm) rather than near the top.
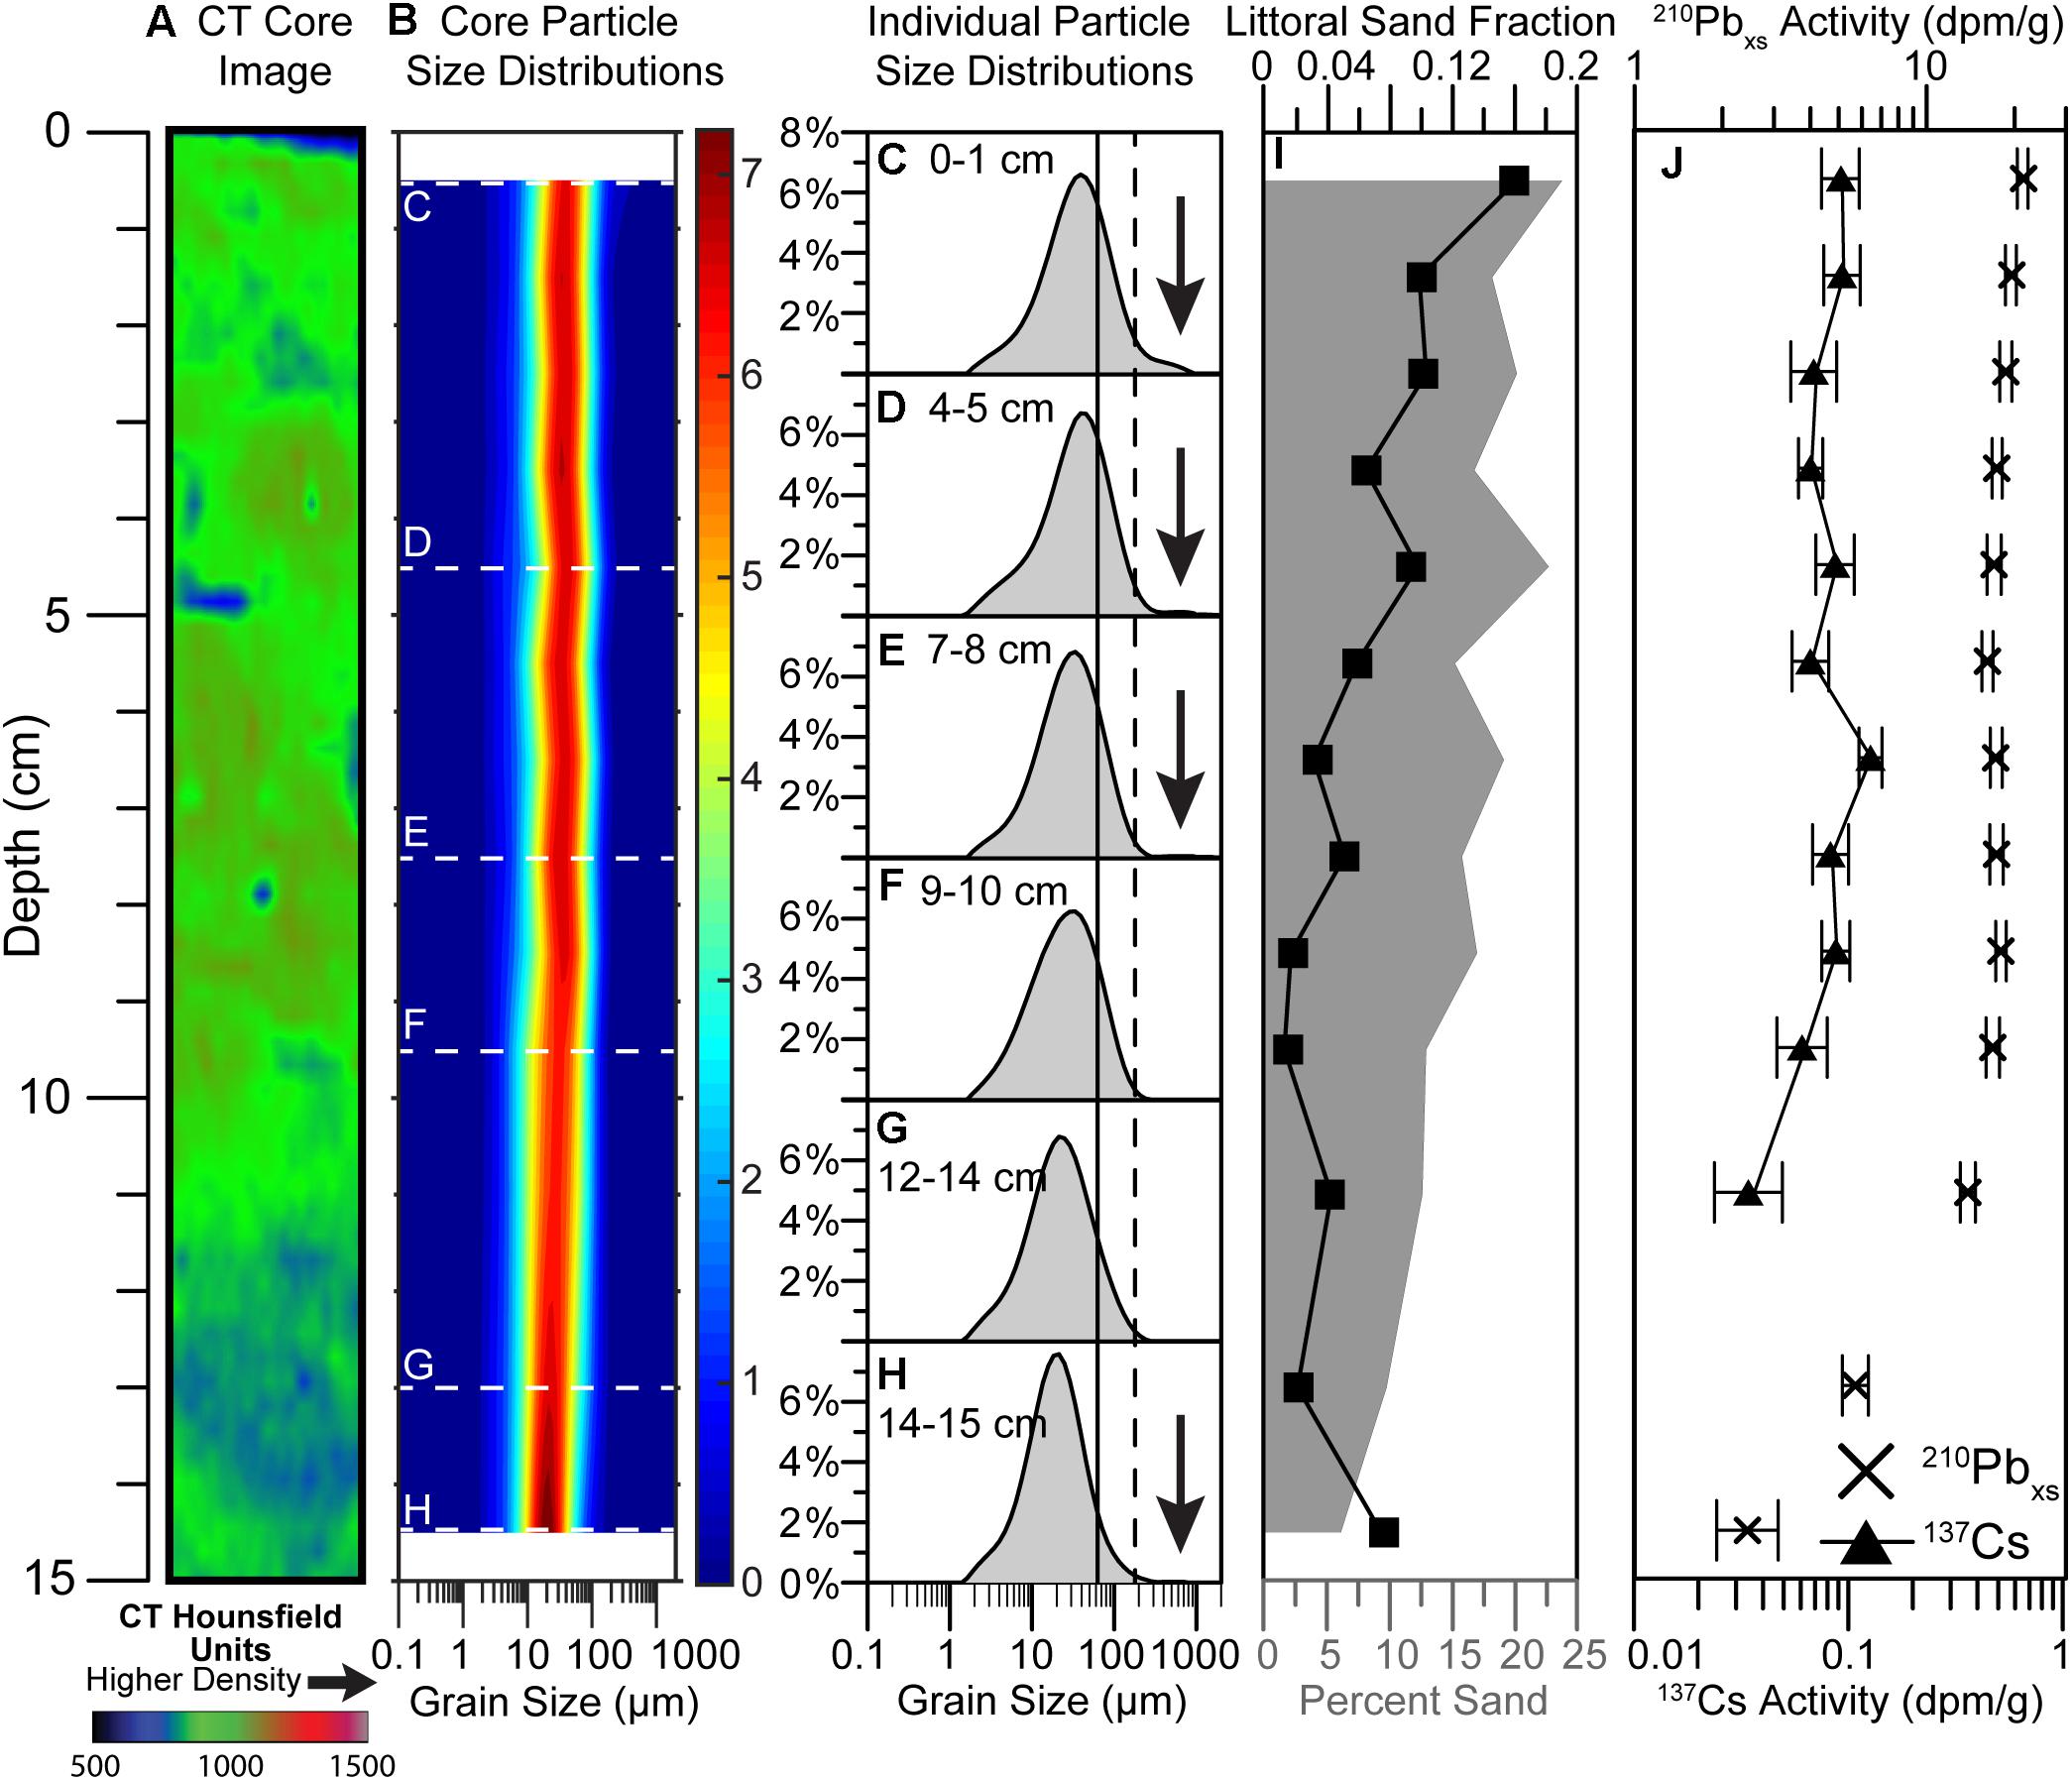
Figure 6. Results from SR1707-02MC (see Figure 1 for location). (A) CT image of the core where cooler colors (blues and greens) are relatively lower density deposits, and warmer colors (reds) are higher density. (B) Down core total grain size distribution for all samples. In this plot the y-axis is depth down the core, x-axis is particle size, and the colors represent the volume present of the sample that fall within those size classifications, where warmer colors are higher percentages and cooler colors are lower percentages. The warmest color region across any depth horizon represents the mode for the sample. Representative individual sample particle size distributions (PSD) are shown in (C–H), where the depths of these PSD are highlighted in (B) as white dashed lines. The solid black vertical line in (C–H) notes the silt/sand boundary at 63 μm and the dashed black vertical line notes the Monterey Bay littoral cutoff diameter at 180 μm (see text for explanation). Black arrows in the plot point to samples with increases in material coarser than the littoral cutoff diameter. The raw measurement size bins for the instrument were used to create the distributions in (B–H). (I) Down core results from the grain size analysis with total percent sand (gray area) and the littoral sand fraction (black squares – see text for explanation). (J) Down core results for the 210Pbxs (black Xs) and 137Cs (black triangles). No Surface Mixed Layer was observed within this core, and 210Pbxs was detected at the base.
From the representative PSD in Figures 6C–H these highest values at the base of the core correspond to a high, narrow peak in the sample at 14–15 cm (Figure 6H). In the individual PSD we also see the gradual coarsening upward through the core, as each sample distribution has a relatively comparable shape, but the curve is gradually shifted to the right moving up the core. For example, at the base (Figure 6H, 14–15 cm) the mode is ∼20 μm, but closer to ∼40–50 μm at the surface (Figure 6C, 0–1 cm). Unique to this core, is that all of the samples have a mode that is clearly finer than the silt/sand boundary. Even though this core overall is generally finer than the other cores, there are still sample PSD that contain the very coarse tail (noted by the black arrows in Figures 6C,E,H). The very coarse sub-populations were observed in the samples in the upper portion of the core (e.g., 0–1 cm, 4–5 cm, and 7–8 cm), and at the base of the core (14–15 cm).
The total sand content also gradually increases up core (Figure 6I). At the base, the total sand content is ∼5%, while at the surface the total sand content is just below 25%. Below ∼9 cm in the core the sand increases from ∼5 to 12%, while above 9 cm the sand generally fluctuates (with a net increasing trend) between ∼17 and 25%.
From the 210Pbxs profile (Figure 6J), the upper 6 cm exhibits steady-state accumulation with a relatively steep slope. This core did not exhibit a SML based on the 210Pbxs profile, and this was confirmed through measuring excess 234Th (Alexander and Venherm, 2003) as it was only detected at the surface. Note, excess 234Th was not measured on any of the other cores due to instrument availability. From 6 to 9 cm activities are uniform to slightly increasing with depth, while below 9 cm activities decrease with depth, but with a much lower slope as compared to the upper section. Excess 210Pb was detected at the base of this core.
For the 137Cs there is no clearly distinct peak in activity. The maximum activity (0.12 ± 0.02 dpm/g) was detected at 7 cm, but comparable activities (0.09 ± 0.02 dpm/g) were detected at the surface and at a depth of 9 cm. Maximum penetration occurred at a depth of 12 cm, with no mixed layer that would place the 1954 CE time horizon at this depth. Although it should be noted that this measurement spanned a 2 cm sample interval from 10 to 12 cm.
PS1410-08GC
The sediment fabric and grain size results for PS1410-08GC are shown in Figure 7. This longer core was from the same location as SR1707-02MC above in southern Monterey Bay. Most of the core has a mottled appearance (Figure 7A), where mottled sections vary from dominantly low-density (∼8–12 cm), to high-density (∼40–50 cm), and moderate-density (0–8 cm, 12–40 cm, and 50–63 cm). From 63 cm down to 75 cm the appearance is less mottled, resembling more irregular layering, although without any distinct horizontal contacts. Below 75 cm the layering becomes more distinct, and appears to dip within the core. It is likely that this apparent dipping may be an artifact of the coring process. Note the CT scan does not extend to the base of the core to avoid imaging the core-catcher.
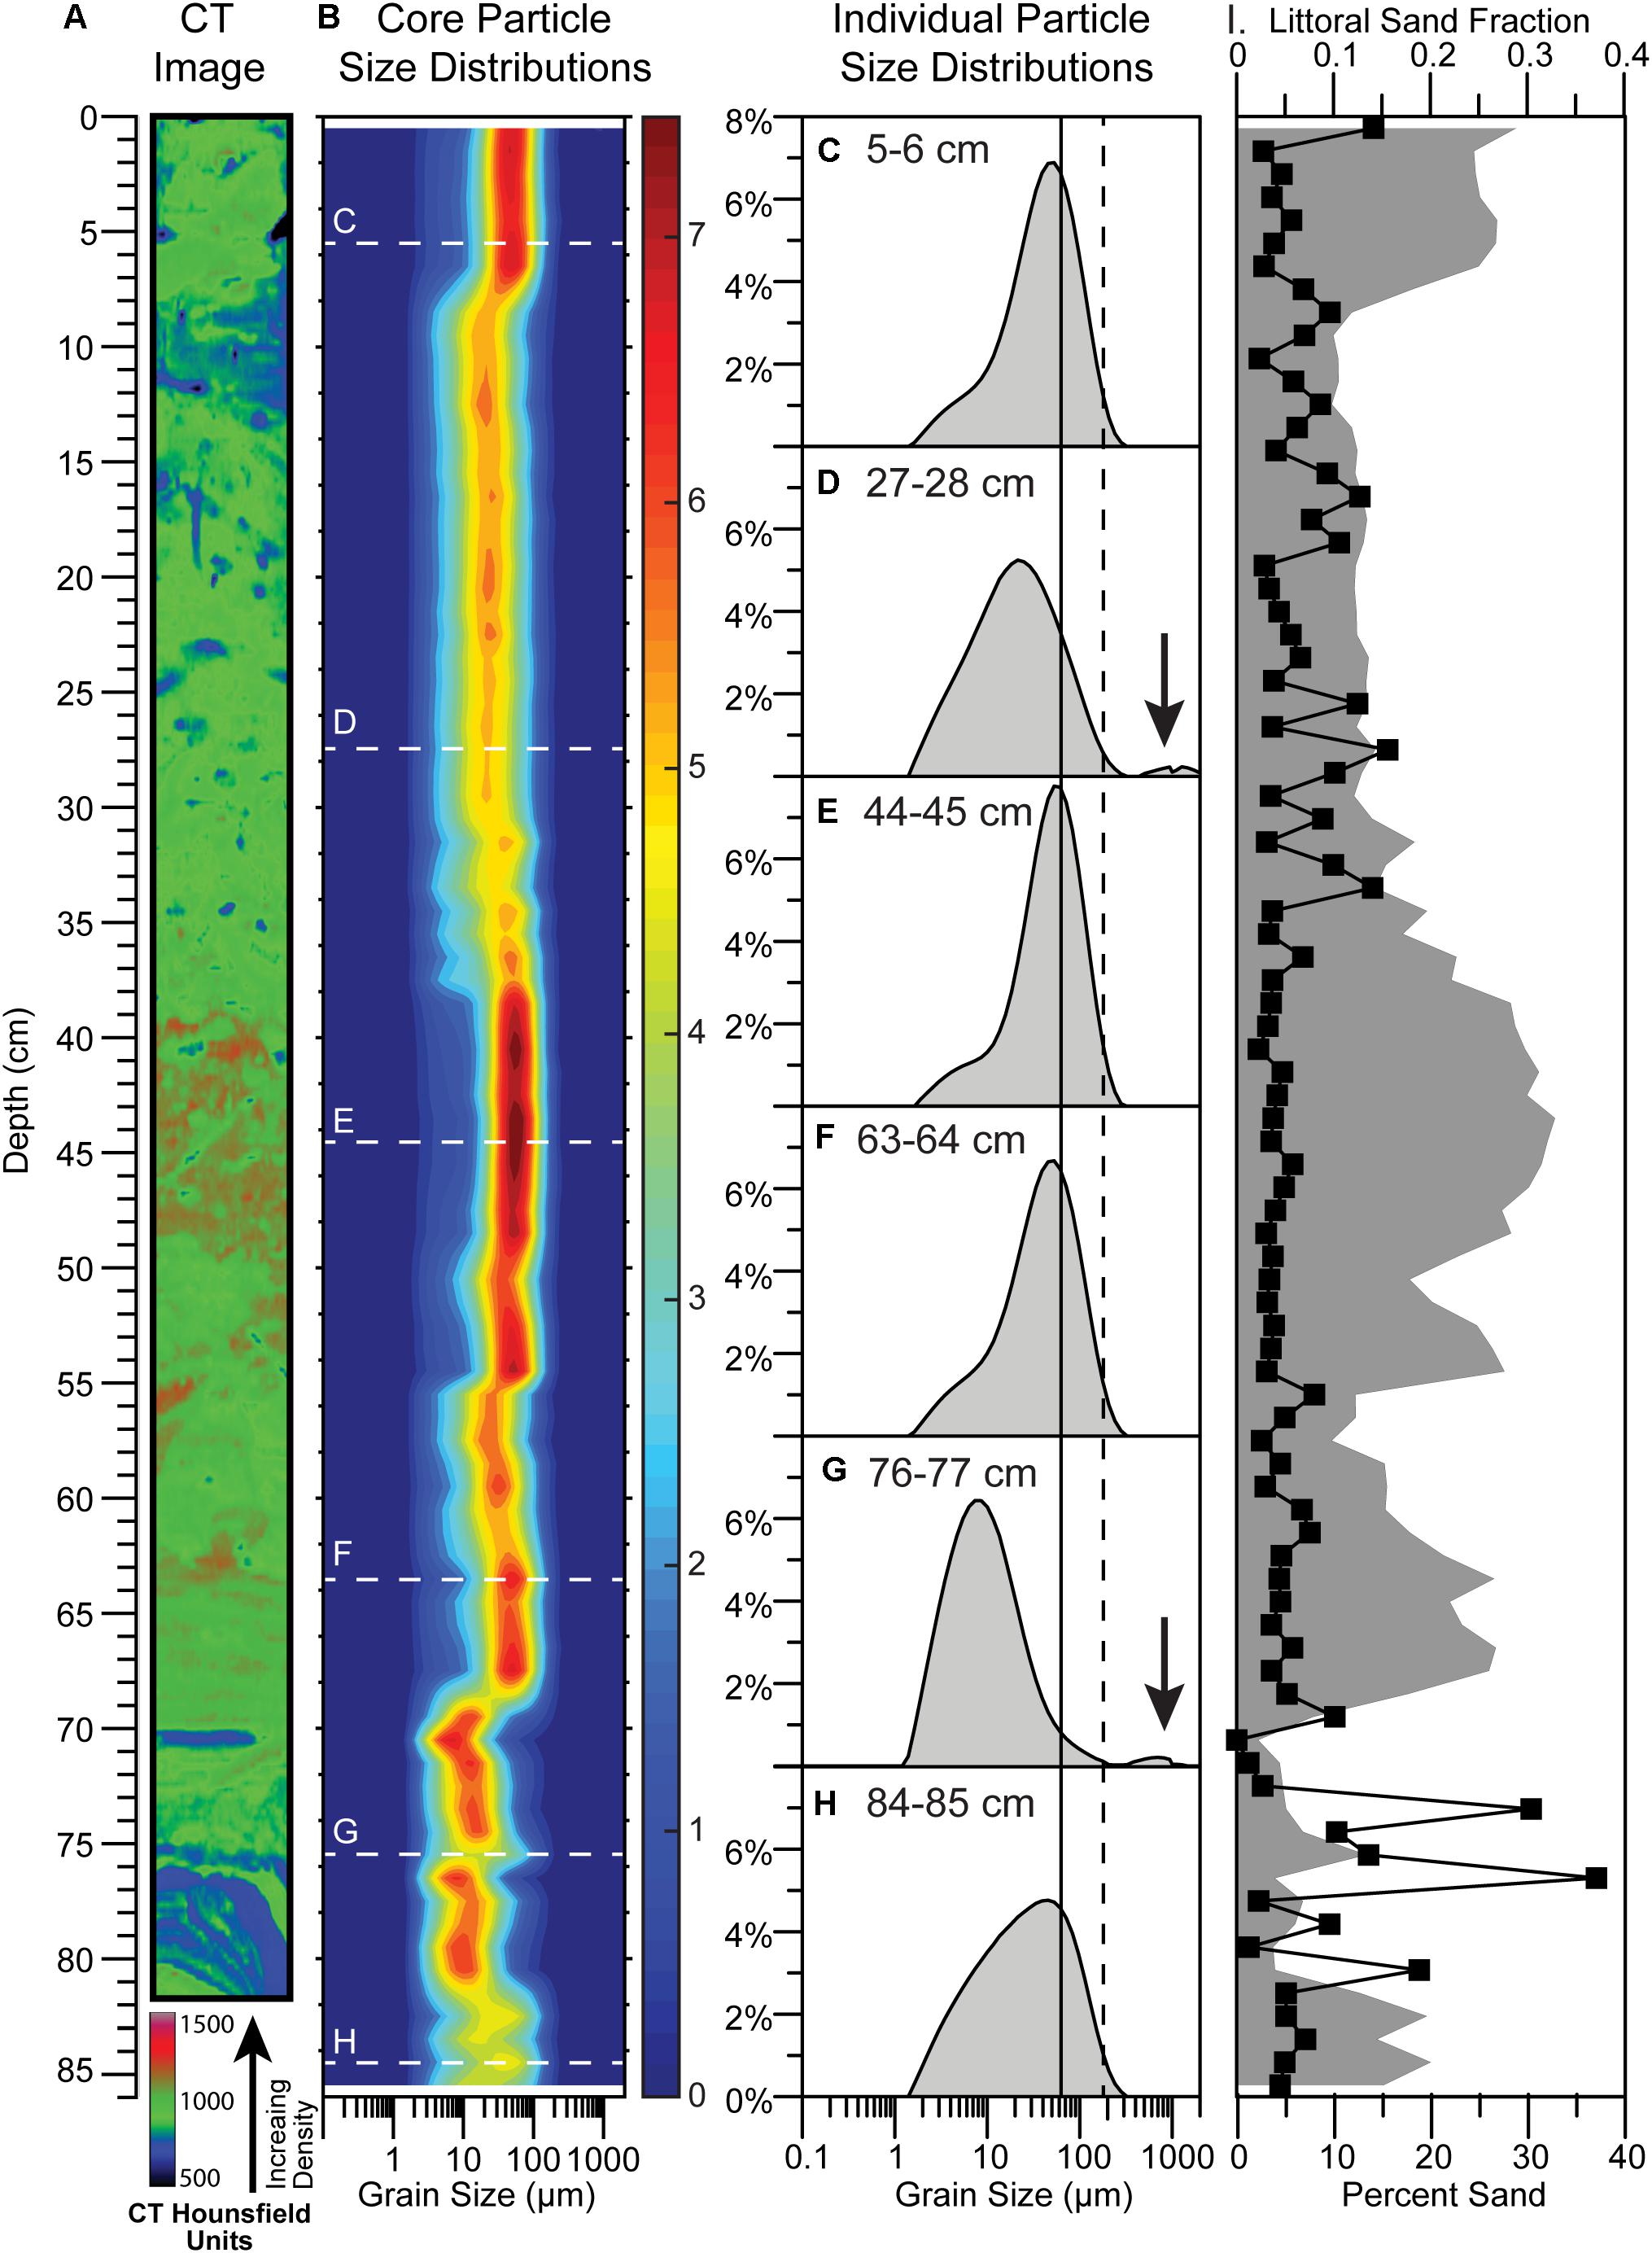
Figure 7. Results from PS1410-08GC (see Figure 1 for location). (A) CT image of the core where cooler colors (blues and greens) are relatively lower density deposits, and warmer colors (reds) are higher density. (B) Down core total grain size distribution for all samples. In this plot the y-axis is depth down the core, x-axis is particle size, and the colors represent the volume present of the sample that fall within those size classifications, where warmer colors are higher percentages and cooler colors are lower percentages. The warmest color region across any depth horizon represents the mode for the sample. Representative individual sample particle size distributions (PSD) are shown in (C–H), where the depths of these PSD are highlighted in (B) as white dashed lines. The solid black vertical line in (C–H) notes the silt/sand boundary at 63 μm and the dashed black vertical line notes the Monterey Bay littoral cutoff diameter at 180 μm (see text for explanation). Black arrows in the plot point to samples with increases in material coarser than the littoral cutoff diameter. The raw measurement size bins for the instrument were used to create the distributions in (B–H). (I) Down core results from the grain size analysis with total percent sand (gray area) and the littoral sand fraction (black squares – see text for explanation). For geochronological results from this core, see Figure 2 or Table 1.
As with the variable sediment fabric, there is variable sediment texture in this core. From Figure 7B we see distinct, often step-wise changes throughout the core, with coarser sections (0–7 cm, 38–55 cm, 63–68 cm, and 82–86 cm) separated by finer sections. At the base from 82–86 cm, the core is relatively coarse, but shows a broad distribution with most of the particles falling between ∼3–100 μm. Overlying this section from ∼68–82 cm the sediment is finer, but with a tighter distribution as most particles range from ∼3–40 μm. The core generally coarsens upward above this within two distinct coarser units, the lowermost from 63–68 cm and 38–55 cm above that. In both of these coarser units, the particles fall between ∼20–200 μm, with a more restricted distribution in the 38–55 cm. In this unit most particles are between ∼40–100 μm and individual size classes are greater than 7% (dark red colors in Figure 7B). Between these two coarser units is a small finer unit (55–63 cm) where the distributions shift back to the left. Above 38 cm is a thick finer unit (∼9–31 cm) characterized by a broader distribution of sizes evident by the wider color swath in Figure 7B, and lack of many depths with values above 6%. At 7 cm there is a shift back to the right indicating a coarser unit, with a narrowing of the distribution as maximum values are between 6 and 7%.
The individual representative PSD in Figures 7C–H show a variety of shapes for the distribution curves. For the lowermost coarse unit the sample at 84–85 cm (Figure 7H), the curve has a relatively broad distribution, but with a mode close to the silt/sand boundary. Contrast that with the overlying finer unit where the PSD from 76 to 77 cm has a narrow peak centered near 10 μm (Figure 7G). Figures 7E,F are PSD from the two coarser units between 38 and 68 cm that have generally similar shapes with a mode near the silt/sand boundary. The sample at 44–45 cm (Figure 7E) has a more prominent peak, with less material in the clay to fine silt portion of the size spectrum compared to the lower sample from 63 to 64 cm (Figure 7F). Figure 7D from 27 to 28 cm within the thick finer unit is characterized by a broad distribution with a mode closer to ∼20 μm, while near the surface of the core at 5–6 cm (Figure 7C) the distribution is more similar to that at 63–64 cm (Figure 7F). As with the other cores, there are discrete samples that also contain the very coarse sub-population (black arrows in Figures 7D,G). In these representative samples the coarse tail again appears somewhat detached from larger distribution curve.
Overall, the sediment texture in this core fluctuates between sandy-mud and mud with relatively high total sand content (∼30%) sections at depths of 0–7 cm, 38–55 cm, and 63–68 cm (Figure 7I). There is a low total sand (<10%) section from 70–81 cm, while for much of the rest of the core the total sand fluctuates around 20%. See Table 1 for the geochronological results for this core.
Discussion
Age Models
We developed age-depth models for all the multicores based off of the 210Pb data (Figure 8) using the Constant Rate of Supply (CRS) model (Appleby and Oldfield, 1978), and starting below the SML. In cores SR1707-02MC and SR1707-07MC 210Pbxs was detected throughout the entire length of the core. To account for an incomplete inventory, the remaining/missing radioisotope inventory was estimated following the methods described by Sanchez-Cabeza and Ruiz-Fernández (2012), where the remaining inventory was estimated from the average mass accumulation rate in the lowermost section of the core.
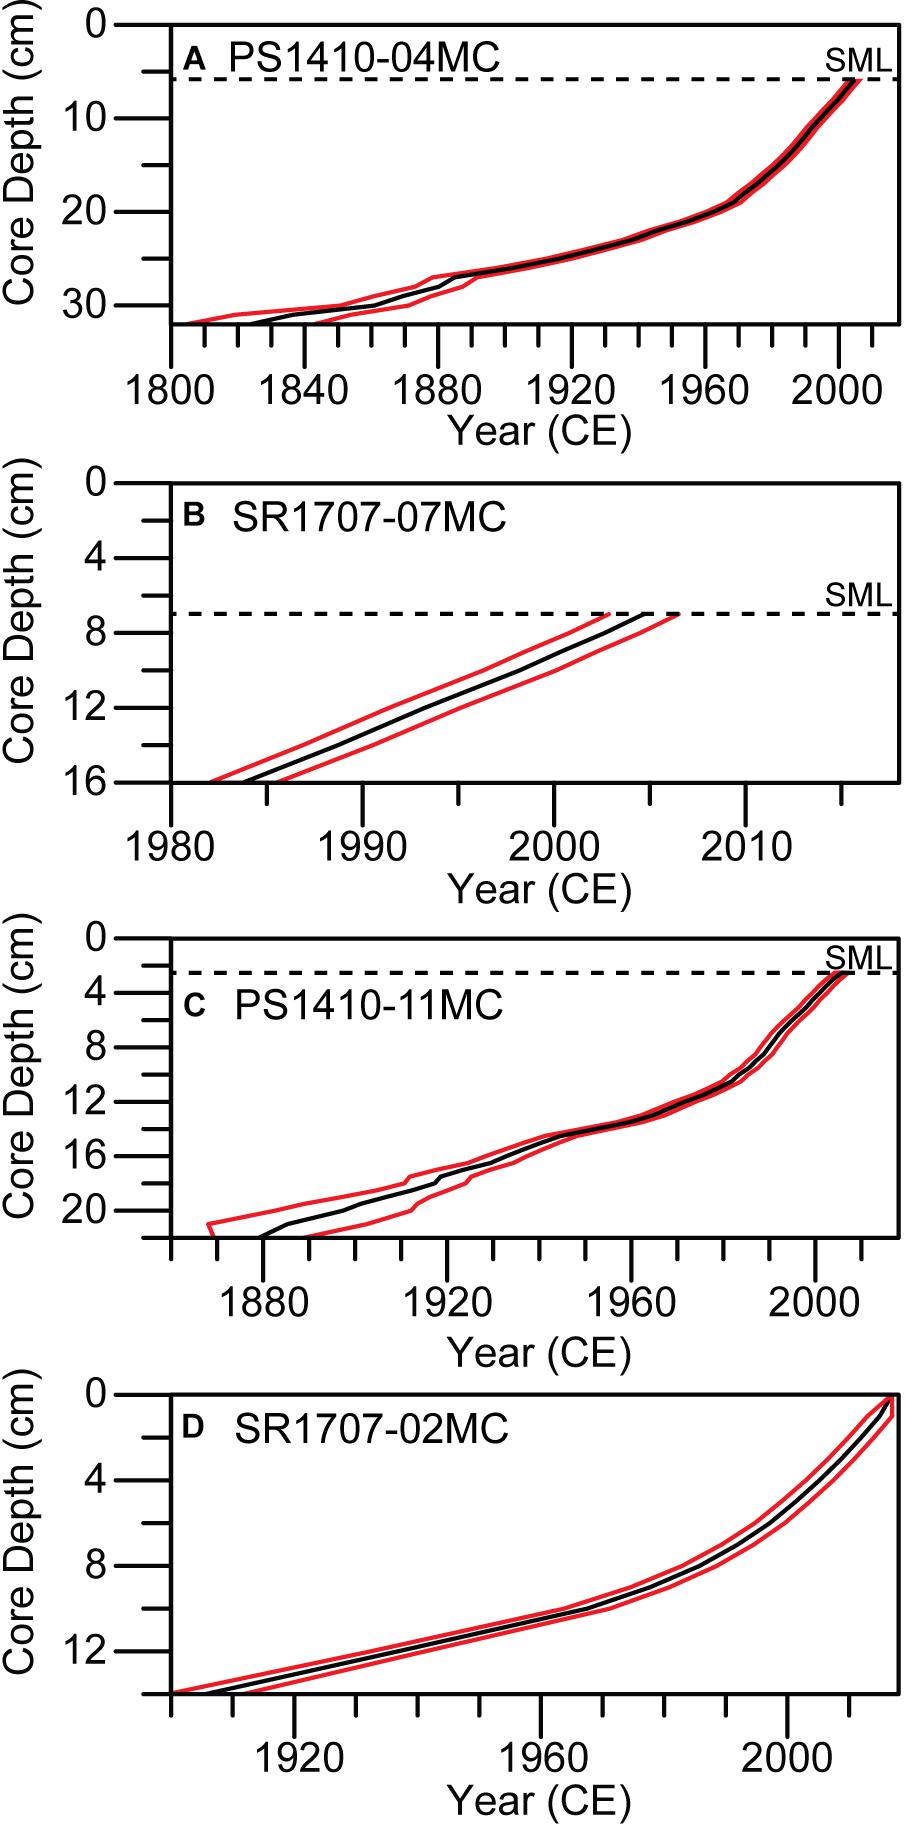
Figure 8. Age-depth models for all the multicores: (A) PS1410-04MC, (B) SR1707-07MC, (C) PS1410-11MC, and (D) SR1707-02MC. The ages were determined from the 210Pbxs data using the Constant Rate of Supply model. The black line represents the modeled age with the red lines constraining the age uncertainty determined by propagating errors from the counting statistics. Ages were plotted below the Surface Mixed Layer (SML – dashed horizontal line) where present.
For core PS1410-04MC the 210Pbxs inventory was complete, and the model extends back to the mid-1800s at a depth of ∼30 cm (Figure 8A). Of all the multicores, this core gave us the longest record. The SML-adjusted 137Cs 1954 CE horizon at a depth of 21 cm agrees reasonably well with the model, where at 21 cm in the core the model gives a date of 1955 ± 2.4 CE. The overall average sedimentation rate for this core based on the age model was 0.17 cm/yr. Interestingly, the age model shows an inflection point in the curve around 1970 where the slope steepens suggesting that sedimentation rates were faster over the past several decades than earlier in the 20th century. Estimating a sedimentation rate over the past several decades gives us a rate of 0.41 cm/yr since the 1970s for this core.
By contrast SR1707-07MC had the weakest age model, and also the encompassed the shortest time span. Both 210Pbxs inventory and 137Cs were detected throughout the core. From the model, ages were only determined from 7 to 16 cm (below the 6 cm SML), spanning the years from 2005 to 1983 CE (Figure 8B). While this model cannot be validated with the 137Cs horizons, calculating a sedimentation rate by plotting the natural log of the 210Pbxs versus core depth (Kolker et al., 2009) gives a rate of 0.44 cm/yr, thus we should expect only ∼3 decades of time within 16 cm of core. Therefore, we feel confident, that at a minimum, this core reflects only the past several decades.
Core PS1410-11MC had the full 210Pbxs inventory and extends back to the late 1800s (Figure 8C). The 137Cs 1954 CE horizon in this core is at a depth of 13 cm after adjusting for the SML. In the model, 13 cm is 1965 ± 2.6 CE. While there is a discrepancy between the model and the 137Cs data, we remain confident in the 210Pb age model as the dates are within a decade, and there is no 1963 peak to compare to. Further, there are generally low overall 137Cs activities (>0.1 dpm/g), so there is a possibility of deeper penetration but these activities are below the instrument detection limit. The overall average sedimentation rate for this core based on the age model was 0.16 cm/yr. Similar to PS1410-04MC, there is a steepening of the slope over the past several decades, where the most recent sedimentation rate was 0.29 cm/yr since the 1970s.
Similarly, for SR1707-02MC the age model (Figure 8D) agrees reasonably well with the 137Cs data. In this core the 1954 CE time horizon is at a depth of 12 cm, which the modeled age for that depth is 1937 ± 4.4 CE. This sample, however, is a 2 cm interval (10–12 cm in the core), and the modeled age of the interval above it at 10 cm is 1968 ± 3.7 CE, thus the actual 1954 CE horizon could be between 10 and 12 cm as modeled and measured. This core also did not capture the full 210Pbxs inventory, and the remaining inventory was estimated. Although the remaining inventory was minimal (estimated at ∼2% of the total) as the core spans >100 years, near the limit of 210Pb chronological capabilities. The overall average sedimentation rate for this core based on the age model was 0.13 cm/yr. This curve also shows a change in sedimentation rate over the past several decades, where the rate has increased to 0.24 cm/yr since the late 1970s.
The geochronology results for the composite SR1707-02MC and PS1410-08GC spliced record are best modeled using a quadratic regression in CLAM (Figure 2B). However, to avoid age reversals, the CLAM model required the exclusion of the AMS 14C date at 26 cm, which has a nearly identical date as that at 46 cm (e.g., 363 ± 99 and 405 ± 100 cal years BP, respectively). Inclusion of the sample at 26 cm would imply a nearly instantaneous deposition of at least 20 cm of sediment, and no such sedimentary unit is observed in the CT scan (Figures 2A, 7A). If this is true, then this suggests that this AMS sample may represent reworked material from a previously lower horizon. This interpretation is supported with the grain size results, which show that those depths likely contain elevated levels of remobilized material (see section “Sedimentation Over the Past 1,000 Years”). The CLAM quadratic regression model yields a 95% confidence range for age uncertainty that spans from 4 years at the beginning of the record (at 2 cm depth, which corresponds to -63 cal years BP [ 2013 CE]), to a maximum of 257 years at the base (at 89 cm depth, which corresponds to 1095 cal years BP). The overall average sedimentation rate for this core based on the age model was 0.08 cm/year.
Collectively we feel confident in all of these age models. For the multicores that span the past several decades to 100+ years, the overall average sedimentation rates ranged from 0.13 to 0.44 cm/year. These rates are comparable to rates similarly determined by 210Pb and 137Cs in Monterey Bay by Lewis et al. (2002) that ranged from 0.15 to 3.9 cm/year. Moreover, these average rates are also in line with 20th century sea level rise for Monterey Bay (0.15 cm/yr) as determined from tide gage records corrected for local uplift (Reynolds and Simms, 2015), whereby sedimentation rates approximate the accommodation space created by local sea level rise. Similarly, our overall average rate for the longer core PS1410-08GC at 0.08 cm/yr is also in line with the late Holocene sea level rise estimate for Monterey Bay of 0.13 cm/yr (Reynolds and Simms, 2015).
From the CT images, however, it is clear that bioturbation is present throughout all of the cores. We recognize that such mixing can have a significant impact on how we utilize our age models to interpret the timing of past events identified within the sediment record. To address this issue in terms of the shorter multicores, we only determined ages for sediment below the SML. The thickness of the SML can be thought of as being fixed through time for a given location, whereby sediment “moves” out of the SML at a rate equal the rate at which sediment is added to the surface (i.e., the sedimentation rate) (Wheatcroft, 1990). Therefore, the ages determined from the CRS model below the SML are valid as changes in isotope activity with depth are still a function of the decay rate (known) and the sedimentation rate (the rate that sediment “moves” out of the SML). The CRS model is also a better suited model to use in the presence of mixed sediments, because if the mixing zone spans 10 years of accumulation the maximum age error is still less than 2 years (Appleby, 1998). For the multicores, SML thicknesses ranged from 0 cm in SR1707-02MC (although the sediment does appear mixed) to 6 cm in SR1707-07MC. These SML thicknesses are also comparable to values reported in the region (1–4 cm) by Lewis et al. (2002). Taking the SML thickness per core, and the most recent (post 1970s) sedimentation rates, the mixing zone for PS1410-11MC spans 7 years, while for PS1410-04MC and SR1707-07MC it spans 12 and 13 years, respectively. For SR1707-02MC no SML was detected, but given the mixed appearance in the sediment we can assume mixing might still have occurred. Cores from comparable settings in southern Monterey Bay analyzed by Lewis et al. (2002) had SML thicknesses that ranged from 1 to 3 cm. Using the 3 cm SML thickness for SR1707-02MC the mixed zone would span 12.5 years. Therefore, for all of these cores the maximum age error using the CRS model due to the mixing is still likely only a couple of years as the mixing zones approximate 1 decade of accumulation.
Although the age estimate errors may only be a couple of years, the sedimentary deposits are essentially homogenized over the mixed zone. The sedimentary signal from a specific event will therefore be mixed over a 7–13 year period, where with more time in the mixed zone the likelihood of preserving a distinct sedimentary signal decreases. Recognizing this, we realize that any interpretations of deposits resulting from events (e.g., specific flood or wetter-than-average years) or even inter-annual variations (e.g., ENSO cyclicity) will be difficult to confidently resolve. Multi-decadal processes (e.g., PDO) however, we feel we should be able to confidently resolve given our age determinations even with the presence of sediment mixing.
Similarly, for the longer core PS1410-08GC the mixing will make it unreasonable to resolve event to yearly scales, and arguably even decadal scales further back in the record. Assuming the 3 cm mixing zone (same as was assumed for SR1707-02MC) and conservatively utilizing the overall average sedimentation rate of 0.08 cm/yr, the mixing zone would span 37.5 years. The mixing in this core therefore, could essentially homogenize the sediment over a 1 to 4 decade time period (using the faster recent sedimentation rate estimate from SR1707-02MC above to provide the minimum time boundary) making resolving decadal processes difficult, but multi-decadal to centennial processes reasonable. Ultimately, for either the longer core PS1410-08GC or the short multi cores we will look to focus only on time periods that exceed these depth/time scales of bioturbation in making interpretations of the sediment record.
Modern Sedimentation
With these age models, we can now look at changes in sedimentation over the past several decades, in particular, changes in sediment delivery to Monterey Bay. Sediment delivery to the bay is overwhelmingly by the three largest rivers (Salinas, Pajaro, and San Lorenzo = 97% of sediment), with the Salinas accounting for 77% of the total supply (Eittreim et al., 2002). The Salinas River is one of the largest rivers in California in terms of sediment supply to the ocean, and the sediment loads can be extreme and episodic. For example, from ∼1930 to 2000 CE the mean annual sediment load in the Salinas River exceeded the overall mean value during only 18 of the 70 years (Farnsworth and Milliman, 2003). For the San Lorenzo River, 63% of all suspended sediment transport occurred over only 62 total days within the time period from 1936 to 1998 CE, the result of multiple short-lived and infrequent extreme flooding events that occurred once every decade or two (Willis and Griggs, 2003). This demonstrates that much of the sediment delivery to Monterey Bay occurs in pulses during extreme events. While short-lived and sporadic, these extreme events are significant. The Salinas, along with other California coastal rivers the Eel and Santa Clara, are the only 3 rivers in the United States (from 1950 to 1990) to have a daily sediment load exceed 5 × 10⁶ t/day (Farnsworth and Milliman, 2003).
Elevated discharges within the Salinas, and other California rivers, can transport increased amounts of sand to the ocean, and these extreme events often occur during positive ENSO and PDO climatic periods (Inman and Jenkins, 1999; Farnsworth and Milliman, 2003; Gray et al., 2015a,b). Therefore, variability in the total sand content within shelf sediment should reflect these forcings, and we can look to this sand content as a proxy for climatic variability. Although focusing on the sand fraction alone is admittedly only a fraction of the complete grain size data we presented above, given the relationship outlined above we feel this is the most relevant and concise proxy to assess sedimentation changes driven by climatic variability. As stated above, while we may not be able to distinguish individual events given the amount of sediment mixing we observed within all the cores, we should be able to distinguish the longer-term, multi-decadal cycles (e.g., PDO) within these sediment records.
In Figure 9A we have combined the sand content from the four multicores, and plotted this data versus time from each core’s individual age models. The sand percentages have been standardized after Kirby et al. (2010), and show the data in standard deviations above or below the mean value for each core. In this way, we can present all the cores on the same scale regardless of the absolute sand content in any core. The data are only presented back to the 1870s, so that there are data from at least two cores for every approximate time period. From the plot, we see that prior to the ∼1920s much of the data cluster around the mean (value of 0 on the standardized scale), and generally below the mean (less than average sand in the deposits). From the 1920s through the 1970s the data is substantially below the mean, but after the 1970s sand values are generally above the mean (more sand than average). A five-point running average (black line - all data combined) highlights these overall inter-decadal trends for much of the record.
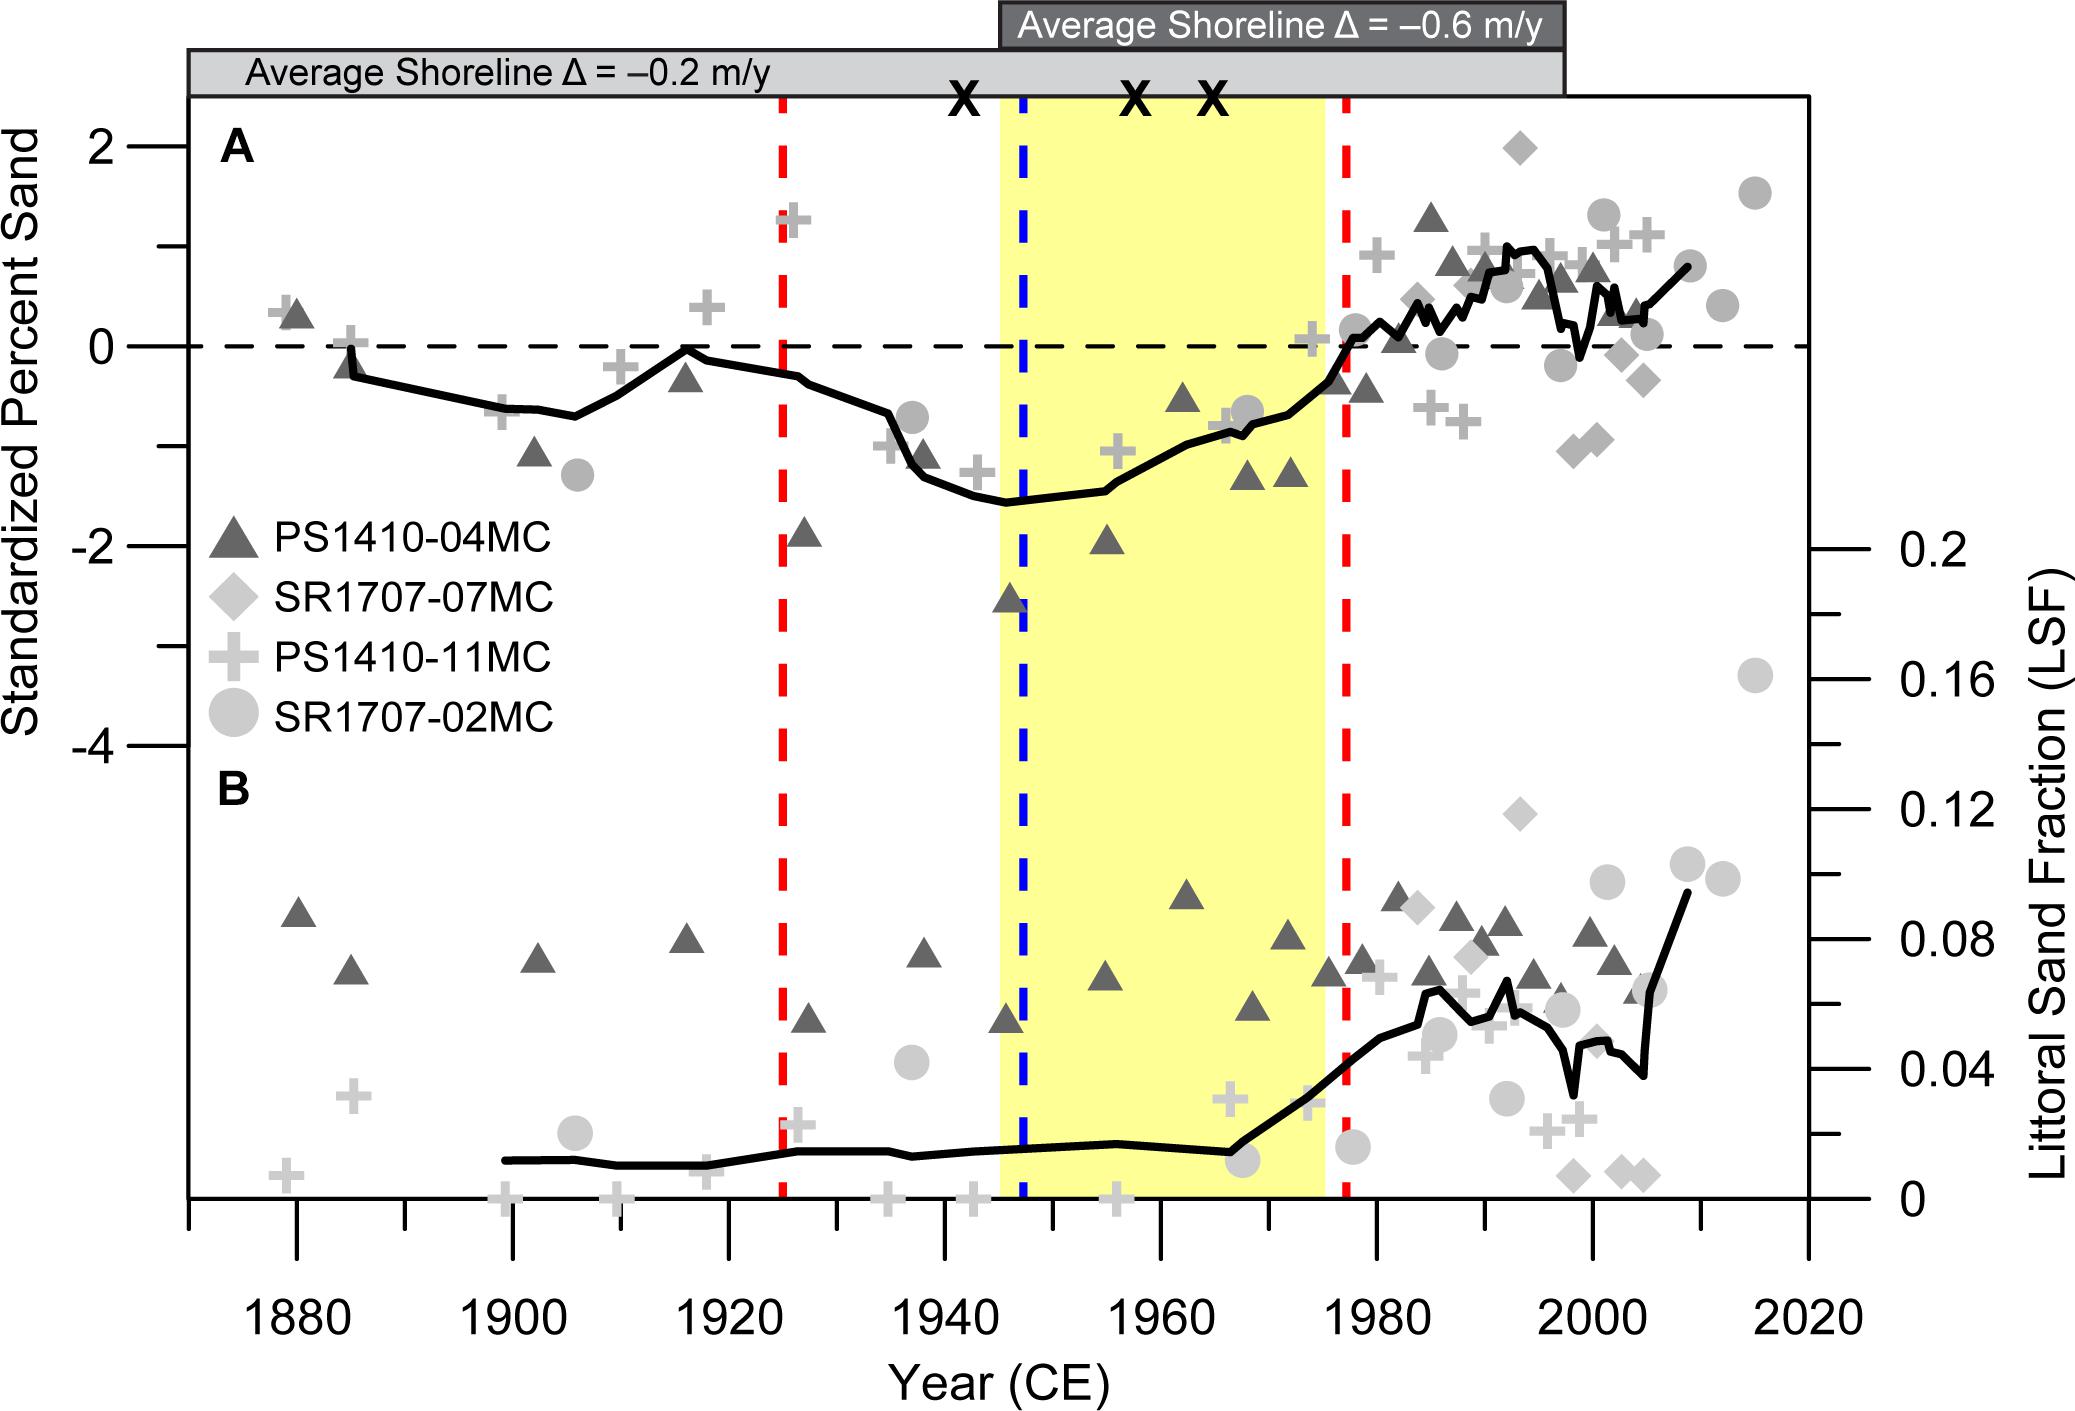
Figure 9. Plot of grain size parameters versus time for the modern time period. (A) The standardized percent sand for all cores (see text for explanation) with a 5-point moving average (black line) computed from all core data combined. (B) The littoral sand fraction for all cores with a 5-point moving average (black line) that excludes PS1410-04MC (dark gray triangles). For both plots the transitions between major PDO shifts (Mantua et al., 1997) are shown by the vertical dashed lines, where a red line indicates a transition into a positive PDO phase, and a blue line is a transition into a negative PDO phase. The yellow vertical bar indicates the period of maximum dam construction in California (Willis and Griggs, 2003), and the black Xs at the top denote the implementation of the 3 largest dams on the Salinas River (Farnsworth and Milliman, 2003). The gray horizontal bars at the top of the plot show shoreline change results where the width of the bar approximates the period with which the data was averaged, and negative values indicate net erosion (Hapke et al., 2006).
The sand trends generally follow the broader climate and runoff trends for the area during this time period. The three major PDO shifts in the 20th century are shown in Figure 9, where red dashed lines indicate a shift to a positive PDO (1925 and 1977 CE), and the blue dashed line is the shift to a negative PDO in 1947 CE (Mantua et al., 1997). Monterey Bay in central California is aligned with southern California where positive PDO periods tend to bring increased precipitation, runoff, and river discharge (Inman and Jenkins, 1999; Farnsworth and Milliman, 2003; Warrick and Farnsworth, 2009). Specifically, fluvial discharge data from the Salinas show the period preceding 1943 CE as being wet, followed by a low-runoff dry period on the Salinas River from 1944 to 1977 CE (Inman and Jenkins, 1999). After the shift back to a positive PDO in 1977 there was a return to a wet climate with elevated-discharge on the Salinas River (Inman and Jenkins, 1999). The shelf sand data agrees reasonably well with these shifts, where relatively more sand was deposited on the shelf during the wet/high-discharge periods (1920s–1940s and post-1970s), with lower sand during the dry/low-runoff period (1940s–1970s) (Figure 9).
We recognize that there are some discrepancies within these general trends (sand is decreasing following shift to a positive PDO in 1925 CE and increasing following a shift to a negative PDO in 1947 CE), but such discrepancies might be the result of limited samples during these times coupled with age uncertainties due to sediment mixing. For example, for all cores collectively there are only 2 samples in each of the following decades: 1920s, 1940s, and 1950s. There are 3 samples for the 1930s, 4 in the 1960s, and finally 5 in the 1970s. Given this limited temporal coverage decade to decade throughout this period and slower sedimentation rates that increase the inherent age uncertainty from mixing, it is not unreasonable that the variability in the data do not precisely correspond with the exact year for the PDO shift. As mentioned above, we recognize our data limitations in being able to resolve annual and inter-annual events. Such a limitation may be demonstrated by the data not corresponding exactly the specific year that marks the shift in PDO. Yet, at decadal scales the data do reasonably well. From the 1920 CE to 1940 CE the data show higher sand content than from 1940 CE to 1970 CE, periods that approximate the changes in the PDO. Where we do have more data and higher sedimentation rates post-1970 that would reduce age uncertainty due to mixing, the trends are much more consistent following the positive PDO shift in 1977 CE.
Taken overall therefore, the shelf sand data does appear to correspond to climate fluctuations, and this is most apparent when comparing the most recent prolonged dry period (negative PDO, 1940s–1970s) to the recent wet period (positive PDO, 1970s–2000s). This difference in sand between these two most recent climate periods is significant (p = 0.008). As shown in Table 2, based on all cores, the average sand content during the last positive PDO period (wet climate) was 29.67 ± 7.34 % as compared to 22.41 ± 7.03% during the preceding cool phase. Therefore, the total sand content in shelf deposits may be a good climate indicator.
Table 2. Comparison of sediment characteristics between different time periods.
Interestingly, the standardized sand values were consistently the highest after the 1970s. This is the only section of the plot where the 5-point moving average is positive, and positive throughout. Given that there were other positive PDO periods throughout the record where the sand was not as high, this might point to a larger environmental shift in later-half of the twentieth century resulting from anthropogenic influences that are seen across a variety of social and environmental metrics (see Steffen et al., 2011 and references therein). For example, anthropogenic modification to sediment dispersal systems, which have been shown to have had a significant impact on sediment delivery to the coast (Syvitski et al., 2005).
Dams on coastal rivers for example, can reduce the sediment flux to the ocean. Particularly the coarse sediment (sand and gravel) flux. Dams along coastal rivers in California have reduced sand and gravel discharges to the ocean on average by 25% (Willis and Griggs, 2003). For the Salinas River specifically, the reduction was 33%, and for the Pajaro and San Lorenzo Rivers the reductions were 6% and 2%, respectively (Willis and Griggs, 2003). The majority of dams/dam storage capacity was built between 1945 and 1977 CE (Willis and Griggs, 2003) with major dams on the Salinas constructed in 1941, 1956, and 1965 CE (Farnsworth and Milliman, 2003). These time periods are shown on Figure 9 (maximum dam construction = yellow vertical bar, Salinas River dams = black Xs). From this figure we see that following the dam construction the sand content on the shelf increases. In other words, dams are built, the fluvial sand and gravel supply to the ocean is reduced, yet sand increases in deposits along the shelf. The implication of this scenario is that the additional sand supplied to the shelf must be coming from a non-fluvial source.
A possible non-fluvial source for the excess sand is supply from coastal erosion and remobilization of littoral zone sediment. Sea level rise can drive coastal erosion, and according to the Bruun rule (Bruun, 1962) as the shoreline migrates landward the eroded material is transported and deposited offshore. While sea level rise has accelerated over the 20th century (Kemp et al., 2011), it is not clear that sea level rise alone could explain the observed increase in sand deposited on the shelf. First, there is some debate as to the validity of the Bruun rule in natural settings (e.g., Cooper and Pilkey, 2004). It has also been noted that this model neglects landward transport of material with shoreline retreat (Rosati et al., 2013) In some cases landward transport has been shown to actually dominate lower in the shoreface profile at the boundary between the upper and lower shoreface, and that offshore transport only dominates higher up in the surf zone (Aagaard and Sørensen, 2012). Further, with sea level rise accelerating throughout the century, we would expect the increase in sand to be persistent throughout the century and not just over the past several decades as observed. While global sea level rise has accelerated since the 1990s, this acceleration is actually lower along the Pacific coast of North America due to atmospheric wind patterns (Bromirski et al., 2011).
While sea level rise is likely contributing to coastal erosion, we feel other processes have a greater impact and over the shorter time periods consistent with the observed changes in sedimentation. Both the climatic shifts and dam construction mentioned above can have a dramatic impact on shorelines, particularly in California. California’s coastal rivers are dominantly small mountainous rivers which can experience coherence between river floods and energetic ocean conditions (Wheatcroft et al., 1997; Kniskern et al., 2011; Odigie and Warrick, 2017). In this case, the same storms that bring excess precipitation also bring elevated wave heights and strong currents to the coastal ocean. For example, the atmospheric river storms responsible for the historic flooding in the 1861–1862 winter also breached the sandy barrier fronting Carpinteria marsh leaving behind overwash deposits comparable to deposits resulting from hurricanes and tsunamis (Reynolds et al., 2018). Additionally, strong El Niño winters that often drive the extreme fluvial discharges can also result in extreme beach and coastal erosion, such as the 1982–1983, 1997–1998, and 2009–2010 El Niño winters (Storlazzi and Griggs, 2000; Sallenger et al., 2002; Allan and Komar, 2006; Barnard et al., 2011; Barnard et al., 2015).
More recently, the 2015–2016 El Niño winter resulted in unprecedented levels of shoreline retreat due in part to a multi-year drought that preceded this winter that reduced sediment supply to the coast, and the corresponding low precipitation during the event (Barnard et al., 2017). In this case, the sediment supply to the coast had been previously suppressed, and this El Niño did not bring increased precipitation but rather energetic ocean conditions that resulted in extreme coastal erosion. As dams on coastal rivers also suppresses sediment supply to the coast, a similar set-up may have occurred following the dam construction period from the 1940s–1970s and subsequent climate shift to the positive PDO. The more frequent and intense storms during the positive PDO may have overwhelmed a coastal system that had a sand deficit due dam construction, resulting in accelerated coastal erosion.
This combined dams-climate effect is consistent with our shelf sand observations (Figure 9A). Sand increases steadily from the 1940s through much of the 1970s as dams are being constructed, but in the late 1970s the sand increases rapidly following the shift to the positive PDO. Not only is the positive PDO period in the 1980s and 1990s the only time in the record that sand content is consistently greater than the mean, but at times it is 1 standard deviation or more. With dams preventing sediment from reaching the coast during this time, we feel the increased influx of sand must be coming from coastal erosion and littoral sources. Dams prevented sediment from reaching the coast, and when the climate changed to one where storms were more intense and frequent, the result was increased coastal erosion similar to what was observed in a smaller scale during the 2015–2106 El Niño. As the coast eroded, a new supply of sand was transported seaward and deposited along the mid-shelf.
Increased erosion during this period has been documented for Monterey Bay. After the mid 1940s, shorelines throughout the bay eroded at an average rate of -0.6 m/year, 3-times the long-term average shoreline change rate of -0.2 m/year from the mid 1850s to late 1990s (Hapke et al., 2006). Clearly coastal erosion increased in Monterey Bay in the latter half of the 20th century, although from the shoreline data we cannot specifically discern the effect of combined dams and climate. Yet as coastal erosion is increasing, the mid-shelf deposits are being enriched in sand at the same time. Simultaneously as more sand is being trapped behind dams, it seems likely that the additional shelf sand is coming from coastal sources.
In order to test whether the increase in sand is from coastal erosion, we looked for coastal indicators within the sediment data. We decided to look at the how much littoral-sized sand was within the shelf deposits. With increased coastal erosion, we expect there will be increased littoral sand within the system, and while much of this sand may ultimately end up in the more prominent littoral sinks (e.g., canyons, estuaries, etc.), offshore transport in also a sink for littoral sand (Komar, 1996). Therefore, we should also see relative increases in the amount of littoral sand escaping the littoral system and being transported across the shelf.
For many locations along the California coast, including Monterey Bay, there is a well-established littoral cutoff diameter. The littoral cutoff diameter is the minimum size threshold for significant quantities of sand to remain within the beach or littoral zone, particles finer than this threshold will be resuspended and transported offshore under relatively normal conditions (Hicks, 1985; Hicks and Inman, 1987; Limber et al., 2008). For Monterey Bay, the littoral cutoff diameter is 180 μm (Best and Griggs, 1991), so material coarser than 180 μm is more likely to be retained within beaches throughout Monterey Bay, primarily moving along the coast within the littoral cell.
Using this local littoral cutoff diameter, we developed the littoral sand fraction (LSF), an index that represents the fraction of the total sand component that is larger than the littoral cutoff diameter. To determine the LSF, we took the percentage of sand greater than 180 μm (local littoral cutoff diameter) and divided that by the total sand percentage for the sample. A LSF value of 1 therefore, would represent a sample that is entirely littoral sand, while a value of 0 would have no littoral sand, and either of these values is independent of the total sand content for a given sample. Increases in the LSF throughout the core therefore, would represent an increased contribution from the littoral zone that is likely created through increased erosion/remobilization.
The LSF results are plotted down core for all the cores in Figures 3–7. For PS1410-04MC (Figure 3I), the LSF is highest at the base, but is generally consistent through the upper ∼25 cm of the core, fluctuating between ∼0.06 and 0.10. For SR1707-07MC (Figure 4I), the LSF low throughout, typically near 0, except for a section between 10 and 15 cm where values are high (∼0.10). For PS1410-11MC there are 3 distinct LSF sections within the core (Figure 5I). A lower section from the base to ∼26 cm where the LSF is high (>0.06), a middle section from ∼12 to 26 cm where the LSF is low (<0.04), and the upper section above 12 cm where the LSF increases and fluctuates between ∼0.02 and ∼0.06. For SR1707-02MC (Figure 6I) the LSF decreases in the lowermost section of the core, but increases from ∼9 cm to the surface. The individual PSD in Figures 3–7 highlight those samples with higher LSF values, where the black arrows denote where the littoral sand section of the distribution is elevated. In many of these representative PSD the littoral sand portion of the plot is often detached from the larger distribution (e.g., Figures 3G, 4G, 5E) suggesting a completely unique population of grains separate from the larger population within the sample.
These LSF data are plotted versus time in Figure 9B. What stands out is that for PS1410-04MC (dark gray triangles) the LSF is steady through time (∼0.08), but for the other cores (light gray symbols) the LSF increases in the latter half of the 20th century. This trend is clearly demonstrated by the 5-point moving average trendline in Figure 9B (this trendline excludes PS1410-04MC) that shows average values of <0.02 from the early 1900s to the late 1960s, followed by an increase to >0.06 through the 1990s. Similar to the total sand data, the inflection point for the LSF occurs near the end of the elevated dam construction period and near the PDO shift in the late 1970s.
From Table 2, we see that for the LSF, the high erosion period (mid 1940s to late 1990s) is statistically different (p = 0.030) than the earlier data, only when PS1410-04MC is excluded. Interestingly the LSF is not significantly different between climate periods, and the total sand content is not significantly different between the high and low erosion periods whether PS1410-04MC is excluded or not. Therefore, total sand may be a good climate indicator, the LSF may be a good coastal erosion indicator, and these two metrics are seemingly independent.
For this data, however, the LSF is only an erosion indicator when PS1410-04MC is excluded, but this discrepancy may be explained by the location of this core. PS1410-04MC was the only core located outside of Monterey Bay proper along the open coast. This stretch of the coast consists mostly of rocky headlands separated by pocket beaches formed from uplifted marine terraces. By contrast, the coastline within Monterey Bay has a much higher percentage of linear beach and dune systems. These rocky coasts, like where PS1410-04MC was located, are more resistant to erosion than the sandy beaches throughout Monterey Bay. The shoreline change study by Hapke et al. (2006) only focused on sandy beach areas, so there is minimal shoreline change data from the open coast section. Where data are available along this section of the coast south of Point Ano Nuevo, the sediment transport vector for PS1410-04MC (Eittreim et al., 2002), the recent shoreline change data show a mix of slightly accreting to slightly eroding beaches (Hapke et al., 2006). Whereas within Monterey Bay most of the areas are experiencing shoreline erosion over this most recent period (Hapke et al., 2006). Additionally, the open coast area proximal to PS1410-04MC is removed from the major rivers in the region. All of these rivers directly empty into Monterey Bay (Figure 1). Rather, this section of the coast is fed by small creeks, and these creeks are undammed. Therefore, we can think of PS1410-04MC as our control site for watershed modification. Where there have been little to no modifications, coastal erosion is minimal, and the LSF stays consistent through time. Within the bay, in the areas fed by modified rivers, we see a significant change in the period following dam construction that corresponds to increased coastal erosion.
Overall, from these data we conclude that sand delivery to the shelf generally follows climatic cycles, where more sand is delivered during wet periods that correspond to a positive PDO. Following dam construction on the Monterey Bay rivers, the shift to the positive PDO resulted in increased coastal erosion, and more sand supplied from littoral sources likely during the large wave events associated with storms. This new littoral source replaced some of the fluvial sand that was being trapped behind dams. For PS1410-04MC which was less impacted with dams, the total sand still responded to the climate shifts, but the lack of a prominent shift the LSF showed that the relative fluvial versus coastal sand supply remained constant.
Sedimentation Over the Past 1,000 Years
From the modern sedimentation within Monterey Bay, the big takeaway is that we can use the combination of total sand and the LSF to investigate variability in fluvial and coastal (erosional) sediment sources. Subsequently, we can apply these metrics to PS1410-08GC, which spans >1,000 years encompassing the climatic variability of the late Holocene including the Medieval Climate Anomaly (MCA) and the Little Ice Age (LIA), to determine if the patterns we observed within the modern record are consistent over a longer time period. For the MCA and LIA we used the age ranges from Masson-Delmotte et al. (2013) of 1050-650 cal years BP and 500–100 cal years BP, respectively.
In Figure 7I the LSF is plotted along with the total sand content for PS1410-08GC. From the plot, there are sections of relatively constant and low LSF (∼0.05) from ∼81–86 cm, ∼37–68 cm, and ∼1–6 cm. There are also sections where the LSF fluctuates and contains relatively high values (∼0.1–0.4), for example ∼70–81 cm, ∼23–35 cm, and ∼7–19 cm. Based on what we observed within the modern record, we interpret these periods of relatively high and fluctuating LSF values to represent periods of increased sediment supply from coastal erosion, while the periods of relatively constant and low LSF values represent periods of high fluvial supply. In discussing the age model above, we decided to exclude our date from 21 to 24 cm because we felt the age was too old, and likely incorporated older reworked material. From the plot in Figure 7I, we see that this section of the core overlaps with an elevated erosion section based on the LSF data. The near-similar age of the sample from 41 to 44 cm was from a section with low LSF, we would interpret as having limited supply of eroded material. These lithologic characteristics are further support for why we excluded the date at 21–24 cm in favor of the date at 41–44 cm.
Interestingly, the highest LSF values (located ∼70–81 cm in the core) coincided with the lowest total sand, while the highest total sand corresponded to relatively low LSF (∼37–47 cm). This trend is generally consistent throughout the core, where higher total sand corresponds to low LSF, and low total sand corresponds to elevated LSF (with the exception of the surface of the core). These observations are also consistent with our interpretations from the modern period. The high sand/low LSF periods suggest high fluvial supply with limited erosion, i.e., excess sand being delivered primarily from a fluvial sources offsetting erosion. This would suggest a wet climate. By contrast low sand/high LSF suggest that the overall sand supply is low, i.e., the rivers are not providing significant quantities of sand, this likely results in beaches being sand-starved and susceptible to erosion. As a result, what sand is being supplied to the shelf is increasingly being sourced from this erosion. These low sand/high LSF periods therefore suggests a relatively dry climate.
In Figure 10 the sand and LSF data for 08GC are plotted versus time with the MCA and LIA climate periods indicated. From this we see that the generally warmer and drier MCA encompasses the period of low sand/high LSF consistent with low runoff and high coastal erosion. Also, the high sand/low LSF peaks fall within the beginning of the cool and wet LIA period suggesting high fluvial runoff during this time.
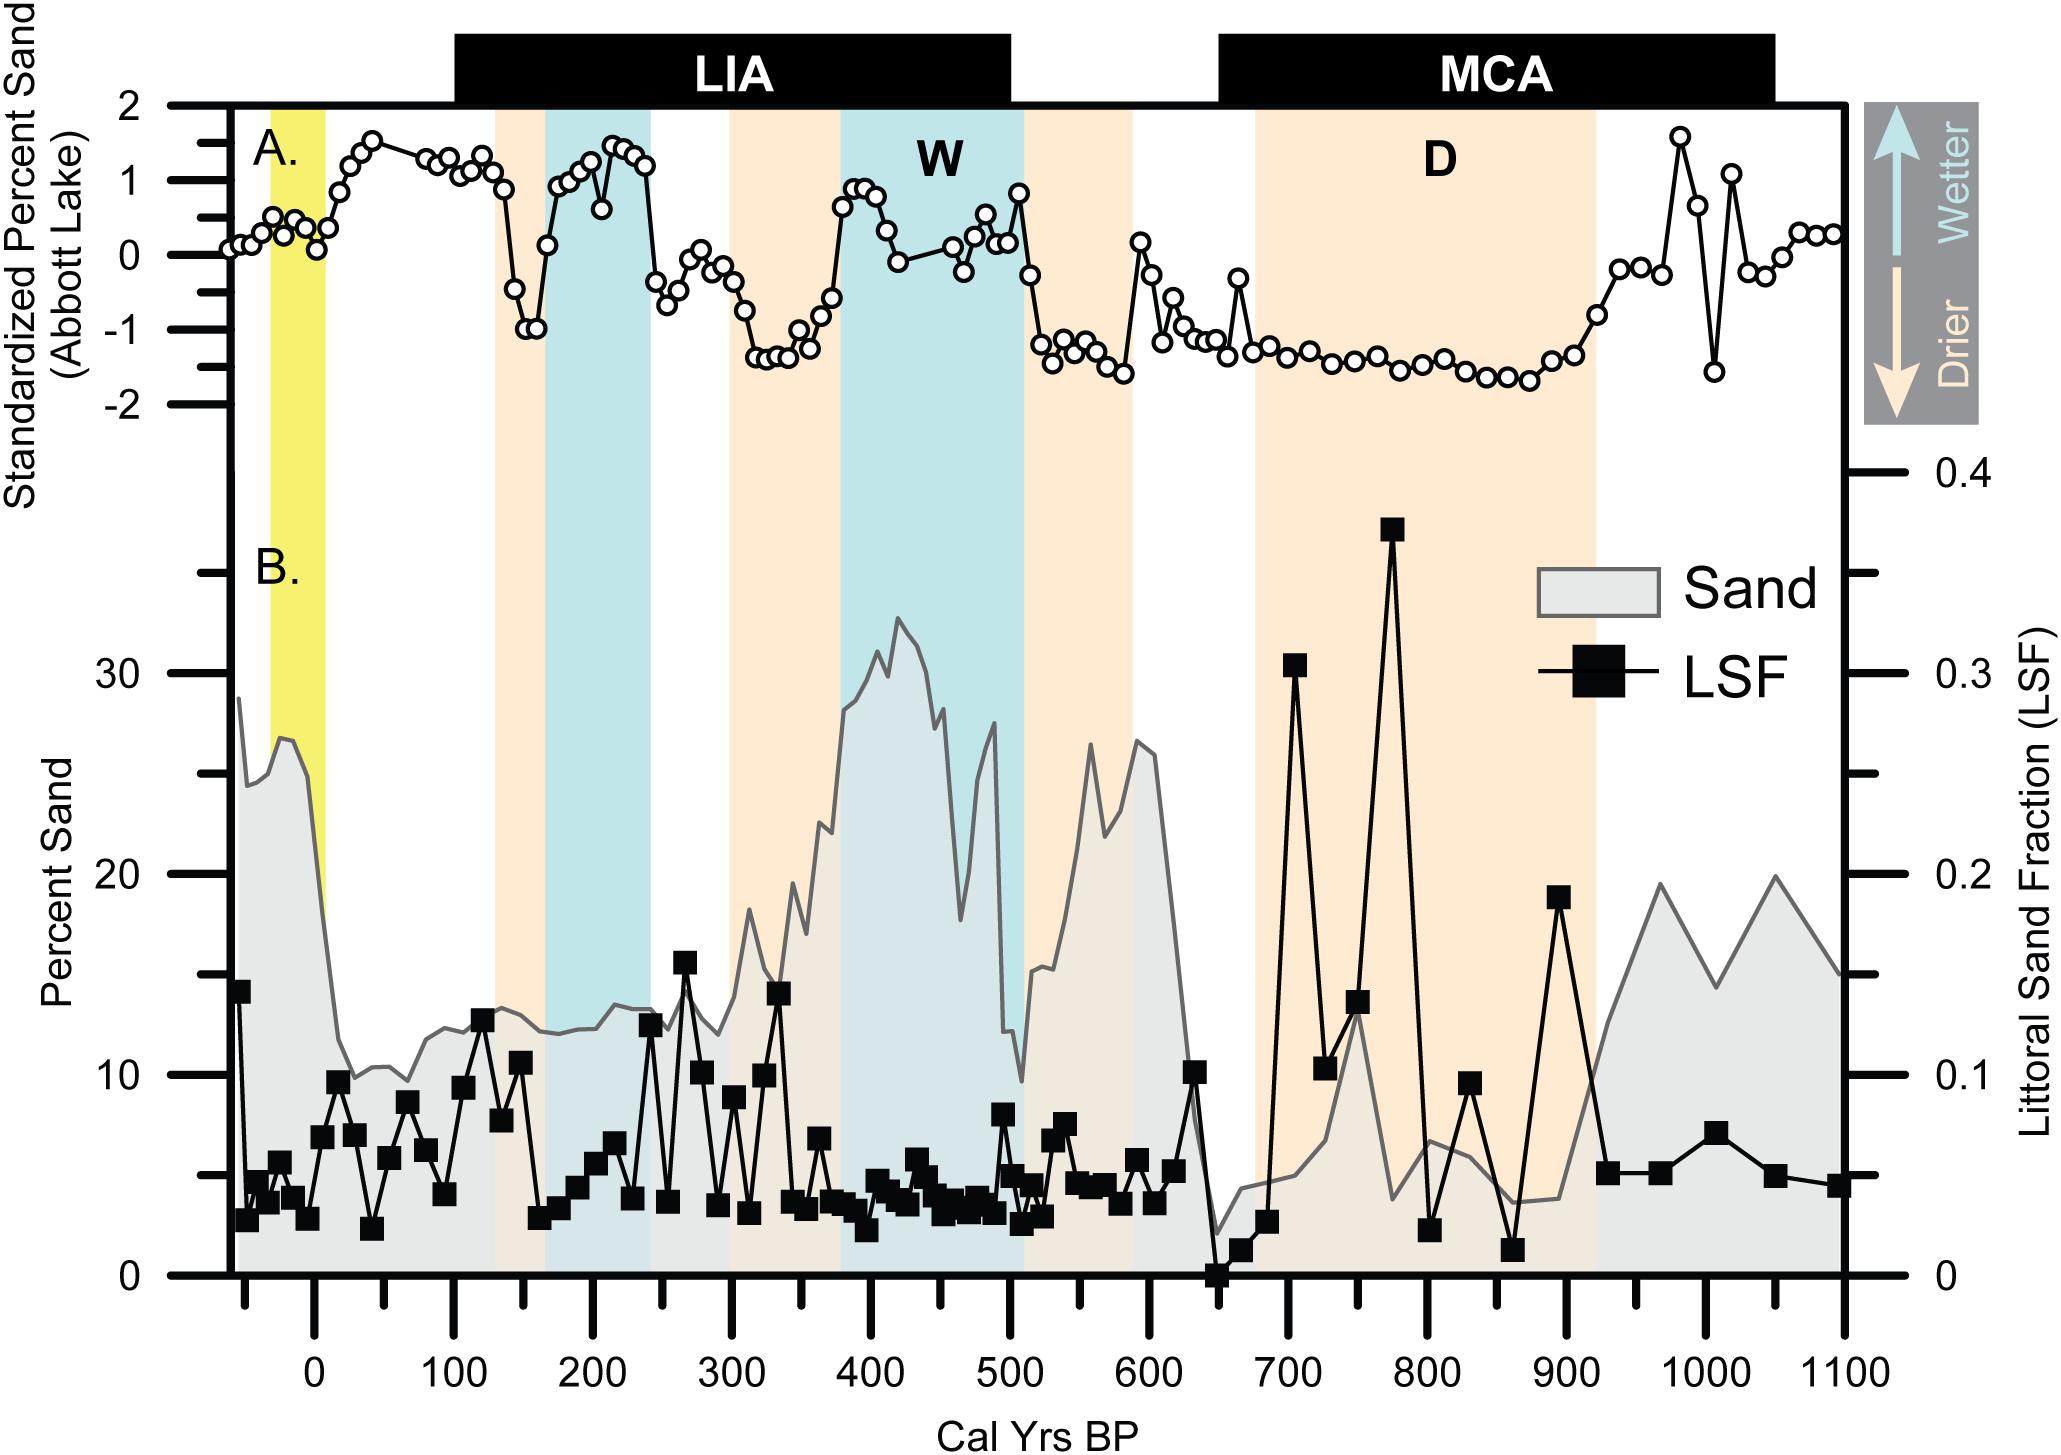
Figure 10. Plot of Holocene changes in grain size characteristics versus climate variability. The time periods for the Medieval Climate Anomaly (MCA) and Little Ice Age (LIA) are shown at the top as black bars (Masson-Delmotte et al., 2013). (A) The regional climate climate periods from nearby Abbott Lake by Hiner et al. (2016) are shown as the standardized sand content (white circles) and the correponding blue and orange vertical bars. Blue bars (“W”) indicate wetter periods, while orange bars (“D”) indicate drier periods. (B) The total sand (gray area) and littoral sand fraction (black squares) for PS1410-08GC are plotted vs. time based on the composite age model. The yellow vertical bar depicts the period of maximum dam construction (Willis and Griggs, 2003).
While these trends are generally consistent to these larger climate periods, we have also plotted the regional climate fluctuation from nearby Abbott Lake (see location in Figure 1) identified by Hiner et al. (2016). Abbott lake is located within the Salinas River watershed, specifically within the Arroyo Seco watershed, which has the highest runoff rates of all of the Salinas River tributaries (Farnsworth and Milliman, 2003). The lake is located ∼60 km to the southeast of the PS1410-08GC coring location, and therefore represents an excellent indicator of regional climate fluctuations that would have directly contributed to sedimentation along the southern Monterey Bay continental shelf.
From the Abbott Lake record, we see that the earliest low runoff period from 920 to 680 cal years BP correlates well with the low sand/high LSF period in PS1410-08GC. A transitional climate period followed where sand increases and the LSF decreases. This is followed by a subsequent dry period from 590 to 510 cal years BP where sand decreases and the LSF increases slightly. The transition to the cooler and wetter LIA is consistent at both Abbott Lake and on the shelf as sand peaks and the LSF is low from 510 to 380 cal years BP. However, the LIA is not consistently wet as Hiner et al. (2016) note from the Abbott Lake record. These similar fluctuations manifest in the shelf record as low sand/high LSF sections are observed during the dry and transitional period from 380 to 240 cal years BP. The LSF decreases during the wet period from 240 to 175 cal years BP, and increases again during the dry period from 175 to 130 cal years BP. Following the LIA sand decreases and the LSF remains relatively high until the dam construction begins in the mid-twentieth century.
In general, we feel these shelf sedimentation characteristics compare well with the regional climate variability. Low runoff, dry periods result in a limited total supply of sand, and an elevated contribution from coastal erosion. Again, this is likely because a limited sand supply to the coast due to the limited runoff accelerates erosion during large wave events. It is interesting to note that during these dry periods the LSF is not consistently high, but rather fluctuates between high and low values. Perhaps this reflects a dominantly quiescent period punctuated by periodic large storm events, while the wet periods might be more consistent over time. It is also important to note that the climate characteristics over the past ∼1,000 years (dry = low sand/high LSF, wet = high sand/low LSF) are different from what we have observed over the past several decades. During the most recent positive PDO (wet period), we have high sand and high LSF. Throughout the full >1,000-year record, this was the only instance where both of these metrics were high at the same time. This demonstrates that humans have modified system beyond the natural cyclicity of the past. Further, it might also reflect unprecedented coastal erosion in the region from the combined effect of modified drainage systems, accelerated sea level rise, and more frequent and intense storms due to climate change. The result of all of this is more sand transport offshore from significant erosion of beaches and sandy shorelines.
Broader Perspective and Future Implications
The results from this study demonstrate that Monterey Bay shelf sediments can preserve evidence of environmental variability driven by climate, humans, and the combined effect of climate and humans. It should be noted, however, that this study just focused on one specific location, and thus extrapolating these results to other regions may be difficult. That being said, this study supports the general idea that continental shelf stratigraphy can be a viable paleo-environmental archive similar to other studies that have tied changes in the amount and characteristics of shelf deposits to regional climatic variability (e.g., Hanebuth and Henrich, 2009; Nizou et al., 2010, Weight et al., 2011).
This study also demonstrates that coastal erosion can serve as a sediment source for shelf regions, a process that has been recognized in other areas globally. For example, erosion from the Old Huanghe delta in China over the last 100 years has supplied sediment to mid shelf regions in the Yellow Sea and East China Sea at an order of magnitude greater than the supply from the modern Huanghe River (Zhou et al., 2014). Similarly, an investigation of the Brazos River delta in the Gulf of Mexico showed 20th century abandonment and activation of deltaic lobes (Carlin and Dellapenna, 2015). Abandonment led to both shoreline erosion and erosion within the subaqueous delta with some of the eroded material being incorporated into the newly activated lobe and a new shelf depocenter (Carlin and Dellapenna, 2015).
For the Brazos River delta the most recent shift in the depocenter was attributed to the combined effect of drought and watershed modifications (Carlin and Dellapenna, 2015). This morphologic/stratigraphic change resulting from the combined effect of climate and human modifications is similar to what we observed in Monterey Bay, where the shift in PDO following the dam construction period accentuated the changes in shelf sedimentation. The combination of climate and human activities resulting in stratigraphic change has been observed in other locations along the United States Pacific margin. On the Umpqua River margin off the coast of Oregon, sedimentation increased and fined during the mid-twentieth century interpreted to be due to the combination of intensive timber harvesting and shift in the PDO to a wet hydroclimate phase for the region (Wheatcroft et al., 2013). Therefore, for both the Umpqua River margin and the Monterey Bay shelf there are detectable stratigraphic changes that resulted from the combined effect of humans and natural processes.
Looking toward the future, we expect this sedimentation regime to persist provided that dams remain in place along coastal rivers and coastal erosion remains elevated as a result. As fluvial sediment supplies remain trapped behind dams, storms will likely continue to erode shoreline with more frequent/intense storms during wet periods, and less frequent/intense storms during dry periods (but storms still capable of causing erosion). Yet, there is an increasing push to remove dams along rivers recently, as dam removals have increased exponentially since the 1970s (O’Connor et al., 2015). Studies on the impacts of dam removal have shown that major responses of the fluvial system following dam removal were relatively short-lived, as the system returned to a more natural state within a couple of years (e.g., East et al., 2018). Therefore, with dam removal there is the potential for a relatively rapid shift back to sedimentation that resembles what we have observed over the past ∼1,000 years rather than the past several decades.
Conclusion
In this study, we investigated shelf sedimentation within Monterey Bay over decadal and centennial time scales, distinguishing sediment sources from both rivers and coastal erosion. The results demonstrated that during dry periods, relatively little sand was transported to the shelf from rivers, and more was sourced from coastal erosion. Conversely, during wet periods more sand was transported to the shelf overall, primarily from rivers, rather than coastal erosion.
These characteristics throughout the past 1,000 years reflect how coastal erosion can increase when fluvial sediment supply is limited during a dry climate period. The data also showed that dam construction on coastal rivers also increased coastal erosion, and the transport of littoral sediment offshore. The combined effect of dams and a shift to a wetter climate, however, resulted in both increases in littoral and total sand transport to the shelf. These most recent deposits represent an unprecedented shift in shelf sedimentation that is unlike any sedimentary characteristics observed over the past >1,000 years. This change is likely the result of accelerated coastal erosion in region from a combination of human modifications, sea level rise, and climate change. While this study only focused on one location, these results are aligned with other studies that show coastal erosion providing sediment to other shelf depocenters, and studies that observed stratigraphic change resulting from the combination of human activities and natural processes. Therefore, this study adds to our understanding that shelf sediment records can reflect climatic variability over centennial time scales, and that over the past several decades shelf sedimentation has changed in response to human activities in the watershed and the coastal zone.
Author Contributions
JC, JA, and AW carried out the cruise and project planning for the PS1410 cruise with AW acting as Chief Scientist. JC conducted the cruise and project planning for the SR1707 cruise in consultation with JA and AW. JC served as Chief Scientist for the SR1707 cruise. JC, JA, VaS, JH, and ViS performed the sample and data analyses and interpretations. JC and JA conducted the primary writing and figure drafting for this manuscript. AW, VaS, JH, and ViS contributed the feedback that greatly improved this manuscript.
Conflict of Interest Statement
The authors declare that the research was conducted in the absence of any commercial or financial relationships that could be construed as a potential conflict of interest.
Acknowledgments
We would like to thank the crew of the R/V Point Sur and the scientific party of cruise PS1410 for sample collection in 2014, with special thanks to Kenneth Coale, Mike Prince, Stian Andrini and the NSF/ONR/UNOLS Chief Scientist Training Program. We would like to thank Jim Christmann of the R/V Shana Rae and the scientific party of cruise SR1707 for sample collection in 2017, with special thanks to Jennifer White and Dan Powers. We would like to thank Sophie De Beukelaer from the Monterey Bay National Marine Sanctuary for assistance in securing permits to collect samples within the marine sanctuary. Acknowledgment is made to the Donors of the American Chemical Society Petroleum Research Fund, for partial support of this research (PRF #57363-UNI8). Additional support for field work was provided by the California State University Council on Ocean Affairs, Science, and Technology (COAST) Program. Analytical funding was provided by the USGS Climate Research and Development Program, COAST, and California State University, Fullerton Office of Research and Sponsored Projects. Anthony Kovscek and Elliot Kim (Stanford Univ.) performed the CT analyses, and Tom Guilderson (LLNL) and John Southon (UC-Irvine) assisted with 14C measurements. We would also like to thank Matthew Kirby for use of his instrumentation, assistance with the Abbott Lake data, and feedback on figures. Finally, we would like to thank John Barron, the editor DP, and the two reviewers who provided valuable comments to improve this manuscript. Any use of trade, firm, or product names is for descriptive purposes only and does not imply endorsement by the U.S. Government.
References
Aagaard, T., and Sørensen, P. (2012). Coastal profile response to sea level rise: a process-based approach. Earth Surf. Process. Landf. 37, 354–362. doi: 10.1002/esp.2271
Abràmoff, M. D., Magalhães, P. J., and Ram, S. J. (2004). Image processing with ImageJ. Biophotonics Int. 11, 36–42.
Alexander, C. R., and Venherm, C. (2003). Modern sedimentary processes in the Santa Monica, California continental margin: sediment accumulation, mixing and budget. Mar. Environ. Res. 56, 177–204. doi: 10.1016/s0141-1136(02)00330-6
Allan, J. C., and Komar, P. D. (2006). Climate controls on US West Coast erosion processes. J. Coast. Res. 22, 511–529. doi: 10.2112/03-0108.1
Appleby, P. (1998). “Dating recent sediments by 210-Pb: problems and solutions,” in Proc. 2nd NKS/EKO-1 Seminar, Helsinki, 7–24.
Appleby, P., and Oldfield, F. (1978). The calculation of 210 Pb dates assuming a constant rate of supply of unsupported 210Pb to the sediments. Catena 5, 1–8. doi: 10.1016/s0341-8162(78)80002-2
Barnard, P. L., Allan, J., Hansen, J. E., Kaminsky, G. M., Ruggiero, P., and Doria, A. (2011). The impact of the 2009–10 El Niño Modoki on U.S. West Coast beaches. Geophys. Res. Lett. 38:L13604. doi: 10.1029/2011GL047707
Barnard, P. L., Hoover, D., Hubbard, D. M., Snyder, A., Ludka, B. C., Allan, J., et al. (2017). Extreme oceanographic forcing and coastal response due to the 2015–2016 El Niño. Nat. Commun. 8:14365. doi: 10.1038/ncomms14365
Barnard, P. L., Short, A. D., Harley, M. D., Splinter, K. D., Vitousek, S., Turner, I. L., et al. (2015). Coastal vulnerability across the Pacific dominated by El Nino/Southern oscillation. Nat. Geosci. 8, 801–807. doi: 10.1038/ngeo2539
Best, T. C., and Griggs, G. B. (1991). “A Sediment Budget for the Santacruz Littoral Cell, California,” in From Shoreline to Abyss, ed. R. H. Osborne (Tulsa, OK: SEPM Society for Sedimentary Geologists), 35–50.
Blaauw, M. (2010). Methods and code for ‘classical’age-modelling of radiocarbon sequences. Quat. Geochronol. 5, 512–518. doi: 10.1016/j.quageo.2010.01.002
Bromirski, P. D., Miller, A. J., Flick, R. E., and Auad, G. (2011). Dynamical suppression of sea level rise along the Pacific coast of North America: indications for imminent acceleration. J. Geophys. Res. Oceans 116:C07005.
Carlin, J. A., and Dellapenna, T. M. (2015). The evolution of a subaqueous delta in the anthropocene: a stratigraphic investigation of the Brazos River delta, TX USA. Cont. Shelf Res. 111, 139–149. doi: 10.1016/j.csr.2015.08.008
Chenillat, F., Riviere, P., Capet, X., Di Lorenzo, E., and Blanke, B. (2012). North pacific gyre oscillation modulates seasonal timing and ecosystem functioning in the california current upwelling system. Geophys. Res. Lett. 39:L01606.
Cooper, J. A. G., and Pilkey, O. H. (2004). Sea-level rise and shoreline retreat: time to abandon the Bruun Rule. Glob. Planet. Change 43, 157–171. doi: 10.1016/j.gloplacha.2004.07.001
Corbett, D. R., Dail, M., and McKee, B. (2007). High-frequency time-series of the dynamic sedimentation processes on the western shelf of the Mississippi River Delta. Cont. Shelf Res. 27, 1600–1615. doi: 10.1016/j.csr.2007.01.025
Corbett, D. R., McKee, B., and Duncan, D. (2004). An evaluation of mobile mud dynamics in the Mississippi River deltaic region. Mar. Geol. 209, 91–112. doi: 10.1016/j.margeo.2004.05.028
Cutshall, N. H., Larsen, I. L., and Olsen, C. R. (1983). Direct analysis of 210 Pb in sediment samples: self-absorption corrections. Nucl. Instrum. Methods Phys. Res. 206, 309–312. doi: 10.1016/0167-5087(83)91273-5
Dettinger, M. D., and Ingram, B. L. (2013). The coming megafloods. Sci. Am. 308, 64–71. doi: 10.1038/scientificamerican0113-64
Dettinger, M. D., Ralph, F. M., Das, T., Neiman, P. J., and Cayan, D. R. (2011). Atmospheric rivers, floods and the water resources of California. Water 3, 445–478. doi: 10.3390/w3020445
Di Lorenzo, E., Schneider, N., Cobb, K., Franks, P., Chhak, K., Miller, A., et al. (2008). North pacific gyre oscillation links ocean climate and ecosystem change. Geophys. Res. Lett. 35:L08607. doi: 10.1111/gcb.13171
East, A. E., Logan, J. B., Mastin, M. C., Ritchie, A. C., Bountry, J. A., Magirl, C. S., et al. (2018). Geomorphic evolution of a gravel-bed river under sediment-starved versus sediment-rich conditions: river response to the world’s largest dam removal. J. Geophys. Res. Earth Surf. 123, 3338–3369.
Eittreim, S. L., Xu, J., Noble, M., and Edwards, B. D. (2002). Towards a sediment budget for the Santa Cruz shelf. Mar. Geol. 181, 235–248. doi: 10.1016/s0025-3227(01)00269-9
Farnsworth, K. L., and Milliman, J. D. (2003). Effects of climatic and anthropogenic change on small mountainous rivers: the Salinas River example. Glob. Planet. Change 39, 53–64. doi: 10.1016/s0921-8181(03)00017-1
Goodbred, S. L., and Kuehl, S. A. (1998). Floodplain processes in the Bengal Basin and the storage of Ganges-Brahmaputra river sediment: an accretion study using Cs-137 and Pb-210 geochronology. Sediment. Geol. 121, 239–258. doi: 10.1016/s0037-0738(98)00082-7
Gray, A. B., Pasternack, G. B., Watson, E. B., Warrick, J. A., and Goñi, M. A. (2015a). Effects of antecedent hydrologic conditions, time dependence, and climate cycles on the suspended sediment load of the Salinas River, California. J. Hydrol. 525, 632–649. doi: 10.1016/j.jhydrol.2015.04.025
Gray, A. B., Pasternack, G. B., Watson, E. B., Warrick, J. A., and Goñi, M. A. (2015b). The effect of El Niño southern oscillation cycles on the decadal scale suspended sediment behavior of a coastal dry-summer subtropical catchment. Earth Surf. Process. Landf. 40, 272–284.
Griggs, G. (1974). Nearshore current patterns along the central California coast. Estuar. Coast. Mar. Sci. 2, 395–405. doi: 10.1016/0302-3524(74)90007-3
Hanebuth, T. J. J., and Henrich, R. (2009). Recurrent decadal-scale dust events over holocene western Africa and their control on canyon turbidite activity (Mauritania). Quat. Sci. Rev. 28, 261–270. doi: 10.1016/j.quascirev.2008.09.024
Hapke, C. J., Reid, D., Richmond, B. M., Ruggiero, P., and List, J. (2006). National assessment of shoreline change Part 3: historical shoreline change and associated coastal land loss along sandy shorelines of the California Coast. US Geol. Survey Open File Rep. 1219:27.
Harris, C. K., Traykovski, P. A., and Geyer, W. R. (2005). Flood dispersal and deposition by near-bed gravitational sediment flows and oceanographic transport: a numerical modeling study of the Eel River shelf, northern California. J. Geophys. Res.Oceans 110:C09025. doi: 10.1029/2004jc002727
Hicks, D. M. (1985). Sand Dispersion from an Ephemeral Delta on a Wave Dominated Coast. Ph.D. thesis, University of California, Santa Cruz.
Hicks, D. M., and Inman, D. L. (1987). Sand dispersion from an ephemeral river delta on the central California coast. Mar. Geol. 77, 305–318. doi: 10.1016/0025-3227(87)90119-8
Hiner, C. A., Kirby, M. E., Bonuso, N., Patterson, W. P., Palermo, J., and Silveira, E. (2016). Late holocene hydroclimatic variability linked to pacific forcing: evidence from abbott lake, coastal central California. J. Paleolimnol. 56, 299–313. doi: 10.1007/s10933-016-9912-4
Huyer, A., Barth, J., Kosro, P., Shearman, R., and Smith, R. (1998). Upper-ocean water mass characteristics of the California Current, summer 1993. Deep Sea Res. Part II Top. Stud. Oceanogr. 45, 1411–1442. doi: 10.1016/s0967-0645(98)80002-7
Inman, D. L., and Jenkins, S. A. (1999). Climate change and the episodicity of sediment flux of small California rivers. J. Geol. 107, 251–270. doi: 10.1086/314346
Jacox, M., Moore, A., Edwards, C., and Fiechter, J. (2014). Spatially resolved upwelling in the California current system and its connections to climate variability. Geophys. Res. Lett. 41, 3189–3196. doi: 10.1002/2014gl059589
Kemp, A. C., Horton, B. P., Donnelly, J. P., Mann, M. E., Vermeer, M., and Rahmstorf, S. (2011). Climate related sea-level variations over the past two millennia. Proc. Natl. Acad. Sci. U.S.A. 108, 11017–11022. doi: 10.1073/pnas.1015619108
Kirby, M., Lund, S., Patterson, W., Anderson, M., Bird, B., Ivanovici, L., et al. (2010). A Holocene record of Pacific decadal oscillation (PDO)-related hydrologic variability in southern California (Lake Elsinore, CA). J. Paleolimnol. 44, 819–839. doi: 10.1007/s10933-010-9454-0
Kniskern, T. A., Warrick, J. A., Farnsworth, K. L., Wheatcroft, R. A., and Goni, M. A. (2011). Coherence of river and ocean conditions along the US West Coast during storms. Cont. Shelf Res. 31, 789–805. doi: 10.1016/j.csr.2011.01.012
Kolker, A. S., Goodbred, S. L., Hameed, S., and Cochran, J. K. (2009). High-resolution records of the response of coastal wetland systems to long-term and short-term sea-level variability. Estuar. Coast. Shelf Sci. 84, 493–508. doi: 10.1016/j.ecss.2009.06.030
Komar, P. (1996). The budget of littoral sediment: concepts and applications. Shore Beach 64, 18–26.
Lewis, R. C., Coale, K. H., Edwards, B. D., Marot, M., Douglas, J. N., and Burton, E. J. (2002). Accumulation rate and mixing of shelf sediments in the Monterey Bay National Marine Sanctuary. Mar. Geol. 181, 157–169. doi: 10.1016/s0025-3227(01)00265-1
Limber, P. W., Patsch, K. B., and Griggs, G. B. (2008). Coastal sediment budgets and the littoral cutoff diameter: a grain size threshold for quantifying active sediment inputs. J. Coast. Res. 24, 122–133. doi: 10.2112/06-0675.1
Mantua, N. J., Hare, S. R., Zhang, Y., Wallace, J. M., and Francis, R. C. (1997). A Pacific interdecadal climate oscillation with impacts on salmon production. Bull. Am. Meteorol. Soc. 78, 1069–1079. doi: 10.1175/1520-0477(1997)078<1069:apicow>2.0.co;
Masson-Delmotte, V., Schulz, M., Abe-Ouchi, A., Beer, J., Ganopolski, A., González Rouco, J., et al. (2013). “Information from paleoclimate archives,” in Climate Change 2013: The Physical Science Basis. Contribution of Working Group I to the Fifth Assessment Report of the Intergovernmental Panel on Climate Change, eds T. F. Stocker, D. Qin, G.-K. Plattner, M. Tignor, S. K. Allen, J. Boschung et al. (Cambridge: Cambridge University Press), 383–464. doi: 10.1017/cbo9781107415324.013
Nittrouer, C. A. (1999). STRATAFORM: overview of its design and synthesis of its results. Mar. Geol. 154, 3–12. doi: 10.1016/s0025-3227(98)00128-5
Nizou, J., Hanebuth, T. J. J., Heslop, D., Schwenk, T., Palamenghi, L., Stuut, J.-B., et al. (2010). The senegal river mud belt: a high-resolution archive of paleoclimatic change and coastal evolution. Mar. Geol. 278, 150–164. doi: 10.1016/j.margeo.2010.10.002
O’Connor, J. E., Duda, J. J., and Grant, G. E. (2015). 1000 dams down and counting. Science 348, 496–497. doi: 10.1126/science.aaa9204
Odigie, K. O., and Warrick, J. A. (2017). Coherence between coastal and river flooding along the California Coast. J. Coast. Res. 34, 308–317. doi: 10.2112/jcoastres-d-16-00226.1
Palinkas, C., and Nittrouer, C. (2006). Clinoform sedimentation along the Apennine shelf, Adriatic Sea. Mar. Geol. 234, 245–260. doi: 10.1016/j.margeo.2006.09.006
Palinkas, C. M. (2009). The timing of floods and storms as a controlling mechanism for shelf deposit morphology. J. Coast. Res. 25, 1122–1129. doi: 10.2112/08-1041.1
Puig, P., Palanques, A., and Guillén, J. (2001). Near-bottom suspended sediment variability caused by storms and near-inertial internal waves on the Ebro mid continental shelf (NW Mediterranean). Mar. Geol. 178, 81–93. doi: 10.1016/s0025-3227(01)00186-4
Reimer, P. J., Bard, E., Bayliss, A., Beck, J. W., Blackwell, P. G., Ramsey, C. B., et al. (2013). IntCal13 and Marine13 radiocarbon age calibration curves 0–50,000 years cal BP. Radiocarbon 55, 1869–1887. doi: 10.1016/j.dib.2018.10.040
Reynolds, L. C., and Simms, A. R. (2015). Late quaternary relative sea level in Southern California and Monterey Bay. Quat. Sci. Rev. 126, 57–66. doi: 10.1016/j.quascirev.2015.08.003
Reynolds, L. C., Simms, A. R., Ejarque, A., King, B., Anderson, R. S., Carlin, J. A., et al. (2018). Coastal flooding and the 1861–2 California storm season. Mar. Geol. 400, 49–59. doi: 10.1016/j.margeo.2018.02.005
Rosati, J. D., Dean, R. G., and Walton, T. L. (2013). The modified Bruun Rule extended for landward transport. Mar. Geol. 340, 71–81. doi: 10.1016/j.margeo.2013.04.018
Sallenger, A. H. Jr., Krabill, W., Brock, J., Swift, R., Manizade, S., and Stockdon, H. (2002). Sea-cliff erosion as a function of beach changes and extreme wave runup during the 1997–1998 El Niño. Mar. Geol. 187, 279–297. doi: 10.1016/s0025-3227(02)00316-x
Sanchez-Cabeza, J., and Ruiz-Fernández, A. (2012). 210Pb sediment radiochronology: an integrated formulation and classification of dating models. Geochim. Cosmochim. Acta 82, 183–200. doi: 10.1016/j.gca.2010.12.024
Schwing, F., Murphree, T., and Green, P. (2002). The evolution of oceanic and atmospheric anomalies in the northeast Pacific during the El Niño and La Niña events of 1995–2001. Prog. Oceanogr. 54, 459–491. doi: 10.1016/s0079-6611(02)00064-2
Steffen, W., Grinevald, J., Crutzen, P., and McNeill, J. (2011). The anthropocene: conceptual and historical perspectives. Philos. Trans. R. Soc. Lond. A Math. Phys. Eng. Sci. 369, 842–867. doi: 10.1098/rsta.2010.0327
Storlazzi, C., and Field, M. (2000). Sediment distribution and transport along a rocky, embayed coast: monterey peninsula and carmel bay, California. Mar. Geol. 170, 289–316. doi: 10.1016/s0025-3227(00)00100-6
Storlazzi, C. D., and Griggs, G. B. (2000). Influence of El Niño–Southern Oscillation (ENSO) events on the evolution of central California’s shoreline. Geol. Soc. Am. Bull. 112, 236–249.
Storlazzi, C. D., and Reid, J. A. (2010). The influence of El Nino-Southern Oscillation (ENSO) cycles on wave-driven sea-floor sediment mobility along the central California continental margin. Cont. Shelf Res. 30, 1582–1599.
Stuiver, M., and Reimer, P. J. (1993). Extended 14 C data base and revised CALIB 3.0 14 C age calibration program. Radiocarbon 35, 215–230.
Syvitski, J. P., Vörösmarty, C. J., Kettner, A. J., and Green, P. (2005). Impact of humans on the flux of terrestrial sediment to the global coastal ocean. Science 308, 376–380.
Traykovski, P., Geyer, W. R., Irish, J., and Lynch, J. (2000). The role of wave-induced density-driven fluid mud flows for cross-shelf transport on the Eel River continental shelf. Cont. Shelf Res. 20, 2113–2140.
Warrick, J. A., and Farnsworth, K. L. (2009). Sources of sediment to the coastal waters of the Southern California Bight. Geol. Soc. Am. Spec. Pap. 454, 39–52.
Weight, R. W. R., Anderson, J. B., and Fernandez, R. (2011). Rapid mud accumulation on the central texas shelf linked to climate change and sea-level rise. J. Sediment. Res. 81, 743–764.
Wheatcroft, R., and Borgeld, J. (2000). Oceanic flood deposits on the northern California shelf: large-scale distribution and small-scale physical properties. Cont. Shelf Res. 20, 2163–2190.
Wheatcroft, R., Sommerfield, C., Drake, D., Borgeld, J., and Nittrouer, C. (1997). Rapid and widespread dispersal of flood sediment on the northern California margin. Geology 25, 163–166.
Wheatcroft, R. A., Goñi, M. A., Richardson, K. N., and Borgeld, J. C. (2013). Natural and human impacts on centennial sediment accumulation patterns on the Umpqua River margin, Oregon. Mar. Geol. 339, 44–56.
Willis, C. M., and Griggs, G. B. (2003). Reductions in fluvial sediment discharge by coastal dams in California and implications for beach sustainability. J. Geol. 111, 167–182.
Wright, L. D., and Nittrouer, C. A. (1995). Dispersal Of river sediments in coastal seas - 6 contrasting cases. Estuaries 18, 494–508.
Xu, J., Noble, M., and Eittreim, S. L. (2002). Suspended sediment transport on the continental shelf near Davenport, California. Mar. Geol. 181, 171–193.
Keywords: shelf sedimentation, littoral sand, coastal erosion, dams, climate, grain size, Monterey Bay, California
Citation: Carlin J, Addison J, Wagner A, Schwartz V, Hayward J and Severin V (2019) Variability in Shelf Sedimentation in Response to Fluvial Sediment Supply and Coastal Erosion Over the Past 1,000 Years in Monterey Bay, CA, United States. Front. Earth Sci. 7:113. doi: 10.3389/feart.2019.00113
Received: 01 October 2018; Accepted: 30 April 2019;
Published: 29 May 2019.
Edited by:
Dorothy M. Peteet, Goddard Institute for Space Studies (NASA), United StatesReviewed by:
Fabio Matano, Italian National Research Council (CNR), ItalyMichel Michaelovitch Mahiques, University of São Paulo, Brazil
Copyright © 2019 Carlin, Addison, Wagner, Schwartz, Hayward and Severin. This is an open-access article distributed under the terms of the Creative Commons Attribution License (CC BY). The use, distribution or reproduction in other forums is permitted, provided the original author(s) and the copyright owner(s) are credited and that the original publication in this journal is cited, in accordance with accepted academic practice. No use, distribution or reproduction is permitted which does not comply with these terms.
*Correspondence: Joseph Carlin, amNhcmxpbkBmdWxsZXJ0b24uZWR1