 Benjamin V. Gaglioti1,2*
 Daniel H. Mann2Gregory C. Wiles3
 Benjamin M. Jones4Josh Charlton3Nicholas Wiesenberg3Laia Andreu-Hayles1
- 1Lamont-Doherty Earth Observatory of Columbia University, Palisades, NY, United States
- 2Department of Geosciences, University of Alaska Fairbanks, Fairbanks, AK, United States
- 3Department of Earth Sciences, The College of Wooster, Wooster, OH, United States
- 4Water and Environmental Research Center, University of Alaska Fairbanks, Fairbanks, AK, United States
The Little Ice Age (LIA), ca. CE 1250–1850, was a cold period of global extent, with the nature and timing of reduced temperatures varying by region. The Gulf of Alaska (GOA) is a key location to study the climatic drivers of glacier fluctuations during the LIA because dendrochronological techniques can provide precise ages of ice advances and retreats. Here, we use dendrochronology to date the most recent advance of La Perouse Glacier in the Fairweather Range of Southeast Alaska. After maintaining a relatively contracted state since at least CE 1200, La Perouse advanced to its maximum LIA position between CE 1850 and 1895. Like many other glaciers bordering the GOA, the La Perouse Glacier reached this maximum position relatively late in the LIA compared with glaciers in other regions. This is curious because reconstructions of paleoclimate in the GOA region indicate the 19th century was not the coldest period of the LIA. Using newly available paleoclimate data, we hypothesize that a combination of moderately cool summers accompanying the Dalton Solar Minimum and exceptionally snowy winters associated with a strengthened Aleutian Low could have caused these relatively late LIA advances. Such a scenario implies that winter climate processes, which are heavily influenced by ocean-atmospheric variability in the North Pacific region, have modulated these coastal glaciers’ sensitivity to shifts in summer temperatures.
Introduction
The Little Ice Age
The Little Ice Age (LIA) saw episodes of lowered temperatures from approximately CE 1250 to 1850, or, in some cases, to 1900 (Wiles et al., 2004; Barclay et al., 2009; Ahmed et al., 2013; Solomina et al., 2015; Anchukaitis et al., 2017). During the LIA, many Northern Hemisphere alpine glaciers advanced to their greatest Holocene extents (Solomina et al., 2015, 2016). These advances were partly a response to declining summer insolation over the last 8 ka of the Holocene (Berger and Loutre, 1991; Solomina et al., 2015). Contrary to what this millennial trend in orbital forcing would predict, the Holocene glacier record is more complicated than a progressive buildup of glacial ice. Numerous glacier advances and retreats occurred during the Holocene (Solomina et al., 2015), and, within these millennial-scale events, there were also century- and decade-scale glacier fluctuations (Luckman, 1993; Grove, 2001; Wiles et al., 2004; Bräuning, 2006; Miller et al., 2012; Solomina et al., 2016). The cyclic and nested nature of the Holocene glacier record indicates that a complex of non-orbital climate forcing agents affected how glaciers responded to the overall long-term cooling imposed by Milankovitch forcing (i.e., Miller et al., 2012). A similar complex of interacting climate processes is expected to continue operating in the future and determine how glaciers respond to ongoing anthropogenic warming (Oerlemans and Fortuin, 1992; Bitz and Battisti, 1999; Marzeion et al., 2014). Analysis of paleo-records can identify processes that may be of key importance to glaciers both in the past and in our warmer future.
The Little Ice Age in the Gulf of Alaska Region
The Gulf of Alaska (GOA; Figure 1) serves as an interesting region in which to examine the relationships between LIA climate and glaciers. This is partly because its mild maritime climate allows forests to repeatedly regrow in the wake of retreating glaciers. When glaciers then readvance, it is possible to use dendrochronology to precisely date glacier-affected trees (Luckman, 1993; Wiles et al., 2008; Barclay et al., 2009; Coulthard et al., 2013). Overriding glaciers, aggrading outwash, proglacial lake-level changes, and moraine building can kill, tilt, and injure trees. These annually-dated archives can provide a precise record of glacial history (Coulthard and Smith, 2013).
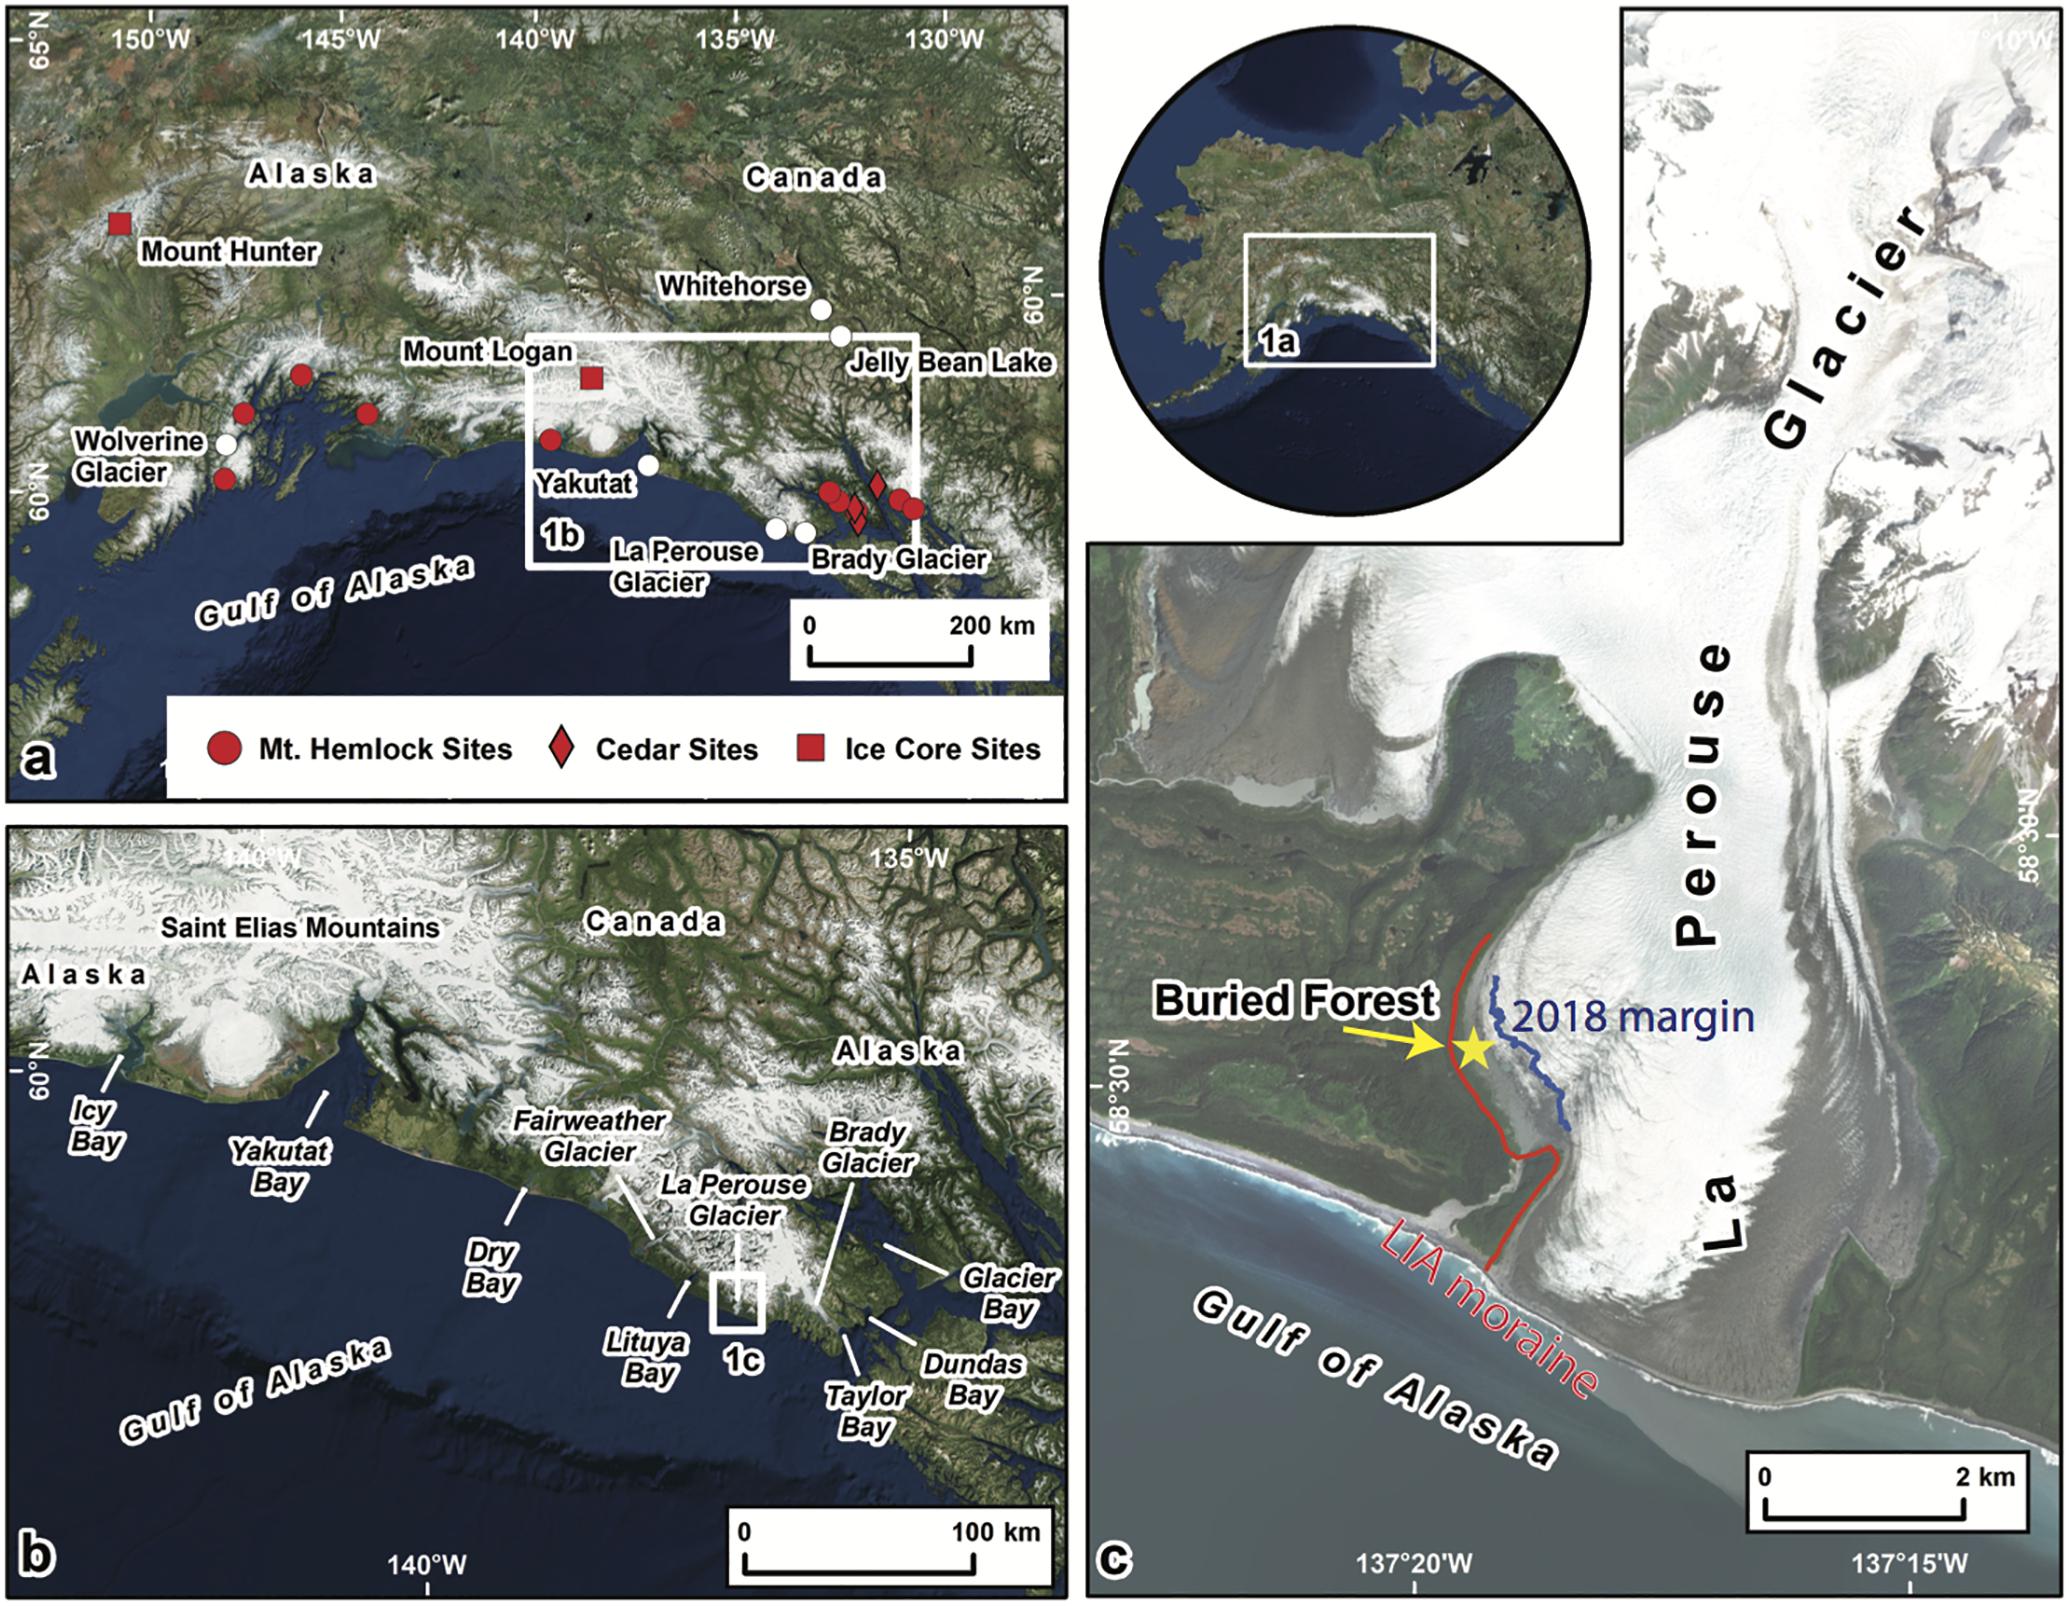
Figure 1. Maps and aerial images of the study area. (a) Locations described in the text including sources of paleoclimate and tree-ring data. (b) Locations of glaciers described in the text. (c) Extent of La Perouse Glacier in 2010 (satellite imagery) with the location of the exhumed forest we crossdated (Figure 2), the Little Ice Age moraine, and field-surveyed ice margin in July of 2018.
Glacier history in the GOA region also provides a useful LIA case study because the climate there is known to be sensitive to volcanic events, solar variability, and North Pacific Decadal Variability (NPDV) (see Study Area section) (Mock et al., 1998; Anderson et al., 2005; Hartmann and Wendler, 2005; Luckman and Wilson, 2005; Wiles et al., 2014; Osterberg et al., 2017; Bailey et al., 2018; Gaglioti et al., in press). Previous studies involving a survey of 143 glaciers in Alaska (Wiles et al., 2004, 2008; Barclay et al., 2009) indicate that LIA advances occurred in three phases that were associated with minima of the De Vries Cycle of solar irradiance, with the most recent and in some cases most extensive advance associated with the Dalton Minimum (CE 1790–1830) (Bard et al., 1997; Wiles et al., 2004). Glacial chronologies in the GOA region constructed using dendrochronology offer a means for disentangling the interactions and relative strengths of these climate drivers.
Here we use dendrochronology to crossdate tree-ring samples collected from standing dead trees in an exceptionally well-preserved “ghost” forest buried by the outwash and ice of the advancing La Perouse Glacier in the Fairweather Range of the St. Elias Mountains in northern Southeast Alaska (Figures 1, 2). We compare this new record with what is known about the timing of the LIA chronologies of nearby coastal glaciers (Figure 1), and then use newly available paleoclimate proxy data from other studies to infer which climate variables and forcing agents may have controlled LIA glacier fluctuations in this region.
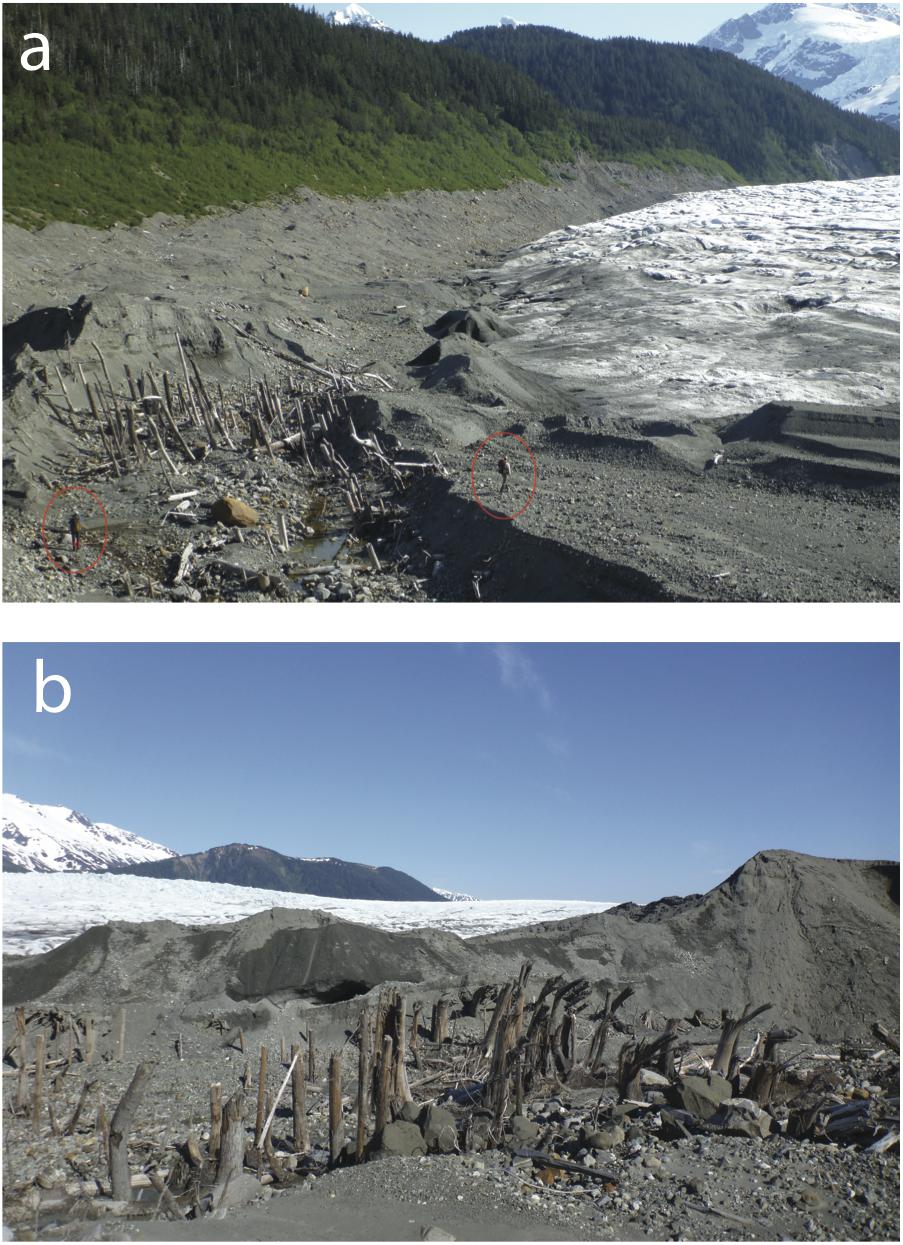
Figure 2. (a) The La Perouse Glacier in retreat in 2016 exposing an in situ interstadial forest. Humans (circled) for scale. (b) These trees were covered by glacial outwash deposited as the glacier advanced. Tree trunks were sheared off by the glacier where they protruded above the protective outwash gravel. Note the flagged logs pointing in the direction of glacier flow.
Study Area
Geography and Climate
The St. Elias Mountains of Southeast Alaska are the most heavily glaciated coastal mountains outside of Greenland and Antarctica. Peaks higher than 4000 m above sea level (asl) rise directly from tidewater, and these ranges intercept extra-tropical cyclonic storms, which are fueled by moisture evaporated from the Subtropical and mid-latitude Pacific Ocean (Rodionov et al., 2007). As a result, the climate along this coast is hyper-maritime, with a mean annual precipitation of 3.9 m at sea level in Yakutat, Alaska (Figure 1a), where mean July and January temperatures are 12.4 and –2.1°C, respectively (Arguez et al., 2012). Strong orographic effects cause even greater precipitation in the mountains and a pronounced rain shadow on the inland side of the range (Arguez et al., 2012).
Decadal variability in air and ocean temperatures and precipitation in the GOA region is largely controlled by shifting modes of NPDV (Wendler et al., 2016). Together, variations in the wintertime strength of the Aleutian Low pressure system (AL) and sea surface temperature anomalies (SSTAs) related to the Pacific Decadal Oscillation (PDO) comprise the dominant ocean-atmospheric modes of NPDV, and both are influenced by the El Niño Southern Oscillation (ENSO) (Newman et al., 2016). A strong AL/positive PDO regime is accompanied by winters with relatively low sea-level pressure and increased meridional flow in the atmosphere over the North Pacific, as well as enhanced storm intensity, increased precipitation, and warm SSTAs along the GOA coastline (Newman et al., 2016). Weak AL/negative PDO regimes are associated with the opposite wintertime patterns. The combination of decadal ENSO variations, seasonal changes in ocean-mixing depths (i.e., “re-emergence” of SSTAs), and poorly understood ocean to atmosphere feedbacks are thought to endow NPDV with its inter-annual autocorrelation (winter-to-winter memory) (Alexander and Deser, 1995; Newman et al., 2016). As a result, multi-decadal ocean-atmospheric regimes separated by abrupt state changes are salient features of the AL, PDO, and therefore the climate of coastal Alaska (Trenberth and Hurrell, 1994; Mantua and Hare, 2002; Hartmann and Wendler, 2005; Wendler et al., 2016).
Glaciers
The geo-climatic setting of the GOA coastal mountains nourishes ice caps and valley glaciers that extend down to sea level and cover about 18% of the GOA watershed (Neal et al., 2010). Mean equilibrium line altitudes on these glaciers are ∼900 m asl nearest the coast, rising to ∼2000 m asl 175 km inland (McGrath et al., 2017). Many coastal range glaciers terminate and calve icebergs into either tidewater bays or freshwater lakes (Figure 1b).
The La Perouse Glacier arises from the southern slopes of Mount Crillon (3200 m asl) and extends down to sea level (Figure 1). The La Perouse Glacier has been the only glacier in the North Pacific region that in recent times has calved directly into the surf of the open ocean. When the La Perouse Glacier was in a retracted state, the valley morphometry indicates that it probably calved into a saltwater bay or a deep freshwater lake.
Of particular importance for the maritime glaciers in the GOA are shifts in the amount of winter precipitation they receive, which may modulate their sensitivity to variations in summer temperature. The Northeast Pacific experiences high-magnitude, decadal-scale shifts in winter precipitation patterns related to changes in the strength of the AL and phase of the PDO. For example, interannual variability in snowfall determined changes in the annual mass balance of the land-terminating Wolverine Glacier between 1967 and 1990 (Figure 1; Bitz and Battisti, 1999). Beginning in 1976, a shift toward a positive PDO and stronger AL – a synoptic pattern associated with increased winter precipitation in the GOA – caused an increased annual mass balance in Wolverine Glacier. Although this positive PDO and strong AL phase lasted until ca. 1998, its effects on glacier mass balance via increased winter snowfall were trumped in the early 1990s by warmer air temperatures that forced the Wolverine Glacier, and many other glaciers in the region, to retreat (Arendt et al., 2002). This mass balance deficit has accelerated in the last decade with the continued warming trends in the region (Van Beusekom et al., 2010), and lowered albedo from the eruption of Mount Redoubt in 2009 (Arendt et al., 2013). In the absence of this exceptional warming trend, the Wolverine Glacier may have continued to have a positive mass balance and possibly even advance in response to the increased snowfall associated with the 1976 regime shift. Shifts in winter snowfall may have been a key factor in controlling glacier fluctuations in the GOA region throughout the Holocene.
Vegetation
The coastlines bordering the GOA support temperate rainforest vegetation up to ∼1000 m asl. The species composition and age of these conifer-dominated, old-growth forests can provide insights into glacial and landscape history. Sitka spruce [Picea sitchensis (Bong.) Carr] and western hemlock [Tsuga heterophylla (Raf.) Sarg] are dominant at lower and middle elevations, while Alaska yellow cedar (Callitropsis nootkatensis D. Don) and shore pine (Pinus contorta subsp. contorta Douglas) typically grow at mid-elevation sites often in or bordering muskegs. Mountain hemlock [Tsuga mertensiana (Bong.) Carr] and Sitka spruce typically form the alpine treeline (Harris et al., 1974; Thompson et al., 2006).
In addition to altitude, the time-since-deglaciation or time-since-other disturbances (i.e., flooding, landslides, abrupt coastal uplift due to seismic events, or windthrow) affect the age and species composition of these forests. On recently disturbed terrain, forest succession proceeds from alder (Alnus spp.), to balsam poplar (Populus trichocarpa Torr. & A.Gray ex. Hook.), to Sitka spruce, and eventually to western hemlock; a sequence that can take ∼300 years or more to complete (Chapin et al., 1994; Fastie, 1995). At lower elevation forests with moist soil conditions, large Alaska yellow cedar trees can co-dominate with hemlock and spruce beginning a few centuries after disturbance (Harris et al., 1974). The ring widths of long-lived yellow cedar, spruce, and hemlock trees can be sensitive to interannual variations in air temperatures, which facilitates the cross-dating of sub-fossil logs (Barclay et al., 1999; Beier et al., 2008; Wiles et al., 2012, 2014).
Historical Accounts
Following Vitus Bering’s brief visit in 1741, a series of European expeditions explored the coast of the northeastern GOA in the 18th and 19th centuries. Of particular relevance are the observations and maps made by the scientific expeditions led by Jean-François de Galaup, Comte de Lapérouse in 1786, Allessandro Malaspina in 1791, and George Vancouver in 1794 (Fisher and Johnston, 1993; La Pérouse, 1994; Olson, 2002; Malaspina and David, 2003). La Perouse described and mapped the glaciers in the coastal St. Elias Mountains and Lituya Bay, the Malaspina expedition mapped and observed the coastline and glaciers in the ice-choked Yakutat Bay while searching in vain for the Northwest Passage, and Vancouver charted Cross Sound (Figure 1). Approximately a century after these first European explorers, the Harriman expedition (Gilbert, 1910; Burroughs and Muir, 1986), and the Boundary Commission of the United States and Canada provided observations and maps of glacier extent during the late 19th and earliest 20th century1, including detailed observations of La Perouse Glacier. These early observations are summarized by Tebenkov (1850); Davidson (1904), and Tarr and Martin (1914) and allow us to compare the extents of glaciers in the late 18th century with their extents 100 and 200 years later.
Materials and Methods
Field Sampling
While exploring the La Perouse forefield in May of 2016, we discovered an ancient forest recently exposed by the retreating margin of the glacier (Figure 2). We collected tree cores to determine when these trees began growing and when they died in order to infer the limiting ages of glacier retreat and advance. We identified the different tree genera based on bark characteristics, stem and branch habit, and wood aroma. Two tree cores (0.5 mm diameter) offset by 90° were collected from 50 of the recently exhumed trees within an area of 0.5 km2. Radiocarbon (14C) samples were collected from the bark of one tree to constrain the timing of tree death, and two other 14C samples were collected from the base of buried soil organic horizons located 50 m from one another in order to provide minimum dates on the initiation of soil development following the penultimate glacier retreat. Radiocarbon samples were analyzed by accelerator mass spectrometry at Beta Analytic in Miami, Florida, and then calibrated to calendar years using the IntCal13 curve (Reimer et al., 2013).
Tree-Ring Measuring and Cross-Dating
Tree cores were sanded with progressively finer sand paper from 100 to 600 grit to reveal ring boundaries. Ring widths were measured either manually to 0.001 mm using a Velmex stage Quick Check counter and the program MeasureJ2X, or digitally using high-resolution scans uploaded to the computer program CooRecorder 8.1. Ring-width series were visually and statistically cross-dated using standard dendrochronological techniques (Holmes, 1983; Stokes and Smiley, 1996).
We developed two ring-width chronologies from the exhumed forest at the La Perouse Glacier. One is based entirely on Alaska yellow cedar, and the other on western hemlock and Sitka spruce (hereafter “hemlock–spruce”). The individual tree-ring series from the buried forest were cross-dated with previously measured, calendar-dated chronologies from the GOA region (Figure 1; Wiles et al., 2012, 2014) and visually checked for shared marker years using skeleton plots generated by the dplr package in Rstudio (Bunn, 2008).
Cross-dated individual series were combined to develop master, calendar-dated chronologies based on the mean, standardized ring-width of all tree-ring series following detrending using a 32 year high-pass spline filter (Holmes, 1983). Correlations between the newly dated La Perouse cedar and hemlock–spruce chronologies and master chronologies from elsewhere in the GOA region (Wiles et al., 2012, 2014) were calculated using the COFECHA program (Holmes, 1983). We also compared the La Perouse chronologies with a ring-width chronology derived from trees killed by the rising waters of an ice-dammed lake along the margin of the Brady Glacier, 36 km to southeast of the La Perouse exhumed forest (Figure 1; Capps et al., 2011).
Results and Interpretation
Field Observations and 14C Ages
Hundreds of in situ dead trees have been exhumed from kame-terrace gravels over the last decade by an ice-marginal stream adjacent to the retreating margin of the La Perouse Glacier (Figures 1, 2). This exhumed forest is devoid of living plant tissue but exquisitely well-preserved, probably due to its rapid burial by sand and gravel, which then shielded it from the overriding glacial ice. The exhumed forest contains trees that retained bark and delicate branches, tree saplings, and shrubs, many of which are still rooted in moss-covered soils (Figure 2). Forest composition (and basal area percentage) of a 30 × 30 m, representative plot is 53% (60%) Alaska yellow cedar, 46% (39%) western hemlock (cf.), and 1% (1%) Sitka spruce.
The exhumed trees are uniformly bent and sheared off 5–10 m above their root crowns, leaving flags of shattered wood oriented westward in the direction of glacier flow (Figure 2). No adventitious roots were found on hemlock or spruce stems, which can occur in these taxa when they are rooted in a gradually aggrading surface (Zobel and Antos, 1982). This suggests that none of these exhumed trees survived initial burial.
The 14C age on the outermost bark of a western hemlock tree had a 95% calibrated age range of CE 1485–1650 (Table 1). The two 14C ages from the lowermost peat in two different profiles of organic soil horizons had 95% calibrated age ranges of CE 235–385 and CE 1310–1435 (Table 1). The younger date is likely the minimum-limiting age for the penultimate retreat of the La Perouse Glacier, after which the exhumed forest began growth. The older date probably represents an older, inter-stadial soil that was covered in till and is now exposed below the forest soil.
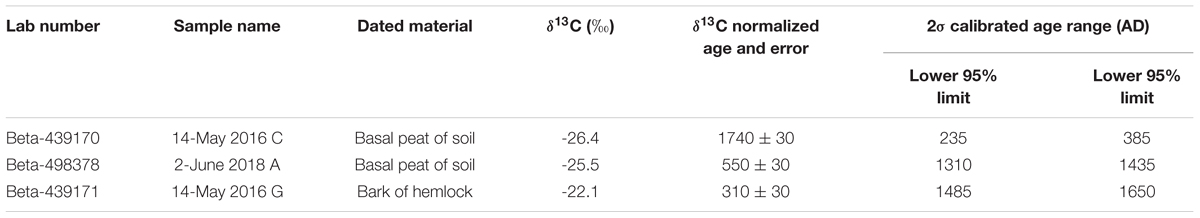
Table 1. Radiocarbon dates reported in the text.
Tree-Ring Analyses
The floating ring-width chronologies from the exhumed forest consist of 49 individual ring-width time series from 30 trees (31 series from 20 hemlock–spruce trees and 18 series from 10 cedar trees) (Figure 3). The inter-series correlations within the cedar and hemlock–spruce chronologies are 0.43 and 0.39, respectively (Figure 3). After shifting the floating cedar chronology in order to obtain peak correlations with the calendar-dated cedar chronologies based on living trees (Wiles et al., 2012, 2014), correlation values are 0.41 for both the 200- and 300-year windows over which the two chronologies overlap. Peak hemlock–spruce correlations between the calendar-dated, living-tree chronology and the floating, exhumed-forest chronology are 0.49 and 0.44 for 200- and 300-year time windows, respectively (Figure 3). After anchoring the floating chronologies to calendar years, the cross-dated chronologies from exhumed trees span the calendar years CE 1451–1866 and CE 1206–1864 for cedar and hemlock–spruce, respectively (Figure 4). The oldest cross-dated hemlock and cedar rings are CE 1206 and CE 1451, respectively, and at least several centuries of post-glacial forest succession is typically required in Southeast Alaska for this forest type to assemble itself (Harris et al., 1974).
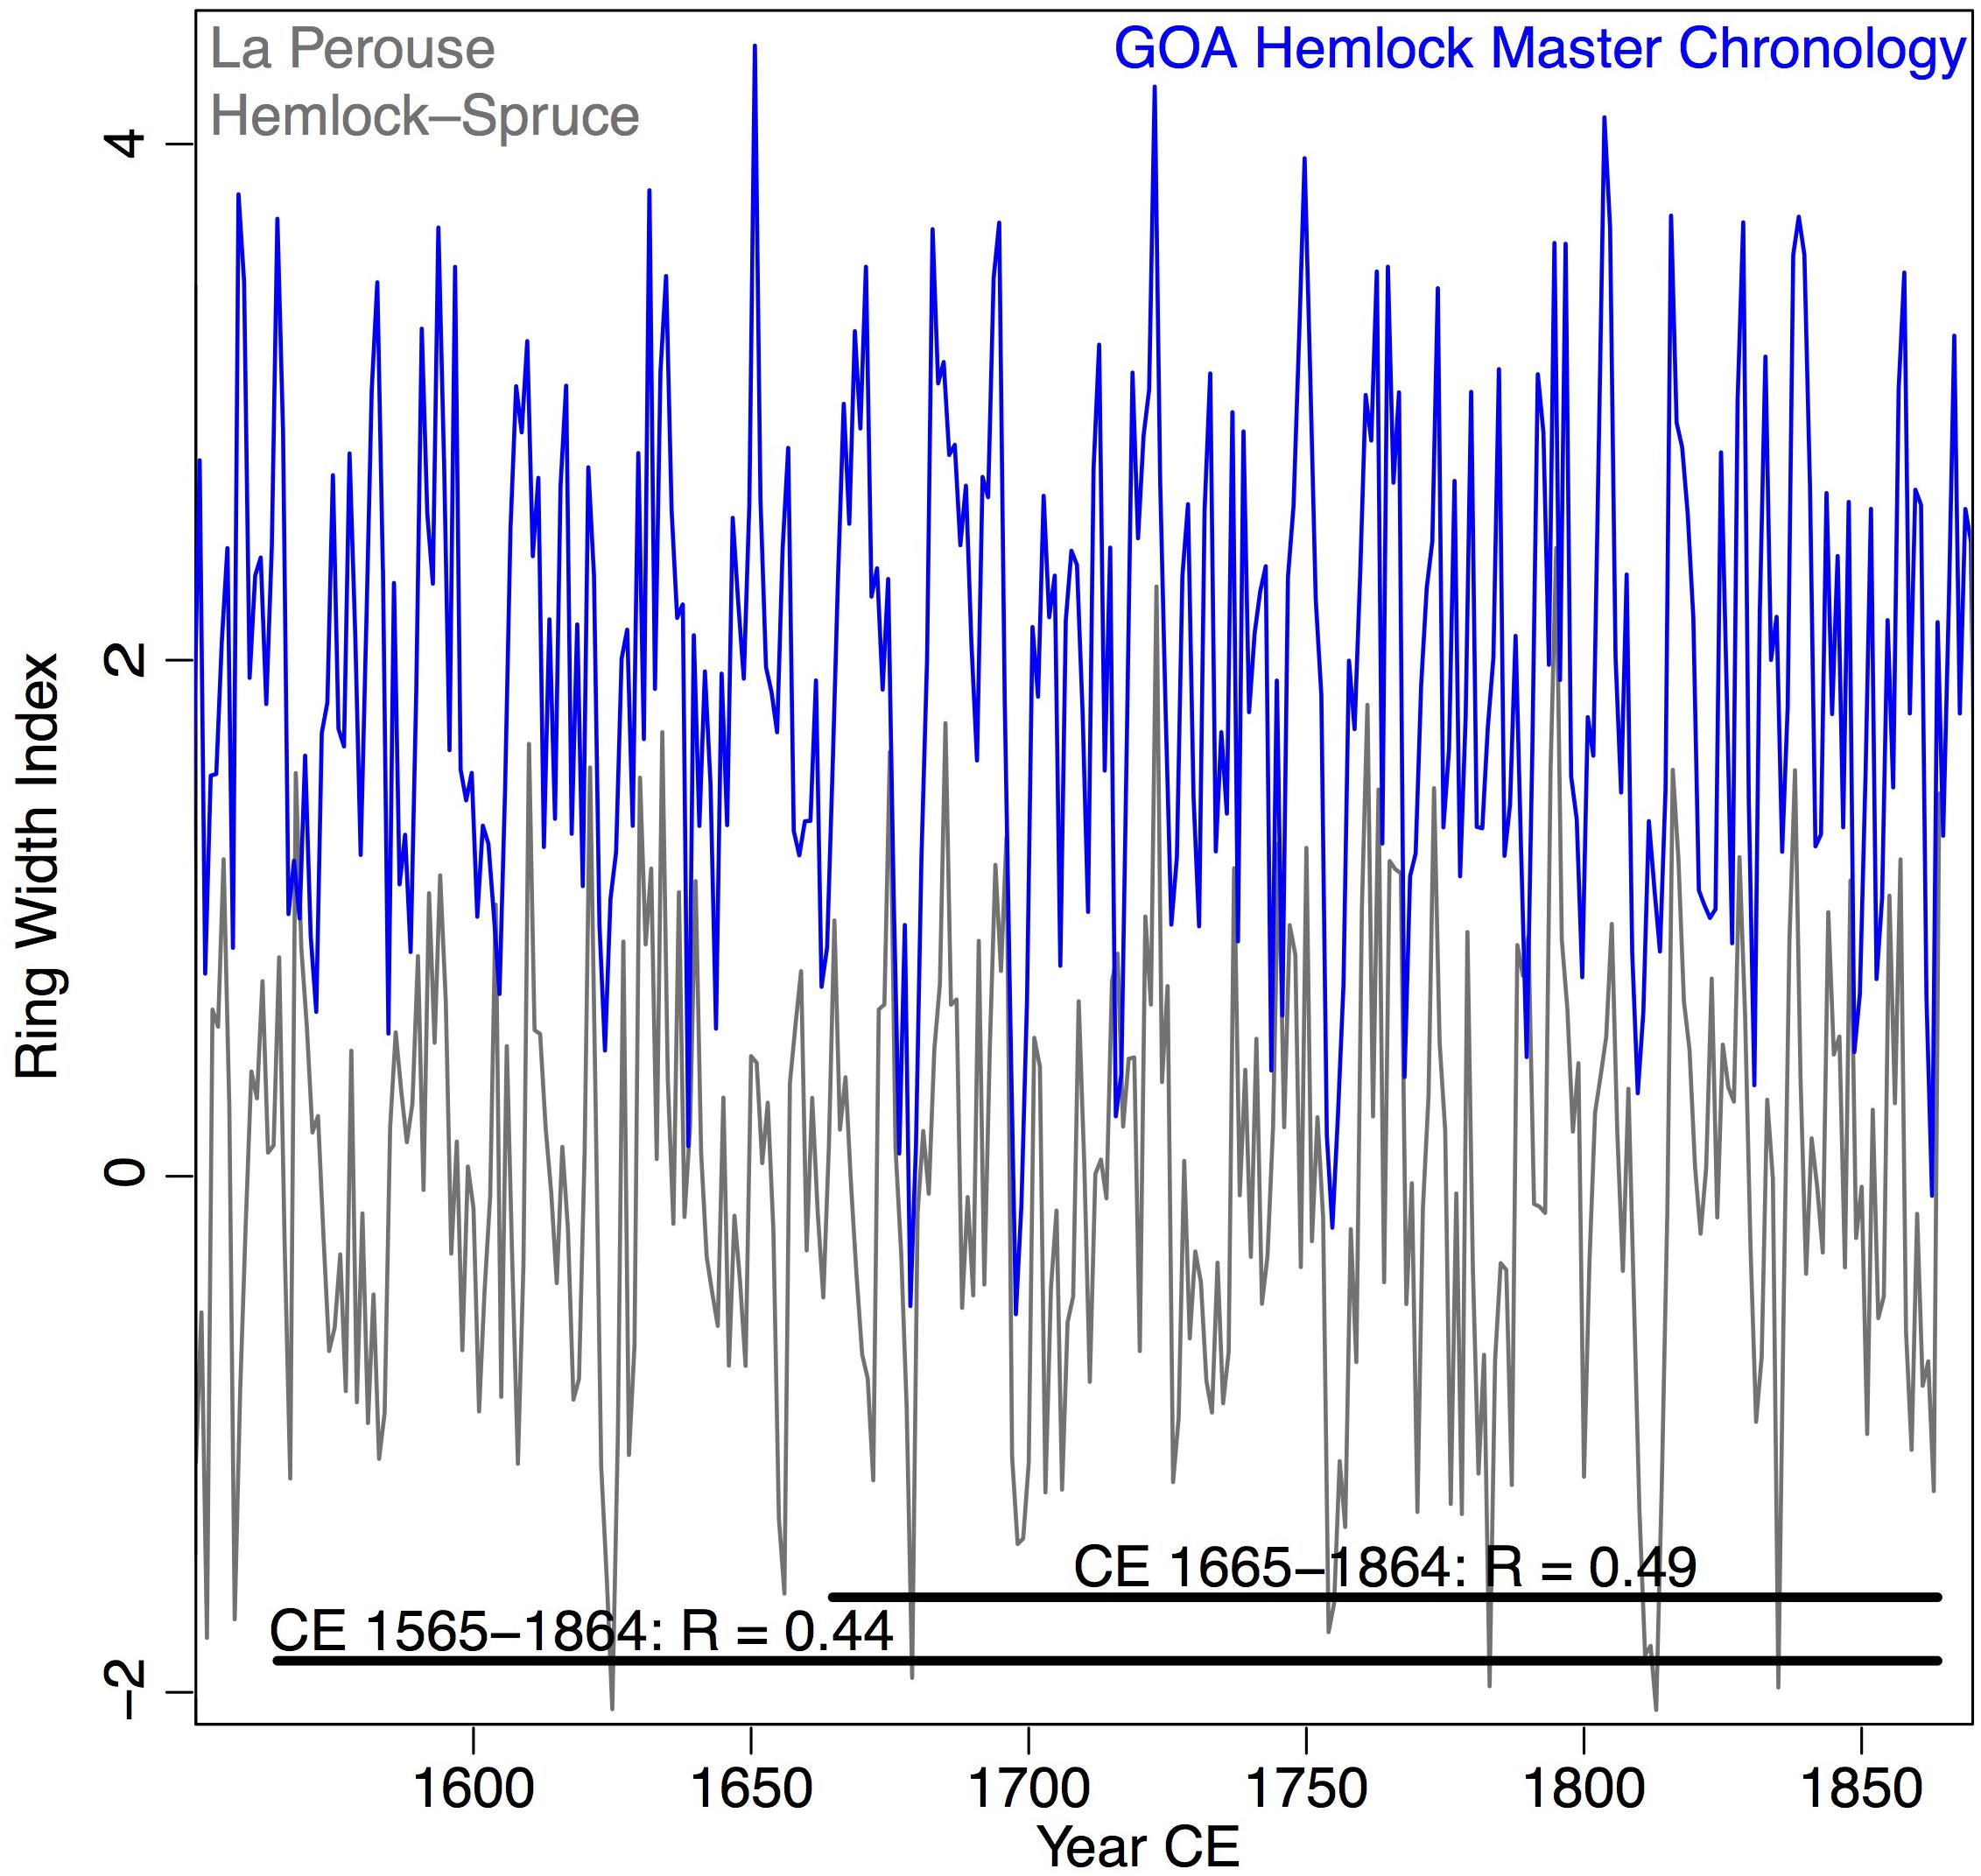
Figure 3. Master ring-width chronology of the La Perouse western hemlock and Sitka spruce trees (gray; bottom) compared with the master chronology of living hemlock and spruce (blue; top) from the Gulf of Alaska region (Wiles et al., 2014; see locations in Figure 1).
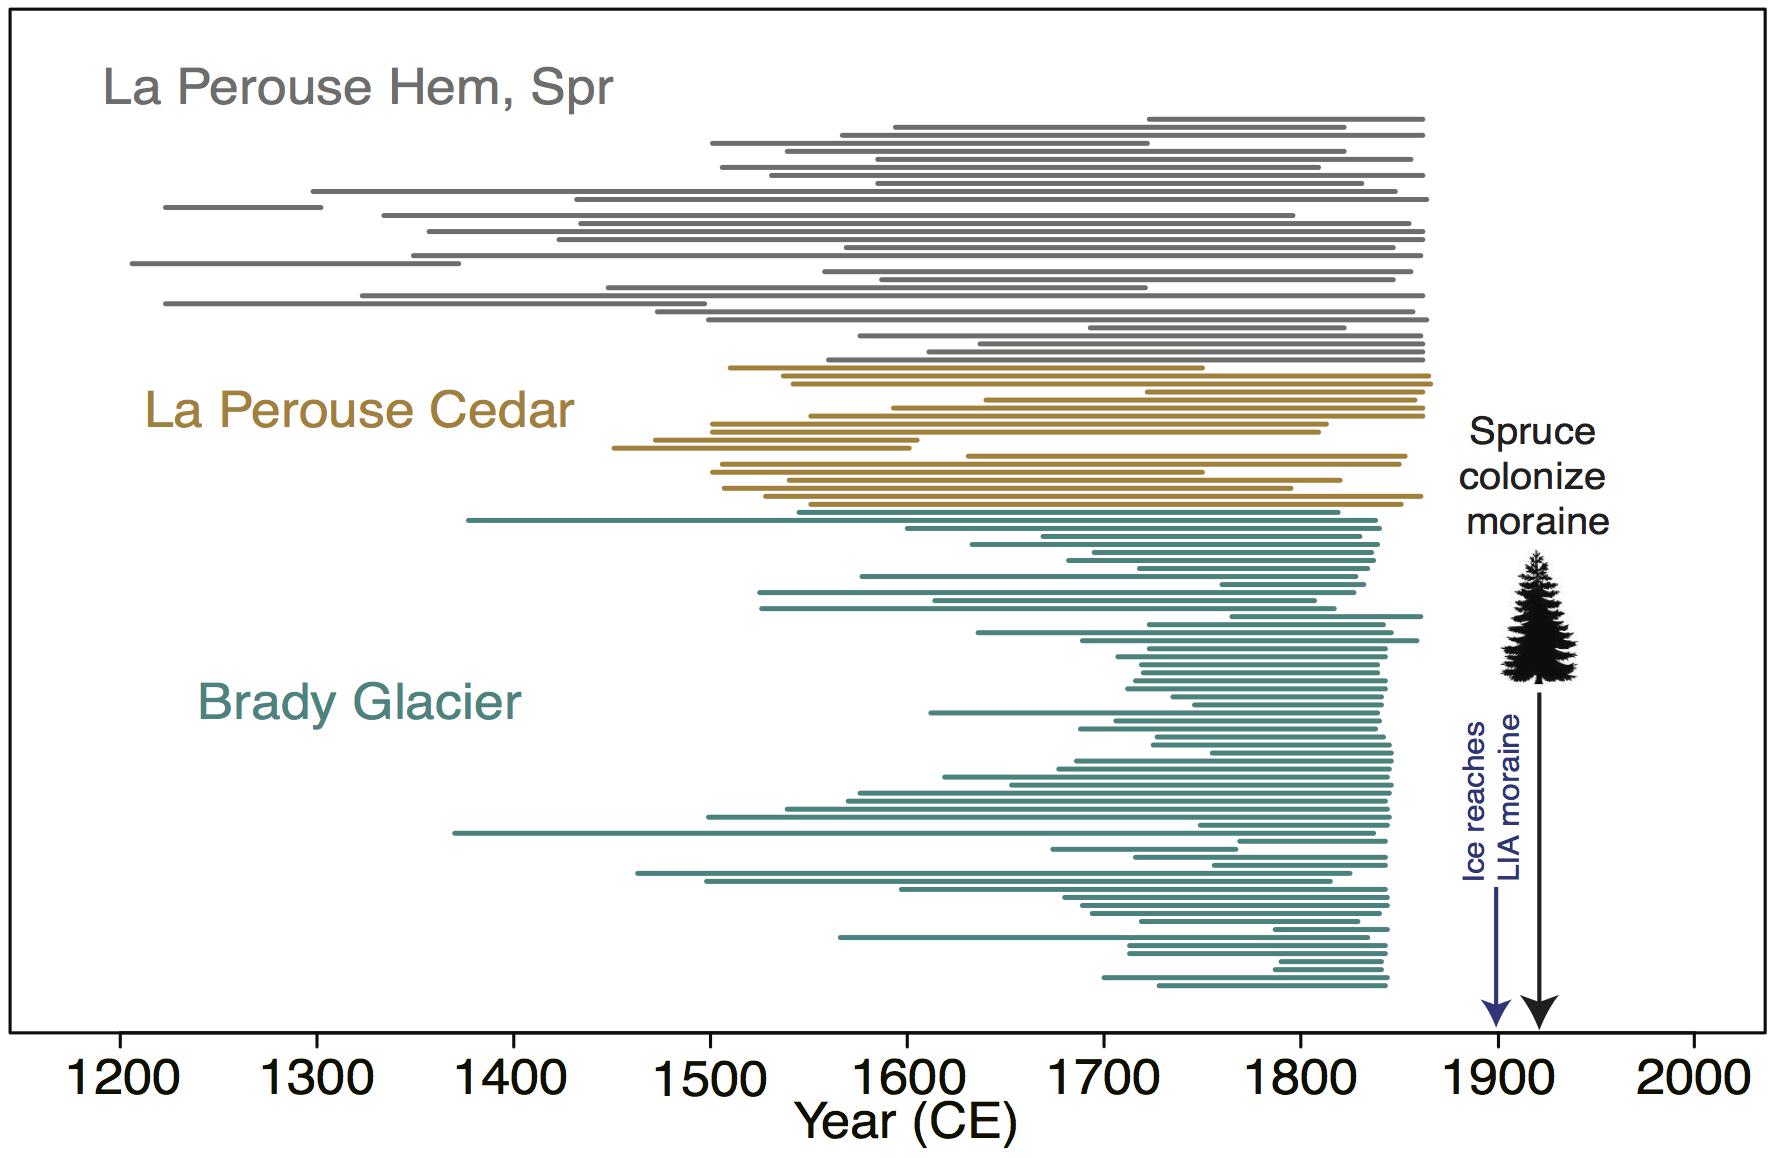
Figure 4. Segment plot of crossdated tree-ring series from the exhumed forest at the La Perouse Glacier and from the nearby Brady Glacier (Figure 1; Capps et al., 2011). The calendar ages of the outer rings correspond to the approach of the La Perouse Glacier and its ice-marginal outwash stream. The trees died after being buried by outwash gravel. Also noted are when the La Perouse Glacier reached its LIA moraine in 1895 as related to the Harriman Expedition by the US Fish Commission (Burroughs and Muir, 1986), and the earliest age of spruce that colonized that moraine indicating glacier retreat.
In summary, the earliest calendar-dated ring (CE 1206) represents the earliest date of forest establishment at this site, and indicates the minimum-limiting age for the penultimate retreat of the La Perouse Glacier, after which the exhumed forest began growth. As indicated by the assigned calendar age on the outermost rings, 20 of the 30 cross-dated trees died when glacial outwash buried them between CE 1850 and 1866 (Figure 4). Earlier outer-ring ages are probably the result of abraded outer rings and/or tree death prior to burial.
Recent History of the La Perouse Glacier
“A landing was made near the west end of the La Perouse ice-wall to examine a forest, part of which had been overwhelmed by an advance of the glacier…” –excerpt of John Muir’s journal from the Harriman Expedition, 1899 (Burroughs and Muir, 1986; Gilbert, 1910).
Accounts by the Harriman expedition in CE 1899 (Gilbert, 1910; Burroughs and Muir, 1986) indicate that the La Perouse Glacier stood at its LIA moraine in 1895 (as relayed to Gilbert by members of the US Fish Commission that visited the site that summer), and had retreated about 100 m by 1899 (Gilbert, 1910). The scientists who visited the La Perouse Glacier terminus in 1899 observed trees near this moraine that had been overrun by the advancing ice about a kilometer south of our sampling location (see John Muir’s quote above). The oldest pith ages we obtained from ten Sitka spruce trees growing on the crest of this LIA moraine date to CE 1922 (Figure 4) (n = 10, pith ages range from CE 1922 to 1937). Establishment of spruce in this recently deglaciated location (i.e., the ecesis age) was likely to take only a few years because spruce seed sources were located adjacent to the moraine. In support of this inference, we have observed spruce seedlings colonizing the La Perouse foreland gravels in areas that were glaciated 5–10 years prior. Several, rapid glacier fluctuations have occurred since 1899, including short-lived re-advances around CE 1910 (Tarr and Martin, 1914) and CE 1949 (Seitz, 1953), but the glacier has mostly been in retreat for the last several decades.
In summary, after being in a retracted state (relative to its 2016 position) since at least CE 1206, based on the cross-dated tree-ring chronology, the La Perouse Glacier was advancing to near its 2016 position between 1850 and 1866 (based on the outer rings of most trees sampled from the buried forest). The glacier reached its LIA maximum position ca. CE 1895, had retreated by 1899, and then had re-advanced to near its LIA moraine in CE 1910. Sometime between CE 1910 and 1922 (based on pith ages of spruce colonizing the LIA moraine), the glacier began a major retreat, and subsequent fluctuations never caused the ice margin to reach the LIA moraine again (Table 1 and Figure 4).
A Brief Review of the Chronology of LIA Glaciation Along the GOA Coastline Between Icy Bay and Icy Strait
Paleoclimate Relevance of La Perouse Glacier
Our dendrochronology-based limiting ages on the advances and retreats of the La Perouse Glacier add new data to the regional LIA glacier record from the northeastern GOA (Wiles et al., 2008). But what do these glacier fluctuations signify in terms of paleoclimate? It is possible that these recent fluctuations of the La Perouse Glacier were driven by internal glacier dynamics rather than climate (Van der Veen, 2013). For example, if the glacier had retreated up its fjord to a point where it terminated on land, a subsequent advance could have occurred regardless of climate. Such “compensatory re-advances” occur when calving ablation ceases after a fjord glacier retreats onto land (Mann, 1986). In the aftermath of a catastrophic calving retreat, this situation can result in extremely positive mass balance, which can then cause the terminus to advance, provided a terminal moraine shoal is accumulating in front of the glacier to protect it from iceberg calving (Mann, 1986; Post et al., 2011). A non-climatically driven scenario like this is the null hypothesis when seeking linkages between climate and the fluctuations of glaciers like La Perouse that at times had calving fronts.
One way to test for climate’s role in controlling the LIA fluctuations of the La Perouse Glacier is to compare its history to that of nearby glaciers, including some that began the 1800s at different stages in their calving-glacier cycles, and also to nearby land-terminating glaciers. Finding synchronized glacier advances throughout the GOA region in the 1800s would indicate these changes were indeed climatically driven. Because we are surveying the behavior of different glaciers on the century scale (1790–1900), the variability of glacier response times on shorter time scales should have relatively minor effects for these high-throughput and relatively small glaciers whose response times to climate are on the order of several decades (Oerlemans and Fortuin, 1992). Below we review historical observations and tree-ring dating that constrain the fluctuations of other glaciers draining the St. Elias Mountains during the time when the La Perouse Glacier was advancing to its LIA maximum position.
Icy Bay
The most recent and extensive LIA advance in Icy Bay was underway in the CE 1640s, and had filled most of the inner bay up to Kichyatt Point by the time Vancouver and Malaspina arrived in the CE 1790s (“KP” in Figure 5a; Barclay et al., 2006). By CE 1837 when Edward Belcher visited the area (Belcher, 1843; Davidson, 1904), the outer portion of Icy Bay was largely filled by glacier ice. Corroborating the oral tradition of local Native people (Topham, 1889), Barclay et al. (2006) suggest this ∼50 years advance was one of the fastest ice expansions ever recorded for a tidewater glacier, and that it was probably assisted by shallow shoals in outer Icy Bay that reduced ablation from the glacier’s iceberg-calving terminus. Belcher (1843) describes the Icy Bay glacier terminus in CE 1837 as a 9-m-high ice cliff located near the present mouth of the bay. Between CE 1837 and 1886, the glacier advanced even further seaward, covering Point Riou (“PR” in Figure 5a) and forming a piedmont lobe that calved into the open sea (Barclay et al., 2006). Several minor retreats occurred within this period, and the glacier filling Icy Bay probably reached its maximum extent sometime between CE 1886 and 1904 (Post and Plfaker, unpublished). Recession from the late LIA maximum began between CE 1904 and 1910 (Tarr and Martin, 1914) and has continued with great rapidity up to the present day (Figure 5a).
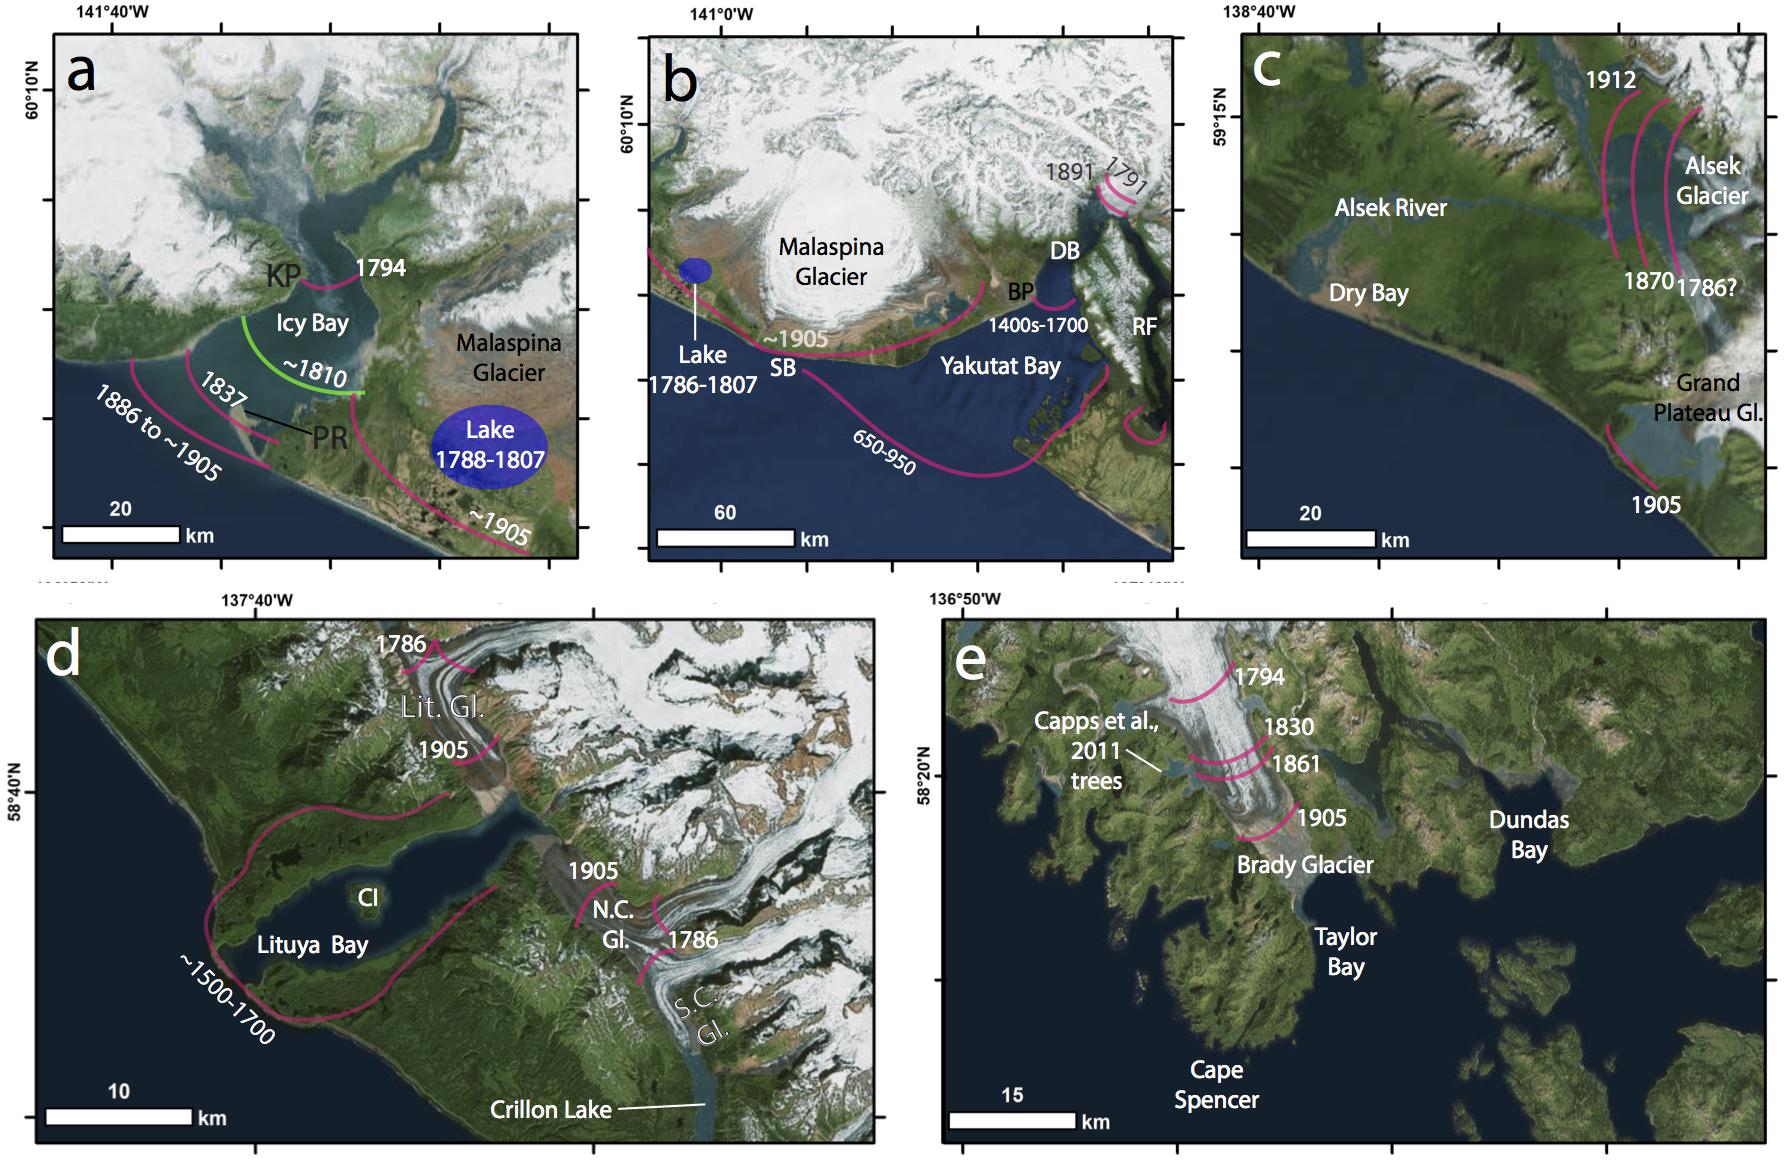
Figure 5. Maps of individual bays and glaciers discussed in the text showing LIA termini positions). (a) Icy Bay: Kichyatt Point (KP), Point Riou (PR). (b) Malaspina Glacier: Yakutat Bay, Disenchantment Bay (DB), Russel Fjord (RF), Blizhni Point (BP). (c) Dry Bay, Alsek River mouth, and Grand Plateau Glacier. (d) Lituya Bay: Cenotaph Island (CI), Lituya Glacier (Lit. Gl.), North Crillon Glacier (N.C. Gl.), and South Crillon Glacier (S.C. Gl.), Crillon Lake. (e) Cape Spencer region: Brady Glacier, Dundas Bay. Glacier Bay is located immediately to the east of this map.
Malaspina Glacier
This glacier is now near its maximum Holocene extent, which means that most evidences of its former fluctuations are concealed beneath it (Though see next section). In general, the Malaspina Glacier (Figures 5a,b) has maintained this extended position since at least CE 1786 when first seen by the La Perouse expedition (La Pérouse, 1994). Minor advances and retreats have occurred within the historical period (Topham, 1889; Russell, 1893; Tarr and Martin, 1914). For example, Tebenkov (1850) compiled maps of the coastline bordering the Malaspina Glacier based on the reports and charts of Russian explorers who visited the area between 1788 and 1807. Even though the Malaspina ice front was generally described as being near where it is today, these early maps show a forested foreland and a ∼60 km2 lake on the southwest side of the glacier terminus just east of Icy Bay (Figures 5a,b). Maps drawn by the Boundary Commission in 1905 indicate the Malaspina’s ice margin advanced over the site of this lake sometime between 1807 and 1912. Consistent with this is the suggestion by Post and Plafker (unpublished) that an advance of 5–10 km occurred in the vicinity of Sitkagi Bluffs (“SB” in Figure 5b) sometime between 1794 and the present. In summary, after reaching its current extended position sometime prior to 1786, the Malaspina Glacier has experienced a series of minor advances and retreats with a significant advance at least along a portion of its wide perimeter during the 1800s.
Glacier Systems in Yakutat Bay, Disenchantment Bay, and Russell Fjord
Conifer trees buried by outwash and till near the mouth of Disenchantment Bay (“DB” in Figure 5b) suggest the most recent advance of the Hubbard Glacier was underway prior to ca. CE 250 (Barclay et al., 2001). This advance – probably representing coeval advances by both the Malaspina and Hubbard Glaciers – reached its maximum extent at the mouth of Yakutat Bay (Figure 5b), where its calving terminus deposited an arcuate shoal across the fjord mouth. Though fluctuations in position undoubtedly occurred over the intervening time span, the Hubbard/Malaspina Glacier terminated near the mouth of Yakutat Bay between CE 650 and 950 based on a 14C date of 830 ± 160 years before present on detrital wood from the terminal moraine (Plafker and Miller, 1957).
Retreat from this most recent LIA maximum was underway by CE 1300, based on the age of a tree growing in outer Yakutat Bay and the 14C ages of basal organics in kettle ponds there (Barclay et al., 2001), as well as the ca. 700 years old spruce trees growing on outwash trains associated with the LIA moraine near the village of Yakutat (Post and Plafker, unpublished; Barclay et al., 2001). Tree ages further up Yakutat Bay indicate that by CE 1460 the Hubbard Glacier had retreated some 40 km (Barclay et al., 2001). Archeological sites in outer Yakutat Bay date between CE 1040 and 1640 and are consistent with this area being deglaciated during this period (Crowell, 2018, written communication). A prominent but un-dated submarine moraine off Blizhni Point 40 km up-fjord from the mouth of Yakutat Bay may record a readvance of the Hubbard Glacier occurring sometime between CE 1400 and the early 1700s (“BP” in Figure 5b). By CE 1791 when it was observed by Malaspina, the Hubbard Glacier had retreated into inner Disenchantment Bay (Tarr and Martin, 1914) and was probably less extensive than it was when Russell charted the Bay in 1891 (Figure 5b; Barclay et al., 2001). Since at least CE 1891 (Russell, 1893), the Hubbard Glacier has been engaged in a fluctuating advance, which given this glacier’s highly positive mass balance, probably represents the compensatory readvance of a calving-glacier cycle (Post and Motyka, 1995). Both Post and Plafker (unpublished) and Barclay et al. (2001) recognized that the Hubbard Glacier has been caught up in a calving-glacier cycle and that its recent fluctuations are largely decoupled from climate.
In contrast to Yakutat Bay, the glacier occupying Russell Fjord (“RF” Figure 5b) began a slow advance perhaps as early as 3000 calibrated 14C years before present (cal yr BP), reached its late-LIA maximum in the early CE 1600s, and remained in an advanced position until beginning to retreat sometime before CE 1752, which is several centuries after the calving retreat of the Hubbard Glacier into upper Disenchantment Bay (Barclay et al., 2001). The Russell Fjord Glacier was more protected from iceberg calving than the Hubbard Glacier, so its fluctuations have probably been driven mainly by climate (Barclay et al., 2001).
Dry Bay – Alsek Glacier
La Perouse sailed past Dry Bay (Figures 1, 5c) in the summer of CE 1786 (La Pérouse, 1994), but the currents at the mouth of Dry Bay were too swift to allow entry. No glaciers were sighted by his expedition in the upper reaches of Dry Bay (the lower Alsek River valley), even though his cartographers were acutely observant about noting glacier positions. They did record the presence of a large lake in Dry Bay that has since filled with alluvium (US Boundary Commission, 1905). Edward Glace, the first known European to descend the Alsek River in CE 1870, observed the terminus of the Alsek glacier advancing from a side valley 20 km upstream from the coast (Davidson, 1904). This glacier was probably missed by La Perouse because it was in a retracted position when he was there a century earlier. It seems likely that the Alsek Glacier made a significant, land-terminating advance between La Perouse’s visit in CE 1786 and 1870, when it was sighted by Glace.
Grand Plateau Glacier and Fairweather Glacier
Located 30 km southeast of Dry Bay, the Grand Plateau Glacier is partly confluent with glaciers flowing into the head of Dry Bay (Figure 5c). In maps made by the Boundary Commission Survey in CE 1905 (US Boundary Commission, 1905), this glacier terminates along a prominent moraine bordering the present coastline, and today a large lake occupies the former lower reaches of the glacier. It is likely that the Grand Plateau Glacier was advancing during the 19th century. This is because it was not noted by 18th century explorers, but was mapped as being near the coast at its LIA max position by the Boundary Commission in CE 1905.
Like the Grand Plateau Glacier, the Fairweather Glacier (not shown) is now separated from the open sea by a massive terminal moraine probably constructed during multiple Holocene advances that repeatedly halted at the coast because of rapidly increasing ablation in the open sea. Both Vancouver’s map made in CE 1794 (Vancouver, 1799) and the Geodetic Survey’s map made in CE 1900 (Davidson, 1904) show a large lake within the terminal moraine of Fairweather Glacier. The presence of this lake in CE 1794 suggests the LIA maximum extent of this glacier was reached sometime before that date. This lake has increased slightly in size over the past several decades. This trend, along with an accumulation area ratio indicating it is roughly in equilibrium with present climate (Mann, 1986), suggest that the Fairweather Glacier is currently retreating in response to recent climate warming.
The Lituya Bay Glacier System
During the LIA, Lituya Bay was filled by a glacier that terminated along a massive, composite moraine bordering the open GOA (Figure 5d). This most recent advance began ca. CE 500 and culminated sometime between CE 1500 and 1700 (Mann and Ugolini, 1985). La Perouse’s cartographers made a detailed survey of the glaciers draining into Lituya Bay during the expedition’s ill-fated visit in July of CE 1786 when 12 men drowned after a dory capsized in rough seas in the outer portion of the Bay (La Pérouse, 1994; an event later commemorated with the naming of Cenotaph Island; “CI” in Figure 5d). The La Perouse map shows that the two glaciers now flowing into the head of the bay had retracted far enough to separate into four separate termini, all of which terminated on land. Between CE 1786 and ca. 1905 (Figure 5d), these four glaciers re-advanced ∼5 km and coalesced. Their advances continue today at slow rates seemingly dependent on construction of moraine shoals in deep water at the fjord head. The accumulation-area ratios of the present glaciers suggest they are now far out of equilibrium with climate and are engaged in the compensatory re-advance limbs of calving glacier cycles (Mann, 1986). Because the North Crillon Glacier (“N.C. Gl.” In Figure 5d) in the south arm of Lituya Bay was advancing during the 19th century, it is likely that its southern lobe (South Crillon Glacier; “S.C. Gl.” in Figure 5d) was advancing into Crillon Lake at the same time (Figure 5d).
La Perouse Glacier and Finger Glacier
In support of our tree-ring dates from La Perouse Glacier, Tebenkov’s charts do not show the termini of either the La Perouse (Figure 1) or Finger Glacier (just southeast of La Perouse Glacier; not shown) near the coast in the late 18th and early 19th centuries (Tebenkov, 1850; Davidson, 1904). However, this assumes that every visible glacier was recorded on these charts. We now know the La Perouse Glacier, which advanced over the exhumed forest between 1850 and 1866, was encountered by the US Fish Commission group in 1895 at its LIA max position, and then observed by John Muir and John Burroughs within ∼100 m of its 1895 terminus in 1899. Similarly, Finger Glacier was not noticed by any 18th century explorers, but was observed by the US Boundary Commission at its LIA max moraine near the present coastline in 1905. Like the La Perouse Glacier, the Finger Glacier probably reached its LIA maximum in the late 1800s.
Brady Glacier and Taylor Bay
“Some of the Taylor Bay and Prince William Sound forests have been destroyed in the same way [as those at the La Perouse Glacier]. Whether simultaneously or not, I am unable to say.” –John Muir in 1899, describing the forests being overtaken by the La Perouse Glacier (Burroughs and Muir, 1986).
Vancouver visited Cross Sound in CE 1794, and his cartographers recorded the position of the Brady Glacier’s terminus, which they estimated was ∼24 km north of Cape Spencer, putting its terminus ∼8 km further up Taylor Bay than it is today (Davidson, 1904). On the Boundary Commission maps drawn ca. 1905, the Brady Glacier is estimated to have been ∼17 km north of Cape Spencer, which indicates that the glacier advanced ∼7 km during the 19th century. These historical observations are consistent with the tree-ring dating of lake-level rise in an ice-marginal lake basin that is adjacent to the Brady Glacier (Figures 1, 4, 5e) where Capps et al. (2011) estimate the Brady Glacier advanced several kilometers between 1830 and 1860. To answer John Muir’s question above, the advance at Brady Glacier probably occurred at the same time the La Perouse Glacier was advancing in the mid- to late-19th century (Figure 4).
Glacier Bay
The LIA chronology of Glacier Bay is the best known of any glacier system in the region (Mann and Streveler, 2008; Connor et al., 2009). The maximum LIA advance of the Glacier Bay Glacier began ca. CE 300 (Goodwin, 1988). The glacier’s rate of advance down the bay was probably constrained by the slow accumulation of the massive moraine shoal required to anchor its terminus in the face of tidewater calving. By CE 1500, the terminus lay in the middle reaches of Glacier Bay, and by CE 1750 it had reached its maximum extent protruding into Icy Strait. In this position, the terminus and its moraine shoal were exposed to strong tidal currents and heavy wave attack, which may have triggered a retreat off the terminal moraine shoal shortly before Vancouver’s expedition observed the terminus in CE 1794 (Lamb, 2017). By that year, the terminus had retreated some 15 km behind its LIA limit, and a rapid retreat ensued by ca. 1800 that caused a catastrophic calving retreat of 120 km in less than 160 years (McKenzie and Goldthwait, 1971; Larsen et al., 2005).
Synthesis
Widespread advances of coastal glaciers occurred along the northeastern coastline of the GOA during the 19th century. Between CE 1790 and 1900, eight of the 12 glacier systems discussed here were either expanding toward their LIA maximum positions or were already there and maintaining those positions (Icy Bay glacier system, Malaspina, Dry Bay–Alsek glacier system, Grand Plateau Glacier, Lituya Bay glacier system, La Perouse Glacier, Finger Glacier, and Brady Glacier). Since CE 1900, the Icy Bay glacier system and the La Perouse Glacier have retreated – radically in the case of the calving Icy Bay glacier system, and modestly in the case of the land-terminating La Perouse Glacier. Three glaciers experienced rapid calving retreats back to their fjord heads prior to CE 1780 (Hubbard Glacier after CE 1300; the Lituya Bay glacier system after CE 1500; and the Glacier Bay system after CE 1760). The geometry and bathymetry of these three fjords, their exposure to tidewater, and their present strongly positive mass balances suggest their recent dynamics have been dominated by calving glacier cycles, which has reduced the influence of climate on their advances and retreats. Overall, the 19th century seems to have been a time of widespread positive mass balance for those coastal glaciers not caught within calving glacier cycles.
Glacier advances during the 19th century were also widespread among non-tidewater glaciers in the GOA region (Figure 6). In a survey of 75 of the most recent LIA moraines in the mountains of coastal Alaska, around 60% were being built between CE 1775 and 1900, many of which represent their maximum positions for the LIA and Holocene (Wiles et al., 2004, 2008). This broad synchronicity between land-terminating and tidewater glaciers suggests that climate, rather than idiosyncratic glaciological factors relating to the calving glacier cycle, was the probably the main driver of 19th-century glacier advances along the northeastern GOA.
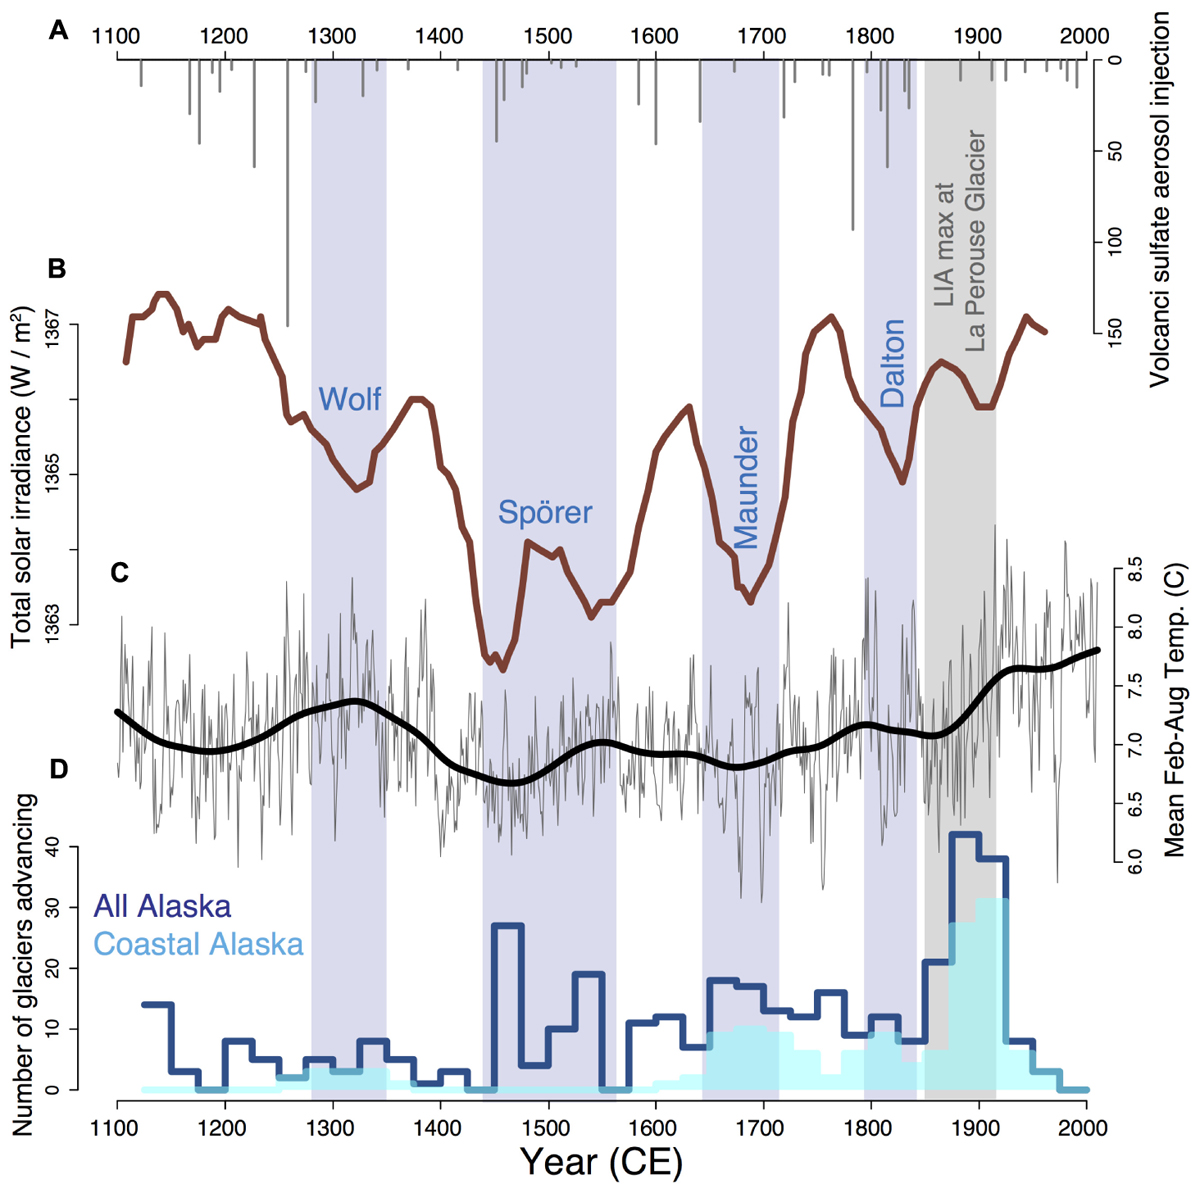
Figure 6. Climate forcing agents, and regional paleoclimate records in the Gulf of Alaska region during the Little Ice Age (LIA). (a) Volcanic forcing (Gao et al., 2008). (b) Solar activity with solar minima labeled (Bard et al., 2000). (c) Reconstructed mean February to August temperature (Wiles et al., 2014). (d) LIA glacier moraine record for all of Alaska (dark blue) and south-coastal Alaska (turquoise) (Wiles et al., 2004) including the La Perouse Glacier’s maximum advance highlighted in gray. Note that most of the Coastal Alaska glaciers advanced shortly after the Dalton Minimum, which was relatively minor in terms of solar forcing and summertime cooling.
Discussion
The Timing of the Little Ice Age in Coastal Alaska Compared to Other Regions
The 19th-century maximum LIA advance of the La Perouse Glacier is similar to that of other glaciers in the northeastern Pacific region (Wiles et al., 2004, 2008), but differs markedly from LIA glacier records from the Alps, Scandanavia, Iceland, and Greenland (Solomina et al., 2016). In these North Atlantic regions, most glaciers reached maximum LIA extents earlier during the LIA and either re-advanced or remained in advanced positions until ca. CE 1850 (Grove, 2001). More similar to the GOA record are those from the western interior region of Canada and from the Pacific Northwest, where most glaciers reached their LIA maxima in the early 18th century, and several others reached their LIA maxima in the mid-19th century (Burbank, 1981; Heikkinen, 1984; Luckman, 1993; Luckman, 2000; Larocque and Smith, 2003; Lewis and Smith, 2004; Allen and Smith, 2007; Jackson et al., 2008; Menounos et al., 2009; Koch et al., 2011; Koehler and Smith, 2011; Coulthard et al., 2013). These differing geographic patterns suggest that the global causes of the LIA were strongly modified by idiosyncrasies involving glaciological responses to regional climate processes.
Possible Climatic Causes of 19th-Century Glacier Advances in the GOA Region
Although the GOA glacier record involves both calving and non-calving glaciers, the fact they are relatively small, warm-based glaciers with large mass balances suggests their lag times in response to climate are on the time scale of several decades (Bahr et al., 1998). Thus we can use regional climate records from the period CE 1790 to 1900 to infer the identity of climate drivers of glacier fluctuations during this same period. Summer cooling caused by the combination of Milankovitch forcing and solar minima associated with the De Vries Cycle have been important drivers of the LIA glacier record in Alaska (Wiles et al., 2004, 2008). Thus three periods of increased glacier activity in Alaska followed the Spörer, Maunder, and Dalton Minima (Figure 6). Glaciers in the hypermaritime region of coastal Alaska may be particularly sensitive to solar-affected air temperatures because of the effects that temperature has on both the length and the warmth of the ablation season within the relatively mild climate in this maritime setting (Oerlemans and Fortuin, 1992; Oerlemans, 2005).
Despite the general pattern of glaciers advancing in response to the cooling caused by orbital forcing and solar minima, it remains unresolved why the frequency and extent of LIA glacier advances along the GOA coastline do not correspond with the length and intensity of solar minima. For example, the most prominent, and, in many cases, the most extensive LIA glacier advances occurred during the 19th century (Wiles et al., 2008), even though these advances were preceded by the shortest and least intense solar minima of the entire LIA (the Dalton Minimum, CE 1790–1840) (Figure 6). Although the Dalton Minimum was relatively cool based on the tree-ring-based reconstruction of February-August air temperatures (Figure 6; Wiles et al., 2014), it seems unlikely that the climate during this 50-year period alone could have caused widespread glacier advances that surpassed previous LIA advances and, in many cases, persisted into the 1920s (Figure 6; Wiles et al., 2004). Overall, the period from CE 1790 to 1900 in the GOA did not see exceptionally cold Feb-Aug temperatures compared to the rest of the LIA (Figure 7). Furthermore, the 19th century advances of the La Perouse Glacier and other glaciers in the region followed a slight multi-century warming trend in mean Feb-Aug temperatures that began ca. CE 1750 (Figure 6). It therefore seems unlikely that cooler summer temperatures alone account for the relatively late LIA advances that dominate the glacier record along the northeastern GOA coastline.
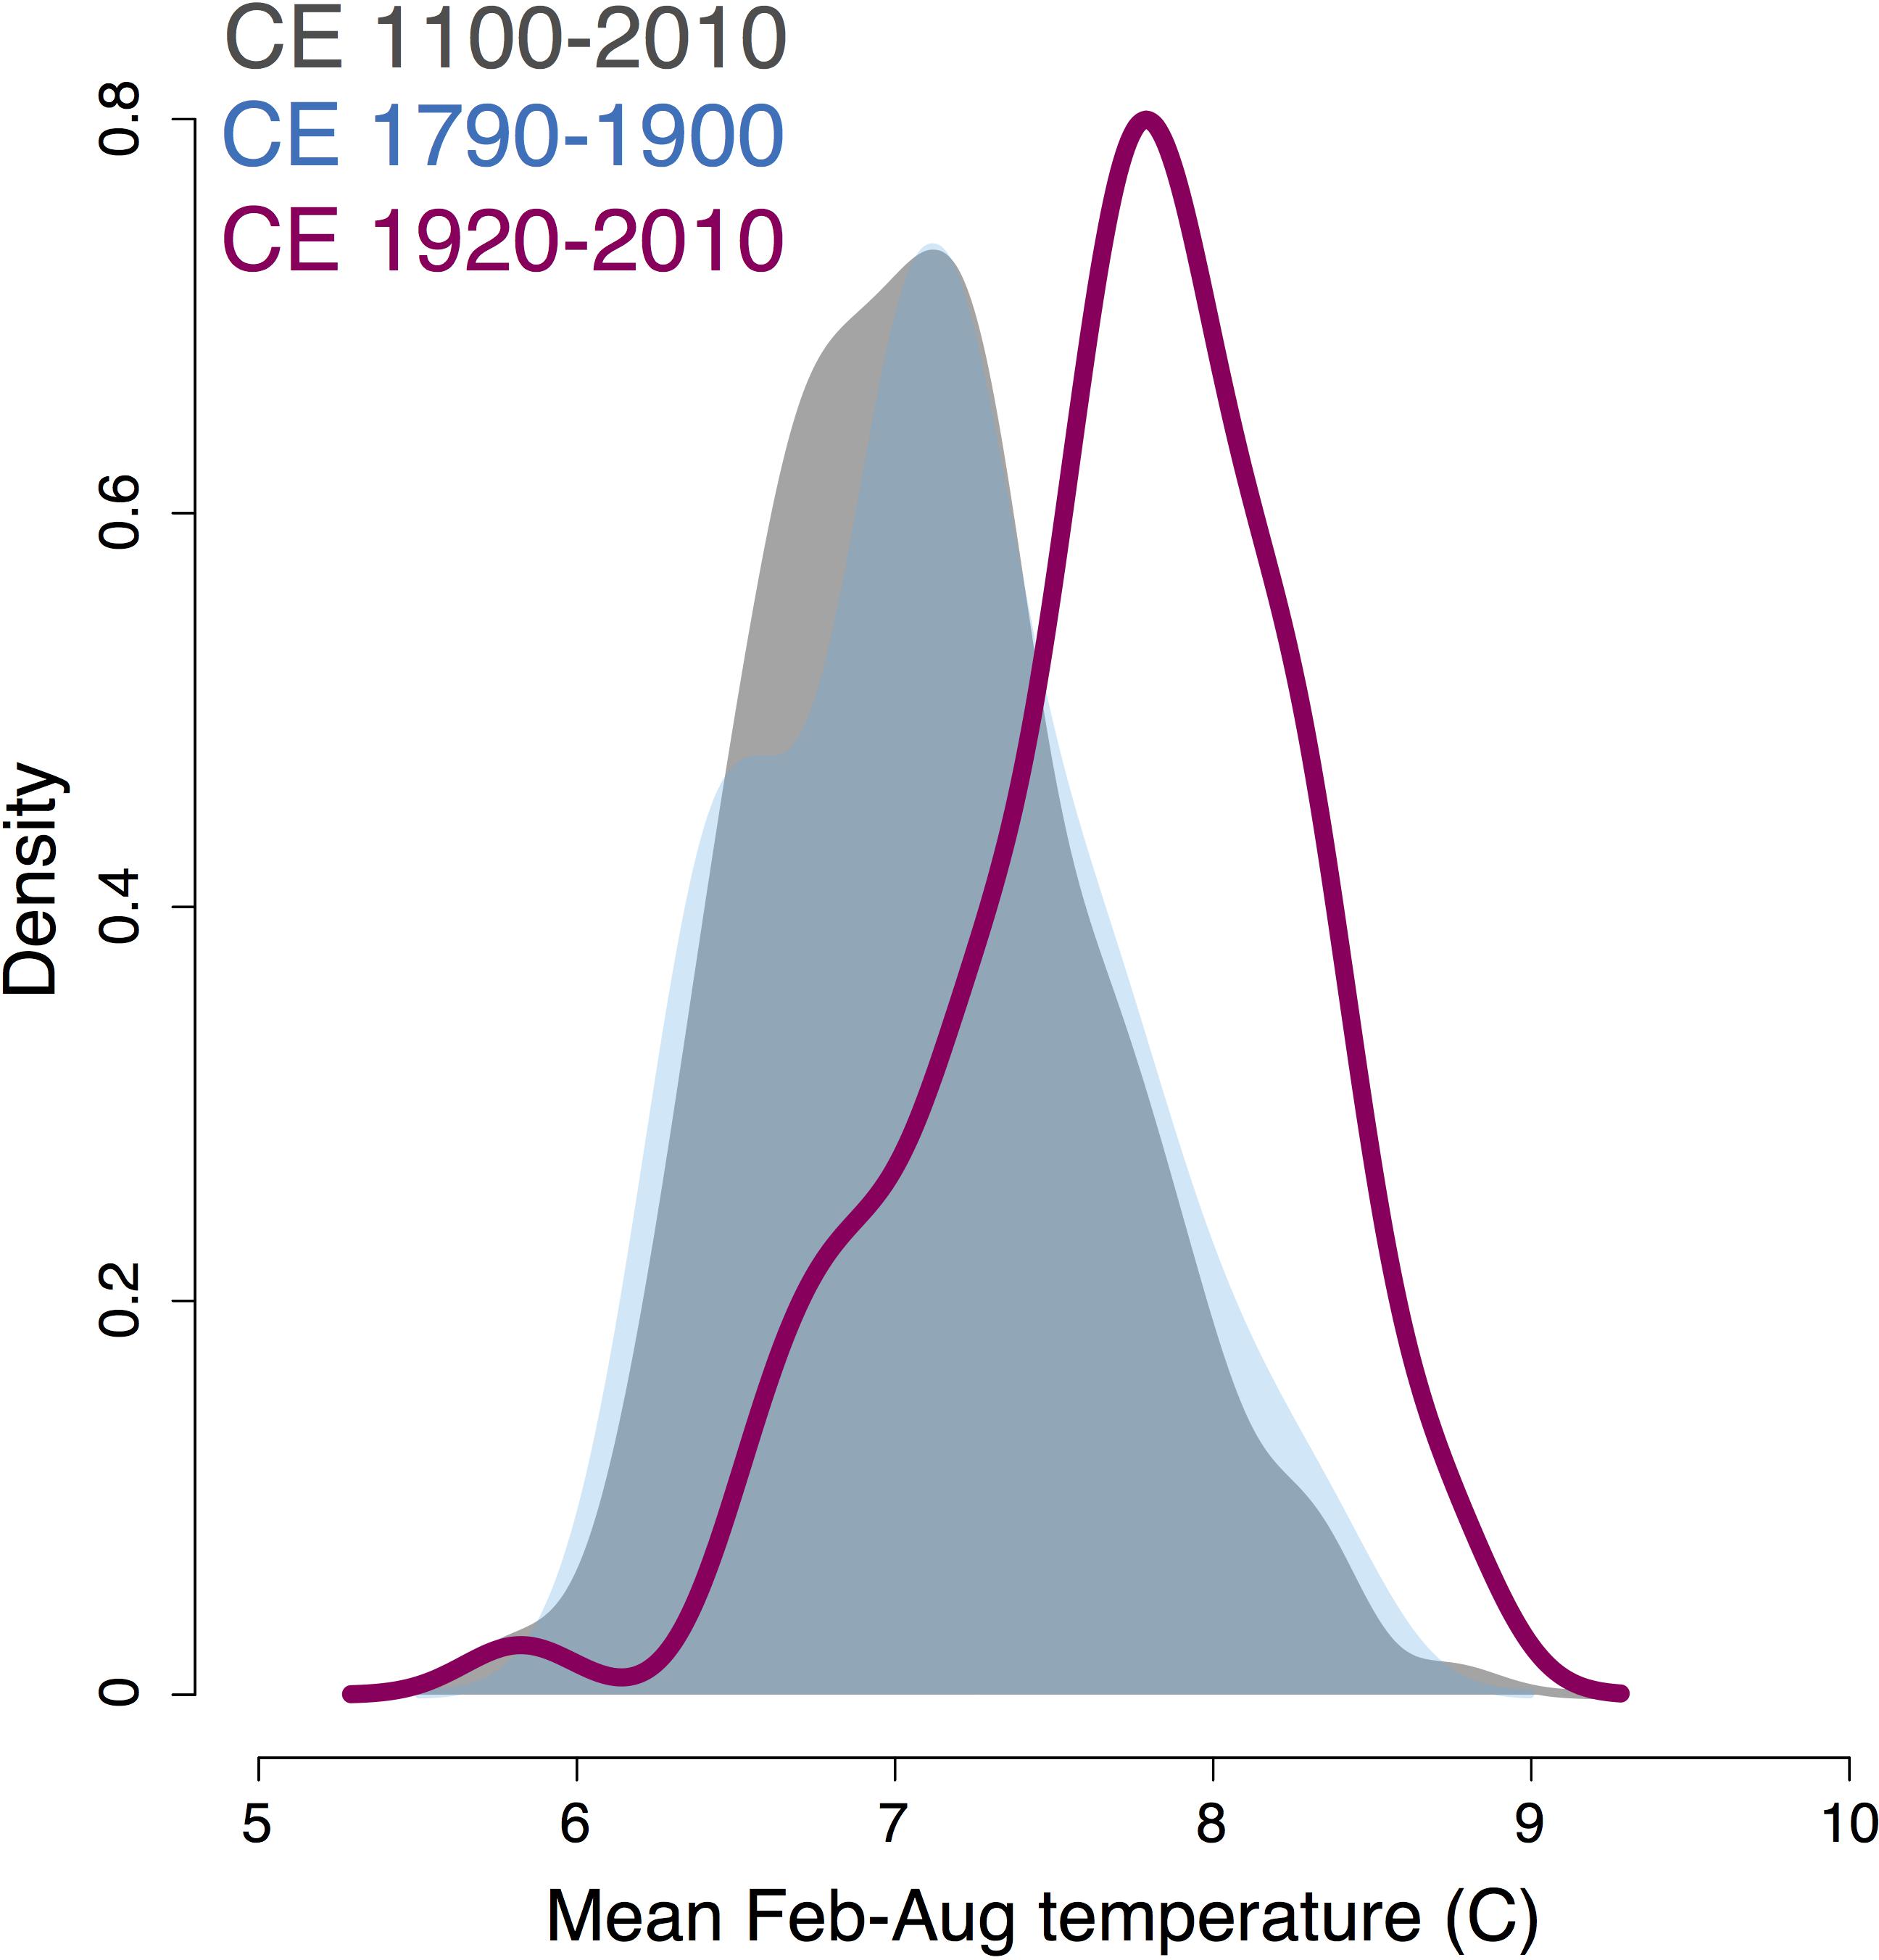
Figure 7. Distribution of mean February to August temperatures based on tree-ring-width reconstructions (Wiles et al., 2014) for all years from CE 1100 to 2010, years when most coastal glaciers were advancing (CE 1790–1900), and years when most coastal glaciers were retreating (1920–2010). These data suggest that warm summers caused widespread glacier retreat after 1920, however, February to August temperatures are not exceptionally cold during the widespread advance observed during the 19th century.
If the 19th century was not the coldest part of the LIA in the GOA region, why did so many glaciers reach their LIA maxima then? One possibility is that increased winter precipitation was a key factor, and that these anomalously late LIA maxima owe their occurrence to the combination of Milankovitch forcing, the Dalton Minimum, enhanced volcanic activity, and increased snow accumulation. This same climatic scenario was first considered and rejected by Tarr and Martin (1914), and proposed again by Miller (1958) and Wiles and Calkin (1994). New paleoclimate data from several sources now allows us to evaluate this hypothesis.
Paleo-Records Show the Importance of Winter Precipitation for GOA Glaciers in the 19th Century
Several paleoclimate reconstructions of NPDV along with wintertime conditions in southern Alaska and southwest Yukon Territory indicate that the GOA coastline experienced relatively high snowfall during the 19th century (Figure 8). A trend of increasing snow-accumulation rates in the Mount Hunter and Mount Logan ice cores began in the early 1700s (Figure 8B; Winski et al., 2017). In addition, variations in sodium fallout in these same ice cores suggests long-term strengthening of the AL that drove more winter storms into the northern GOA after ∼1700, a trend that has continued up to the present (Figure 8A; Osterberg et al., 2017). Together, these regional data suggest that increased winter snow accumulation may have contributed to positive mass balances on glaciers throughout southern coastal Alaska. This conclusion is supported by proxy records in downwind North America, where reconstructions of the wintertime PNA exhibit shifts toward more positive PNA patterns in the early CE 1800s, a teleconnection pattern that also implies a strengthening AL and hence increased winter precipitation in the GOA (Figure 8C; Liu et al., 2017). Additionally, oxygen-isotope proxies of paleoclimate from carbonates in lake sediment and from the Mount Logan ice core suggest that an abrupt shift to a stronger AL occurred between the mid-18th and early-19th centuries (Figure 8D; Fisher et al., 2004; Anderson et al., 2005; Bailey et al., 2018). In summary, recently published paleo-data support the idea that, starting in the 1700s, the combination of increased winter precipitation and moderately cool summers caused positive mass balances in glaciers bordering the northeastern GOA that resulted in the relatively late timing of their LIA maxima during the closing decades of the 19th century (Figures 6, 8).
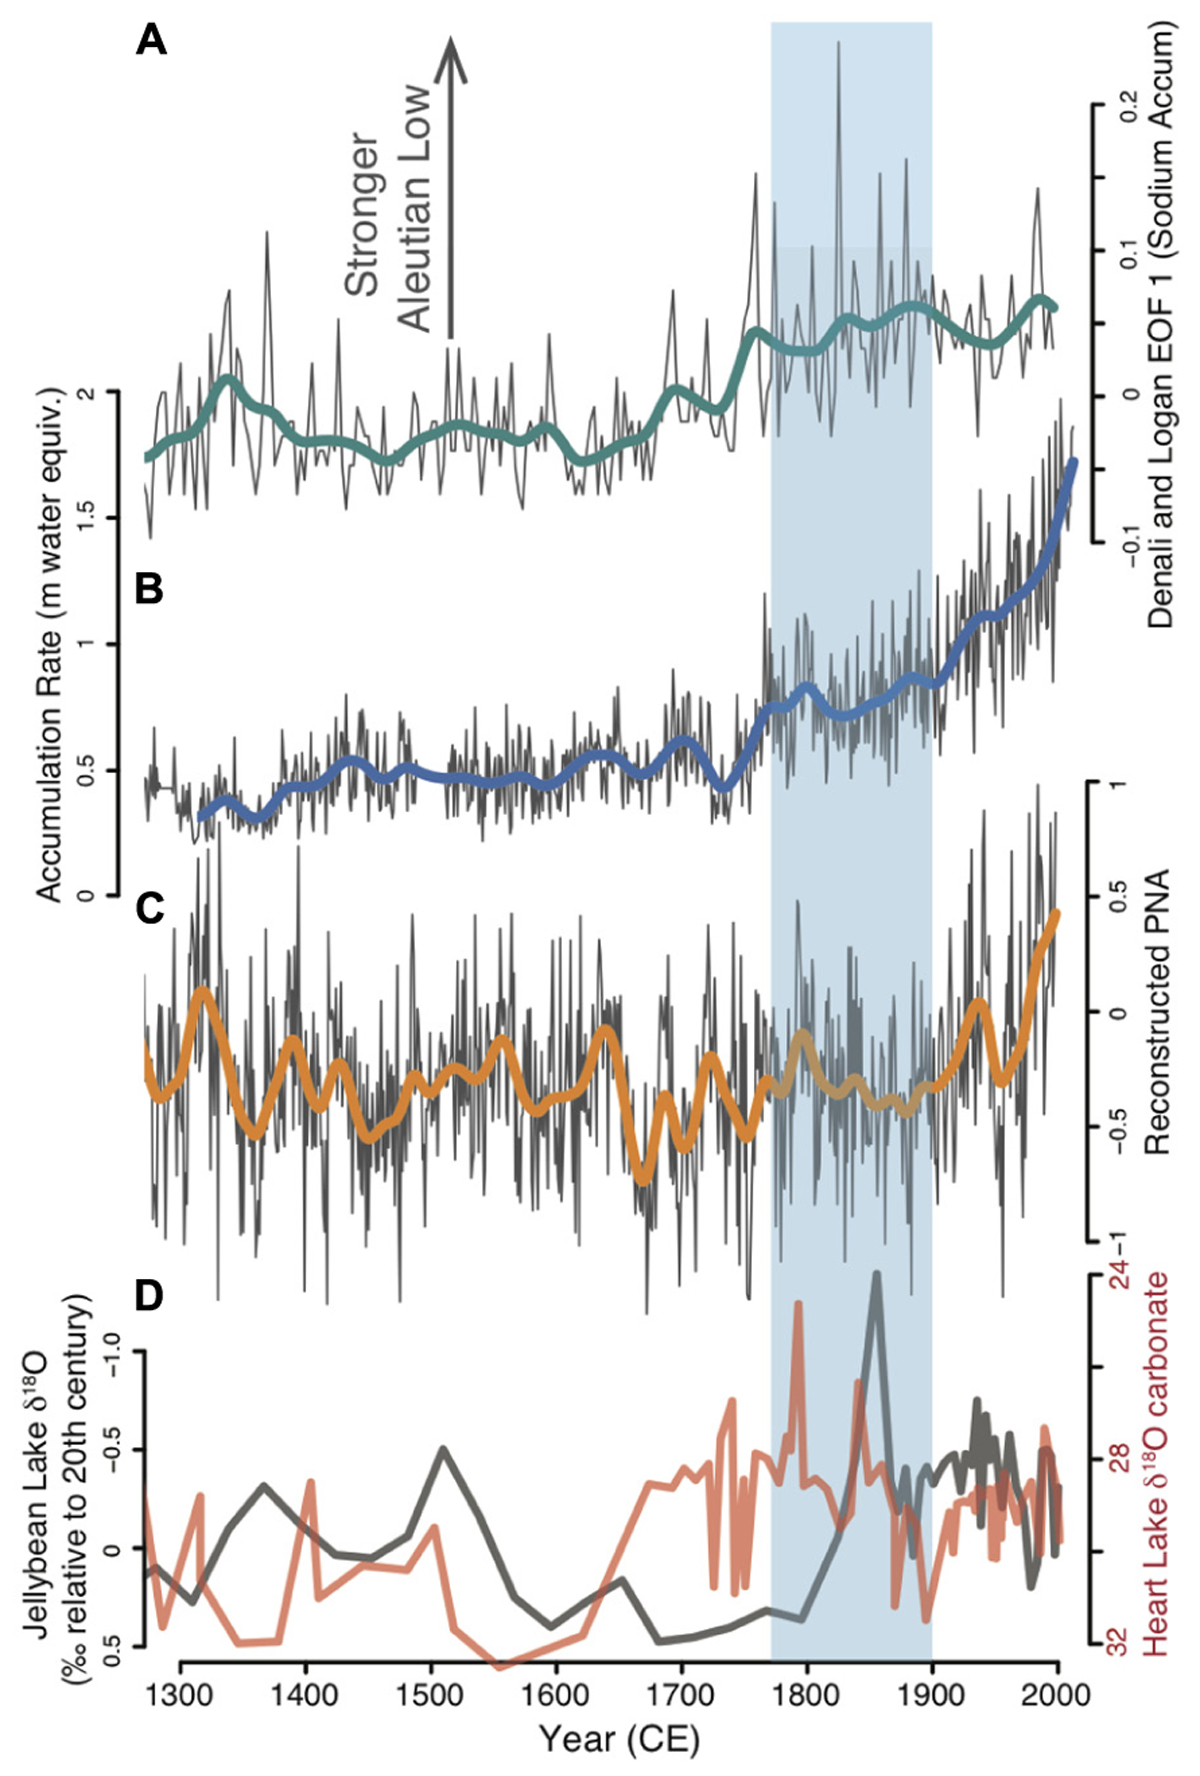
Figure 8. Shifts or trends toward a stronger Aleutian Low pressure system preceded the 19th century glacier advance in Coastal Alaska (blue box). (a) Composite sodium record in ice cores from Mt. Logan (Yukon Territory) and Denali (Alaska) (Osterberg et al., 2017). (b) Accumulation rate of snow on Mount Hunter in the Alaska Range (Winski et al., 2017). (c) Reconstructed Pacific North American atmospheric circulation pattern based on tree rings and varved lake sediments from downwind North America, where more positive values coincide with a stronger Aleutian Low (Liu et al., 2017). (d) Oxygen isotopes of carbonate deposited in Jellybean Lake in the Yukon Territory (Anderson et al., 2005). Up in these graphs reflect a stronger Aleutian Low.
Conclusion
The cross-dated outer rings of 30 in situ conifer trees killed by aggrading outwash in front of advancing glacial ice indicate that the La Perouse Glacier in Southeast Alaska advanced to its maximum LIA extent between CE 1850 and 1895, and then began to retreat prior to CE 1922. Prior to this LIA maximum, the glacier had been in a retracted state since at least CE 1206 based on tree-ring dating, radiocarbon-dated soils, and the lags associated with forest succession. Historical accounts and dendro-glaciological records show that many glaciers surrounding the GOA were also advancing to their LIA-max extents during the 1800s. In contrast, the advances and retreats of a minority of glaciers in the region were partially disconnected from climate by being involved in calving-glacier cycles. Cooler summers caused by the Dalton Solar Minimum were probably not the sole cause of these 1800s advances because the Dalton Solar Minimum was relatively mild, and previous, stronger solar minima were not associated with comparably widespread and extensive glacial advances. Instead, paleoclimate data from ice cores and lake sediments support the interpretation that increased winter precipitation caused by a strengthening of the AL combined with cool summers to cause late-LIA glacial maxima in the GOA region. These results highlight the changing climatic sensitivities of glaciers over relatively short time periods and emphasize the collaborative roles of ocean-atmospheric variability and solar cycles in controlling the fluctuations of mountain glaciers.
Author Contributions
BG designed the research, and conducted the fieldwork, part of the analysis, and wrote the manuscript. DM helped designed the research, and conducted the fieldwork, and helped write the manuscript. GW helped to design the research and conducted interpretation on analysis, and provided comparison data and comments on writing. BJ, JC, and NW helped with analysis, and provided comments on writing. LA-H helped with interpretation and provided comments on writing.
Funding
The US National Park Service provided financial and logistical support. Fieldwork and support for BG was provided by the Lamont-Doherty Earth Observatory Climate Center Postdoctoral Fellowship, National Geographic Project CP4-151R-18, and US National Science Foundation grant OISE-1743738. Additional support came from the US National Science Foundation’s grants OPP-1203271 and PLR-15-04134. LA-H was partially supported by PLR-16-03473 and AGS-15-02150 and GW by AGS – 15-02186.
Conflict of Interest Statement
The authors declare that the research was conducted in the absence of any commercial or financial relationships that could be construed as a potential conflict of interest.
Acknowledgments
We thank Gary Thompson and Hans Munich for providing flight service. Carson Baughman, Philip Wilson, and Rowan Sharman helped with fieldwork, and Lewis Sharman provided administrative assistance in Glacier Bay National Park. Earlier drafts of this manuscript benefited from reviews and conversations with Greg Streveler, Nicolas Young, and Michael Kaplan. Constructive comments from Johannes Koch and Olga Solomina improved this manuscript. This is LDEO contribution number 8301.
Footnotes
References
Ahmed, M., Anchukaitis, K. J., Asrat, A., Borgaonkar, H., Braida, M., Buckley’s, B. M., et al. (2013). Continental-scale temperature variability during the past two millennia. Nat. Geosci. 6:339. doi: 10.1038/ngeo1797
Alexander, M. A., and Deser, C. (1995). A mechanism for the recurrence of wintertime midlatitude SST anomalies. J. Phys. Oceanogr. 25, 122–137. doi: 10.1175/1520-0485(1995)025<0122:AMFTRO>2.0.CO;2
Allen, S. M., and Smith, D. J. (2007). Late holocene glacial activity of bridge glacier, British Columbia Coast Mountains. Can. J. Earth Sci. 44, 1753–1773. doi: 10.1139/e07-059
Anchukaitis, K. J., Wilson, R., Briffa, K. R., Büntgen, U., Cook, E. R., D’Arrigo, R., et al. (2017). Last millennium Northern Hemisphere summer temperatures from tree rings: part II, spatially resolved reconstructions. Quat. Sci. Rev. 163, 1–22. doi: 10.1016/j.quascirev.2017.02.020
Anderson, L., Abbott, M. B., Finney, B. P., and Burns, S. J. (2005). Regional atmospheric circulation change in the North Pacific during the Holocene inferred from lacustrine carbonate oxygen isotopes, Yukon Territory, Canada. Quat. Res. 64, 21–35. doi: 10.1016/j.yqres.2005.03.005
Arendt, A., Luthcke, S., Gardner, A., O’Neel, S., Hill, D., Moholdt, G., et al. (2013). Analysis of a GRACE global mascon solution for Gulf of Alaska glaciers. J. Glaciol. 59, 913–924. doi: 10.3189/2013JoG12J197
Arendt, A. A., Echelmeyer, K. A., Harrison, W. D., Lingle, C. S., and Valentine, V. B. (2002). Rapid wastage of Alaska glaciers and their contribution to rising sea level. Science 297, 382–386. doi: 10.1126/science.1072497
Arguez, A., Durre, I., Applequist, S., Squires, M. F., Vose, R. S., Yin, X., et al. (2012). NOAA’s 1981–2010 US climate normals: an overview. Bull. Am. Meteorol. Soc. 93, 1687–1697. doi: 10.1175/BAMS-D-11-00197.1
Bahr, D. B., Pfeffer, W. T., Sassolas, C., and Meier, M. F. (1998). Response time of glaciers as a function of size and mass balance: 1. Theory. J. Geophys. Res. 103, 9777–9782. doi: 10.1029/98JB00507
Bailey, H. L., Kaufman, D. S., Sloane, H. J., Hubbard, A. L., Henderson, A. C. G., Leng, M. J., et al. (2018). Holocene atmospheric circulation in the central North Pacific: a new terrestrial diatom and δ18O dataset from the Aleutian Islands. Quat. Sci. Rev. 194, 27–38. doi: 10.1016/j.quascirev.2018.06.027
Barclay, D. J., Barclay, J. L., Calkin, P. E., and Wiles, G. C. (2006). A revised and extended Holocene glacial history of Icy Bay, southern Alaska, USA. Arct. Antarct. Alp. Res. 38, 153–162. doi: 10.1657/1523-0430(2006)38[153:ARAEHG]2.0.CO;2
Barclay, D. J., Calkin, P. E., and Wiles, G. C. (2001). Holocene history of Hubbard Glacier in Yakutat Bay and Russell Fiord, southern Alaska. Geol. Soc. Am. Bull. 113, 388–402. doi: 10.1130/0016-7606(2001)113<0388:HHOHGI>2.0.CO;2
Barclay, D. J., Wiles, G. C., and Calkin, P. E. (1999). A 1119-year tree-ring-width chronology from western Prince William Sound, southern Alaska. Holocene 9, 79–84. doi: 10.1191/095968399672825976
Barclay, D. J., Wiles, G. C., and Calkin, P. E. (2009). Tree-ring crossdates for a first millennium CE advance of Tebenkof Glacier, southern Alaska. Quat. Res. 71, 22–26. doi: 10.1016/j.yqres.2008.09.005
Bard, E., Raisbeck, G., Yiou, F., and Jouzel, J. (2000). Solar irradiance during the last 1200 years based on cosmogenic nuclides. Tellus B, 52, 985–992. doi: 10.1034/j.1600-0889.2000.d01-7.x
Bard, E., Raisbeck, G. M., Yiou, F., and Jouzel, J. (1997). Solar modulation of cosmogenic nuclide production over the last millennium: comparison between 14C and 10Be records. Earth Planet. Sci. Lett. 150, 453–462. doi: 10.1016/S0012-821X(97)00082-4
Beier, C. M., Sink, S. E., Hennon, P. E., D’Amore, D. V., and Juday, G. P. (2008). Twentieth-century warming and the dendroclimatology of declining yellow-cedar forests in southeastern Alaska. Can. J. Forest Res. 38, 1319–1334. doi: 10.1139/X07-240
Berger, A., and Loutre, M.-F. (1991). Insolation values for the climate of the last 10 million years. Quat. Sci. Rev. 10, 297–317. doi: 10.1016/0277-3791(91)90033-Q
Bitz, C. M., and Battisti, D. S. (1999). Interannual to decadal variability in climate and the glacier mass balance in Washington, western Canada, and Alaska. J. Clim. 12, 3181–3196. doi: 10.1175/1520-0442(1999)012<3181:ITDVIC>2.0.CO;2
Bräuning, A. (2006). Tree-ring evidence of “Little Ice Age”glacier advances in southern Tibet. Holocene 16, 369–380. doi: 10.1191/0959683606hl922rp
Bunn, A. G. (2008). A dendrochronology program library in R (dplR). Dendrochronologia 26, 115–124. doi: 10.1016/j.dendro.2008.01.002
Burbank, D. W. (1981). A chronology of late Holocene glacier fluctuations on Mount Rainier, Washington. Arct. Alp. Res. 13, 369–386. doi: 10.2307/1551049
Burroughs, J., and Muir, J. (1986). Alaska: The Harriman Expedition, 1899. Mineola, NY: Dover Publications.
Capps, D. M., Wiles, G. C., Clague, J. J., and Luckman, B. H. (2011). Tree-ring dating of the nineteenth-century advance of Brady Glacier and the evolution of two ice-marginal lakes, Alaska. Holocene 21, 641–649. doi: 10.1177/0959683610391315
Chapin, F. S., Walker, L. R., Fastie, C. L., and Sharman, L. C. (1994). Mechanisms of primary succession following deglaciation at Glacier Bay, Alaska. Ecol. Monogr. 64, 149–175. doi: 10.1007/BF00396734
Connor, C., Streveler, G., Post, A., Daniel, M., and Wanye, H. (2009). The Neoglacial landscape and human history of Glacier Bay, Glacier Bay National Park and Preserve, southeast Alaska, USA. Holocene 19, 381–393. doi: 10.1177/0959683608101389
Coulthard, B., and Smith, D. J. (2013). “Dendroglaciology,” in The Encyclopedia of Quaternary Science, Vol. 2, ed. S. A. Elias (Amsterdam: Elsevier), 104–111.
Coulthard, B., Smith, D. J., and Lacourse, T. (2013). Dendroglaciological investigations of mid-to late-Holocene glacial activity in the Mt. Waddington area, British Columbia Coast Mountains, Canada. Holocene 23, 93–103. doi: 10.1177/0959683612455537
Davidson, G. (1904). The glaciers of Alaska that are shown on Russian charts or mentioned in older narratives. Trans. Proc. Geog. Soc. Pacific 3, 1–98.
Fastie, C. L. (1995). Causes and ecosystem consequences of multiple pathways of primary succession at Glacier Bay, Alaska. Ecology 76, 1899–1916. doi: 10.2307/1940722
Fisher, D., Wake, C., Kreutz, K., Yalcin, E., Steig, P., Mayewski, L., et al. (2004). Stable isotope records from Mount Logan, Eclipse ice cores and nearby Jellybean Lake. Water cycle of the North Pacific over 2000 years and over five vertical kilometres: sudden shifts and tropical connections. Géographie Physique et Quaternaire 58, 337–352. doi: 10.7202/013147ar
Fisher, R., and Johnston, H. J. (1993). From Maps to Metaphors: The Pacific World of George Vancouver. Vancouver, BC: UBC Press.
Gaglioti, B. V., Mann, D. H., Williams, A. P., Wiles, G. C., Stoffel, M., Oelkers, R., et al. (in press). Traumatic resin ducts in subalpine mountain hemlock trees provide a new proxy for past winter storminess. J. Geophys. Res.
Gao, C., Robock, A., and Ammann, C. (2008). Volcanic forcing of climate over the past 1500 years: an improved ice core-based index for climate models. J. Geophys. Res. Atmos. 113. doi: 10.1029/2008JD010239
Gilbert, G. K. (1910). Harriman Expedition: Alaska Glaciers and Glaciation, Vol. 3. Boreland: Macritchie Press.
Goodwin, R. G. (1988). Holocene glaciolacustrine sedimentation in muir inlet and ice advance in Glacier Bay, Alaska, U.S.A. Arct. Alp. Res. 20, 55–69.
Grove, J. M. (2001). The initiation of the “Little Ice Age” in regions round the North Atlantic. Climate Change 48, 53–82. doi: 10.1023/A:1005662822136
Harris, A. S., Hutchison, O. K., Meehan, W. R., Swanston, D. N., Helmers, A. E., Hendee, J. C., et al. (1974). The Forest Ecosystem of Southeast Alaska: 1. The Setting. Gen Tech Rep PNW-GTR-012. Portland, OR: US Department of Agriculture.
Hartmann, B., and Wendler, G. (2005). The significance of the 1976 Pacific climate shift in the climatology of Alaska. J. Clim. 18, 4824–4839. doi: 10.1175/JCLI3532.1
Heikkinen, O. (1984). Dendrochronological evidence of variations of Coleman Glacier, Mount Baker, Washington, USA. Arct. Alp. Res. 16, 53–64. doi: 10.2307/1551172
Holmes, R. L. (1983). Computer-assisted quality control in tree-ring dating and measurement. Tree Ring Bull. 43, 69–78. doi: 10.1016/j.dib.2018.08.019
Jackson, S. I., Laxton, S. C., and Smith, D. J. (2008). Dendroglaciological evidence for Holocene glacial advances in the Todd Icefield area, northern British Columbia Coast Mountains. Can. J. Earth Sci. 45, 83–98. doi: 10.1139/e07-071
Koch, J., Clague, J. J., and Osborn, G. D. (2011). Glacier fluctuations during the past millennium in Garibaldi Provincial Park, southern coast Mountains, British Columbia. Can. J. Earth Sci. 44, 1215–1233. doi: 10.1139/e07-019
Koehler, L., and Smith, D. J., (2011). Late holocene glacial activity in Manatee Valley, southern Coast Mountains, British Columbia, Canada. Can. J. Earth Sci. 48, 603–618. doi: 10.1139/E10-087
La Pérouse, J. F. G. (1994). Comte de. 1994–1995. The Journal of Jean-François de Galaup de la Pérouse, 1785–1788. London: Hakluyt Society. Available at: https://trove.nla.gov.au/work/5766697?q&sort=holdings+desc&_=1555351663330&versionId=210812644
Larocque, S. J., and Smith, D. J. (2003). Little ice age glacial activity in the Mt. Waddington area, British Columbia Coast Mountains, Canada. Can. J. Earth Sci. 40, 1413–1436. doi: 10.1139/e03-053
Larsen, C. F., Motyka, R. J., Freymueller, J. T., Echelmeyer, K. A., and Ivins, E. R. (2005). Rapid viscoelastic uplift in southeast Alaska caused by post-little ice age glacial retreat. Earth Planet. Sci. Lett. 237, 548–560. doi: 10.1016/j.epsl.2005.06.032
Lewis, D. H., and Smith, D. J. (2004). Little ice age glacial activity in strathcona provincial park, Vancouver Island, British Columbia, Canada. Can. J. Earth Sci. 41, 285–297. doi: 10.1139/e03-102
Liu, Z., Tang, Y., Jian, Z., Poulsen, C. J., Welker, J. M., and Bowen, G. J. (2017). Pacific North American circulation pattern links external forcing and North American hydroclimatic change over the past millennium. Proc. Natl. Acad. Sci. 114, 3340–3345. doi: 10.1073/pnas.1618201114
Luckman, B. H. (1993). Glacier fluctuation and tree-ring records for the last millennium in the Canadian Rockies. Quat. Sci. Rev. 12, 441–450. doi: 10.1016/S0277-3791(05)80008-3
Luckman, B. H. (2000). The little ice age in the Canadian Rockies. Geomorphology 32, 357–384. doi: 10.1016/S0169-555X(99)00104-X
Luckman, B. H., and Wilson, R. (2005). Summer temperatures in the Canadian Rockies during the last millennium: a revised record. Clim. Dynam. 24, 131–144. doi: 10.1007/s00382-004-0511-0
Malaspina, A., and David, A. (2003). The Malaspina expedition, 1789-1794: journal of the voyage by Alejandro Malaspina, Vol. 2. London: Hakluyt Society.
Mann, D. H. (1986). Reliability of a fjord glacier’s fluctuations for paleoclimatic reconstructions. Quat. Res. 25, 10–24. doi: 10.1016/0033-5894(86)90040-2
Mann, D. H., and Streveler, G. P. (2008). Relative sea level history, isostasy, and glacial history in Icy Strait, Southeast Alaska. Quat. Res. 69, 201–216. doi: 10.1016/j.yqres.2007.12.005
Mann, D. H., and Ugolini, F. C. (1985). Holocene glacial history of the Lituya District, southeast Alaska. Can. J. Earth Sci. 22, 913–928. doi: 10.1139/e85-095
Mantua, N. J., and Hare, S. R. (2002). The Pacific decadal oscillation. J. Oceanogr. 58, 35–44. doi: 10.1023/A:1015820616384
Marzeion, B., Cogley, J. G., Richter, K., and Parkes, D. (2014). Attribution of global glacier mass loss to anthropogenic and natural causes. Science 345, 919–921. doi: 10.1126/science.1254702
McGrath, D., Sass, L., O’Neel, S., Arendt, A., and Kienholz, C. (2017). Hypsometric control on glacier mass balance sensitivity in Alaska and northwest Canada. Earth Fut. 5, 324–336. doi: 10.1002/2016EF000479
McKenzie, G. D., and Goldthwait, R. P. (1971). Glacial history of the last eleven thousand years in Adams Inlet, southeastern Alaska. Geol. Soc. Am. Bull. 82, 1767–1782. doi: 10.1130/0016-7606(1971)82[1767:GHOTLE]2.0.CO;2
Menounos, B., Osborn, G., Clague, J. J., and Luckman, B. H. (2009). Latest pleistocene and holocene glacier fluctuations in western Canada. Quat. Sci. Rev. 28, 2049–2074. doi: 10.1016/j.quascirev.2008.10.018
Miller, G. H., Geirsdóttir,Á, Zhong, Y., Larsen, D. J., Otto, B. L., Holland, M. M., et al. (2012). Abrupt onset of the Little Ice Age triggered by volcanism and sustained by sea-ice/ocean feedbacks. Geophys. Res. Lett. 39:L02708. doi: 10.1073/pnas.1304912110
Miller, M. M. (1958). The role of diastrophism in the regimen of glaciers in the st. Elias District, Alaska. J. Glaciol. 3, 293–297. doi: 10.1017/S0022143000023959
Mock, C. J., Bartlein, P. J., and Anderson, P. M. (1998). Atmospheric circulation patterns and spatial climatic variations in Beringia. Int. J. Climatol. 18, 1085–1104. doi: 10.1002/(SICI)1097-0088(199808)18:10<1085::AID-JOC305>3.0.CO;2-K
Neal, E. G., Hood, E., and Smikrud, K. (2010). Contribution of glacier runoff to freshwater discharge into the Gulf of Alaska. Geophys. Res. Lett. 37:L06404. doi: 10.1111/gcb.13875
Newman, M., Alexander, M. A., Ault, T. R., Cobbd, K. M., Desere, C., Di Lorenzo, E., et al. (2016). The Pacific decadal oscillation, revisited. J. Clim. 29, 4399–4427. doi: 10.1175/JCLI-D-15-0508.1
Oerlemans, J. (2005). Extracting a climate signal from 169 glacier records. Science 308, 675–677. doi: 10.1126/science.1107046
Oerlemans, J., and Fortuin, J. (1992). Sensitivity of glaciers and small ice caps to greenhouse warming. Science 258, 115–117. doi: 10.1126/science.258.5079.115
Olson, W. M. (2002). Through Spanish Eyes: The Spanish Voyages to Alaska, 1774–1792. North Branch, MI: Heritage Research.
Osterberg, E. C., Winski, D. A., Kreutz, K. J., Wake, C. P., Ferris, D. G., Campbell, S., et al. (2017). The 1200 year composite ice core record of Aleutian Low intensification. Geophys. Res. Lett. 44, 7447–7454. doi: 10.1002/2017GL073697
Plafker, G., and Miller, D. J. (1957). Glacial Features and Surficial Deposits of the Malaspina District, Alaska US Geological Survey Report No. 57-91. Washington, DC: US Department of the Interior.
Post, A., and Motyka, R. J. (1995). Taku and Le Conte glaciers, Alaska: calving-speed control of late-Holocene asynchronous advances and retreats. Phys. Geogr. 16, 59–82. doi: 10.1080/02723646.1995.10642543
Post, A., O’Neel, S., Motyka, R. J., and Streveler, G. (2011). A complex relationship between calving glaciers and climate. EOS Trans. Am. Geophys. Union 92, 305–306. doi: 10.1029/2011EO370001
Reimer, P. J., Bard, E., Bayliss, A., Beck, J. E., Blackwell, P. G., Ramsey, C. B., et al. (2013). IntCal13 and Marine13 radiocarbon age calibration curves 0–50,000 years cal BP. Radiocarbon 55, 1869–1887. doi: 10.1016/j.dib.2018.10.040
Rodionov, S. N., Bond, N. A., and Overland, J. E. (2007). The Aleutian Low, storm tracks, and winter climate variability in the Bering Sea. Deep Sea Res. Part II Top. Stud. Oceanogr. 54, 2560–2577. doi: 10.1016/j.dsr2.2007.08.002
Solomina, O. N., Bradley, R. S., Hodgson, D. A., Ivy-Ochs, S., Jomelli, V., Mackintosh’s, A. V., et al. (2015). Holocene glacier fluctuations. Quat. Sci. Rev. 111, 9–34. doi: 10.1016/j.quascirev.2014.11.018
Solomina, O. N., Bradley, R. S., Jomelli, V., Geirsdottir, A., Kaufman, D. S., Koch, J., et al. (2016). Glacier fluctuations during the past 2000 years. Quat. Sci. Rev. 149, 61–90. doi: 10.1016/j.quascirev.2016.04.008
Stokes, M. A., and Smiley, T. L. (1996). Introduction to Tree Ring Dating. Tucson: The University of Arizona Press, 73.
Tarr, R. S., and Martin, L. (1914). Alaskan Glacier Studies of the National Geographic Society in the Yakutat Bay, Prince William Sound and Lower Copper River Regions. Washington, DC: National Geographic Society.
Thompson, R. S., Anderson, K. H., Strickland, L. E., Shafer, S. L., and Pelltier, R. T. (2006). Atlas of relations between climatic parameters and distributions of important trees and shrubs in North America: Alaska species and ecoregions. Paper Presented 1650-D, US Dept. of the Interior, US Geological Survey, Reston, VA. doi: 10.3133/pp1650D
Trenberth, K. E., and Hurrell, J. W. (1994). Decadal atmosphere-ocean variations in the Pacific. Clim. Dynam. 9, 303–319. doi: 10.1007/BF00204745
Van Beusekom, A. E., O’Neel, S. R., March, R. S., Sass, L. C., and Cox, L. H. (2010). Re-Analysis of Alaskan Benchmark Glacier Mass-Balance Data Using the Index Method. US Geological Survey Scientific Investigations Report No: 5247. Washington, DC: US Department of Interior.
Van der Veen, C. J. (2013). Fundamentals of Glacier Dynamics, 2nd Edn. Boca Raton, FL: CRC Press. doi: 10.1201/b14059
Wendler, G., Galloway, K., and Stuefer, M. (2016). On the climate and climate change of Sitka, Southeast Alaska. Theor. Appl. Climatol. 126, 27–34. doi: 10.1007/s00704-015-1542-7
Wiles, G. C., Barclay, D. J., Calkin, P. E., and Lowell, T. V. (2008). Century to millennial-scale temperature variations for the last two thousand years indicated from glacial geologic records of Southern Alaska. Global Planet. Change 60, 115–125. doi: 10.1016/j.gloplacha.2006.07.036
Wiles, G. C., and Calkin, P. E. (1994). Late Holocene, high-resolution glacial chronologies and climate, Kenai Mountains, Alaska. Geol. Soc. Am. Bull. 106, 281–303. doi: 10.1130/0016-7606(1994)106<0281:LHHRGC>2.3.CO;2
Wiles, G. C., D’Arrigo, R. D., Barclay, D., Wilson, R. S., Jarvis, S. K., and Lauren, V. (2014). Surface air temperature variability reconstructed with tree rings for the Gulf of Alaska over the past 1200 years. Holocene 24, 198–208. doi: 10.1177/0959683613516815
Wiles, G. C., D’Arrigo, R. D., Villalba, R., Calkin, P. E., and Barclay, D. J. (2004). Century-scale solar variability and Alaskan temperature change over the past millennium. Geophys. Res. Lett. 31:L15203. doi: 10.1029/2004GL020050
Wiles, G. C., Mennett, C. R., Jarvis, S. K., Wiesenberg, N., Lawson, D. E., D’Arrigo’s, R., et al. (2012). Tree-ring investigations into changing climatic responses of yellow-cedar, Glacier Bay, Alaska. Can. J. Forest Res. 42, 814–819. doi: 10.1139/x2012-028
Winski, D., Osterberg, E., Ferris, D., Kreutz, K., Wake, C., Campbell, S., et al. (2017). Industrial-age doubling of snow accumulation in the Alaska Range linked to tropical ocean warming. Sci. Rep. 7:17869. doi: 10.1038/s41598-017-18022-5
Keywords: glaciers, dendrochronology, Little Ice Age, Southeastern Alaska, St. Elias Mountains, climate change
Citation: Gaglioti BV, Mann DH, Wiles GC, Jones BM, Charlton J, Wiesenberg N and Andreu-Hayles L (2019) Timing and Potential Causes of 19th-Century Glacier Advances in Coastal Alaska Based on Tree-Ring Dating and Historical Accounts. Front. Earth Sci. 7:82. doi: 10.3389/feart.2019.00082
Received: 21 December 2018; Accepted: 04 April 2019;
Published: 03 May 2019.
Edited by:
Lesleigh Anderson, United States Geological Survey, United StatesReviewed by:
Johannes Koch, Brandon University, CanadaOlga Nikolaevna Solomina, Institute of Geography (RAS), Russia
Copyright © 2019 Gaglioti, Mann, Wiles, Jones, Charlton, Wiesenberg and Andreu-Hayles. This is an open-access article distributed under the terms of the Creative Commons Attribution License (CC BY). The use, distribution or reproduction in other forums is permitted, provided the original author(s) and the copyright owner(s) are credited and that the original publication in this journal is cited, in accordance with accepted academic practice. No use, distribution or reproduction is permitted which does not comply with these terms.
*Correspondence: Benjamin V. Gaglioti, YmVuZ2FnbGlvdGlAZ21haWwuY29t