
95% of researchers rate our articles as excellent or good
Learn more about the work of our research integrity team to safeguard the quality of each article we publish.
Find out more
ORIGINAL RESEARCH article
Front. Earth Sci. , 06 February 2019
Sec. Volcanology
Volume 7 - 2019 | https://doi.org/10.3389/feart.2019.00007
 Claire E. Harnett1*
 Jackie E. Kendrick2
 Anthony Lamur2
 Mark E. Thomas1
 Adam Stinton3,4
 Paul A. Wallace2James E. P. Utley2
 William Murphy1
 Jurgen Neuberg1
 Yan Lavallée2
Lava dome collapses pose a hazard to surrounding populations, but equally represent important processes for deciphering the eruptive history of a volcano. Models examining lava dome instability rely on accurate physical and mechanical properties of volcanic rocks. Here we focus on determining the physical and mechanical properties of a suite of temporally-constrained rocks from different phases of the 1995–2010 eruption at Soufrière Hills volcano in Montserrat. We determine the uniaxial compressive strength, tensile strength, density, porosity, permeability, and Young’s modulus using laboratory measurements, complemented by Schmidt hammer testing in the field. By viewing a snapshot of each phase, we find the highest tensile and compressive strengths in the samples attributed to Phase 4, corresponding to a lower permeability and an increasing proportion of isolated porosity. Samples from Phase 5 show lower compressive and tensile strengths, corresponding to the highest permeability and porosity of the tested materials. Overall, this demonstrates a reliance of mechanical properties primarily on porosity, however, a shift toward increasing prevalence of pore connectivity in weaker samples identified by microtextural analysis demonstrates that here pore connectivity also contributes to the strength and Young’s Modulus, as well as controlling permeability. The range in UCS strengths are supported using Schmidt hammer field testing. We determine a narrow range in mineralogy across the sample suite, but identify a correlation between increasing crystallinity and increasing strength. We correlate these changes to residency-time in the growing lava dome during the eruption, where stronger rocks have undergone more crystallization. In addition, subsequent recrystallization of silica polymorphs from the glass phase may further strengthen the material. We suggest the variation in physical and mechanical rock properties shown within the Soufrière Hills eruptive products be included in future structural stability models of the remaining over-steepened dome on Montserrat, and that consideration of rock heterogeneity and its temporal variation if possible, be made in other, similar systems.
Collapse of volcanic flanks and lava domes has been shown to influence subsequent eruptive behavior (e.g., Voight and Elsworth, 2000) and represents a major hazard through generation of pyroclastic flows and debris avalanches. Structural stability modeling is therefore vital in understanding the hazard associated with, and the consequences of volcanic collapse events. This has been explored through various modeling efforts, including: analog modeling (Vidal and Merle, 2000; Cecchi et al., 2004; Tibaldi et al., 2006; Andrade and van Wyk de Vries, 2010; Nolesini et al., 2013); Limit Equilibrium Methods (LEM; Apuani et al., 2005; Simmons et al., 2005; Borselli et al., 2011; Schaefer et al., 2013; Dondin et al., 2017); Finite Element Modeling (FEM; Voight, 2000; Schaefer et al., 2013); Finite Difference Methods (FDM; Apuani et al., 2005; Le Friant et al., 2006) and Discrete Element Modeling (DEM; Morgan and McGovern, 2005a,b; Husain et al., 2014, 2018; Harnett et al., 2018). Although modeling studies expand our knowledge of mechanisms of volcanic structural instability, they are often limited by the availability of mechanical data for edifice rock properties.
In particular, a recurrent challenge in modeling volcanic failure is representing the spatial and temporal heterogeneity of material (e.g., Schaefer et al., 2015; Heap et al., 2016b). The logistical difficulties in accessing deposits and outcrops during or after an eruption also prevent direct observation and quantification of erupted material. Numerical models are often forced to adopt ‘typical’ values for the physical and geomechanical properties of the material from the volcano in question, thus increasing the uncertainties associated with any model. As such, it is important to investigate the spatiotemporal evolution of material forming a volcano.
Volcanic products are typically very heterogeneous, with varied eruptive conditions leading to large ranges in pore architecture (i.e., connected vs. isolated vesicles vs. fractures) and permeability (Mueller et al., 2005; Heap et al., 2014a, 2018c; Farquharson et al., 2015; Colombier et al., 2017). Experimental investigations into volcanic rock properties have increased in recent years, including compressive and tensile strength, elastic properties, and resultant physical changes induced during deformation (e.g., Lavallée et al., 2007, 2008, 2013; Schaefer et al., 2015; Heap et al., 2016a, 2018a; Lamur et al., 2017; Marmoni et al., 2017; Coats et al., 2018), as well as research into the relationship between activity at dome-building volcanoes and their respective rock properties (e.g., Smith et al., 2009, 2011; Kendrick et al., 2013, 2016; Heap et al., 2015, 2016a; Kushnir et al., 2016; Lavallée et al., 2019). This increase in research has started to show the importance of understanding how mechanical properties of rock influence the eruptive style at a volcano, for example at Mt. St. Helens where porosity, and as such strength, was shown to be a determining factor in whether a lava dome or spine was extruded (Heap et al., 2016a).
Geomechanical properties not only influence eruptive style, but also structural stability. For example, although the interior of a lava dome is subjected to moderate confining pressures, outer talus slopes are often unconfined. This complex stress field influences the development of tensile and shear fractures. Although the mechanical behavior of materials in compressive stress fields has received most of the attention by the rock physics community in recent decades (e.g., Paterson and Wong, 2005), there is more investigation to be done into the tensile rock strength of volcanic materials, whose structural stability is commonly challenged by tensile stresses due to lack of confining and high pore pressure (Kilburn, 2018). The tensile strength of rocks is found to be ∼8% of the compressive strength (Jaeger et al., 2009; Perras and Diederichs, 2014), and can be as low as ∼4% (Zorn et al., 2018). As such, rock failure (even under compressive shear stress) generally follows the nucleation, propagation, and coalescence of tensile fractures (with the exception of supershear rupture; e.g., Das, 2015). We therefore investigate tensile strength and the ratio to compressive strength, and its relationship to other physical rock properties.
In addition to determining mechanical properties and variation of the physical properties of volcanic rock, it is important to consider how variation in petrology and geochemistry may also influence dome stability. For example at Mt. Unzen a temporal change in chemistry due to phenocryst abundance was shown to correlate with temporal changes in effusion rate (Nakada and Motomura, 1999), and such evolution in eruptive style will also alter dome stability. Similarly, the occurrence of secondary mineralization may modify the porous structure and coherence of rocks, affecting the structural stability (Horwell et al., 2013; Coats et al., 2018) especially when water is present in the pore space (Heap et al., 2018b).
Here, we focus on quantifying the physical, mineralogical, and mechanical properties of a temporally-constrained sample set, and the variability of these properties, required as inputs for numerical models assessing dome collapse hazard. To do this, we focus specifically on the Soufrière Hills volcano (SHV), and we aim to demonstrate the importance of, and encourage incorporation of, rock heterogeneity in future dome stability modeling efforts. In addition to showcasing the range in material properties, we also speculate how these may be temporally-linked to specific phases of the eruption.
Soufrière Hills volcano is an andesitic volcanic complex on the Caribbean island of Montserrat, located in the northern Lesser Antilles island arc (Figure 1). The current eruption started in July 1995 with a series of phreatic explosions, which led to the emplacement and growth of a lava dome (Young et al., 1998). This was followed by a series of dome growth and collapse cycles, involving large scale pyroclastic density current (PDC) generation and explosive activity. The eruption of SHV included five phases of dome growth (Wadge et al., 2014; Stinton et al., 2017): Phase 1 (November 15, 1995–March 10, 1998); Phase 2 (November 27, 1999–August 1, 2003); Phase 3 (August 1, 2005–April 20, 2007); Phase 4 (separated into Phase 4a: August 8, 2008–October 8, 2008, and Phase 4b: December 2, 2008–January 3, 2009; Robertson et al., 2009); and Phase 5 (October 8, 2009–February 11, 2010). These phases were separated by pauses characterized by no magma extrusion, and Phases 3, 4, and 5 were preceded by transitional periods with increases in seismicity and/or ash venting.
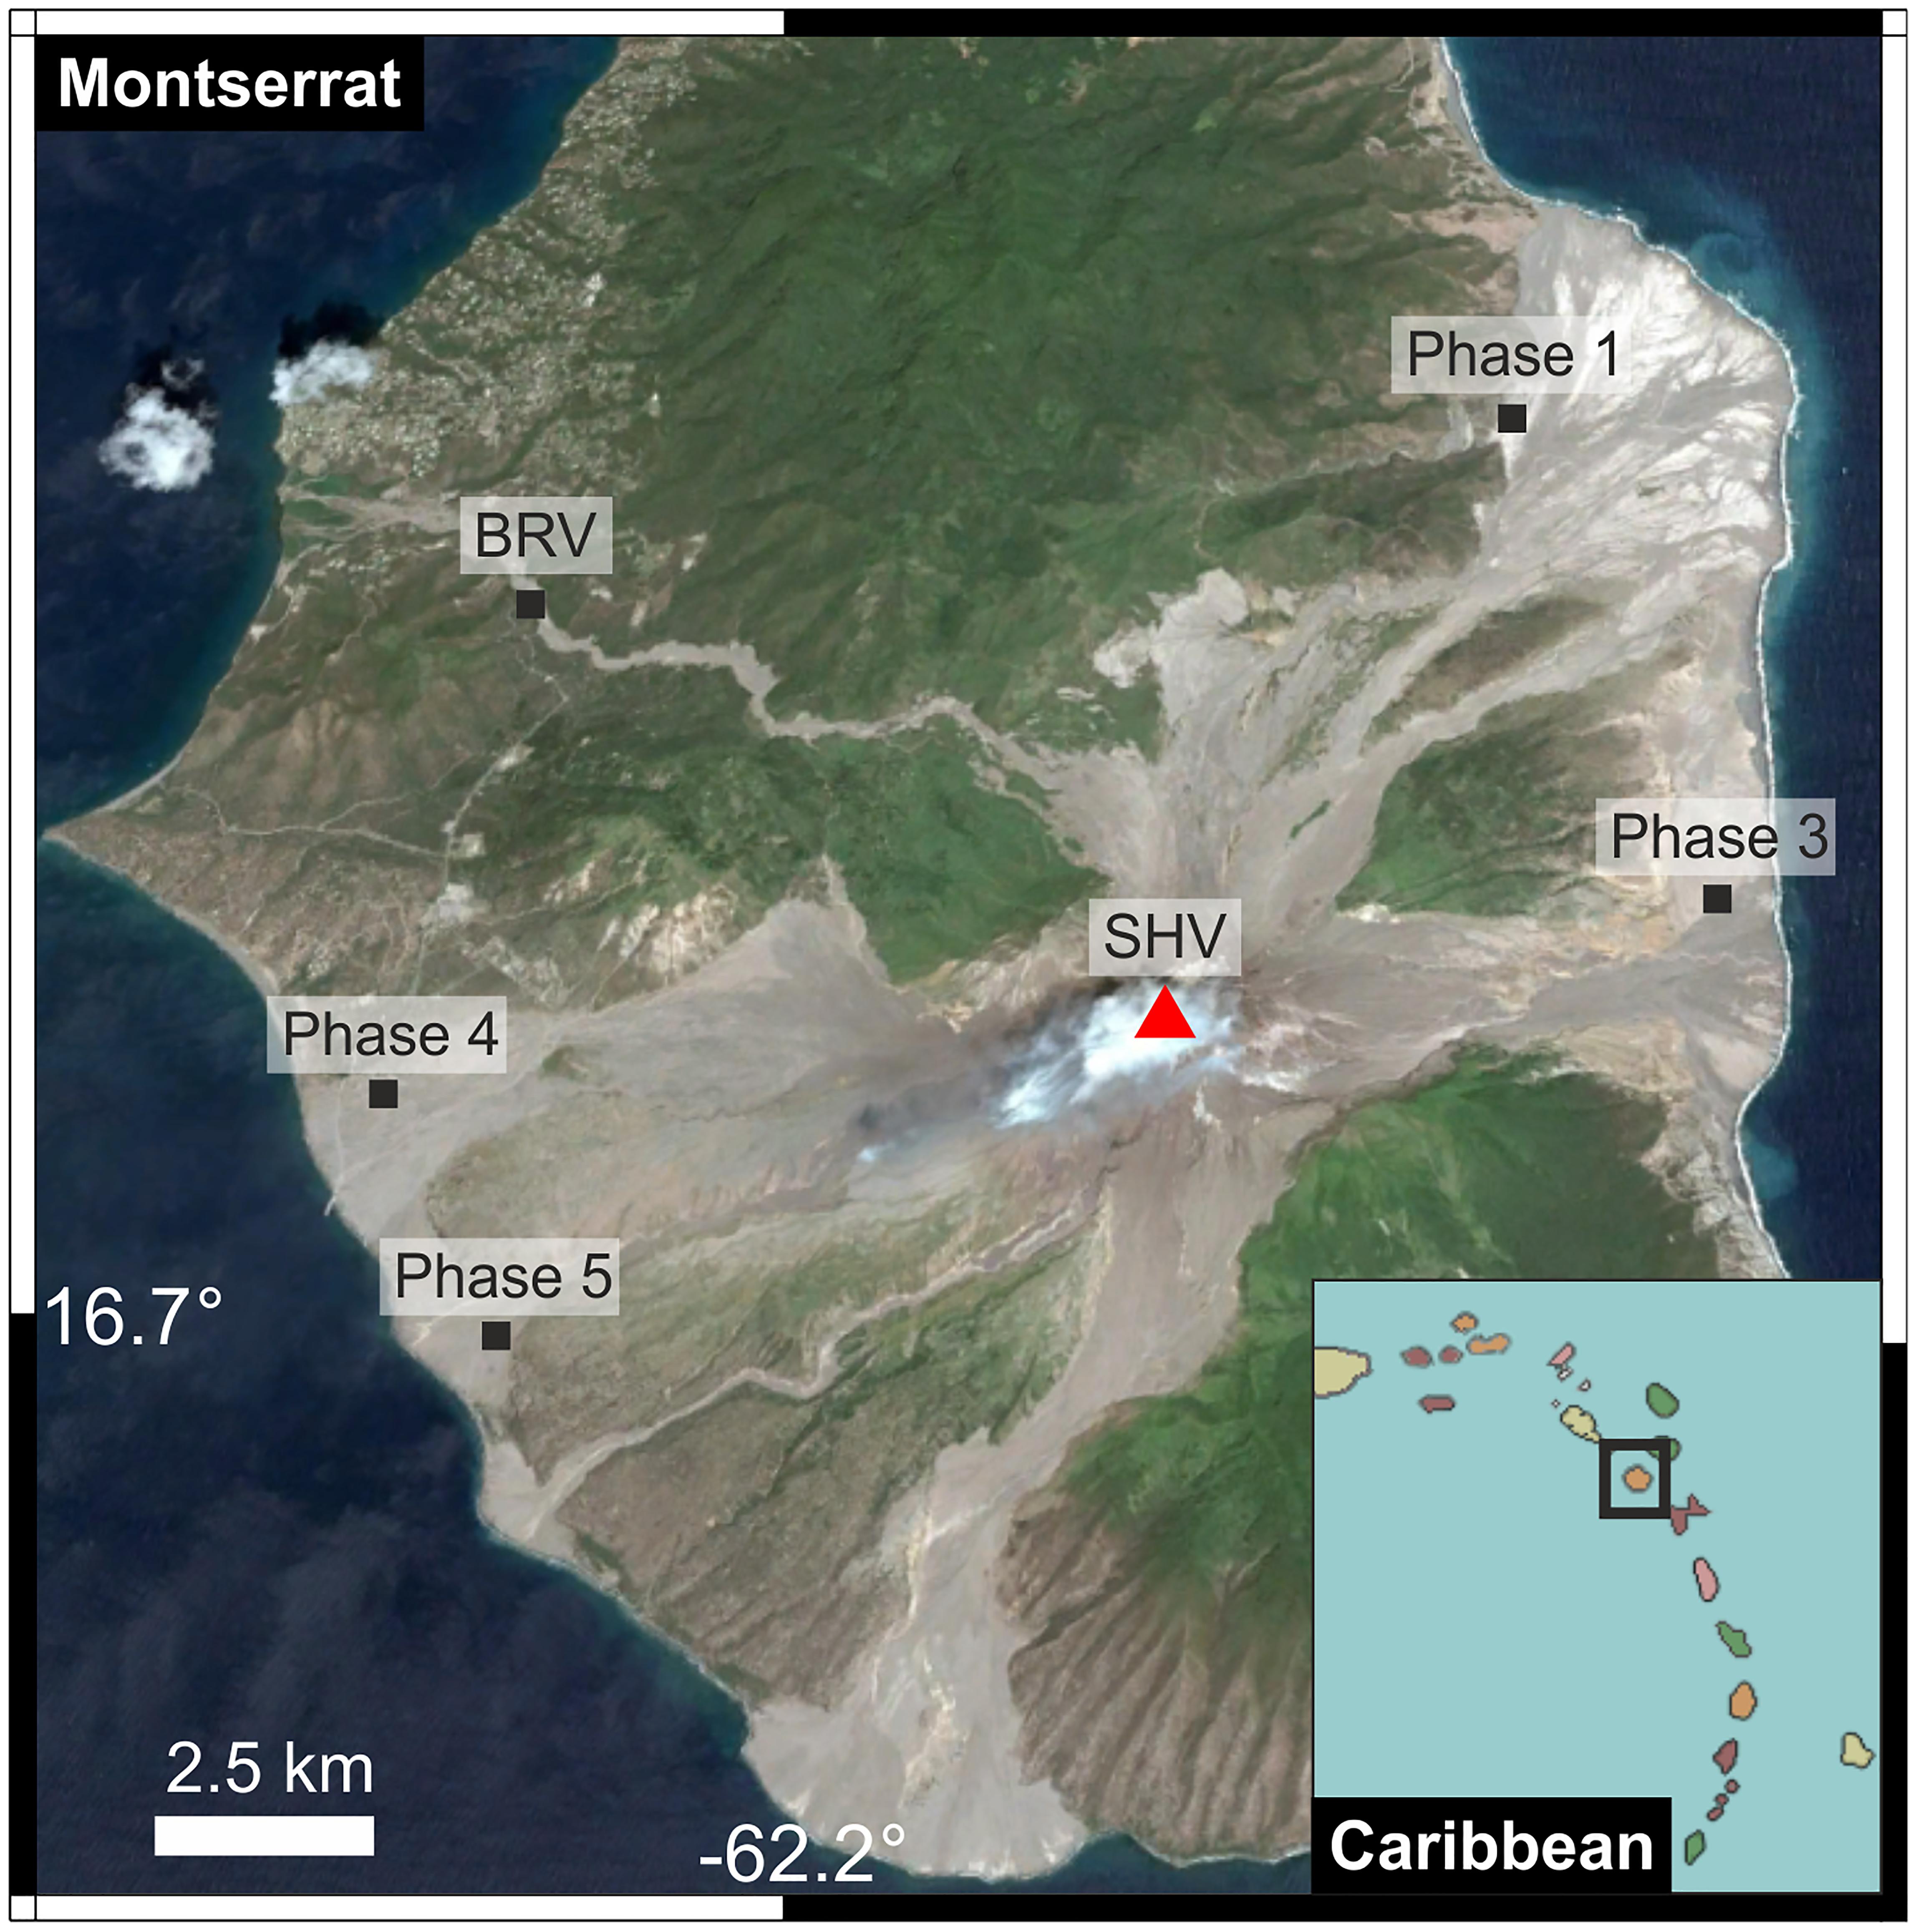
Figure 1. Map of Montserrat showing landscape, including topographic lows where pyroclastic deposits have been channeled. Location of sampling sites shown for each phase. Also marked: Soufrière Hills volcano (SHV) summit (red triangle), and Belham River Valley (BRV; where additional Schmidt hammer testing was carried out). Inset shows location of Montserrat in the Caribbean islands.
Several lava dome collapses occurred throughout the eruptive period, with the largest of these (>107 m3) shown in Figure 2. The end of the last phase of lava extrusion was marked by a major dome collapse on February 11, 2010 (Stinton et al., 2014b). The scale of collapses throughout the eruption ranged from frequent (up to 140 per day) small scale rockfalls (Calder et al., 2002), to larger whole dome collapses such as the total dome collapse on July 12–13, 2003 (Herd et al., 2005).
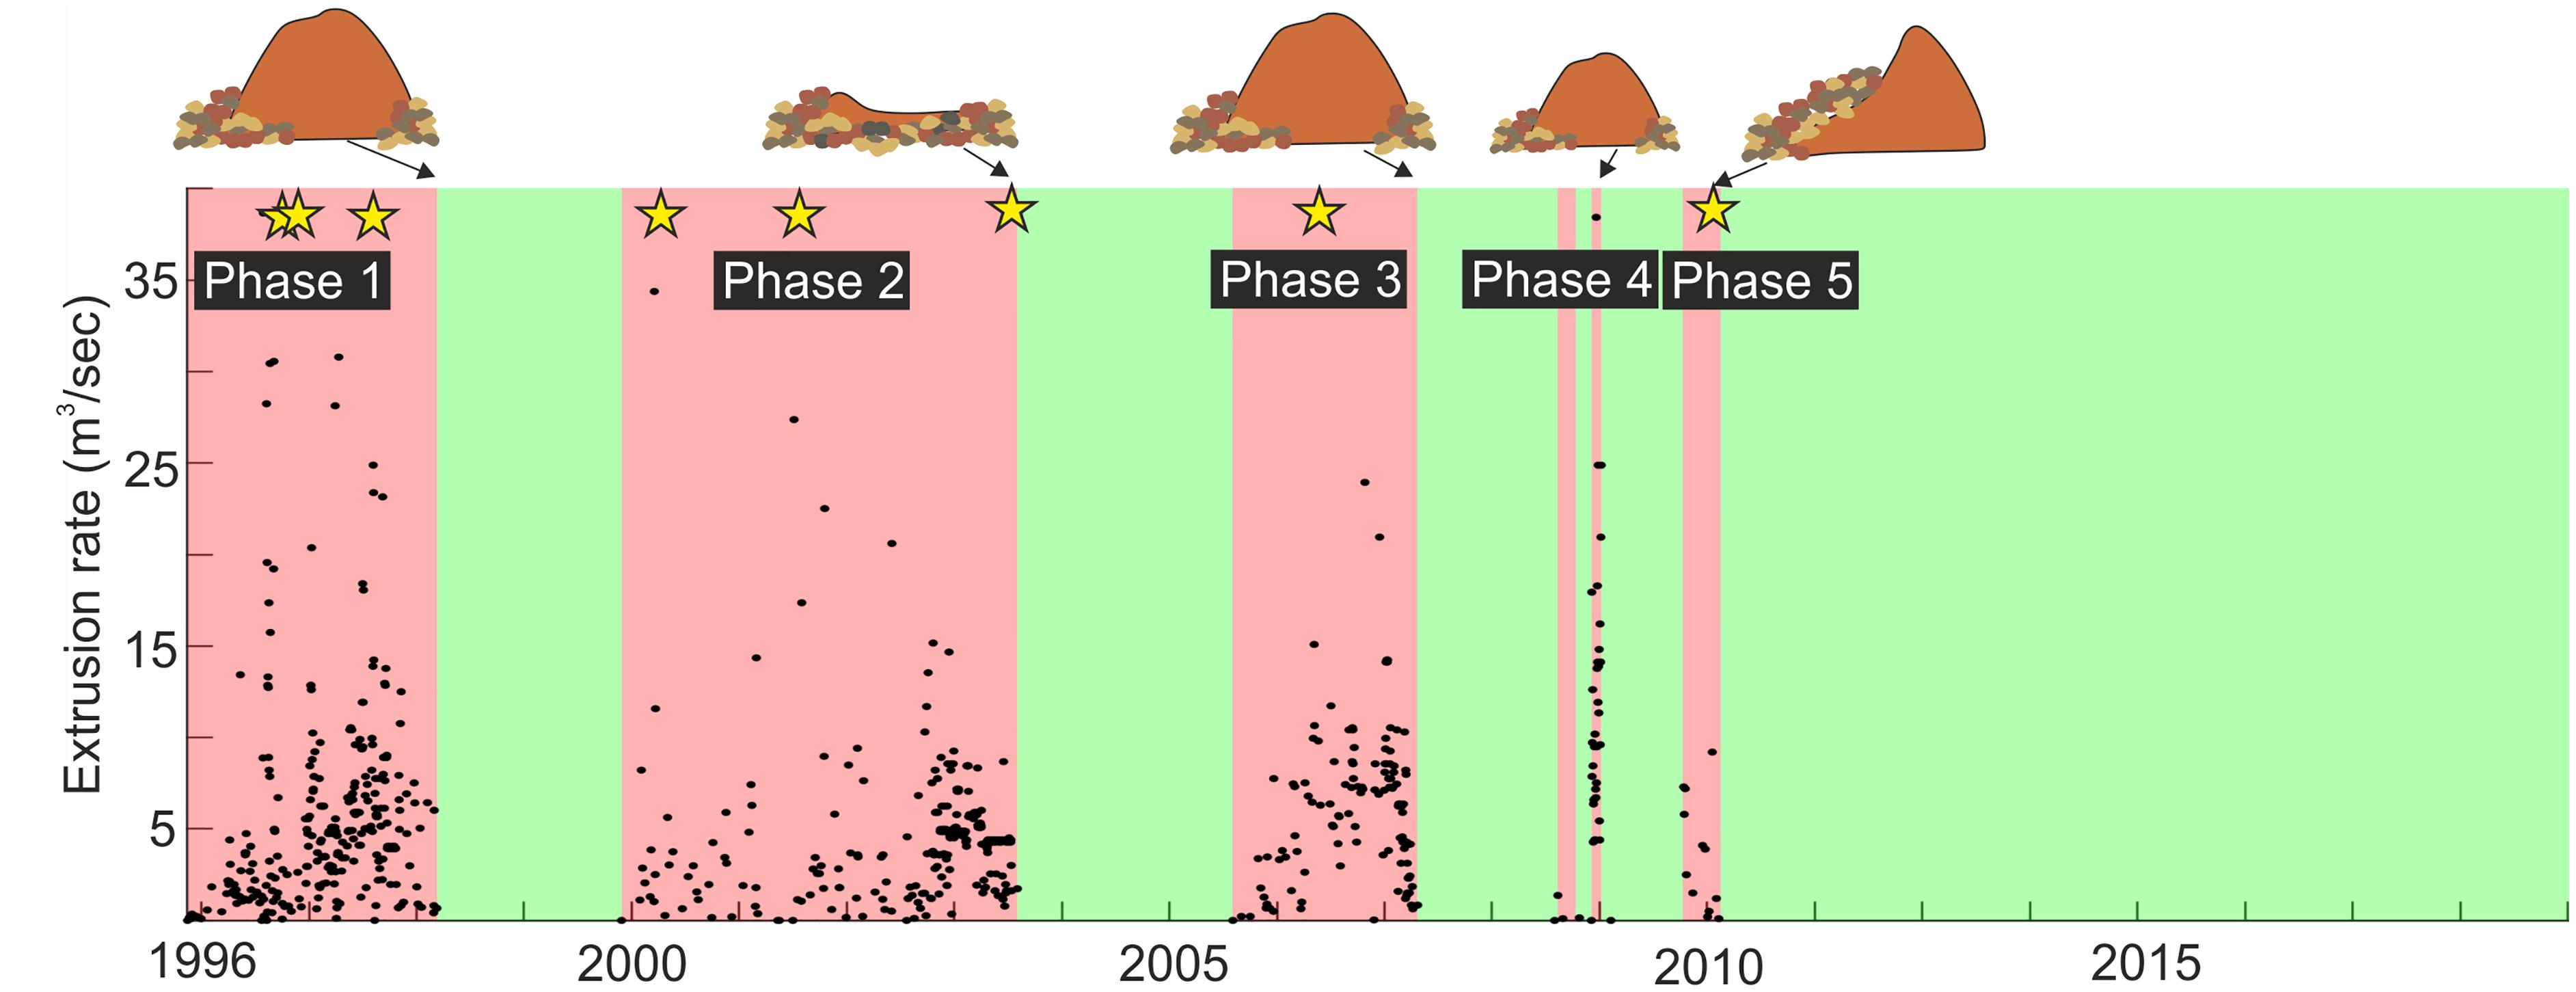
Figure 2. Eruption history at Soufrière Hills, Montserrat. Extrusion rate data shown in black, calculated for Phases 1–4 using erupted volume data from Wadge et al. (2014) and extrusion data for Phase 5 from Stinton et al. (2014a). Red shows eruptive phases, whilst green shows pauses in activity. Annotations show state of the dome at the end of each phase (standing dome with relative size indicated, wholesale collapse, partial collapse), and stars mark major (>107 m3) dome collapses across the eruption.
Petrological studies of products throughout the eruption have shown that SHV has produced lavas of relatively similar composition hornblende-bearing andesites (Humphreys et al., 2010; Christopher et al., 2014; Wadge et al., 2014), with an increasing proportion of mafic inclusions in later phases (Barclay et al., 2010). Long-term petrology across the eruption was explored by Christopher et al. (2014) and although they found systematic changes in Fe-content across time, they concluded that there was no progressive change of bulk composition, with SiO2 content consistently between 56 and 62% throughout the eruption. However, previous studies have documented that geomechanical rock properties of chemically indistinguishable lavas can vary broadly as a result of distinct pore structures (Kendrick et al., 2013; Schaefer et al., 2015; Heap et al., 2016a), local heterogeneities (Farquharson et al., 2016), anisotropy (Bubeck et al., 2017), and post-emplacement alteration (Pola et al., 2014; Siratovich et al., 2014; Coats et al., 2018). We therefore aim to explore how the petrographic textures of the Soufrière Hills products and the temporal variation in these textures affect both rock strength and volcanic behavior, even where there is a narrow range in bulk rock compositions.
The quantity and quality of observations recorded throughout the eruption makes SHV an ideal test site for exploring temporal variability in erupted products, as records of collapse events enable linking of specific pyroclastic deposits to specific eruptive phases.
For this experimental study, seven block samples were collected from different PDC deposits around SHV. Deposits were selected based on the certainty with which the blocks could be tied to not only a particular collapse, but also to ensure the material was erupted during a given eruptive phase. Hence, deposits that were selected occurred in the middle or toward the end of an eruptive phase to avoid sampling rocks that were extruded in previous phases of activity. Samples can be confidently tied to their respective phase due to the directionality of collapse in each case (Table 1). Within each selected deposit, safely accessible blocks were examined and the Schmidt hammer method (detailed below) was employed to gain an overview of variability in material properties in the field. One block was collected from Phase 1, and two blocks collected for each of Phases 3, 4, and 5 (Figure 1). No samples were available for Phase 2 due to inaccessibility, and as the majority of the deposits entered the ocean (Trofimovs et al., 2008).
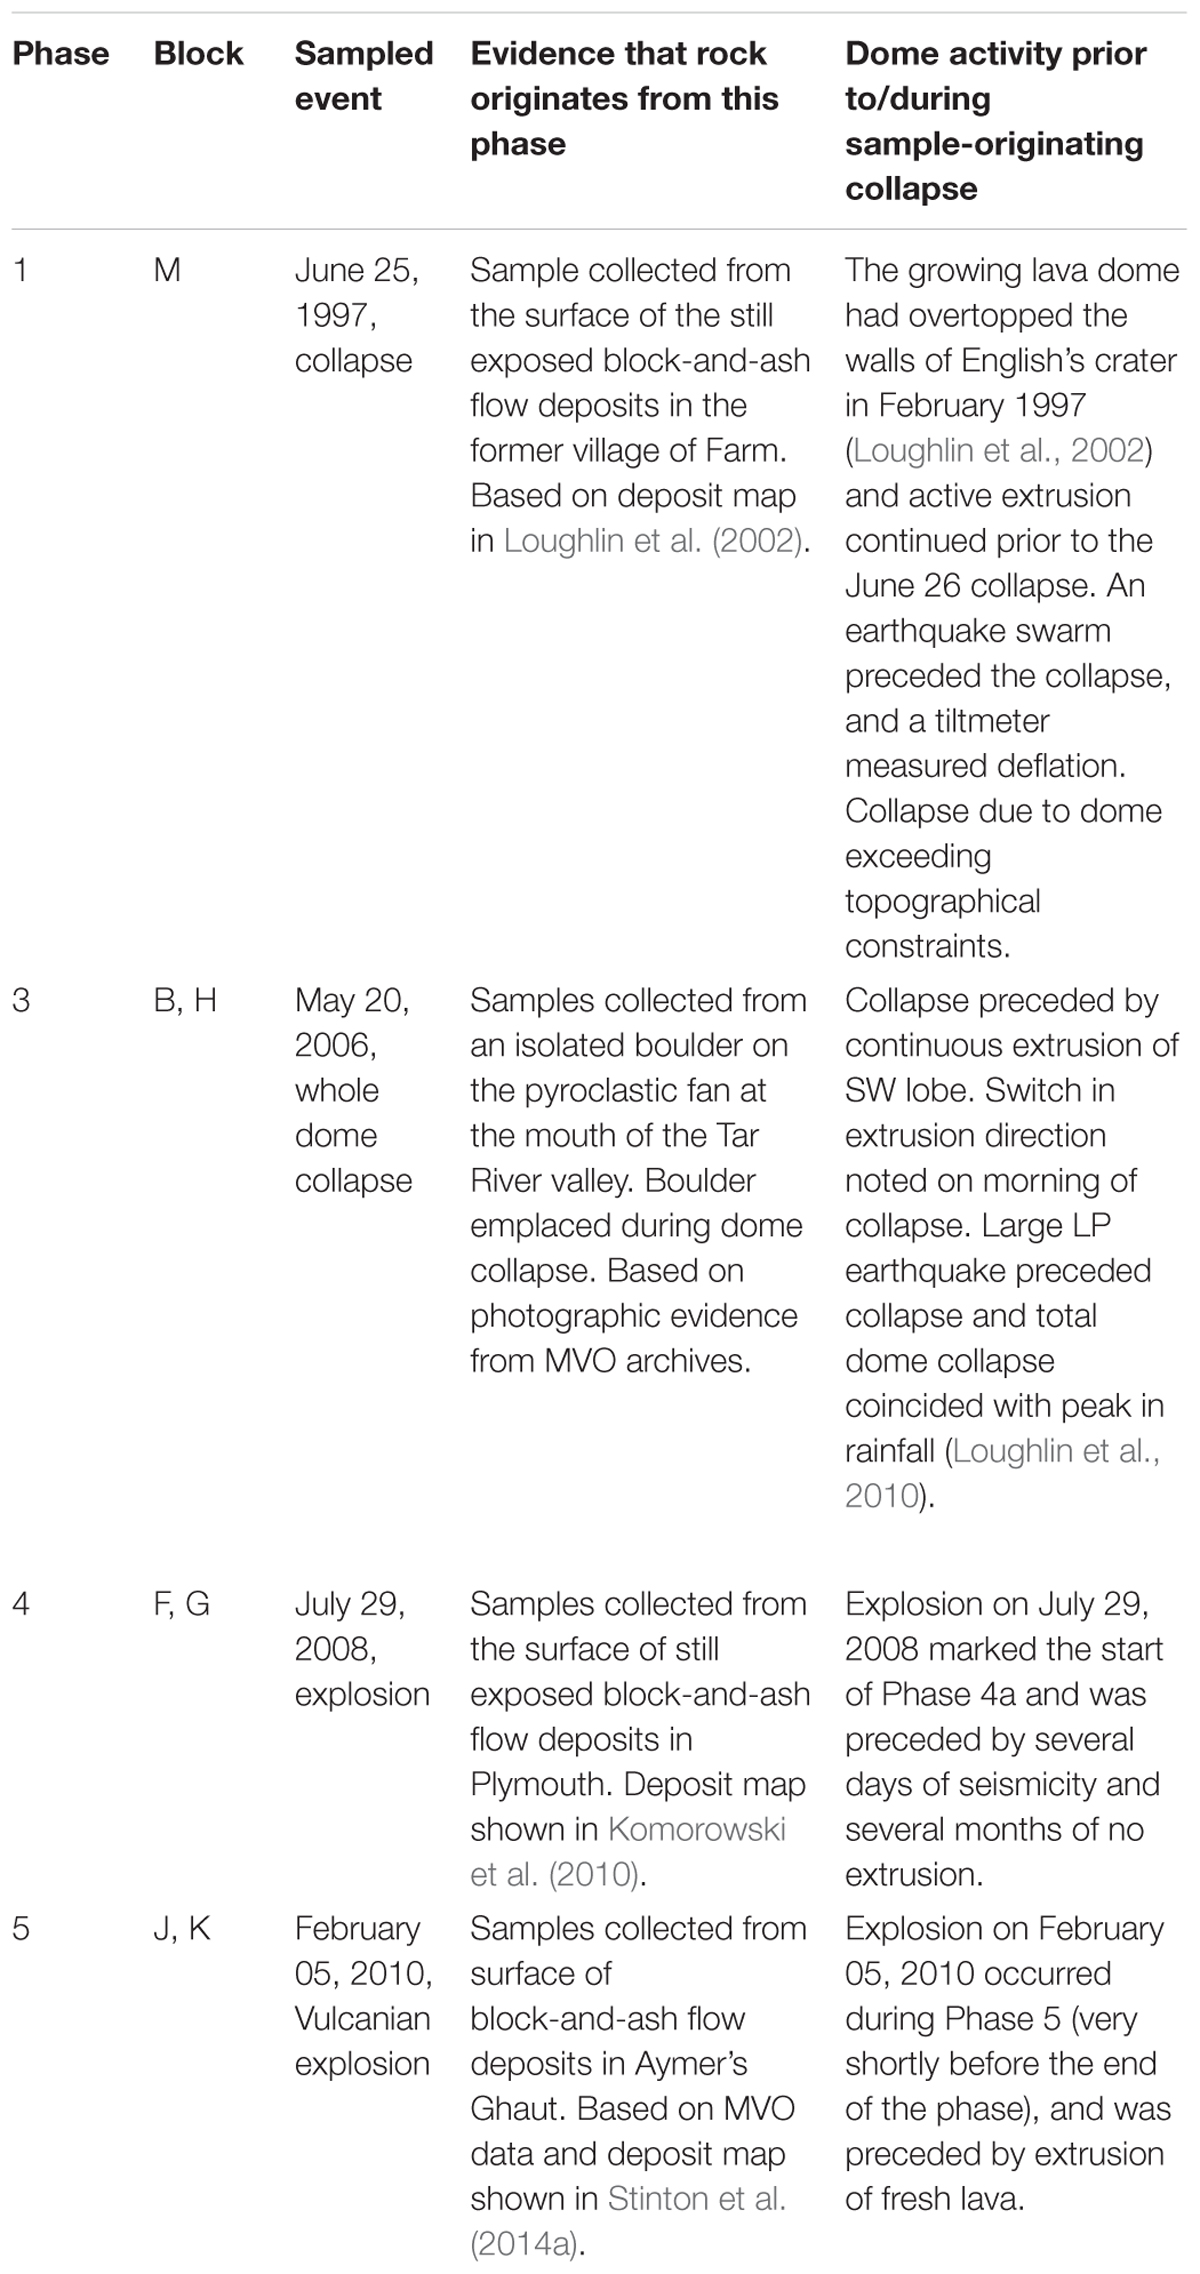
Table 1. Block labels, their respective phase, and evidence that each sample originates from its attributed phase, alongside summaries of dome activity prior to each of the collapses from which samples in this study are collected.
Since the deposition of all samples occurred via PDCs, they are likely to represent the strongest material from each of the phases, as weaker material could have been preferentially broken down by the collapse and transport processes. Whilst we cannot be certain that the material is the most representative of each phase, we present here one of the first temporally-resolved examinations of rock property evolution during an eruption.
From each of the seven blocks collected, cores were prepared with a diameter of 26 mm and were cut and ground parallel to a nominal length of 52 mm for use in porosity and permeability measurements, and for testing in uniaxial and cyclic loading experiments (sample properties provided in Supplementary Table S1). Samples were then oven-dried for at least 12 h at 70°C and thermally equilibrated to ambient conditions before any measurements were performed. All cores were taken at the same orientation within a given block.
One core was prepared from each block with 37 mm diameter and nominal length of 80 mm. The density of these samples (provided in Supplementary Table S1) was calculated using their mass and sample dimensions, and these samples were used for testing in cyclic loading experiments to determine Young’s modulus.
From each of the 7 blocks, 37 mm diameter by ∼18 mm thick disks were also prepared for use in Brazilian tensile strength tests (Supplementary Table S2). These samples have an approximate aspect ratio of 1:2 as recommended by ISRM and ASTM.
Sub-samples of each block were taken from offcuts of these cores and set in epoxy, in the same orientation as the cores were prepared. Thick sections were created for mineralogical and textural characterization by polishing and carbon coating the epoxy-mounted samples.
Mineralogical and textural analyses were performed on the prepared thick sections. The variation in phase abundances across the sample range was quantified using QEMSCAN (Quantitative Evaluation of Minerals by Scanning electron microscopy) at the University of Liverpool. The QEMSCAN is an automated SEM-EDS (scanning electron microscopy/energy dispersive X-ray spectroscopy) system manufactured by FEI Company.
The QEMSCAN uses a 15 kV electron beam to produce X-ray spectra which provide a semi-quantitative chemical map of the different phases, here at a resolution of 10 μm over an average area of 10.5 mm by 10.5 mm. The identified chemical compositions are compared to known compositions stored in a reference library. Additional mineral and glass chemistry definitions are manually added to the supplied database to ensure all chemical compounds are recognized. Crystallographic features are not discriminated by QEMSCAN, and so polymorphs of the same composition cannot be differentiated (for example, quartz and cristobalite would both be classified as “silica polymorphs” by QEMSCAN processing). We then used the iDiscover software to create color images showing the distribution of mineral phases, and used this data to determine the normalized mineral abundances of the sample as area-percentages.
The Schmidt hammer is a portable, hand-held instrument originally designed for non-destructive index testing of concrete. It records the rebound height of a spring-loaded mass to indicate material strength (Torabi et al., 2011); this ‘rebound value’ can be correlated to various mechanical properties such as uniaxial (unconfined) compressive strength and Young’s modulus (e.g., Deere and Miller, 1966; Yasar and Erdogan, 2004). Schmidt hammer testing has previously been used on volcanic rocks (e.g., Dinçer et al., 2004; Del Potro and Hürlimann, 2009) and provides a method of collecting in situ data where outcrop accessibility is problematic. In this study, we used an L-type Schmidt hammer to carry out field testing in accordance with the International Society of Rock Mechanics (ISRM) guidelines (Ulusay and Hudson, 1979). The Schmidt hammer rebound values (RL) were corrected for angle of testing where necessary, following the normalization procedure set out by Basu and Aydin (2004); this often results in non-integer rebound values. The Schmidt hammer was calibrated using a steel anvil, which gave a RL value of 72. Hard rocks such as granites generally have high RL values of >50, whereas softer rocks such as chalk are likely to have a RL value < 30 (Katz et al., 2000; Ericson, 2004; Goudie, 2013).
We present results of Schmidt hammer tests on 24 blocks, measured during a field campaign in January 2016, from deposits where the eruptive phase is known (4 from Phase 1, 3 from Phase 3, 9 from Phase 4, and 8 from Phase 5). These tests were carried out at the same locations as sample sites (Figure 1), but on blocks exceeding 30 cm in all dimensions and therefore these were not collected for laboratory experimentation. We therefore consider the Schmidt hammer data a verification of the collected blocks. We also present results from 28 Schmidt hammer tests on samples located in Belham River Valley (BRV); these cannot be attributed to a specific phase, but from collapse direction information we can determine that these boulders were emplaced during Phases 3–5. This gives additional constraint of the range of expected values.
Permeability and porosity were determined for all 26 mm diameter cores. The density of each core (ρrock) was determined by measuring its mass and volume, and calculating the ratio between the two (Supplementary Table S1 and Supplementary Figure S1). Connected porosity was determined for each core using a helium pycnometer (Micromeritics AccuPyc II 1340), providing sample void volumes with an accuracy of 0.1%. Total porosity was also determined for each of the seven blocks by creating a powder of the rock sample and measuring its density (ρpowder). Total porosity exceeds connected porosity as it includes calculation of isolated pores that could not be accessed by helium during pycnometry. Total porosity (ϕT) is calculated using:
Permeability was measured using a benchtop GasPerm permeameter developed by Vinci Technologies. We measured permeabilities of 49 samples using nitrogen as permeating fluid and by imposing a flow rate that created, depending on the permeability of the sample, a minimum pressure differential (ΔP) between the inflow and outflow of 0.5 psi (0.0035 MPa). Measurements were made on each sample at three confining pressures. The confining pressure was held constant at each of 100, 200, and 300 psi (0.7, 1.4, and 2.1 MPa) for the duration of the measurement. In cases where Darcian conditions were not achieved (i.e., the flow rate resulted in too high ΔP and turbulent flow/gas slippage in the porous medium), we applied Klinkenberg and Forchheimer’s corrections to retrieve the equivalent Darcy permeability.
Uniaxial compressive strength (UCS) testing was carried out at ambient (room) temperature on one sample from each block (7 total) using 26 mm diameter samples (for which permeability and porosity had already been determined). The cores were loaded axially at a constant strain rate of 10-5 s-1 using a 5969 Instron uniaxial benchtop press with a 50 kN load cell at the Experimental Volcanology and Geothermal Research Laboratory at the University of Liverpool. The measured axial displacement was corrected to subtract the compliance of the apparatus (i.e., pistons and frame) during loading. While one sample from each block was loaded to failure to measure the compressive strength, we established the repeatability of the mechanical data of the materials by determining Young’s modulus using 22 stress cycling experiments (see Section “Cyclic Experiments”), as higher Young’s modulus relates to higher peak strength (e.g., Schaefer et al., 2015).
Indirect tensile strength was measured using the Brazil testing method (Ulusay and Hudson, 1979), in which a compressive load is applied diametrically to the curved edge of a cylindrical, disk-shaped rock sample. This is a commonly used method to induce tensile failure due to the logistical difficulty of measuring direct tensile strength (Perras and Diederichs, 2014). Tensile strength, σt, is calculated using the following formula:
where P is the applied load (N), D is sample diameter (m), and L is sample thickness (m).
In total, 66 samples were prepared at 37 mm diameter (with aspect ratio of 1:2 to meet ISRM standards), and were loaded at a constant deformation rate of 0.0037 mm/s (equivalent diametric strain rate of 10-4 s-1), again using the Instron uniaxial press in the Experimental Volcanology and Geothermal Research Laboratory at the University of Liverpool.
The UCS tests were used to inform the cyclic loading tests by defining a threshold of 50% peak stress for each sample type. Cyclic loading experiments were then performed on 22 cores of 26 mm diameter, and 7 cores of 37 mm diameter (both with 2:1 aspect ratio); the samples were axially loaded to this threshold at a constant strain rate of 10-5 s-1, and then unloaded at the same rate. This was performed to examine the repeatability of the stress-strain response to loading, and to calculate elastic moduli. By loading only to 50% of peak stress, we considered the rock to behave purely elastically (Walsh, 1965; Nihei et al., 2000; David et al., 2012), and therefore assumed that no lasting damage was done to the sample and that it could rebound and recover deformation.
Young’s modulus (E) is a key parameter in volcanic modeling (Hale et al., 2009a,b; Husain et al., 2014; Harnett et al., 2018). Young’s modulus is traditionally an elastic parameter, defined in GPa, and although these rocks do not behave in a purely linear elastic manner throughout compression, the stress-strain response is linear following crack-closure and prior to damage accumulation (e.g., Heap and Faulkner, 2008). Here, to fall confidently within this regime we consider the linear portion of the curve as between 40 and 50% of peak rock strength. Therefore for all 29 cores with 26 mm diameter and 7 cores with 37 mm diameter, we calculate Young’s modulus within this range. Following ISRM guidelines (Ulusay and Hudson, 1979), we calculate the Young’s modulus using:
where σ is stress and ε is strain, at a given percentage of peak rock strength (denoted by the subscript).
QEMSCAN analysis illustrates mineral assemblages and their relative abundance in each of the samples. An exemplar rock from each of Phases 1, 3, 4, and 5 is shown in Figure 3, with the remaining rocks from this study shown in Supplementary Figure S2, and backscattered electron images shown in Supplementary Figure S3. In addition to color images showing the mineral distribution and texture in each sample, a grayscale image shows the pore structure highlighted in black.
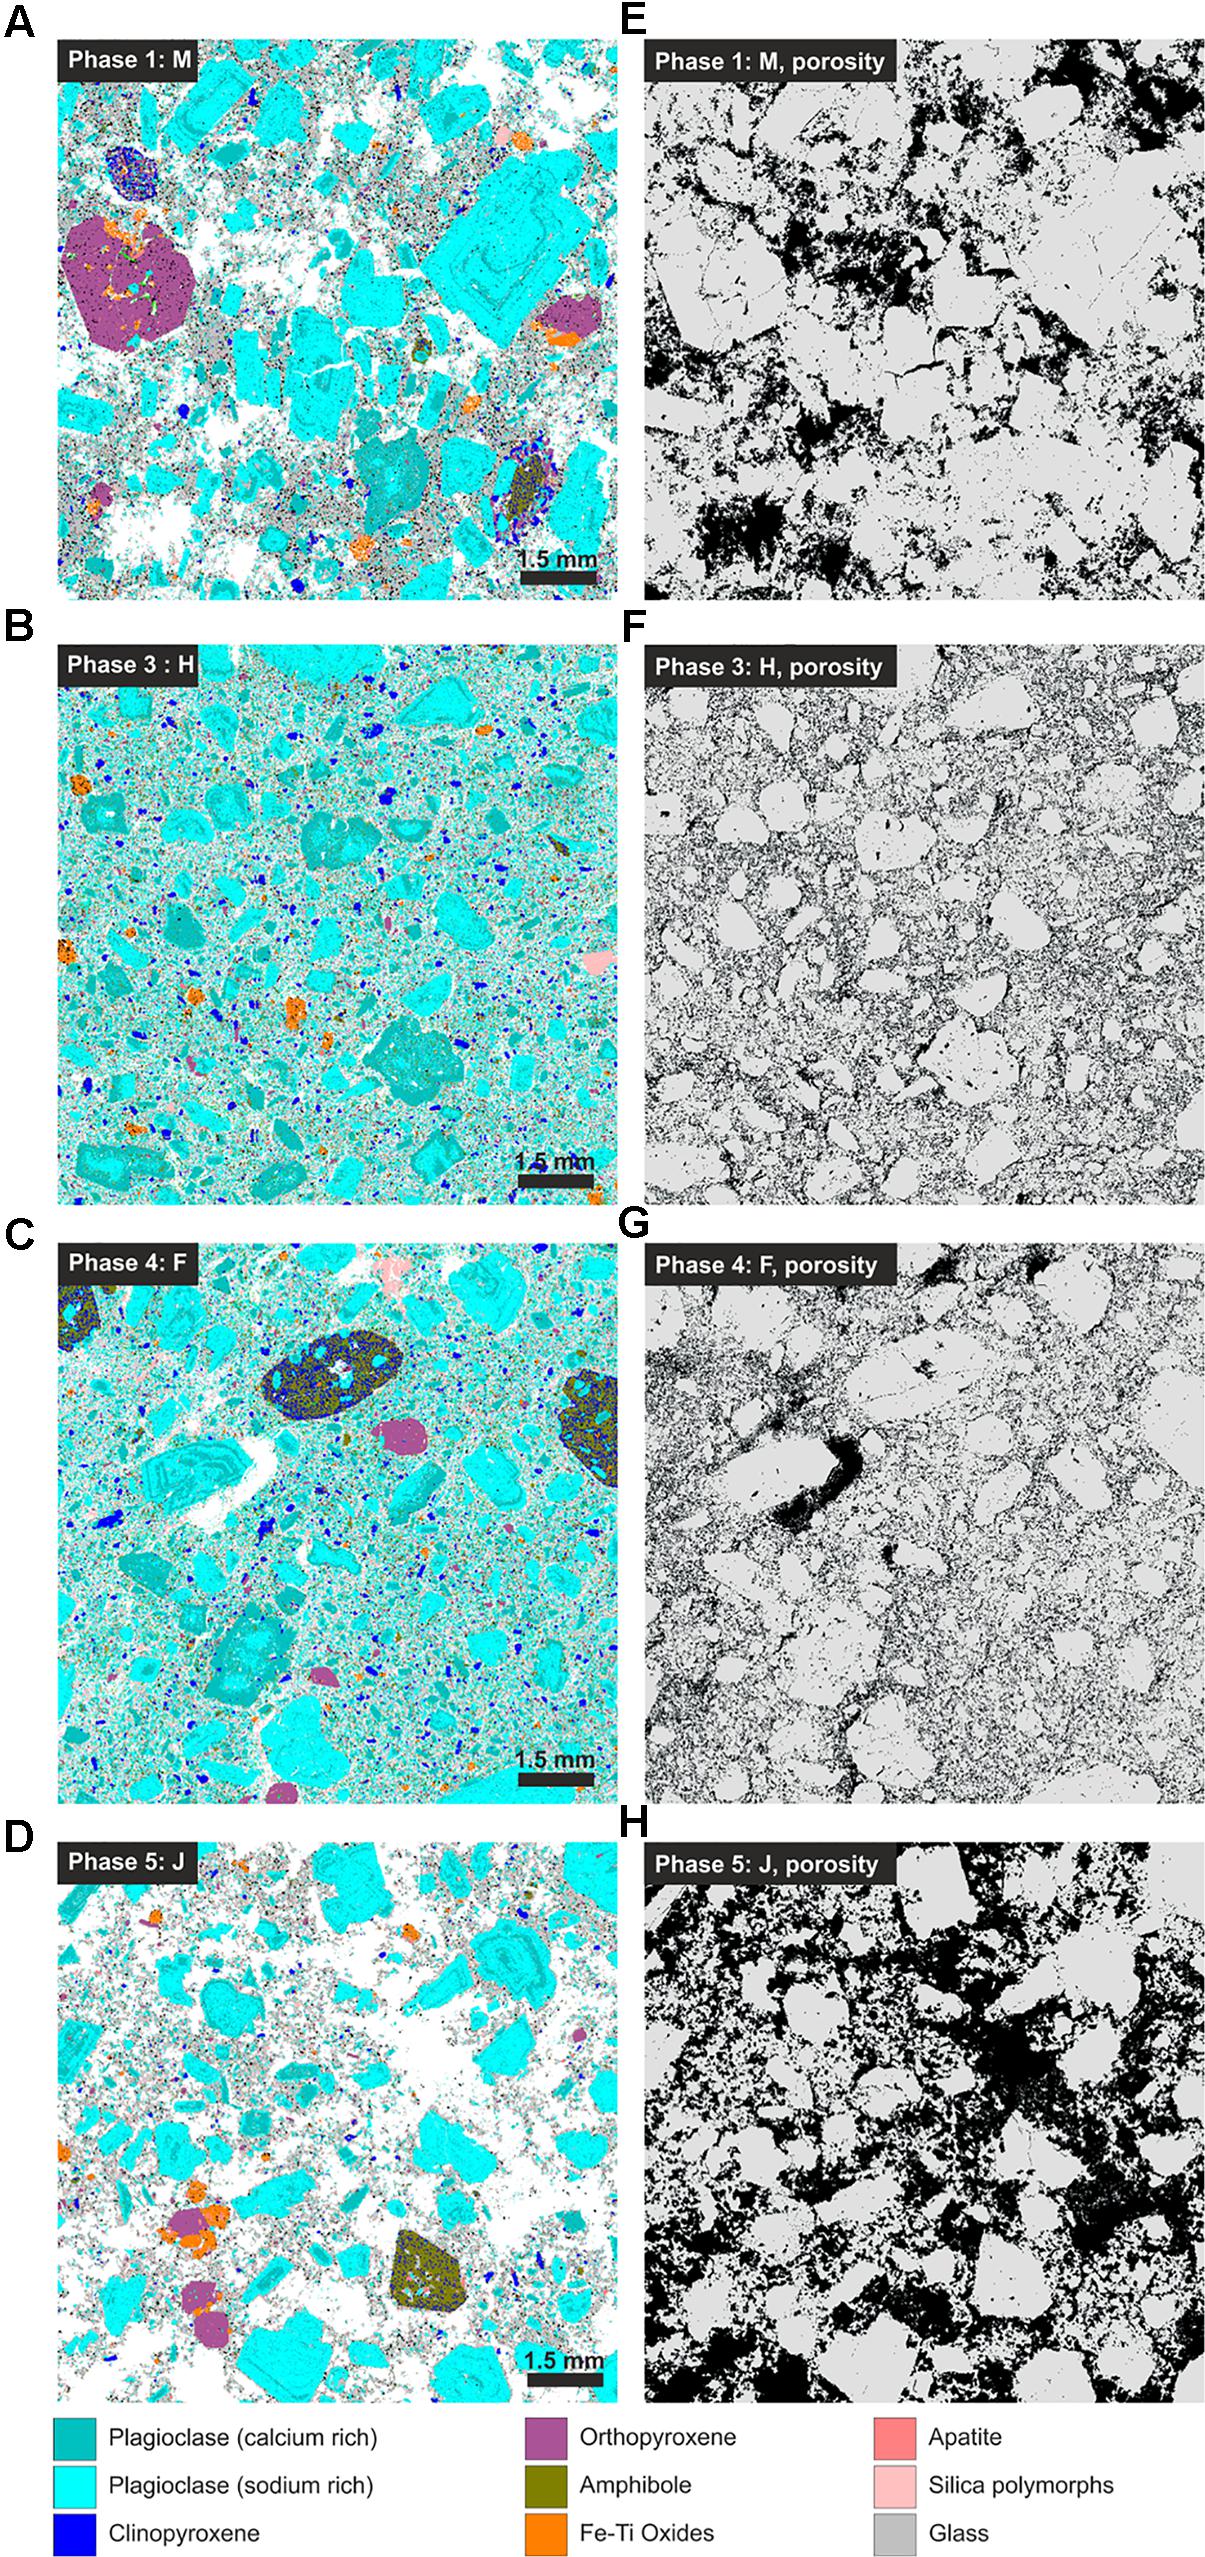
Figure 3. (A–D) QEMSCAN images showing mineral assemblage in one sample from each phase (other samples provided in Supplementary Figure S2) – the mineralogical key is shown below the images, with white used to portray the pore space. See Table 2 for full mineral phase analysis; (E–H) pore distribution in one sample from each phase (other samples provided in Supplementary Figure S2) using processed QEMSCAN images with solid fraction shown in gray, and all porosity in black. Samples from Phases 3 and 4 are denser, with evenly distributed pore-space, whereas samples from Phases 1 and 5 have higher pore content and show pore-localization and a high connectivity. Backscattered electron images for the same samples are shown in Supplementary Figure S3.
We explore mineral abundance within the sample suite, and show the area percentage calculated from QEMSCAN imagery of interstitial glass combined with silica polymorphs, and plagioclase (separated into calcium-rich and sodium-rich; Figures 4A,B). Percentages for all mineral components as a proportion of the solid phase in all samples are shown in Table 2. Plagioclase is dominant across all samples, totaling between 42.5 and 56.1% with zoned crystals evident in all samples (Figure 3). Slight increases in solid fraction total plagioclase content in Samples H and F (Phases 3 and 4) correspond to overall increase in crystallinity of these samples, and as such, slight depletions in total glass and silica polymorph phases (Figure 4). There is a higher proportion of interstitial glass compared to silica polymorphs in Samples M and J (Phases 1 and 5) compared to Samples H and F. The “glass” that is identified by QEMSCAN consists of fine-grained mesostasis which may comprise fine grains of various compositions that are smaller than the X-ray interaction volume of the QEMSCAN instrumentation; it thus may not necessarily represent the mechanical and rheological properties of quenched interstitial melt. Amphiboles are mostly in the form of pseudomorphs of break-down products, and clusters of pyroxene. Clinopyroxene is more dominant than orthopyroxene, particularly in Samples H and F. Oxides are rare in all samples, and generally occur in the form of micro-phenocrysts.
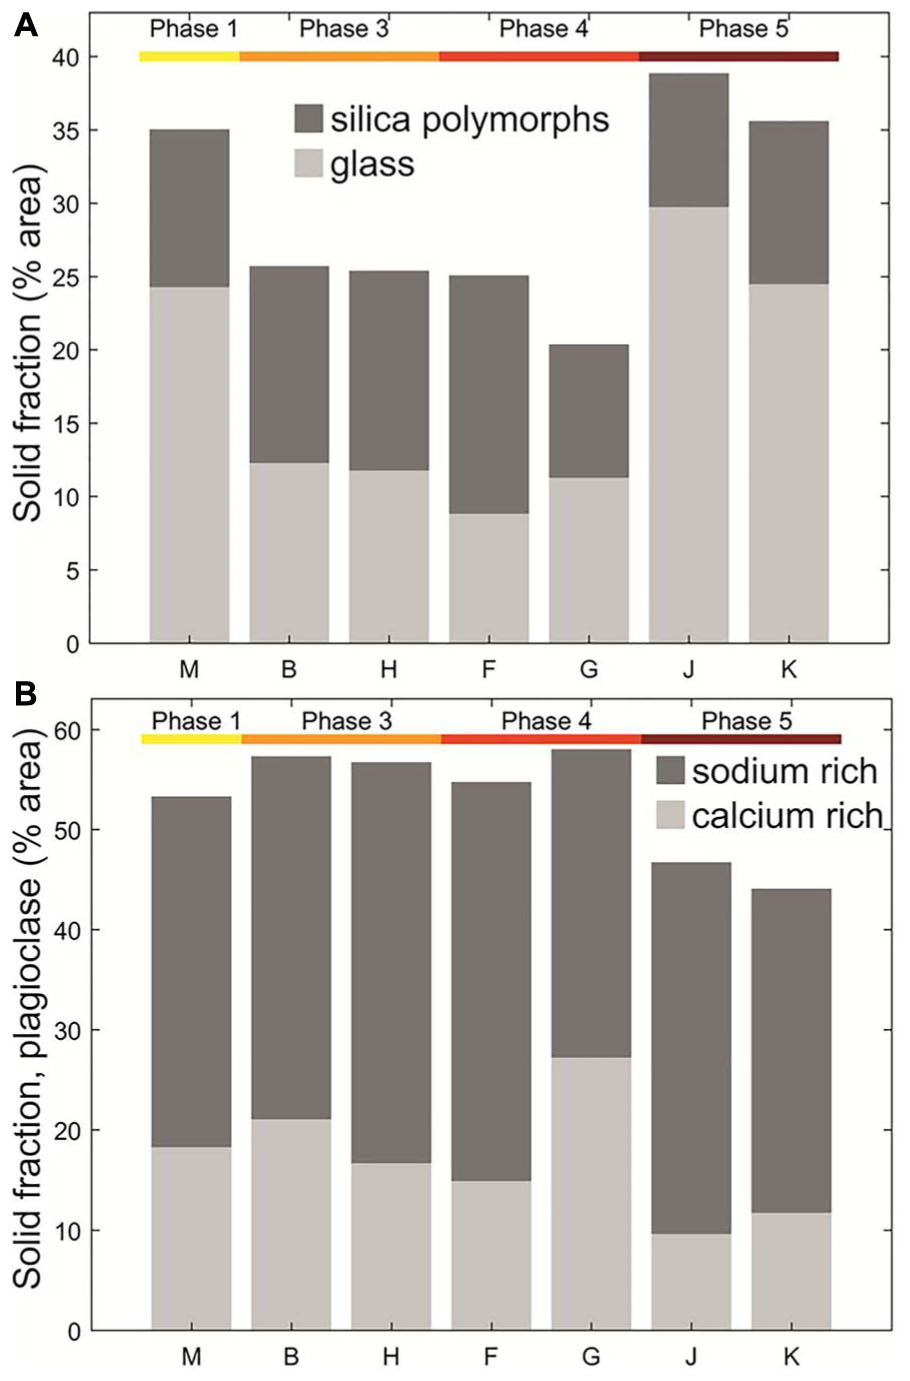
Figure 4. Abundances of (A) glass and silica polymorphs, the remaining solid fraction is composed of the primary minerals (crystallinity, Table 2); (B) plagioclase – both sodium rich and calcium rich; shown as percentage area, calculated from 10 μm resolution QEMSCAN images (shown in Figure 3 and Supplementary Figure S2), and Phase indicated by horizontal bars at the top of each plot.
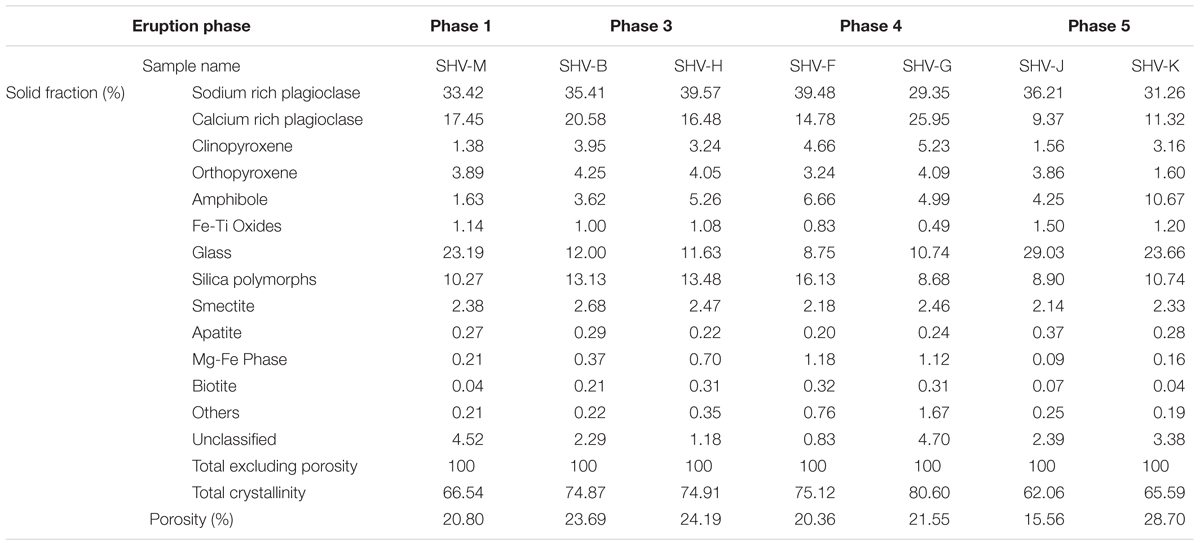
Table 2. Quantitative analysis of mineral phases present in each sample, calculated as a percentage area of the solid fraction, and porosity as % of total area, using the 10-μm resolution QEMSCAN analysis of a 10.1 mm × 10.1 mm area.
In addition to having lower crystalline fractions (i.e., more glass and silica polymorphs), Samples M and J also have larger, more heterogeneously distributed pore spaces. Porosity is greatest in Sample J (Table 3), and comprises vesicles in between crystals whereas in samples from earlier phases (e.g., Samples H, F), much smaller pore spaces are found within the groundmass. Overall, QEMSCAN analysis shows low variability in the componentry and the mineralogical assemblage throughout the samples tested.
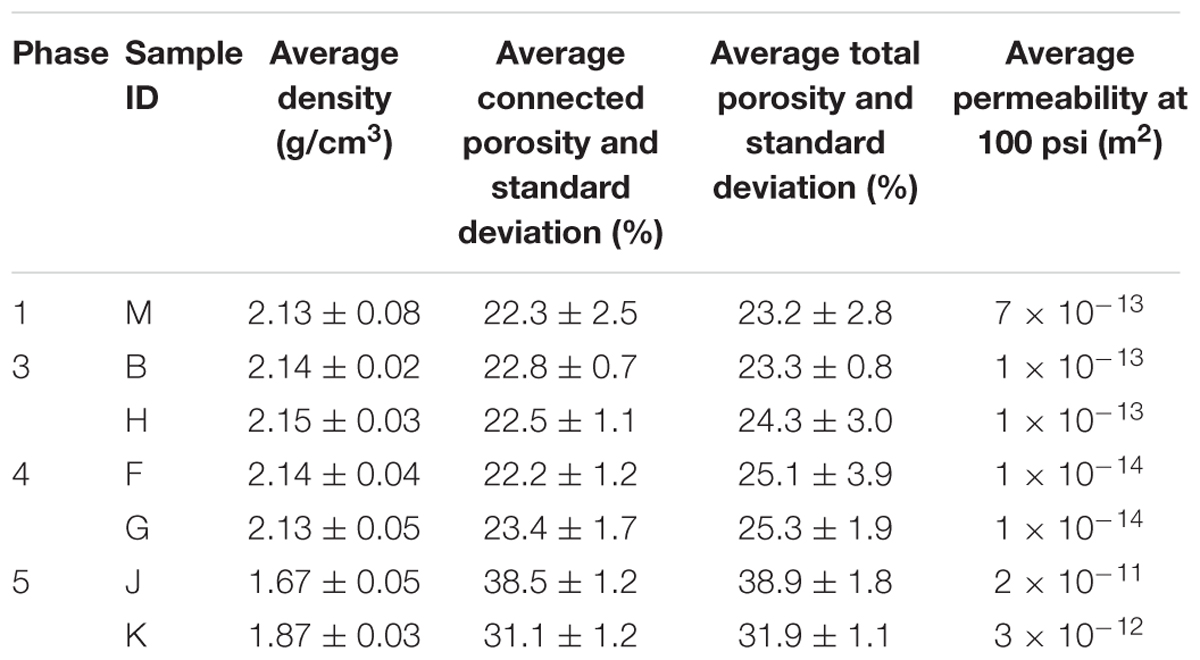
Table 3. Physical properties calculated for each sample, using the following methods: (a) average density, measured using a helium pycnometer and the standard deviation for each block; (b) connected porosity: measured using a helium pycnometer and the standard deviation for each block; (c) total porosity, calculated by measuring the density of a powder and using Equation (1) and the standard deviation for each block; and (d) permeability, measured at 100 psi using the GasPerm permeameter.
We present the results of 52 Schmidt hammer tests (Figure 5), both on blocks from known eruptive phases, and from a random selection of blocks in BRV. The data show that blocks from Phase 5 appear to be the weakest (average RL = 26.4). Samples from Phases 1, 3, and 4 exhibit similar Schmidt hammer results, with average rebound values of 34.5, 39.7, and 37.4, respectively (Figure 5A; raw values given in Supplementary Table S3).
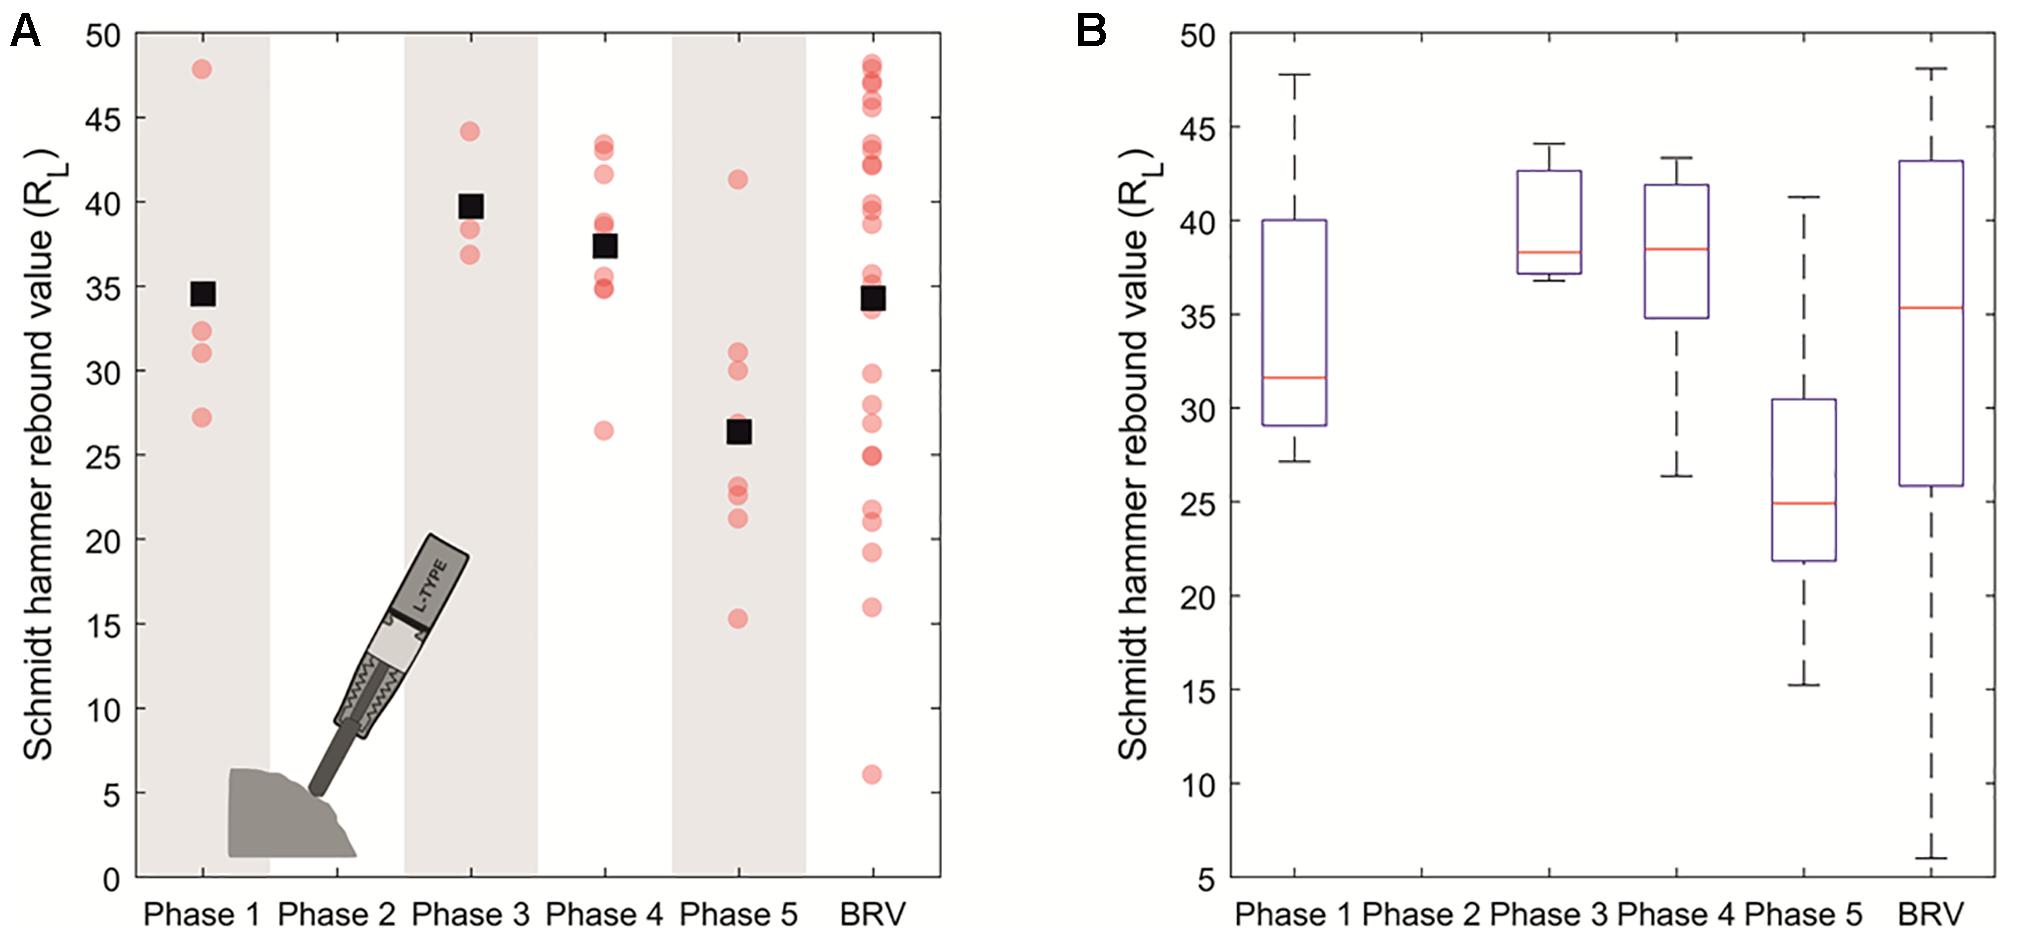
Figure 5. (A) Schmidt hammer rebound value (RL) results from field testing at sampling locations for Phases 1, 3, 4, and 5. Belham River Valley (BRV) results show values obtained on a random selection of blocks from Phases 3, 4, and 5. Raw data shown by circles, with the mean RL for each phase shown by a square; (B) box plot diagram to show median (red line), mean (black squares), 25th and 75th percentiles, and range for Schmidt hammer rebound values from each phase. Results from BRV span the overall range in values seen in other phases and highlight that Phase 5 material is the weakest of the erupted products tested, although the maximum RL across all phases is similar.
The Schmidt hammer rebound values from all of the samples from known eruptive phases have a range of 32.6 from 15.2 to 47.8. The ranges within each phase are 20.6 (Phase 1), 7.3 (Phase 3), 17.0 (Phase 4), and 26.0 (Phase 5); the rebound values from the random boulders in the BRV have a range from 6.0 to 48.1 (a spread of 42.1), showing a similar distribution to that of the temporally-constrained blocks. Assuming there were no systematic variations in rock strength across time, the same variation would be found within the samples from each phase. However, the difference between the spread of randomly sampled blocks (42.1) far exceeds the difference within blocks attributed to a particular phase (max RL = 26.0 for Phase 5). However, the 25th–75th percentiles of the entire dataset span a relatively narrow range of 21.8 to 42.6, highlighting that the extremes of these values represent rarer outliers (Figure 5B).
Connected porosities extend from approximately 20–40% across all samples (Figure 6A and Table 3), with ranges for Phases 1, 3, 4, and 5 of 8.2, 3.3, 4.9, and 11.0%, respectively (all values of both connected and total porosity provided in Supplementary Table S1). Sample M (Phase 1) has an average connected porosity of 22.8% and an average total porosity of 23.2%. Samples B and H (Phase 3) have very similar porosities to Sample M, with an average connected porosity of 22.6% and a slightly higher average total porosity of 23.8%. Samples F and G (Phase 4) have similar connected porosities with an average of 22.8%, but a higher average total porosity of 25.2%, showing the existence of more isolated pores. Samples J and K (Phase 5) have a noticeably higher porosity than all of the other measured samples, with an average connected porosity of 34.8% and few isolated pores, giving an average total porosity of 35.4%.
Figure 6. Physical properties of 26 mm cores from eruptive Phases 1, 3, 4, and 5: (A) connected porosity evolution and (B) gas permeability evolution throughout the eruption; (C) permeability as a function of porosity for all samples. Results show that porosity is consistent between Phases 1, 3, 4, and increases in Phase 5, whereas permeability systematically decreases from Phase 1 through to Phase 4, and then increases in Phase 5. Phases 1 and 5 follow a near-continuous trend on the porosity-permeability plot, while Phases 3 and 4 plot distinctly, suggesting contrasting pore morphology and connectivity.
Similarly, the density of the 26 mm samples varies from 1.61–2.22 g/cm3, with average densities for Phases 1, 3, 4, and 5 of 2.13, 2.14, 2.14, and 1.76 g/cm3, respectively. The density values for Samples M, B, H, F, and G are very similar (as observed for porosity), with a clear decrease in density in Samples J and K. The relationship between density and porosity is broadly linear (Supplementary Figure S1), although deviation from linearity results primarily from the varied abundances of isolated pores.
Permeability across all samples ranges from 10-15 to 10-11 m2 (Figure 6B and Table 3), and relates non-linearly to the connected porosity (Figure 6C; all values of permeability are provided in Supplementary Table S1). Tight clustering is to be expected within one rock sample (e.g., Schaefer et al., 2015), but permeability also remains very consistent between two different blocks attributed to the same eruptive phase (Figures 6B,C), even with increased confining pressure (Supplementary Figure S4). The difference between the permeabilities of samples from each phase is therefore determined to be greater than the variation expected from natural heterogeneity within one block. In the tested samples there is a systematic decrease in permeability from Phases 1 to 4 (Table 3), and Phase 5 samples show the maximum permeability across the erupted materials tested, with an average permeability for the samples from Phase 5 of 9.2 × 10⁻¹² m2 (although some were too permeable to obtain a value). The decrease in permeability across Phases 1–4 occurs despite a relatively constant connected porosity (Figure 6C), although the proportion of isolated pores increases across the same range (Supplementary Table S1).
To maximize data gathering from a limited sample set, we performed UCS testing on one prepared 26 mm sample from each block (Figure 7A), resulting in 7 UCS values. Where there are two individual blocks from one phase, we find very similar results between the two blocks (Figure 7B), and we confirm the phase repeatability using cyclic loading tests to non-destructively measure Young’s modulus for each sample (see section “Cyclic Loading and Young’s Modulus”).
Figure 7. (A) Photos of one core from each block tested (M; B; H; F; G; J; K), with the corresponding phase marked; (B) UCS results from tests carried out at a constant strain rate of 10-5 s-1 on one core from Phase 1, and two cores from Phases 3, 4, and 5. UCS curves labeled with the block from which each rock was cored. Phase 5 samples show creep-like (i.e., undergoing significant strain prior to failure) behavior due to high porosity, while the other samples display sharp failure curves.
The results from the UCS tests generally show expected behavior, where the stress-strain curve can be broken into an initial stage of compaction of pre-existing pores and microfractures within the rock, an elastic loading phase, a brief period of strain hardening, and then a fracture marked by a sudden stress drop (Figure 7B; as described by Scholz, 1968; Heap and Faulkner, 2008). The UCS curves for Samples J and K show a more creep-like behavior due to their high porosity (>30%). These rocks did not exhibit a sharp stress drop, but rather ongoing compaction of pore spaces within the sample. The maximum load was recorded as the uniaxial compressive strength, and the tests were stopped when the stress showed a marked decrease (more than 10% stress drop) over time, suggesting that the rock had ruptured and was unable to bear any more load.
The results are summarized in Figure 8, along with all the mechanical results for each sample. Sample M (Phase 1) has a UCS of 25.1 MPa. For the remaining phases, two tests were carried out (one from each block, Figure 8A). The average UCS values for Phases 3, 4, and 5 are 27.8, 49.8, and 6.6 MPa, respectively (raw sample data are provided in Supplementary Table S1, with averages and standard deviations provided in Supplementary Table S4).
Figure 8. (A) UCS results. UCS is highest in Phase 4, and lowest in Phase 5, while Phases 1 and 3 are intermediate. (B) UCS as a function of porosity, compared with published datasets from other dome-building volcanoes: 1Heap et al., 2018a (diamonds); 2Coats et al., 2018 (squares); 3Heap et al., 2014a (downward triangles); 4Kendrick et al., 2013 (circles); (C) Tensile strength determined by Brazilian disk testing for samples from eruptive Phases 1, 3, 4, and 5. Each measurement is shown by the hollow markers, with mean tensile strength for each eruptive Phase shown by the black squares. (D) Young’s modulus (E) determined from both UCS and cyclic tests performed on 26 mm diameter cores and shown by Phase with averages shown for each Phase (black squares). Young’s modulus is determined using stress/strain between 40 and 50% of the UCS strength value, from the linear portion of stress/strain curve where we assume elastic behavior.
The lowest UCS results (<7 MPa) are found in Samples J and K (Phase 5) and correlate to the highest porosity among the samples tested (Figure 8B). These samples are more friable and have more evident pore space in hand specimen (Figure 7A), and the pore distribution maps from QEMSCAN analysis further highlight the connectivity of the porous network (Figure 3). Lower sample porosities correspond to higher uniaxial compressive strengths, however, for porosities between 20 and 25%, UCS values vary between 25 and 50 MPa. Although the porosity of these samples is similar, there is a higher proportion of isolated pores and lower permeability in the stronger Samples F and G (Phase 4). The porosity-strength relationship identified in this study fits well with other datasets from dome-building volcanoes (Figure 8B).
Similarly to the UCS results, the Young’s modulus increases with decreasing porosity across the sample suite. Young’s Modulus increases from Phase 1 to Phase 3 to Phase 4, with a drop to the lowest values in Phase 5 samples (Figure 8C). A higher Young’s modulus correlates to lower porosity values, and as such, higher Young’s modulus values typically correspond to higher UCS values. Cyclic testing showed good repeatability of mechanical data (i.e., stress-strain curve morphology, Supplementary Figure S5) within rock types, and to an extent within phases irrespective of sample size (26 or 37 mm diameter). Young’s modulus determined from the UCS tests gives average values in Phases 1, 3, 4, and 5 of 7.2, 7.0, 11.1, and 3.2 GPa, respectively. We also determined Young’s modulus using the cyclic tests, which indicated a range of Young’s modulus within each sample suite of less than 3 GPa, and average values for Phases 1, 3, 4, and 5 of 4.6, 7.2, 10.9, and 2.5 GPa, respectively. There is good agreement between the Young’s modulus values from UCS and cyclic testing, as the same portion (40–50%) of the peak stress of the loading curve was used for the analysis (Figure 8C; with raw data in Supplementary Table S1, and averages and standard deviations given in Supplementary Table S4). Increasing Young’s modulus values correspond most systematically to an increasing proportion of isolated porosity and therefore to decreasing permeability (Figure 9B and Table 3).
Figure 9. (A) Uniaxial tensile strength (UTS; hollow symbols) and uniaxial compressive strength (UCS; filled symbols) as a function of rock density (a proxy for porosity, see Supplementary Table S1 and Supplementary Figure S1). (B) Young’s modulus as a function of connected porosity, determined from UCS tests (black symbol outlines) and from cyclic tests (no symbol outline). (C) Permeability as a function of Young’s modulus, for 26 mm samples (thin symbol outline) and 37 mm samples (thick symbol outline).
We performed 66 Brazilian indirect tensile tests to constrain the tensile strength (UTS; Figure 8D) and found UTS averages of 2.13 MPa for Phase 1; 2.47 MPa for Phase 3; 3.22 MPa for Phase 4; and 0.96 MPa for Phase 5 (see averages and standard deviation for each phase in Supplementary Table S4). The results from the Brazilian disk testing correlate well to the UCS and Young’s modulus values, conforming to the trend of lower strength at lower density or higher porosities (Figures 8D, 9). The variability within each sample set is higher than for UCS (there are more tests), although each phase still has a considerably smaller range than the sample suite as a whole and there is good agreement between the different blocks within the same phase (Supplementary Table S2).
We show that in our study both compressive and tensile rock strength is inversely proportional to density (Figure 9A), and we consider bulk rock density here to be a proxy for total porosity (Supplementary Figure S1). That said, for a given density the UCS/UTS ratio is highly variable (Figure 10A), the ratio for Phases 1, 3, 4, and 5 is 11.8, 10.9, 15.5, and 6.9, respectively. Instead, UCS/UTS ratio systematically decreases with increasing permeability (Figure 10B). We also compare the average Schmidt hammer rebound values for each phase to the UCS/UTS ratio, where the Schmidt hammer rebound values increase with increasing UCS/UTS ratio (Figure 10C). This is likely due to the sensitivity of the Schmidt hammer to the rock stiffness, as Young’s modulus also correlates very well with the UCS/UTS ratio (Figure 10D).
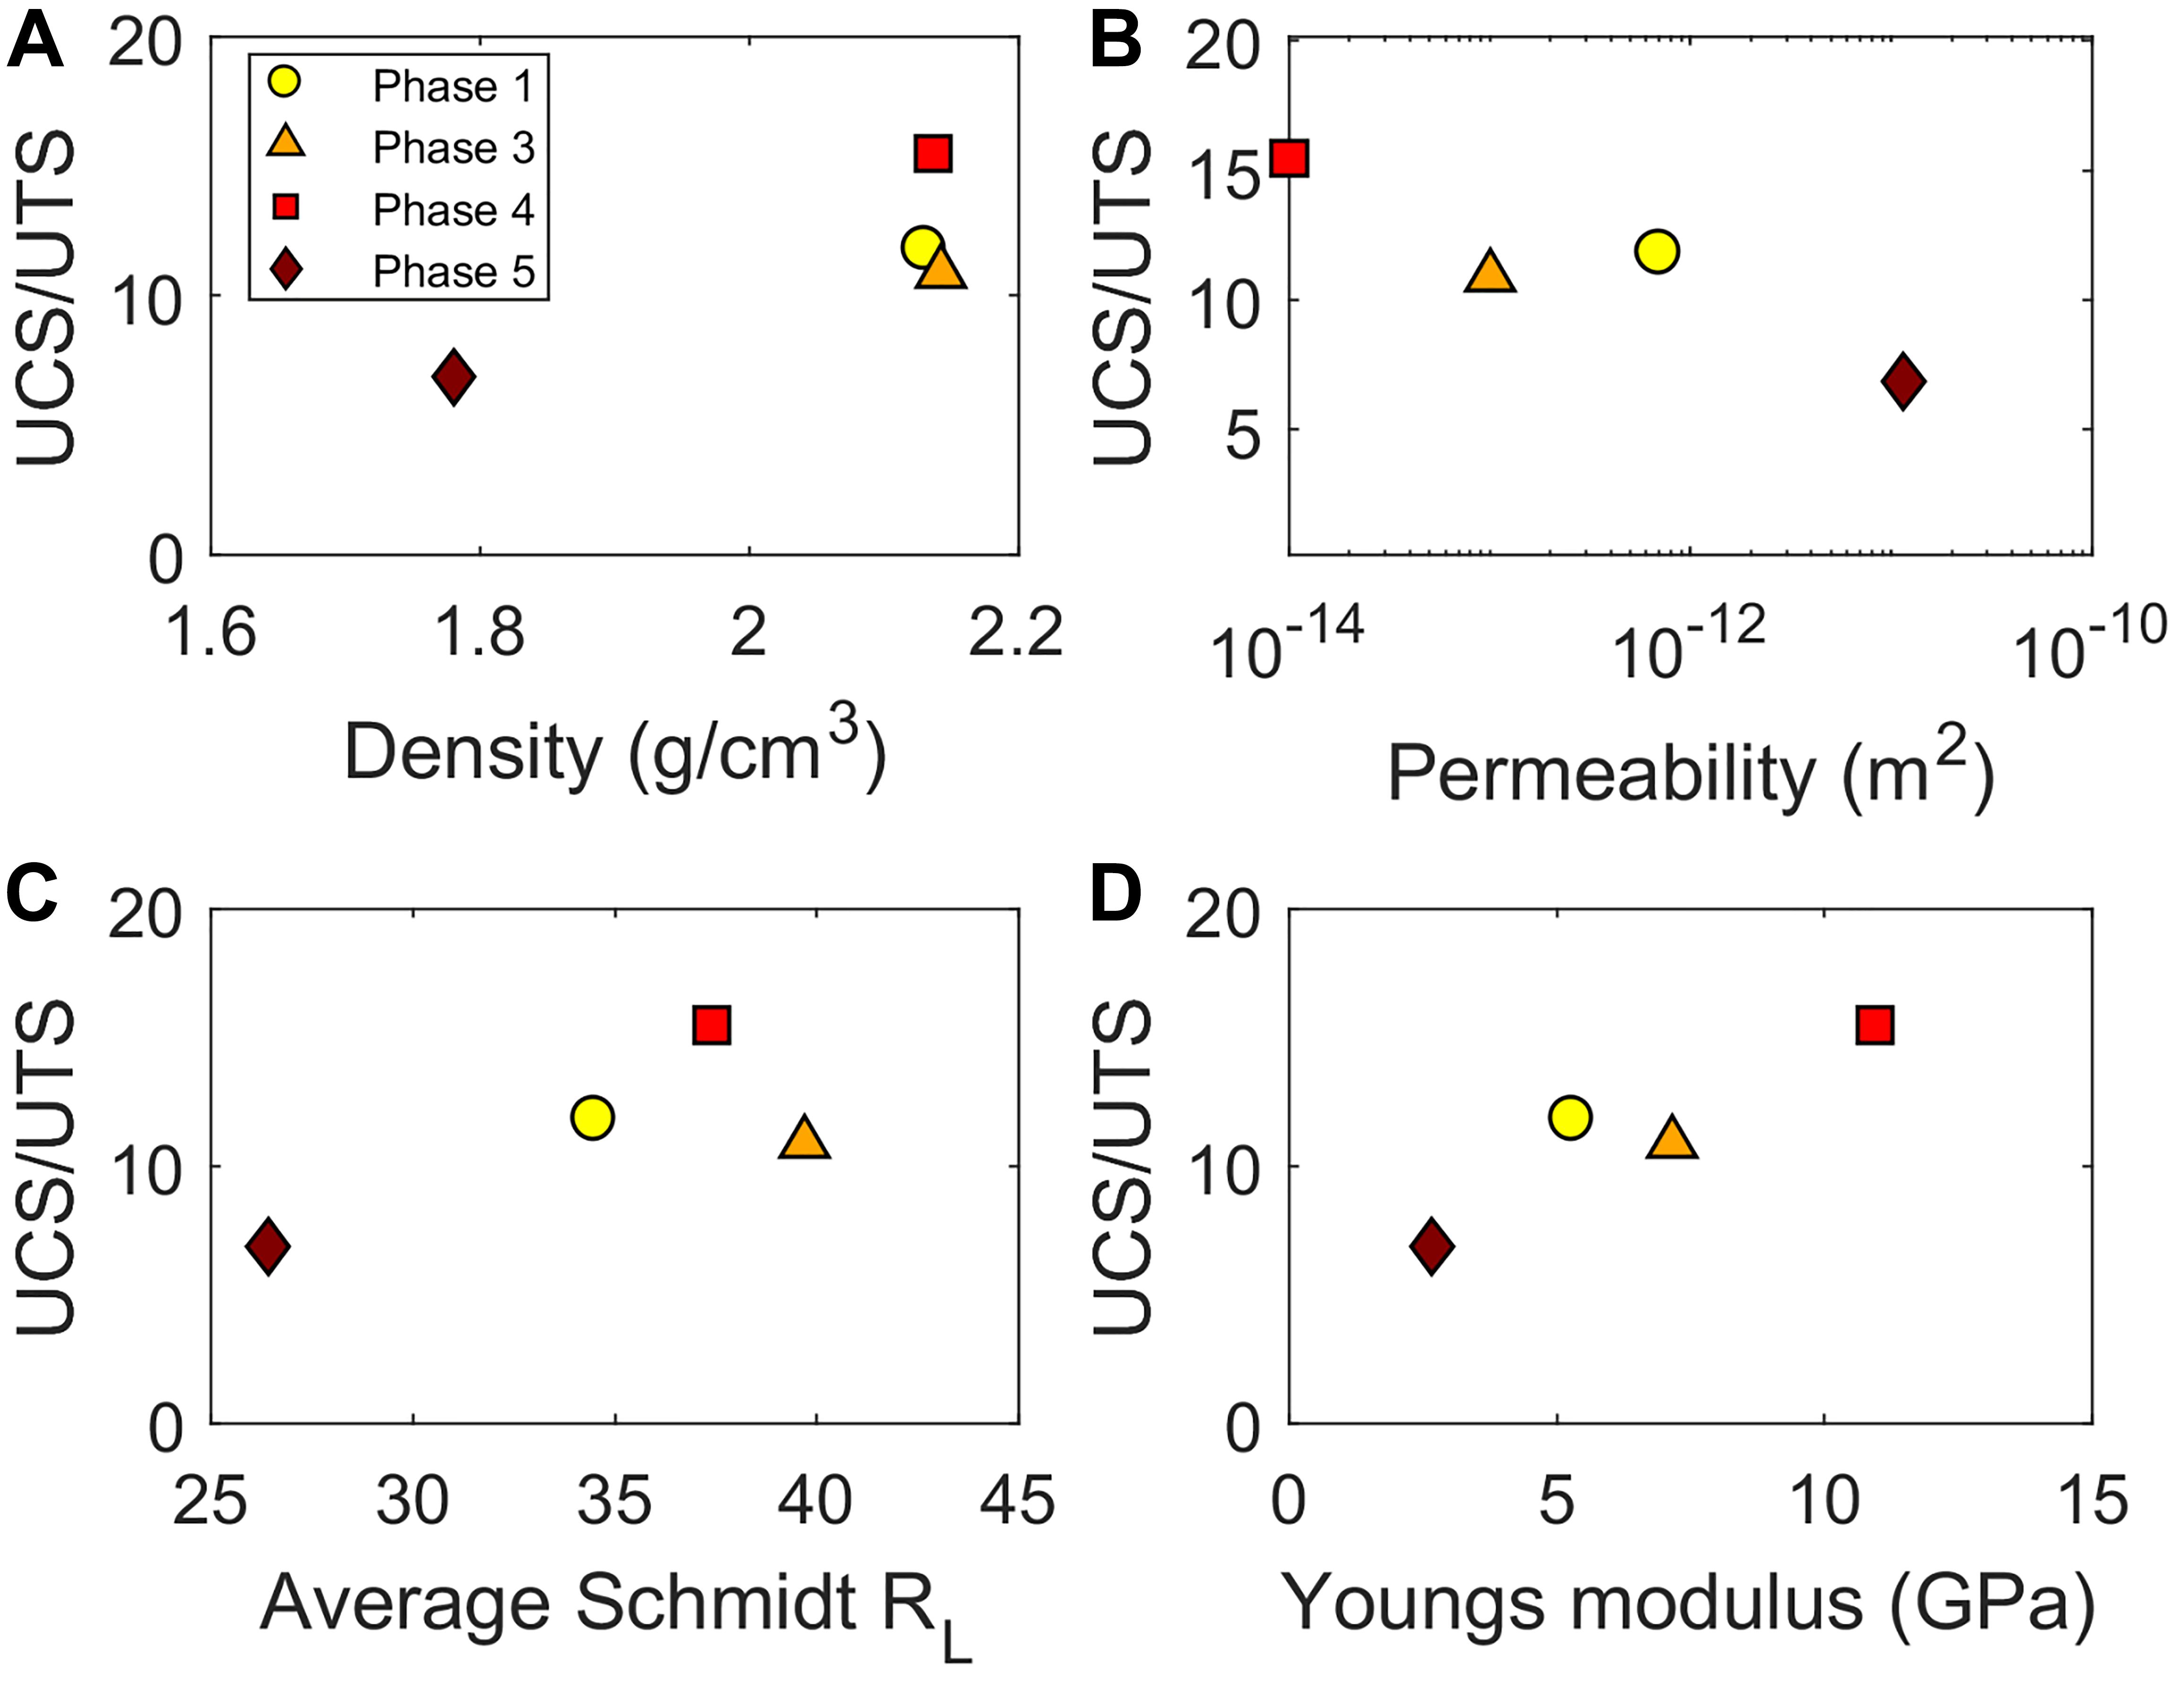
Figure 10. (A) UCS/UTS ratio as a function of density; (B) UCS/UTS ratio as a function of permeability; (C) UCS/UTS ratio as a function of average Schmidt hammer rebound value (RL); and (D) UCS/UTS ratio as a function of Young’s modulus. Phase averages shown in each case. A higher UCS/UTS ratio correlates to lower permeabilities, higher Schmidt hammer rebound values, and higher Young’s modulus values.
In this study, we have demonstrated a wide range in physical and mechanical properties of dome rock from Soufrière Hills volcano (SHV). We show how these properties vary in relation to one another, and in addition, by gathering these data from temporally-constrained samples, we are able to speculate how this could reflect the changing eruptive behavior across this well-observed 15-year eruption. We verify the trends observed in our limited laboratory sample suite using Schmidt hammer rebound testing on a wider range of samples in the field, and find RL values to be in broad agreement with the observed temporal trends of strength and Young’s Modulus. The identified links in physical and mechanical rock properties are necessary for assessing volcano dynamics, and the temporal relationships could prove important if corroborated using a wider suite of rocks.
The SHV dome rocks examined here range in porosity from 19.7 to 40.2%, with inversely-proportional permeabilities spanning the range from 10-15 to 10-11 m2. Our corresponding densities of 1.61–2.34 g/cm3 also agree well with the range of densities measured on 85 blocks from block-and-ash flows in 1997 and to the porosity range of 15.1–45.5% observed for a smaller subset of these 1997 lava samples (Formenti and Druitt, 2003). Moreover this spectrum of our samples exceeds the porosity and permeability range spanned by banded pumice samples collected from block-and-ash flow deposits at SHV (Farquharson and Wadsworth, 2018). The strength of the dome rocks measured at SHV varies by almost an order of magnitude from 6.2 to 51.1 MPa in compression, and 0.5–4.1 MPa in tension, which show a non-linear decrease with increasing porosity and permeability. We demonstrate a higher UCS/UTS ratio for stronger, stiffer material, highlighting the different effect of pore connectivity on compressive and tensile strength. This is an important consideration when modeling structural dome instability, as using a constant UCS/UTS ratio in numerical models could result in overestimation of a dome’s tensile strength, and therefore underestimation of the failure likelihood of the unconfined portion of lava domes. The current SHV dome at Montserrat is likely to have cooled to an extent where viscous flow no longer dominates eruptive behavior (Ball et al., 2015); as such, tests of rock properties at ambient temperatures are relevant to the modeling of ongoing stability of the volcano, but moreover, a number of studies have demonstrated that the strength of volcanic rock at elevated temperature is either comparable (Heap et al., 2014a, 2018a) or higher (Schaefer et al., 2015; Coats et al., 2018) than at room temperature, suggesting that domes are at their weakest following cooling.
For the same sample suite, Young’s modulus values range from 1.4 to 12.3 GPa and correspond to higher values in less porous, denser samples (Figure 9B). A strong correlation is shown between Young’s modulus and sample permeability (Figure 9C), where lower permeabilities correlate to higher stiffness values. This suggests a dependence of Young’s modulus on not only porosity, but also pore connectivity, which also controls the permeability.
Mechanical data from experiments show a general trend of increasing strength (compressive and tensile) and stiffness in samples from Phase 1 to Phase 4, with a corresponding decrease in permeability (and increasing proportion of isolated pores). The samples from Phase 5 show significantly lower strength and stiffness and have both the highest porosity and permeability. Therefore porosity can be considered as a controlling factor in both strength and stiffness of volcanic rocks (as described previously for other volcanic rocks; Heap et al., 2014b, 2016a; Schaefer et al., 2015; Colombier et al., 2017; Marmoni et al., 2017; Coats et al., 2018). We compare the correlation between porosity and uniaxial compressive strength in this dataset to published data from other dome-building volcanoes (Volcán de Colima, Mexico, Mount St. Helens, United States, and Mt. Unzen, Japan) and find that our samples fit well with existing data (Figure 8B). Although we speculate that the properties identified in this study could suggest a temporal evolution in mechanical behavior at Soufrière Hills, we show here that examining the mechanical properties as a function of the physical rock properties may be more appropriate.
Although cracks are present in these samples (particularly in Sample M), we note that the samples in this study do not show the pervasive micro-fractured textures that have been observed in similar andesites from Volcán de Colima (Heap et al., 2014a). The QEMSCAN images highlighting porosity (Figures 3E–H) show that the samples with higher porosities (e.g., Sample J from Phase 5) have larger, more heterogeneously distributed pore space with a higher degree of connectivity. Lamur et al. (2017) showed that the addition of a macro fracture in samples with relatively high porosity (above 18%) has little impact on the resultant permeability, and as such we surmise that permeability in our sample suite is controlled by preexisting pore connectivity, rather than pervasive fractures.
Further, we also demonstrate that pore morphology and connectivity has an important control on mechanical properties (UCS, UTS, and Young’s modulus); where total porosity is similar (Phases 1, 3, and 4), lower connectivity (and thus permeability) in Phase 1, then Phase 3, and finally lowest in Phase 4, corresponds to a significant increase in compressive (7% from Phase 1 to 3 and 85% from Phase 3 to 4) and tensile (16% from Phase 1 to 3 and 30% from Phase 3 to 4) strength, and stiffness (Young’s modulus, 35% from Phase 1 to 3 and 53% from Phase 3 to 4). By showing that the rocks are not heavily micro-fractured and pore connectivity is a controlling factor in mechanical behavior, we also demonstrate that differences found between the rocks in this study are unlikely to be due to damage during transport in pyroclastic density currents, and rather represent the textural heterogeneity of the eruptive products.
In order to establish whether porosity is exerting the only control on the mechanical properties of the rocks tested here, we also examine the mineralogy of the samples. Variation in glass, silica polymorph and plagioclase content is non-systematic through time, although we do see co-variance of a number of physical and mechanical properties. For example, total crystallinity (Table 2) as a proportion of the solid fraction of each sample (i.e., excluding the glass and silica polymorph phase) correlates positively to the mechanical behavior (Figure 11), with the lowest crystallinity (Phase 5, 62–66% crystallinity) corresponding to the lowest rock strength and Young’s Modulus (UTS = 1.0 MPa, UCS = 6.6 MPa, YM = 2.9 GPa), and the highest crystallinity (Phase 4, 75–81% crystallinity) corresponding to the highest rock strength and Young’s Modulus (UTS = 2.8 MPa, UCS = 49.9 MPa, YM = 10.7 GPa). Such relationships of strengthening with increasing crystallinity have been noted in partially crystalline polymers (e.g., Brady, 1976). The crystallinity-strength relationship at a dome-building volcano was discussed by Bain et al. (2019), where low crystallinity samples were associated with low repose times between volcanic explosions, and therefore low residency times within the upper conduit and dome. We speculate that a longer residence time at elevated temperature within the volcano leads to increased densification of material as well as increased crystallization. This could have particular importance when considering the likely mechanical behavior of dome rock.
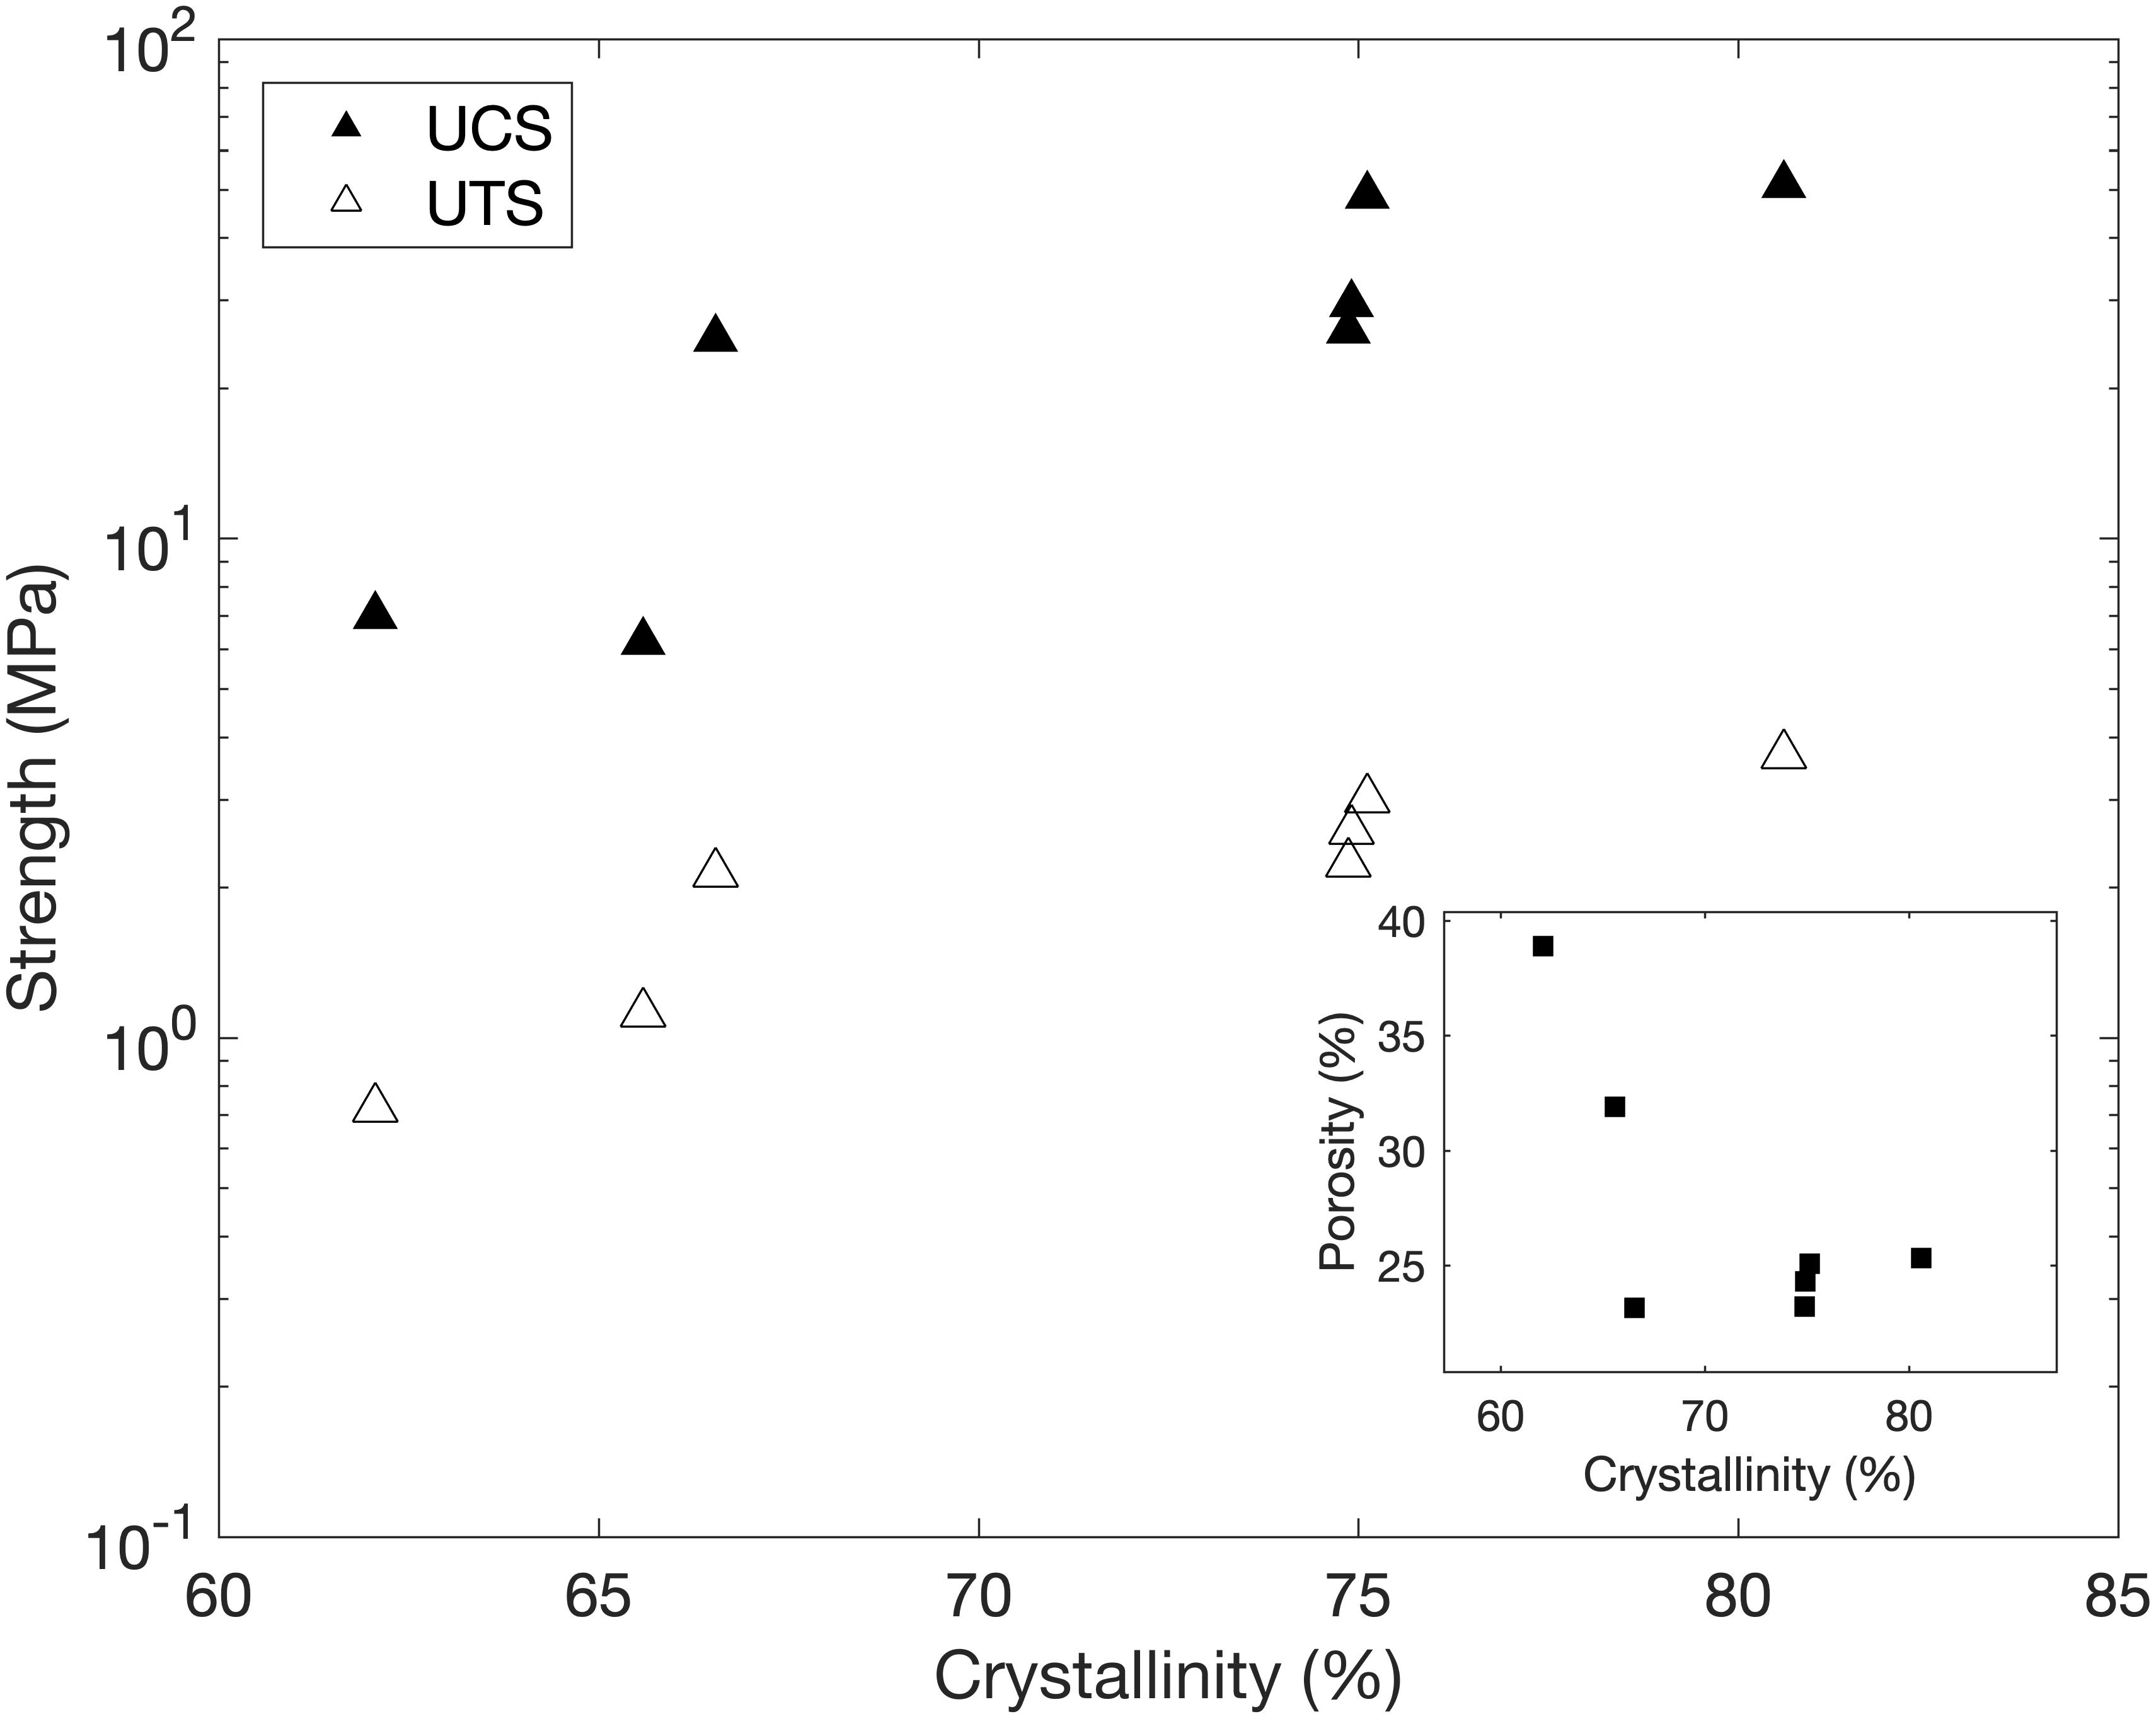
Figure 11. Rock strength as a function of crystallinity, where solid markers show uniaxial compressive strength (UCS) and hollow markers show tensile strength (UTS). Inset shows correlation between crystallinity and porosity.
The relationship between crystal fraction and strength was modeled up to 40% crystallinity by Heap et al. (2016b), who found that UCS decreased with increasing crystal content up to 15%; our system differs in that it exceeds the maximum loose packing as the groundmass has crystallized and interlocked in situ, and thus is contrasting to the simplified two- phase system modeled in Heap et al. (2016b). As observed by previous work (e.g., Zorn et al., 2018), porosity and crystallinity are inversely proportional (Figure 11); the more porous samples have lower crystallinity and are more glassy than the denser samples. Thus despite the correlation between crystallinity and strength, it is difficult to determine if there is an independent effect of crystallinity with the sample suite tested, as porosity is generally believed to impart the greatest control on strength (Kendrick et al., 2013; Heap et al., 2014a, 2016b; Farquharson et al., 2015; Schaefer et al., 2015).
We also use Schmidt hammer testing to support the laboratory results. The Schmidt hammer is a well-known tool for field testing to infer both UCS and Young’s modulus (Katz et al., 2000; Ylmaz and Sendr, 2002; Dinçer et al., 2004; Yagiz, 2009). We do not directly correlate our Schmidt hammer results to UCS values here due to the variability in published correlations; however, we see that the raw data from the Schmidt hammer index testing shows a similar trend to UCS results (Figures 10B,C). This supports our UCS data by providing analysis of a larger sample set, although the Schmidt hammer results differ from the UCS results by indicating a more similar strength between the samples from Phase 3 to Phase 4. The slight discrepancy between the Schmidt hammer data and the experimental results likely arises from the sensitivity of the Schmidt hammer to sample porosity (Yasar and Erdogan, 2004; Aydin and Basu, 2005; Yagiz, 2009). As the rock porosities appear to have very similar ranges in Phases 1, 3, and 4, we suggest the Schmidt hammer is insensitive to the small differences in pore connectivity, as evidenced by the permeability differences which seem to correlate to tensile and compressive strength as well as stiffness observed in the mechanical tests. The Schmidt hammer does, however, show clearly that the samples from Phase 5 are the weakest material tested.
We find a slight increase in strength from Phase 1 to Phase 3 (Figures 8A,C,D), as well as slightly lower permeabilities than those from Phase 1 and a significant increase in glass recrystallization to silica polymorphs which can serve to block pores by vapor phase deposition (Horwell et al., 2013) and decrease permeability. The lack of explosions during Phase 3 (Wadge et al., 2014) and enhanced residence time in the lava dome as a result could explain these textural differences to the earlier phases of the eruption. Phase 3 had one major collapse on the May 20, 2006 (from which the Phase 3 samples in this study are collected) compared to several collapses in the earlier phases. The average extrusion rates are, however, very similar in Phase 1 and Phase 3, at 4.5 and 5.3 m3s-1, respectively. This could explain the similar porosities between the samples from each phase (e.g., Collombet, 2009), and therefore the similarities in strength (e.g., Coats et al., 2018). It is important to note that the extrusion rates within each phase were highly variable, as shown in Figure 2, and therefore the rock properties defined in the study are likely to be determined by short-term emplacement conditions, rather than representative of the whole eruptive phase.
Unlike the other eruptive phases at Soufrière Hills, Phase 4 occurred in 2 short episodes from August 08, 2008 until October 08, 2008, and then from December 02, 2008 until January 03, 2009 (Stinton et al., 2017). The samples from Phase 4 are collected from the explosion on July 29, 2008 and are the strongest of the erupted products tested here. The other rocks in this study are samples from events that occurred during periods of active extrusion and so are likely to have been stored in the dome for shorter time periods, whereas the Phase 4 products follow a period of quiescence and are likely to have had longer residence times within the lava dome. Previous work (Horwell et al., 2013) has shown that recrystallization that occurs after emplacement of material within the dome is likely to increase the fraction of silica polymorphs (likely to be cristobalite) at the expense of glass. Horwell et al. (2013) suggested that by additionally filling pore space with recrystallized silica polymorphs, rock strength may be increased; although it is difficult to distinguish between all the contributing variables, recrystallization of interstitial glass to silica polymorphs (Table 2) is highest in the strongest samples, present in Phases 3 and 4.
It is clear here that understanding the events preceding each collapse (Table 1) is an important factor in determining a rock’s history, and therefore its likely mechanical properties. For example, although the samples from Phases 4 and 5 in this study are both collected from deposits that are associated with explosions, they exhibit very different mechanical properties. The July 29, 2008 event marked the beginning of Phase 4a and was preceded by no extrusion (Table 1); therefore, the material from this event is likely to be mechanically distinct from material that collapses during extrusion. This is important to feed into future numerical models, as it suggests increased mechanical strength from alteration following increased repose time.
Phase 5 at SHV was also short-lived compared to Phases 1 and 3, but was punctuated by several vulcanian explosions and did not contain the frequent small scale collapses seen in Phase 1 (Stinton et al., 2014a). The time-averaged extrusion rate during Phase 5 is estimated at 7 m3s-1. The samples from Phase 5 have larger phenocrysts than samples from the previous two phases (Figure 3), suggesting a longer crystallization time of magma prior to the final ascent and eruption. This could be due to the absence of wholesale dome collapse after May 2006 (Figure 2), that plugged the upper conduit, preventing magma extrusion. We also suggest that the high permeability of the Phase 5 samples contributes to efficient outgassing of the dome, leading to relatively degassed magma; as previously observed by Cole et al. (2014).
All dome material emplaced from the beginning of the eruption in 1995 until May 2006 was removed by repeated collapse events (Wadge et al., 2014). Extrusion resumed almost immediately after the May 2006 collapse, and dome growth in Phases 4 and 5 occurred primarily on top of the remaining Phase 3 dome. The February 2010 collapse likely removed most of the material emplaced in Phase 4, suggesting the dome that still remains on Montserrat mostly comprises material emplaced in Phases 3 and 5. We suggest therefore that future modeling efforts of the current dome include rock heterogeneity (both temporal, and spatial if available), as this could significantly influence overall structural stability (e.g., Schaefer et al., 2013).
We present here a study of the physical and mechanical properties of a suite of temporally-constrained rocks from Soufrière Hills volcano (SHV). We clearly demonstrate the variability and co-variance of physical and mechanical rock properties (porosity, permeability, UCS, UTS, Young’s modulus, and Schmidt hardness) across a broad spectrum volcanic rocks, representative of the extruded products of SHV (e.g., Formenti and Druitt, 2003). These parameters vary extensively for the materials tested. Across all phases, we observe a range in connected porosity of 19.7–40.2%, permeability of 10-15 to 10-11 m2, tensile strength of 0.53–4.15 MPa, compressive strength of 6.2–51.1 MPa, Young’s modulus of 1.39–12.29 GPa, and Schmidt hammer rebound values of 12.5–47.9. We find that while porosity has a dominant control on strength and Young’s Modulus, higher pore connectivity (at a given porosity) also weakens material, decreases the UCS/UTS ratio and enhances permeability by up to two orders of magnitude. In addition, we show how more crystalline samples have lower porosity, and have the lowest proportion of pristine glass. Both higher total crystallinity, and higher recrystallization of glass into silica polymorphs correlate with higher strength and Young’s Modulus in our sample suite, though these also correlate positively to the control porosity has on strength and thus crystallinity is judged to have a lesser influence.
The temporal evolution, from the samples tested in the laboratory and field in this study, indicates an increase in rock strength from Phase 1 to Phase 3 to Phase 4, and then shows a large decrease in strength in samples from Phase 5 of the eruption, with all samples following the same physical and mechanical relationships as defined above. We acknowledge that the samples tested in this study only provide us with a “snapshot” during the phases of a complicated eruptive history at SHV, and that more samples would be required from varied locations to test if this trend is truly observed for the eruption as a whole. However, our dataset demonstrates a large range in mechanical properties (strength and stiffness) that can be linked to the rock’s texture (porosity and crystallinity) and permeability, and we use field Schmidt hammer testing to support the laboratory investigation, finding good correlation.
We conclude that even at a volcano with a narrow range of eruptive material and chemical composition, taking single values for mechanical parameters is insufficient for the purpose of numerical modeling. Consequently, the inclusion of temporal and spatial heterogeneity should be strongly considered in future structural stability models.
CH led the project, conducted fieldwork and experiments, prepared all figures, and wrote the manuscript. JK and AL helped to conceptualize the project, conducted experiments, assisted with data processing, and improved the manuscript and figures. MT and AS conducted fieldwork, helped to conceptualize the project, and revised the manuscript. PW and JU conducted the QEMSCAN analysis and processing, and revised the manuscript. WM and JN provided useful discussion and revised the manuscript. YL helped to conceptualize the project and improved the manuscript.
CH was funded through a NERC studentship as part of the Leeds York Spheres Doctoral Training Partnership (DTP) (Grant No NE/L002574/1). JN acknowledges the Centre for the Observation and Modelling of Earthquakes, Volcanoes and Tectonics (COMET). YL acknowledges financial support from the European Research Council Starting grant on Strain Localisation in Magma (SLiM, No. 306488).
The authors declare that the research was conducted in the absence of any commercial or financial relationships that could be construed as a potential conflict of interest.
We are in debt to the Montserrat Volcano Observatory and its staff for assistance during the field campaign, namely Paddy Smith, Karen Pascal, and Rod Stewart. CH thanks Ben Todd, Eduardo Morgado, and Ruth Amey for software assistance. We would like to thank FEI Company of Hilsboro Oregon, and Prof. Richard H. Worden of the University of Liverpool, for the very significant support with Qemscan® WellSite SEM hardware and iDiscover® software, allowing us to acquire extensive high quality Qemscan® datasets.
The Supplementary Material for this article can be found online at: https://www.frontiersin.org/articles/10.3389/feart.2019.00007/full#supplementary-material
Andrade, S. D., and van Wyk de Vries, B. (2010). Structural analysis of the early stages of catastrophic stratovolcano flank-collapse using analogue models. Bull. Volcanol. 72, 771–789. doi: 10.1007/s00445-010-0363-x
Apuani, T., Corazzato, C., Cancelli, A., and Tibaldi, A. (2005). Stability of a collapsing volcano (Stromboli, Italy): limit equilibrium analysis and numerical modelling. J. Volcanol. Geotherm. Res. 144, 191–210. doi: 10.1016/j.jvolgeores.2004.11.028
Aydin, A., and Basu, A. (2005). The Schmidt hammer in rock material characterization. Eng. Geol. 81, 1–14. doi: 10.1016/j.enggeo.2005.06.006
Bain, A. A., Calder, E. S., Cortés, J. A., Cortés, G. P., and Loughlin, S. C. (2019). Textural and geochemical constraints on andesitic plug emplacement prior to the 2004–2010 vulcanian explosions at Galeras volcano, Colombia. Bull. Volcanol. 81:1. doi: 10.1007/s00445-018-1260-y
Ball, J. L., Stauffer, P. H., Calder, E. S., and Valentine, G. A. (2015). The hydrothermal alteration of cooling lava domes. Bull. Volcanol. 77:102. doi: 10.1007/s00445-015-0986-z
Barclay, J., Herd, R. A., Edwards, B. R., Christopher, T., Kiddle, E. J., Plail, M., et al. (2010). Caught in the act: implications for the increasing abundance of mafic enclaves during the recent eruptive episodes of the Soufrière Hills Volcano, Montserrat. Geophys. Res. Lett. 37:L00E09. doi: 10.1029/2010GL042509
Basu, A., and Aydin, A. (2004). A method for normalization of Schmidt hammer rebound values. Int. J. Rock Mech. Min. Sci. 41, 1211–1214. doi: 10.1016/j.ijrmms.2004.05.001
Borselli, L., Capra, L., Sarocchi, D., and De la Cruz-Reyna, S. (2011). Flank collapse scenarios at Volcán de Colima, Mexico: a relative instability analysis. J. Volcanol. Geotherm. Res. 208, 51–65. doi: 10.1016/j.jvolgeores.2011.08.004
Brady, D. G. (1976). The crystallinity of poly(phenylene sulfide) and its effect on polymer properties. J. Appl. Polym. Sci. 20, 2541–2551. doi: 10.1002/app.1976.070200921
Bubeck, A., Walker, R. J., Healy, D., Dobbs, M., and Holwell, D. A. (2017). Pore geometry as a control on rock strength. Earth Planet. Sci. Lett. 457, 38–48. doi: 10.1016/j.epsl.2016.09.050
Calder, E. S., Luckett, R., Sparks, R. S. J., and Voight, B. (2002). Mechanisms of lava dome instability and generation of rockfalls and pyroclastic flows at Soufrière Hills Volcano, Montserrat. Geol. Soc. Lond. Mem. 21, 173–190. doi: 10.1144/GSL.MEM.2002.021.01.08
Cecchi, E., van Wyk de Vries, B., and Lavest, J. M. (2004). Flank spreading and collapse of weak-cored volcanoes. Bull. Volcanol. 67, 72–91. doi: 10.1007/s00445-004-0369-3
Christopher, T. E., Humphreys, M. C. S., Barclay, J., Genareau, K., De Angelis, S. M. H., Plail, M., et al. (2014). Petrological and geochemical variation during the Soufrière Hills eruption, 1995 to 2010. Geol. Soc. Lond. Mem. 39, 317–342. doi: 10.1144/M39.17
Coats, R., Kendrick, J. E., Wallace, P. A., Miwa, T., Hornby, A. J., Ashworth, J. D., et al. (2018). Failure criteria for porous dome rocks and lavas: a study of Mt. Unzen, Japan. Solid Earth Discuss. 9, 1299–1328. doi: 10.5194/se-2018-19
Cole, P. D., Smith, P., Komorowski, J.-C., Alfano, F., Bonadonna, C., Stinton, A., et al. (2014). Chapter 4 Ash venting occurring both prior to and during lava extrusion at Soufrière Hills Volcano, Montserrat, from 2005 to 2010. Geol. Soc. Lond. Mem. 39, 71–92. doi: 10.1144/M39.4
Collombet, M. (2009). Two-dimensional gas loss for silicic magma flows: toward more realistic numerical models. Geophys. J. Int. 177, 309–318. doi: 10.1111/j.1365-246X.2008.04086.x
Colombier, M., Wadsworth, F. B., Gurioli, L., Scheu, B., Kueppers, U., Di Muro, A., et al. (2017). The evolution of pore connectivity in volcanic rocks. Earth Planet. Sci. Lett. 462, 99–109. doi: 10.1016/j.epsl.2017.01.011
Das, S. (2015). “Supershear earthquake ruptures - theory, methods, laboratory experiments and fault superhighways: an update,” in Perspectives on European Earthquake Engineering and Seismology. Geotechnical, Geological and Earthquake Engineering, ed. A. Ansal (Cham: Springer), 1–20. doi: 10.1007/978-3-319-07118-3
David, E. C., Brantut, N., Schubnel, A., and Zimmerman, R. W. (2012). Sliding crack model for nonlinearity and hysteresis in the uniaxial stress-strain curve of rock. Int. J. Rock Mech. Min. Sci. 52, 9–17. doi: 10.1016/j.ijrmms.2012.02.001
Deere, D. U., and Miller, R. P. (1966). Engineering Classification and Index Properties for Intact Rock. Albuquerque, NM: Kirtland Air Force Base. doi: 10.21236/AD0646610
Del Potro, R., and Hürlimann, M. (2009). A comparison of different indirect techniques to evaluate volcanic intact rock strength. Rock Mech. Rock Eng. 42, 931–938. doi: 10.1007/s00603-008-0001-5
Dinçer, I., Acar, A., Çobanoðlu, I., and Uras, Y. (2004). Correlation between Schmidt hardness, uniaxial compressive strength and Young’s modulus for andesites, basalts and tuffs. Bull. Eng. Geol. Environ. 63, 141–148. doi: 10.1007/s10064-004-0230-0
Dondin, F. J. Y., Heap, M. J., Robertson, R. E. A., Dorville, J. F. M., and Carey, S. (2017). Flank instability assessment at Kick-’em-Jenny submarine volcano (Grenada, Lesser Antilles): a multidisciplinary approach using experiments and modeling. Bull. Volcanol. 79:5. doi: 10.1007/s00445-016-1090-8
Ericson, K. (2004). Geomorphological surfaces of different age and origin in granite landscapes: an evaluation of the Schmidt hammer test. Earth Surf. Process. Landf. 29, 495–509. doi: 10.1002/esp.1048
Farquharson, J., Heap, M. J., Varley, N. R., Baud, P., and Reuschlé, T. (2015). Permeability and porosity relationships of edifice-forming andesites: a combined field and laboratory study. J. Volcanol. Geotherm. Res. 297, 52–68. doi: 10.1016/j.jvolgeores.2015.03.016
Farquharson, J. I., Heap, M. J., Lavallée, Y., Varley, N. R., and Baud, P. (2016). Evidence for the development of permeability anisotropy in lava domes and volcanic conduits. J. Volcanol. Geotherm. Res. 323, 163–185. doi: 10.1016/j.jvolgeores.2016.05.007
Farquharson, J. I., and Wadsworth, F. B. (2018). Upscaling permeability in anisotropic volcanic systems. J. Volcanol. Geotherm. Res. 364, 35–47. doi: 10.1016/j.jvolgeores.2018.09.002
Formenti, Y., and Druitt, T. H. (2003). Vesicle connectivity in pyroclasts and implications for the fluidisation of fountain-collapse pyroclastic flows, Montserrat (West Indies). Earth Planet. Sci. Lett. 214, 561–574. doi: 10.1016/S0012-821X(03)00386-8
Goudie, A. S. (2013). The schmidt hammer and related devices in geomorphological research. Treatise Geomorphol. 14, 338–345. doi: 10.1016/B978-0-12-374739-6.00398-5
Hale, A. J., Calder, E. S., Loughlin, S. C., Wadge, G., and Ryan, G. A. (2009a). Modelling the lava dome extruded at Soufrière Hills Volcano, Montserrat, August 2005-May 2006. Part I: dome shape and internal structure. J. Volcanol. Geotherm. Res. 187, 69–84. doi: 10.1016/j.jvolgeores.2009.08.014
Hale, A. J., Calder, E. S., Loughlin, S. C., Wadge, G., and Ryan, G. A. (2009b). Modelling the lava dome extruded at Soufrière Hills Volcano, Montserrat, August 2005-May 2006. Part II: Rockfall activity and talus deformation. J. Volcanol. Geotherm. Res. 187, 69–84. doi: 10.1016/j.jvolgeores.2009.08.014
Harnett, C. E., Thomas, M. E., Purvance, M. D., and Neuberg, J. (2018). Using a discrete element approach to model lava dome emplacement and collapse. J. Volcanol. Geotherm. Res. 359, 68–77. doi: 10.1016/j.jvolgeores.2018.06.017
Heap, M. J., Coats, R., Chen, C. F., Varley, N., Lavallée, Y., Kendrick, J., et al. (2018a). Thermal resilience of microcracked andesitic dome rocks. J. Volcanol. Geotherm. Res. 367, 20–30. doi: 10.1016/j.jvolgeores.2018.10.021
Heap, M. J., Farquharson, J. I., Kushnir, A. R. L., Lavallée, Y., Baud, P., Gilg, H. A., et al. (2018b). The influence of water on the strength of Neapolitan Yellow Tuff, the most widely used building stone in Naples (Italy). Bull. Volcanol. 80:51. doi: 10.1007/s00445-018-1225-1
Heap, M. J., Reuschlé, T., Farquharson, J. I., and Baud, P. (2018c). Permeability of volcanic rocks to gas and water. J. Volcanol. Geotherm. Res. 354, 29–38. doi: 10.1016/j.jvolgeores.2018.02.002
Heap, M. J., Farquharson, J. I., Baud, P., Lavallée, Y., and Reuschlé, T. (2015). Fracture and compaction of andesite in a volcanic edifice. Bull. Volcanol. 77:55. doi: 10.1007/s00445-015-0938-7
Heap, M. J., and Faulkner, D. R. (2008). Quantifying the evolution of static elastic properties as crystalline rock approaches failure. Int. J. Rock Mech. Min. Sci. 45, 564–573. doi: 10.1016/j.ijrmms.2007.07.018
Heap, M. J., Lavallée, Y., Petrakova, L., Baud, P., Reuschlé, T., Varley, N. R., et al. (2014a). Microstructural controls on the physical and mechanical properties of edifice-forming andesites at Volcán de Colima, Mexico. J. Geophys. Res. Solid Earth 119, 2925–2963. doi: 10.1002/2013JB010521
Heap, M. J., Xu, T., and Chen, C. F. (2014b). The influence of porosity and vesicle size on the brittle strength of volcanic rocks and magma. Bull. Volcanol. 76, 1–15. doi: 10.1007/s00445-014-0856-0
Heap, M. J., Russell, J. K., and Kennedy, L. A. (2016a). Mechanical behaviour of dacite from Mount St. Helens (USA): a link between porosity and lava dome extrusion mechanism (dome or spine)? J. Volcanol. Geotherm. Res. 328, 159–177. doi: 10.1016/j.jvolgeores.2016.10.015
Heap, M. J., Wadsworth, F. B., Xu, T., Chen, C. F., and Tang, C. (2016b). The strength of heterogeneous volcanic rocks: a 2D approximation. J. Volcanol. Geotherm. Res. 319, 1–11. doi: 10.1016/j.jvolgeores.2016.03.013
Herd, R. A., Edmonds, M., and Bass, V. (2005). Catastrophic lava dome failure at Soufrière Hills Volcano, Montserrat, 12-13 July 2003. J. Volcanol. Geotherm. Res. 148, 234–252. doi: 10.1016/j.jvolgeores.2005.05.003
Horwell, C. J., Williamson, B. J., Llewellin, E. W., Damby, D. E., and Le Blond, J. S. (2013). The nature and formation of cristobalite at the Soufrière Hills volcano, Montserrat: implications for the petrology and stability of silicic lava domes. Bull. Volcanol. 75, 1–19. doi: 10.1007/s00445-013-0696-3
Humphreys, M. C. S., Edmonds, M., Christopher, T., and Hards, V. (2010). Magma hybridisation and diffusive exchange recorded in heterogeneous glasses from Soufrière Hills Volcano, Montserrat. Geophys. Res. Lett. 37:L00E06. doi: 10.1029/2009GL041926
Husain, T., Elsworth, D., Voight, B., Mattioli, G., and Jansma, P. (2018). Influence of conduit flow mechanics on magma rheology and the growth style of lava domes. Geophys. J. Int. 213, 1768–1784. doi: 10.1093/gji/ggy073
Husain, T., Elsworth, D., Voight, B., Mattioli, G. S., and Jansma, P. (2014). Influence of extrusion rate and magma rheology on the growth of lava domes: insights from particle-dynamics modeling. J. Volcanol. Geotherm. Res. 285, 110–117. doi: 10.1016/j.jvolgeores.2014.08.013
Jaeger, J., Cook, N., and Zimmerman, R. (2009). Fundamentals of Rock Mechanics. Hoboken, NJ: John Wiley & Sons.
Katz, O., Reches, Z., and Roegiers, J.-C. (2000). Evaluation of mechanical rock properties using a Schmidt Hammer. Int. J. Rock Mech. Min. Sci. 37, 723–728. doi: 10.1016/S1365-1609(00)00004-6
Kendrick, J. E., Lavallée, Y., Varley, N. R., Wadsworth, F. B., Lamb, O. D., and Vasseur, J. (2016). Blowing off steam: tuffisite formation as a regulator for lava dome eruptions. Front. Earth Sci. 4:41. doi: 10.3389/feart.2016.00041
Kendrick, J. E., Smith, R., Sammonds, P., Meredith, P. G., Dainty, M., and Pallister, J. S. (2013). The influence of thermal and cyclic stressing on the strength of rocks from Mount St. Helens, Washington. Bull. Volcanol. 75, 1–12. doi: 10.1007/s00445-013-0728-z
Kilburn, C. R. J. (2018). Forecasting volcanic eruptions: beyond the failure forecast method. Front. Earth Sci. 6:133. doi: 10.3389/feart.2018.00133
Komorowski, J. C., Legendre, Y., Christopher, T., Bernstein, M., Stewart, R., Joseph, E., et al. (2010). Insights into processes and deposits of hazardous vulcanian explosions at Soufrière Hills Volcano during 2008 and 2009 (Montserrat, West Indies). Geophys. Res. Lett. 37, 1–6. doi: 10.1029/2010GL042558
Kushnir, A. R. L., Martel, C., Bourdier, J. L., Heap, M. J., Reuschlé, T., Erdmann, S., et al. (2016). Probing permeability and microstructure: unravelling the role of a low-permeability dome on the explosivity of Merapi (Indonesia). J. Volcanol. Geotherm. Res. 316, 56–71. doi: 10.1016/j.jvolgeores.2016.02.012
Lamur, A., Kendrick, J. E., Eggertsson, G. H., Wall, R. J., Ashworth, J. D., and Lavallée, Y. (2017). The permeability of fractured rocks in pressurised volcanic and geothermal systems. Sci. Rep. 7:6173. doi: 10.1038/s41598-017-05460-4
Lavallée, Y., Benson, P. M., Heap, M. J., Hess, K. U., Flaws, A., Schillinger, B., et al. (2013). Reconstructing magma failure and the degassing network of domebuilding eruptions. Geology 41, 515–518. doi: 10.1130/G33948.1
Lavallée, Y., Heap, M. J., Kueppers, U., Kendrick, J. E., and Dingwell, D. B. (2019). “The fragility of Volcan de Colima - a material constraint,” in Volcan de Colima - Managing the Threat, eds N. R. Varley and J. C. Komorowski (Berlin: Springer Verlag).
Lavallée, Y., Hess, K. U., Cordonnier, B., and Dingwell, D. B. (2007). Non-Newtonian rheological law for highly crystalline dome lavas. Geology 35, 843–846. doi: 10.1130/G23594A.1
Lavallée, Y., Meredith, P. G., Dingwell, D. B., Hess, K. U., Wassermann, J., Cordonnier, B., et al. (2008). Seismogenic lavas and explosive eruption forecasting. Nature 453, 507–510. doi: 10.1038/nature06980
Le Friant, A., Boudon, G., Komorowski, J., Heinrich, P., and Semet, M. P. (2006). Potential flank-collapse of soufrière volcano, guadeloupe, lesser antilles? numerical simulation and hazards. Nat. Hazards 39, 381–393. doi: 10.1007/s11069-005-6128-8
Loughlin, S. C., Calder, E. S., Clarke, A., Cole, P. D., Luckett, R., Mangan, M. T., et al. (2002). Pyroclastic flows and surges generated by the 25 June 1997 dome collapse, Soufrière Hills Volcano, Montserrat. Geol. Soc. Lond. Mem. 21, 191–209. doi: 10.1144/GSL.MEM.2002.021.01.09
Loughlin, S. C., Luckett, R., Ryan, G., Christopher, T., Hards, V., De Angelis, S., et al. (2010). An overview of lava dome evolution, dome collapse and cyclicity at Soufrière Hills Volcano, Montserrat, 2005-2007. Geophys. Res. Lett. 37:L00E16. doi: 10.1029/2010GL042547
Marmoni, G. M., Martino, S., Heap, M. J., and Reuschlé, T. (2017). Multiphysics laboratory tests for modelling gravity-driven instabilities at slope scale. Procedia Eng. 191, 142–149. doi: 10.1016/j.proeng.2017.05.165
Morgan, J. K., and McGovern, P. J. (2005a). Discrete element simulations of gravitational volcanic deformation: 1. Deformation structures and geometries. J. Geophys. Res. B Solid Earth 110, 1–22. doi: 10.1029/2004JB003252
Morgan, J. K., and McGovern, P. J. (2005b). Discrete element simulations of gravitational volcanic deformation: 2. Mechanical analysis. J. Geophys. Res. B Solid Earth 110, 1–13. doi: 10.1029/2004JB003253
Mueller, S., Melnik, O., Spieler, O., Scheu, B., and Dingwell, D. B. (2005). Permeability and degassing of dome lavas undergoing rapid decompression: an experimental determination. Bull. Volcanol. 67, 526–538. doi: 10.1007/s00445-004-0392-4
Nakada, S., and Motomura, Y. (1999). Petrology of the 1991-1995 eruption at Unzen: effusion pulsation and groundmass crystallization. J. Volcanol. Geotherm. Res. 89, 173–196. doi: 10.1016/S0377-0273(98)00131-0
Nihei, K. T., Hilbert, L. B., Cook, N. G. W., Nakagawa, S., and Myer, L. R. (2000). Frictional effects on the volumetric strain of sandstone. Int. J. Rock Mech. Min. Sci. 37, 121–132. doi: 10.1016/S1365-1609(99)00098-2
Nolesini, T., Di Traglia, F., Del Ventisette, C., Moretti, S., and Casagli, N. (2013). Deformations and slope instability on Stromboli volcano: integration of GBInSAR data and analog modeling. Geomorphology 180–181, 242–254. doi: 10.1016/j.geomorph.2012.10.014
Paterson, M. S., and Wong, T. (2005). Experimental Rock Deformation - the Brittle Field, 2nd Edn. New York, NY: Springer.
Perras, M. A., and Diederichs, M. S. (2014). A review of the tensile strength of rock: concepts and testing. Geotech. Geol. Eng. 32, 525–546. doi: 10.1007/s10706-014-9732-0
Pola, A., Crosta, G. B., Fusi, N., and Castellanza, R. (2014). General characterization of the mechanical behaviour of different volcanic rocks with respect to alteration. Eng. Geol. 169, 1–13. doi: 10.1016/j.enggeo.2013.11.011
Robertson, R., Babal, K., Bass, V., Christopher, T., Chardot, L., Fergus, M., et al. (2009). Report for the Scientific Advisory Committee on Montserrat Volcanic Activity. Affiliation: Montserrat Volcano Observatory.
Schaefer, L. N., Kendrick, J. E., Oommen, T., Lavallée, Y., and Chigna, G. (2015). Geomechanical rock properties of a basaltic volcano. Front. Earth Sci. 3:29. doi: 10.3389/feart.2015.00029
Schaefer, L. N., Oommen, T., Corazzato, C., Tibaldi, A., Escobar-Wolf, R., and Rose, W. I. (2013). An integrated field-numerical approach to assess slope stability hazards at volcanoes: the example of Pacaya, Guatemala. Bull. Volcanol. 75, 1–18. doi: 10.1007/s00445-013-0720-7
Scholz, C. H. (1968). Microfracturing and the inelastic deformation of rock in compression. J. Geophys. Res. 73, 1417–1432. doi: 10.1029/JB073i004p01417
Simmons, J., Elsworth, D., and Voight, B. (2005). Classification and idealized limit-equilibrium analyses of dome collapses at Soufrière Hills volcano, Montserrat, during growth of the first lava dome: November 1995-March 1998. J. Volcanol. Geotherm. Res. 139, 241–258. doi: 10.1016/j.jvolgeores.2004.08.009
Siratovich, P. A., Heap, M. J., Villenueve, M. C., Cole, J. W., and Reuschlé, T. (2014). Physical property relationships of the Rotokawa Andesite, a significant geothermal reservoir rock in the Taupo Volcanic Zone, New Zealand. Geotherm. Energy 2:10. doi: 10.1186/s40517-014-0010-4
Smith, R., Sammonds, P. R., and Kilburn, C. R. J. (2009). Fracturing of volcanic systems: experimental insights into pre-eruptive conditions. Earth Planet. Sci. Lett. 280, 211–219. doi: 10.1016/j.epsl.2009.01.032
Smith, R., Sammonds, P. R., Tuffen, H., and Meredith, P. G. (2011). Evolution of the mechanics of the 2004-2008 Mt. St. Helens lava dome with time and temperature. Earth Planet. Sci. Lett. 307, 191–200. doi: 10.1016/j.epsl.2011.04.044
Stinton, A. J., Bass, V., Christopher, T., Edgecome, N., Fergus, M., Pascal, K., et al. (2017). MVO Scientific Report for Volcanic Activity between 1 April and 30 September 2017. Affiliation: Montserrat Volcano Observatory.
Stinton, A. J., Cole, P. D., Odbert, H. M., Christopher, T., Avard, G., and Bernstein, M. (2014a). Dome growth and valley fill during Phase 5 (8 October 2009-11 February 2010) at the Soufrière Hills Volcano, Montserrat. Geol. Soc. Lond. Mem. 39, 113–131. doi: 10.1144/M39.6
Stinton, A. J., Cole, P. D., Stewart, R. C., Odbert, H. M., and Smith, P. (2014b). The 11 February 2010 partial dome collapse at Soufrière Hills Volcano, Montserrat. Geol. Soc. Lond. Mem. 39, 133–152. doi: 10.1144/M39.7
Tibaldi, A., Bistacchi, A., Pasquarè, F. A., and Vezzoli, L. (2006). Extensional tectonics and volcano lateral collapses: insights from Ollagüe volcano (Chile-Bolivia) and analogue modelling. Terra Nova 18, 282–289. doi: 10.1111/j.1365-3121.2006.00691.x
Torabi, S. R., Ataei, M., and Javanshir, M. (2011). Application of Schmidt rebound number for estimating rock strength under specific geological conditions. J. Min. Environ. 1, 1–8.
Trofimovs, J., Sparks, R. S. J., and Talling, P. J. (2008). Anatomy of a submarine pyroclastic flow and associated turbidity current: July 2003 dome collapse, Soufrière Hills volcano, Montserrat, West Indies. Sedimentology 55, 617–634. doi: 10.1111/j.1365-3091.2007.00914.x
Ulusay, R., and Hudson, J. A. (eds). (1979). The Complete ISRM Suggested Methods for Rock Characterization: Testing and Monitoring 1974-2006. Ankara: ISRM Turkish National Group.
Vidal, N., and Merle, O. (2000). Reactivation of basement faults beneath volcanoes: a new model of flank collapse. J. Volcanol. Geotherm. Res. 99, 9–26. doi: 10.1016/S0377-0273(99)00194-8
Voight, B. (2000). Structural stability of andesite volcanoes and lava domes. Philos. Trans. R. Soc. Lond. 358, 1663–1703. doi: 10.1098/rsta.2000.0609
Voight, B., and Elsworth, D. (2000). Instability and collapse of hazardous gas-pressurized lava domes. Geophys. Res. Lett. 27, 1–4. doi: 10.1029/1999GL008389
Wadge, G., Voight, B., Sparks, R. S. J., Cole, P. D., Loughlin, S. C., and Robertson, R. E. (2014). An overview of the eruption of Soufrière Hills Volcano, Montserrat from 2000 to 2010. Geol. Soc. Lond. Mem. 39, 1–40. doi: 10.1144/M39.1
Walsh, J. B. (1965). The effect of cracks on the uniaxial elastic compression of rocks. J. Geophys. Res. 70, 399–411. doi: 10.1029/JZ070i002p00399
Yagiz, S. (2009). Predicting uniaxial compressive strength, modulus of elasticity and index properties of rocks using the Schmidt hammer. Bull. Eng. Geol. Environ. 68, 55–63. doi: 10.1007/s10064-008-0172-z
Yasar, E., and Erdogan, Y. (2004). Estimation of rock physicomechanical properties using hardness methods. Eng. Geol. 71, 281–288. doi: 10.1016/S0013-7952(03)00141-8
Ylmaz, I., and Sendr, H. (2002). Correlation of Schmidt hardness with unconfined compressive strength and Young’s modulus in gypsum from Sivas (Turkey). Eng. Geol. 66, 211–219. doi: 10.1016/S0013-7952(02)00041-8
Young, S. R., Sparks, R. S. J., Aspinall, W. P., Lynch, L. L., Miller, A. D., Robertson, R. E. A., et al. (1998). Overview of the eruption of Soufrière Hills Volcano, Montserrat, 18 July 1995 to December 1997. Geophys. Res. Lett. 25, 3389–3392. doi: 10.1029/98GL01405
Keywords: Soufrière Hills volcano, lava dome, mechanical properties, strength, porosity, mineralogy, Schmidt hammer
Citation: Harnett CE, Kendrick JE, Lamur A, Thomas ME, Stinton A, Wallace PA, Utley JEP, Murphy W, Neuberg J and Lavallée Y (2019) Evolution of Mechanical Properties of Lava Dome Rocks Across the 1995–2010 Eruption of Soufrière Hills Volcano, Montserrat. Front. Earth Sci. 7:7. doi: 10.3389/feart.2019.00007
Received: 02 November 2018; Accepted: 18 January 2019;
Published: 06 February 2019.
Edited by:
Luis E. Lara, Servicio Nacional de Geología y Minería, ChileReviewed by:
Oleg E. Melnik, Lomonosov Moscow State University, RussiaCopyright © 2019 Harnett, Kendrick, Lamur, Thomas, Stinton, Wallace, Utley, Murphy, Neuberg and Lavallée. This is an open-access article distributed under the terms of the Creative Commons Attribution License (CC BY). The use, distribution or reproduction in other forums is permitted, provided the original author(s) and the copyright owner(s) are credited and that the original publication in this journal is cited, in accordance with accepted academic practice. No use, distribution or reproduction is permitted which does not comply with these terms.
*Correspondence: Claire E. Harnett, ZWVjZWhAbGVlZHMuYWMudWs=
Disclaimer: All claims expressed in this article are solely those of the authors and do not necessarily represent those of their affiliated organizations, or those of the publisher, the editors and the reviewers. Any product that may be evaluated in this article or claim that may be made by its manufacturer is not guaranteed or endorsed by the publisher.
Research integrity at Frontiers
Learn more about the work of our research integrity team to safeguard the quality of each article we publish.