
95% of researchers rate our articles as excellent or good
Learn more about the work of our research integrity team to safeguard the quality of each article we publish.
Find out more
ORIGINAL RESEARCH article
Front. Earth Sci. , 05 March 2019
Sec. Biogeoscience
Volume 6 - 2018 | https://doi.org/10.3389/feart.2018.00246
This article is part of the Research Topic Critical Zone (CZ) Export to Streams as Indicator for CZ Structure and Function View all 9 articles
 Jesse R. Armfield1
 Julia N. Perdrial1*
 Alex Gagnon1
 Jack Ehrenkranz1Nicolas Perdrial1
 Malayika Cincotta1
 Donald Ross2
 James B. Shanley3Kristen L. Underwood4Peter Ryan5
Stream water pH and composition are widely used to monitor ongoing recovery from the deposition of strong anthropogenic acids in many forested headwater catchments in the northeastern United States. However, stream water composition is a function of highly complex and coupled processes, flowpaths, and variations in soil and bedrock composition. Spatial heterogeneity is especially pronounced in headwater catchments with steep topography, potentially limiting stream water composition as an indicator of changes in critical zone (CZ) dynamics during system recovery. To investigate the link between catchment characteristics, landscape position, and stream water composition we used long-term data (1991–2015) from the Sleepers River Research Watershed (SRRW) in northeastern Vermont. We investigated trends with time in stream water and trends with time, depth, and landscape position (upslope, midslope, and riparian zone) in groundwater (GW) and soil solution. We further determined soil elemental composition and mineralogy on archived (1996) and modern (2017) soil samples to assess changes in composition with time. SRRW is inherently well-buffered by calcite in bedrock and till, but soils had become acidified and are now recovering from acidification. Although base cations, especially Ca, decrease progressively with time in GW, riparian soils have become more enriched in Ca, due to a mixture of lateral and vertical transfers. At the same time stream water Ca fluxes increased over the past two decades, likely due to the leaching of (transient) legacy Ca from riparian zones and increased water fluxes. The stream water response therefore reflects the dynamic changes in soil chemistry, flow routing and water inputs.
Streams indicate critical zone (CZ) function, because they represent an integrated signal of watershed processes (Frisbee et al., 2011) including internal stream processes (Mulholland and Hill, 1997; Dawson et al., 2001) and processes occurring at the interfaces (i.e., riparian or hyporheic zones) (Bishop et al., 2004; Winterdahl et al., 2011). For example, the effects of acid deposition, especially prevalent in the northeastern United States (Likens et al., 1972), have been monitored using stream water observations (Newell and Skjelkvåle, 1997; Amiotte-Suchet et al., 1999; Huang et al., 2017).
Acid deposition forms when emission-derived sulfur dioxide and nitrogen oxides interact with precipitation, which impacts the entire CZ through a multitude of complex and coupled processes, including declining tree and soil quality due to low pH and base cation leaching (Matzner and Murach, 1995; Driscoll et al., 2001; Raddum et al., 2007). The ensuing stream water signals are typically sensitive to these effects and showed low pH, increased concentrations of acid anions (sulfate and nitrate), and increased effluxes of base cations (e.g., Ca and Na) from many acid-impacted systems (Newell and Skjelkvåle, 1997; Driscoll et al., 2001; Garmo et al., 2014). In the United States, legislation passed in 1970 and 1990 led to reductions in emissions that caused a slow increase in precipitation pH as well as a decrease in the acid anion content across affected regions, and stream water composition has since been monitored closely for signs of recovery (Newell and Skjelkvåle, 1997; Driscoll et al., 2001; Skjelkvåle, 2003; Rice and Herman, 2012; Rogora et al., 2013; Garmo et al., 2014; Kopáček et al., 2016).
However, because streams merge water and solutes from various sources, the attribution of changes in stream water chemistry to specific process locations without detailed investigations of the CZ is difficult. For example, one CZ process strongly affected by the presence of strong acids (mostly H2SO4 and HNO3) is weathering, i.e., the breakdown of bedrock and regolith through physical and chemical processes (Jin et al., 2010). Chemical weathering includes simple dissolution reactions (typical for carbonates) and hydrolysis (typical for silicates). Both processes are driven by proton availability and in the case of most silicate minerals weathering reactions are incongruent, i.e., they generate dissolved weathering products and form secondary minerals (Strawn et al., 2015). As such, weathering and soil development continuously change the composition of the solid CZ and the composition of percolating waters [e.g., soil solution and groundwater (GW)]. Another important process is the leaching of base cations from acid-impacted soils that lead to declines in soil health. These changes can be clear in headwater catchments with pronounced topography, even within just a few decades of changes in precipitation chemistry due to the transfer of soluble materials to deeper soil layers, GW (vertical transfer), and/or via lateral transfer to low-lying landscape positions (Johnson et al., 2000; Nezat et al., 2004; Brantley et al., 2007; Bailey et al., 2014; Lawrence et al., 2015; Lybrand and Rasmussen, 2015).
Stream water composition is therefore strongly affected by flowpaths that intersect different layers of a heterogeneous CZ. Accordingly, backtracking to identify specific processes requires information on soils as well as subsurface waters. We attempt this backtracking to identify signals of recovery in streams and soils using the well-studied Sleepers River Research Watershed (SRRW) in northeastern Vermont as a testbed. SRRW received strong acids through wet and dry deposition but, unlike many other watersheds in the NE, contains carbonate-bearing parent material that buffers the pH of percolating water. The impact of acid deposition on the CZ is therefore less dramatic but potentially visible due to the sensitivity of carbonates to only small changes in acid inputs.
In order to investigate how the CZ at SRRW responds to changes in precipitation chemistry in the stream signal and how compositional differences by landscape position influence this signal, we analyzed long-term stream water (1991-present), soil solution (2004–2013), and GW composition (2004–2013) at various landscape positions. Data analyzed include: pH, acid anions (nitrate and sulfate), base cations (Na and Ca) and Si. To test for changes in soil composition with time we investigated soil elemental composition (Si, Al, Na, and Ca) and mineralogy data from archived (1996) and modern (2017) soil samples of varying landscape position.
Because silicate weathering at the watershed scale is a slow process, we hypothesize that changes in acid deposition are not recorded as significant trends of silicate weathering products in the stream over our 24-year study period. However, we hypothesize that carbonate weathering and base cation leaching slowed, leading to decreases in Ca flux in the stream since 1991. We further hypothesize that topographically induced transfer of base cations led to depletions in shallow horizons at upslope and midslope locations while near-stream soils led to enrichments in base cations, especially Ca.
The SRRW comprises a series of nested catchments with varying land use in northeastern VT (Figure 1). The forested headwater watershed, W-9, is the focus of this study and is underlain by the Waits River Formation, which includes a quartz-mica phyllite member interbedded with calcareous granulite (Ferry, 1991; Ratcliffe et al., 2011). This formation is covered by up to 4 m of dense silty basal till from the last glaciation, (Shanley, 2000) which itself is sourced from the underlying Waits River Formation (53%) and the nearby Gile Mountain Formation (25%; Hornbeck et al., 1997). The presence of carbonates in bedrock and till contributes to the high buffering capacity and high pH in stream waters, despite historic acid deposition (Hornbeck et al., 1997; Shanley, 2000).
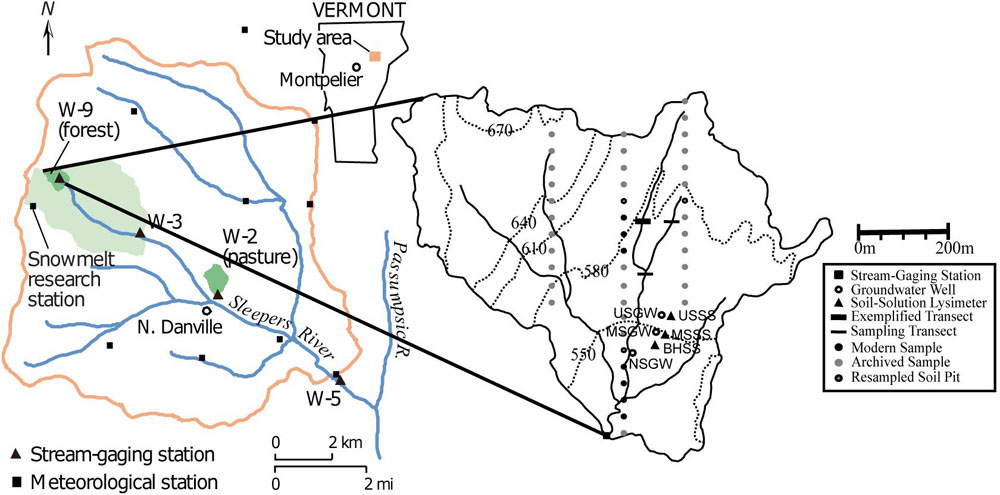
Figure 1. Location of the Sleepers River watershed and nested subwatershed in Vermont with locations of well, soil pits and augered transects (modified after Kendall et al., 1999; Shanley, 2000, with permission).
Annual precipitation averages 1320 mm, of which up to 30% falls as snow. The average maximum snow water equivalent approaches 280 mm, and the annual spring snowmelt is a dominant hydrologic event (Shanley et al., 2004). Decades-long research on the hydrology and biogeochemistry of W-9 has provided insights into water routing and stream flow contribution (Hornbeck et al., 1997; Shanley et al., 2015). Saturation-excess overland flow is an important contribution to streamflow generation, stored catchment water typically controls stream response, and convergent landscape positions especially contribute to event stream waters (McGlynn et al., 1999; Shanley et al., 2015). Because this area was a till deposition zone for the SE-moving Wisconsinan glaciation, the shallow aquifer is dominated by till with fine silt texture and a low saturated hydraulic conductivity that increases from near 0.1 mm/hr within the till to as much as 100 mm/hr in some surficial soils (Kendall et al., 1999). Streamflow has a relatively flashy response to precipitation, but water stored in the till sustains base flow such that W-9 has never ceased to flow, while comparable size watersheds in the region, including Hubbard Brook New Hampshire, routinely dry up in summer. This stored water helps contribute to an “old-water” dominated response in streamflow during events (Shanley et al., 2002).
Elevation at W-9 ranges from 519 to 678 m, and the terrain presents a mix of slopes of varying steepness and gently dipping riparian areas and wetlands. Because of this setting, landscape position strongly influences soils in W-9: Inceptisols (most prevalent) and Spodosols dominate on well-drained upland areas such as upslope and midslope areas (Shanley et al., 2004). Histosols are mostly found in poorly drained riparian areas and are often located where GW upwelling occurs (Shanley et al., 2004). The catchment is completely forested with second-growth northern hardwoods such as sugar maple, yellow birch, white ash and American beech, but softwood species (balsam fir and red spruce) are also present (Shanley et al., 2004). Like other catchments in the Northeastern United States, SRRW has been impacted by acid deposition that caused forest decline (branch dieback, some declining crown vigor) and low soil pH (Shanley et al., 2004). However, due to emissions regulations, SRRW is experiencing reduced acid inputs (Stoddard et al., 1999; Burns et al., 2005). In particular, sulfate concentrations in precipitation have been decreasing at SRRW (Shanley et al., 2004) and the NE more generally (Miles et al., 2012). Stream water dissolved organic matter has been measured weekly at SRRW since 1991 and increased steadily by 0.027 mg L-1 yr-1 (Cincotta et al., this special issues).
In order to assess trends in soil-, ground- and stream water composition, we used existing data on discharge, pH, sulfate, nitrate, Si, Ca, and Na that have been collected weekly and during events at SRRW over 24 years (chemistry database doi: 10.5066/P9380HQG, flow database doi: 10.5066/P929KMVK). For soil solution, we used data from 3 sets of nested zero-tension lysimeters that occupy three main landscape positions (upslope, midslope, and base of the hill) and sample at 15 cm (shallow), and 50 cm (deep). Groundwater wells screened at various depths (Table 1) occupy the same landscape positions as lysimeters and were used to monitor changes in GW composition. Both soil solution and GW compositions were determined on approximately biweekly samples between 2004 and 2013 but due to intermittently dry conditions, soil solution samples were obtained less frequently. Stream water composition for the same solutes was available from approximately weekly grab sample collection between 1991 and 2015 at the stream gauge at the base of the watershed (Figure 1).
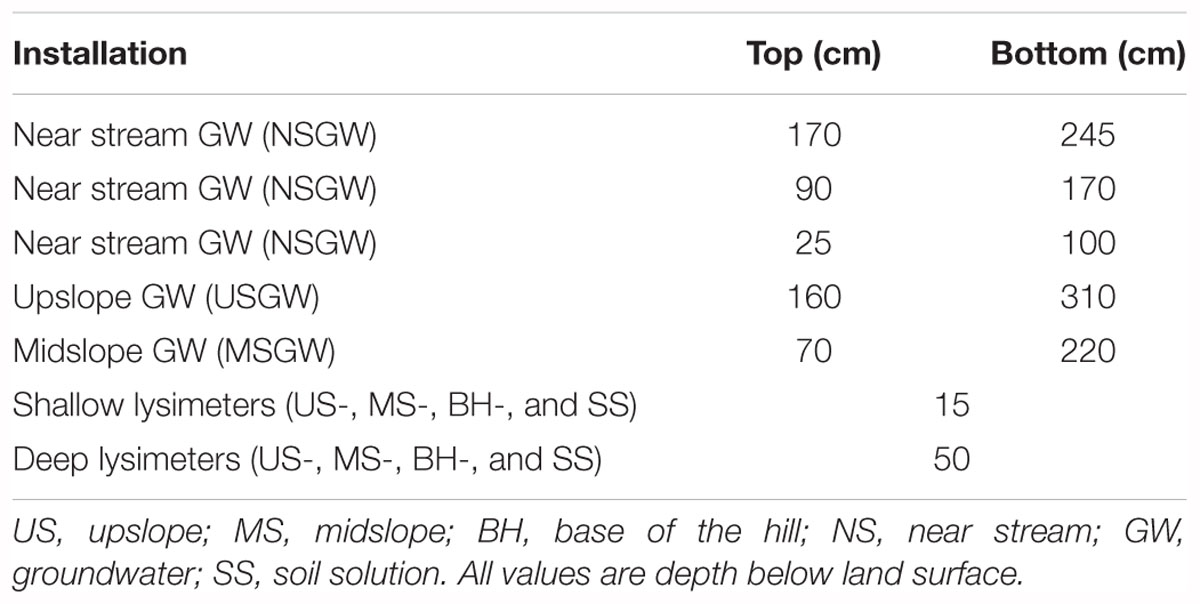
Table 1. Screened intervals (wells) and sampling depth (lysimeters).
In addition to existing data, we collected samples from lysimeters, wells and the stream in the fall of 2017 for dissolved inorganic carbon (DIC) isotope analysis to test for carbonate weathering signals. Lysimeters and wells were pumped and allowed to recharge prior to sampling and all samples were capped immediately with no headspace, placed in a cooler, and shipped to the UC Davis Stable Isotope Facility within 24 h of collection.
To investigate landscape position controls on soil composition, we took soil samples every 1–3 m in three transects that spanned from upslope to midslope to near stream areas (Figure 1). Two transects cut across the two main tributaries, and one transect cut across a few meters below the confluence of the tributaries (Figure 1). These transect samples were taken using a bucket auger in 15-cm depth increments until 90 cm or depth of refusal.
To increase the statistical power of results and to allow for an in-depth analysis of compositional changes in soil with depth and landscape position, we additionally sampled each of the three soil orders from soil pits by taxonomic horizon in various locations throughout W-9 in 2017 (Figure 1). In order to allow for comparison with soils prior to recovery, we also analyzed archived samples (stored at room temperature in the dark in sealed glass vials) collected as part of a soil survey in 1996 (n = 156). We used average values of soil composition in archived (1996) and modern (2017) samples, some of which were re-sampled in the same approximate location (Figure 1).
Soil samples prepared for XRF and powder XRD were air dried (4–5 days), sieved (<2 mm), ground and homogenized in a ball mill, and stored dry prior to analysis. Soil elemental composition was determined on both archived samples (n = 156) and modern transect samples (n = 121) as well as samples from representative landscape positions of modern (n = 43) and archived soils (n = 78) using a Thermo Scientific Niton XL3t X-Ray Fluorescence Analyzer and a Thermo Scientific ARL QUANT’X X-Ray Fluorescence Spectrometer in the Geology Department at the University of Vermont and Middlebury College, respectively. From these data we calculated mass transfer coefficients (MTC) to determine the pedogenetic behavior of selected elements (Si, Al, Na, Ca; Brimhall and Dietrich, 1987; Brantley et al., 2007). For parent material we did not use bedrock or till, but the deepest sampled horizon (i.e., partially weathered till) because parent material composition in this area varies greatly across the watershed. MTC values therefore only show depletion vs. enrichment relative to the deepest accessible horizon. We used Ti as an immobile element because of its normal distribution in the parent material. All data from each soil order of the 1996 survey as well as the representative data from 2017 were averaged by horizon to assess the variability of each horizon of each soil order. Relative MTC was calculated as:
where MTC (dimensionless) is the ratio of the concentration (C) of an element of interest (subscript M) relative to an immobile element (subscript I) in the weathered soil (subscript W) and the parent material (subscript P). Soil mineralogy was identified using X-ray diffraction (XRD) on random powder mounts from modern soil samples from each resampled pit. In order to identify secondary clay minerals, samples from the lowest horizon (till) were also analyzed using oriented texture preparations of the <2 μm fraction that was separated by decantation (Poppe et al., 2001). Suspensions were pipetted on glass slide preparations and allowed to air-dry. This approach allows for an orientation of crystallites that restricts diffraction in the crystallographic c-direction and hence only the (00l) intervals are visible (Lagaly, 1993; Moore and Reynolds, 1997). The clay fraction was analyzed air-dried (AD), treated with ethylene glycol (EG) to test for presence of swelling clay, and heat-treated (HT, 400 and 550°C) to collapse the chlorite peaks to test for overlap with the kaolinite reflections (Moore and Reynolds, 1997). XRD analysis of all samples was conducted on a Rigaku Miniflex II Powder Diffractometer with CuKα radiation, operated at 30 kV and 15 mA. Scanning parameters were set at 0.02 step width and a count time of 10 s per step between 3 and 5–65 °2𝜃.
All statistical analyses were completed in R (R Core Development Team, 2017). Stream flux was calculated to evaluate trends in recovery (sulfate, nitrate) and weathering (Si, Na, and Ca). All stream flux calculations were completed using the USGS LoadEst functions (Runkel et al., 2004) implemented within the LoadFlex package and trend analyses were conducted using the Kendall and trend packages (McLeod, 2011; Appling et al., 2015; R Core Development Team, 2017; Pohlert, 2018). LoadEst requires daily time steps, therefore concentration and discharge of highly sampled storm events were entered as daily averages. The best of the 9 predefined LoadEst models was then selected based on how accurately it predicted measured values and was applied to the discharge record for annual flux calculation.
Flow adjusted residuals of the concentration-discharge relationship were then evaluated and, if they were not normally distributed, a Mann-Kendall trend analysis was conducted and the Sen slope was calculated. Baseflow composition was determined by calculating the mean stream composition during discharge conditions lower than the 20th percentile and storm flow composition was determined by calculating the mean stream composition during the of discharge conditions greater than the 80th percentile. Baseflow and stormflow composition were also computed at less than the 5th percentile and greater than 95th percentile.
The significance of trends in soil solution and GW composition with time and space were evaluated using several methods. For temporal trends in GW, linear regressions on raw data were used first as this method is powerful and if significance is established no more statistical analyses are needed to draw conclusions (Meals et al., 2011). Temporal trends in GW concentration were evaluated using data from the well with the most complete record (the well at the upslope). In the case of highly variable seasonal compositions, regressions on annual averages were implemented. When large parts of the datasets (>1/3 of the record) were missing or other tests failed to establish a trend, Welch’s 2 sample t tests were used to evaluate any differences in composition (Meals et al., 2011; Derrick and White, 2016). Trends in space were evaluated by calculating the average and standard error at each depth and landscape position. If averages were within error of one another, Welch’s 2 sample t test was used to determine whether the data sets were significantly different (Derrick and White, 2016).
Discharge showed large variations (ranging from 7.4∗104 m3 yr-1 in 2001 to 1.5∗105 m3 yr-1 in 2011) and increased slightly but significantly (Figure 2A). Stream water pH values showed large, mostly seasonal, variations between 1991 and 2004 with values ranging from 6.7 up to 8.6 with less variability thereafter (Figure 2B and Supplementary Materials). Annual stream water sulfate flux decreased more than 30% since 1991 (from 870 to 580 kg yr-1, Figure 2C) and Mann Kendall trend analysis on flow adjusted model residuals indicated a significant negative trend in sulfate concentration (τ = -0.442, Sens Slope = -0.007, p < 0.05). The annual nitrate flux showed large interannual variability (between 60 and 105 kg NO3- per year) but no significant increase or decrease over time (Figure 2D).
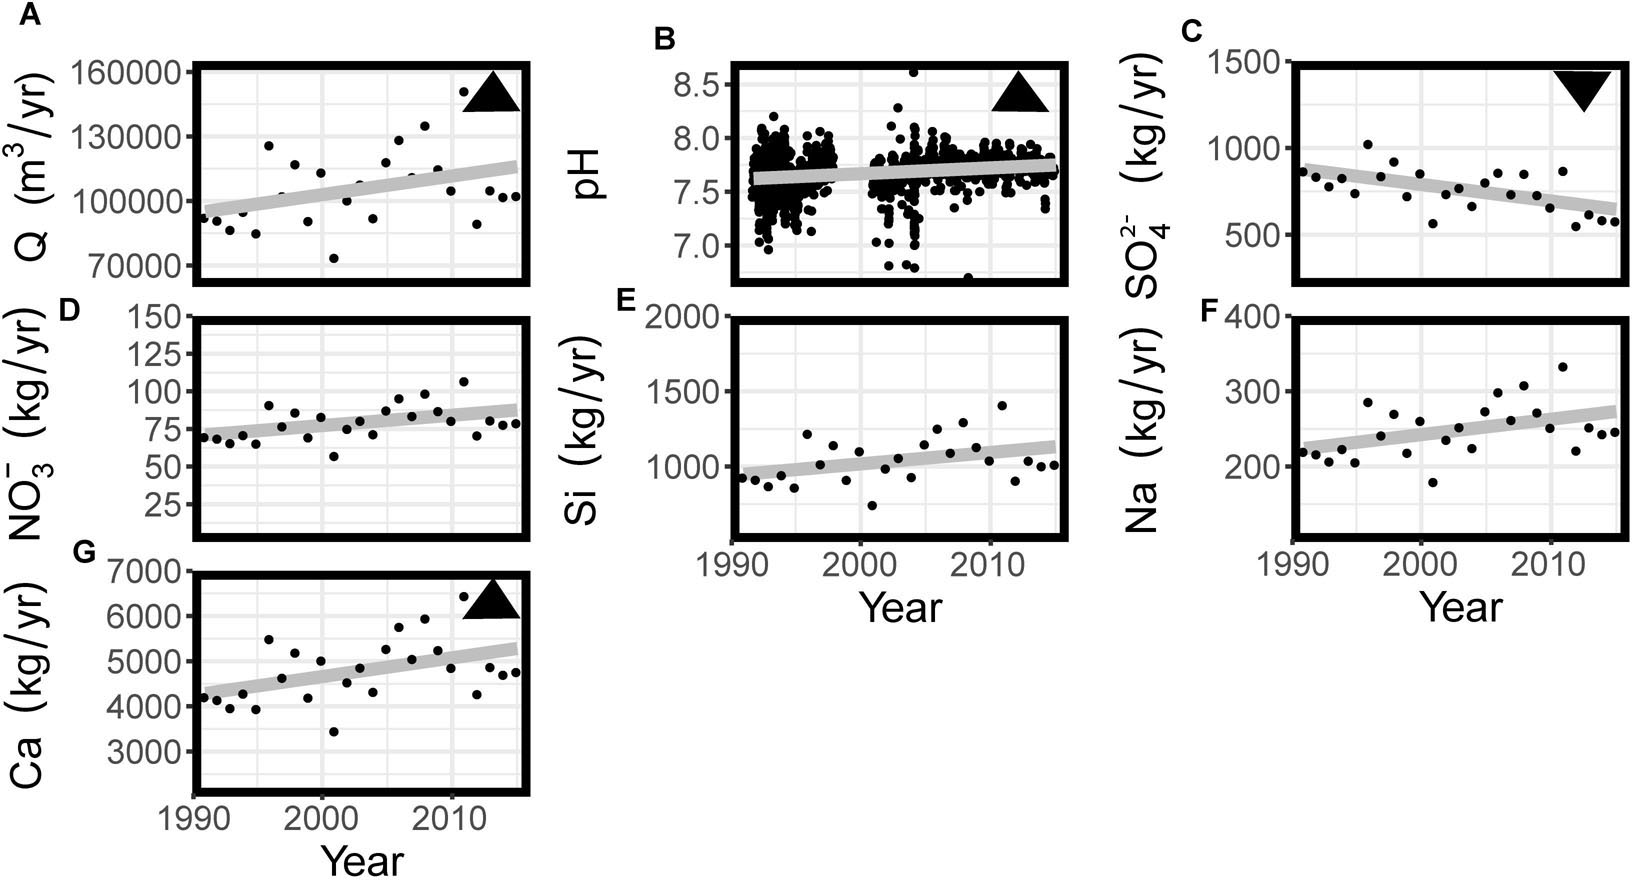
Figure 2. Complete time series for (A) discharge (Q), for the water year (B) pH measurements, and (C–G) annual flux of selected solutes (calendar year). Triangles in the top right corner indicate the directionality of statistically significant trends of linear regression.
Both Si and Na stream water flux showed large interannual variability (ranging from 750 to 1400 kg yr-1 for Si and from 180 to 330 kg yr-1 for Na, Figures 2E,F). Mann Kendall trend analyses showed no significant trends in Si and Na concentration. The flux of Ca showed similarly large variations (ranging from 3450 and 6450 kg yr-1) and a slight increase that was significant (τ = 0.078, Sens Slope = 0.002, p < 0.05). The great interannual variability in fluxes is in agreement with the interannual variability in discharge (Figure 2A), showing very wet years in 1996, 2008 and 2011 and much drier years in 1995, 2001, and 2012.
We also investigated groundwater and soil water composition for trends with time, depth, and landscape position (upslope vs. midslope vs. base of the hill). Temporal trends are exemplified for selected years with typical annual precipitation (i.e., years 2004, 2008, and 2012). Significance was established using linear regression on the entire time series (see Supplementary Material Figure S1 for complete time series of GW composition).
Soil solution pH increased over time especially in deep and some shallow soil solution and was generally greater at depth and with proximity to the stream (Figure 3A). GW pH in the upslope well increased from an annual average of 7.9 ± 0.3 in 2004 to an annual average of 8.1 ± 0.2 in 2012, which is higher than the average stream water pH at base flow (7.8 ± 0.2, Table 2).
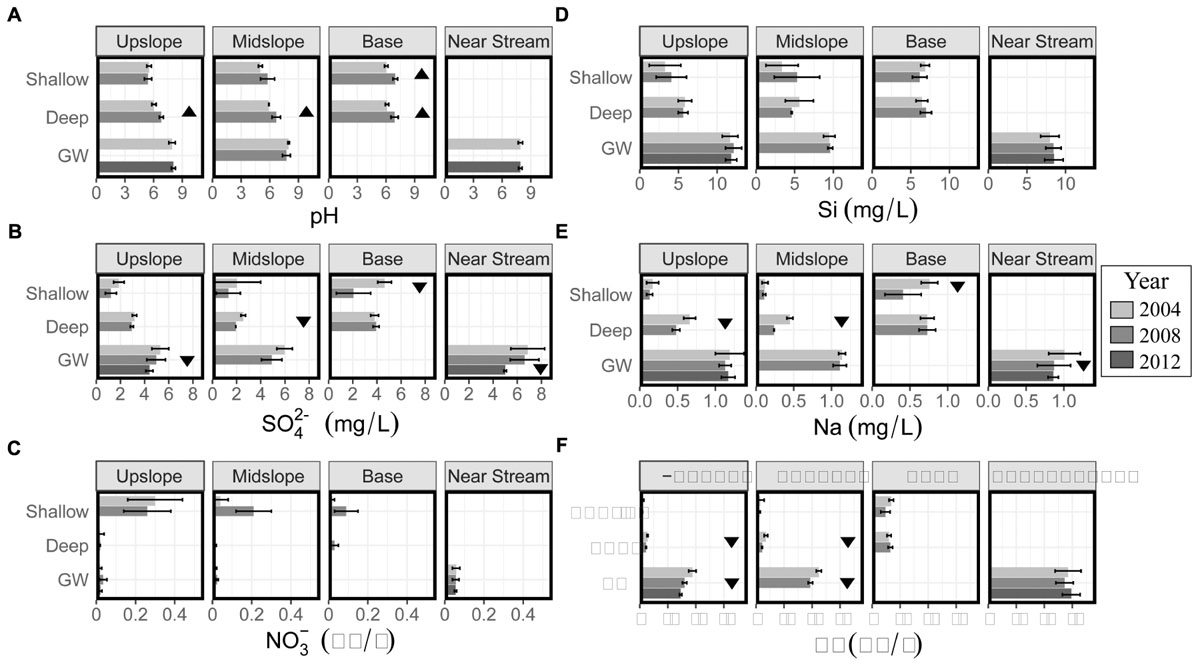
Figure 3. Mean annual (A) pH and (B–F) concentrations of selected solutes in soil water (shallow = 15 cm and deep = 50 cm) and GW at four landscape positions (upslope, slope, base, and near stream) between 2004 and 2012. Base of the hill (soil solution samples) and near stream (GW well) are in proximity to each other. Triangles indicate the directionality of statistically significant trends on the complete time series of data for each depth and landscape position.
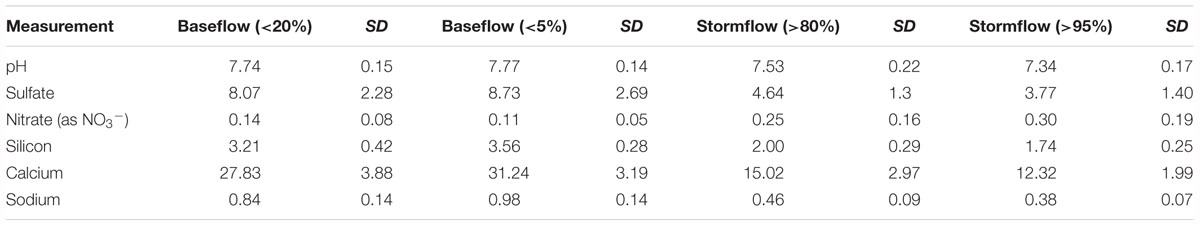
Table 2. Average stream water pH and concentration of selected solutes (mg/L) during baseflow and stormflow conditions from 1991 to 2015.
Sulfate concentrations generally decreased with time but were greater at depth and with proximity to the stream (Figure 3B). For example, the average sulfate concentration in all shallow soil water decreased from 3.2 ± 1.5 mg L-1 in 2004 to 1.6 ± 1.1 mg L-1 in 2008 and is in agreement with the general trend of decreasing sulfate over the years. GW sulfate decreased from an average of 5.3 ± 0.7 mg L-1 in 2004 to 4.4 ± 0.3 mg L-1 in 2012. The trend of increasing sulfate concentrations with depth was observed at the upslope position where the sulfate concentration in GW was up to 2.5 times higher than in soil water. The average stream water sulfate concentration at baseflow (<20%, 8.1 ± 2.3 mg L-1) was the highest mean sulfate concentration of any water source (Table 2).
Nitrate concentrations did not change significantly over time and were lower at depth and closer to the stream (Figure 3C). Annual average nitrate concentrations in shallow soil solution ranged from as low as 0.02 ± 0.01 mg L-1 at the base of the hill in 2004 to as high as 0.26 ± 0.12 mg L-1 at the hilltop position in 2008 (Figure 3C). Compared to upslope, nitrate concentrations at the base of the hill were slightly lower and similar to base flow stream water concentrations (Table 2).
Average annual soil and groundwater Si concentrations did not show significant changes with time but, like pH and sulfate, concentrations were generally greater with depth and proximity to the stream (Figure 3D). For example, Si in GW at the upslope position remained relatively constant since 2004 at an average value of 12 ± 0.2 mg L-1 (Figure 3D). Soil water Si concentrations were generally greater (6.7 ± 0.8 mg L-1) at the base of the hill than upslope. In contrast, near stream GW Si concentrations (8.4 ± 1.2 mg L-1) were almost 30% lower than upslope GW concentrations, (12.0 ± 0.8 mg L-1) which is still almost 3 times higher than stream water base flow concentrations (Table 2).
Annual average Na concentrations decreased with time in deep soil solution at the upslope and midslope positions and were generally lowest in upslope soil waters (as low as 0.6 ± 0.1 mg L-1) and largest in GW, which was similar to stream water composition at base flow (Table 2).
Ca concentrations generally decreased through the study period but were greater at depth and proximal to the stream (Figure 3F). Upslope GW Ca concentrations decreased significantly from 18.8 ± 1.3 mg L-1 in 2004 to 16.0 ± 0.8 mg L-1 in 2012 (Figure 3F) and were generally greater at depth (1.0 ± 0.7 mg L-1 in shallow soil water vs. 16.4 ± 2.4 mg L-1 in GW). Stream water Ca concentrations at base flow were similar to GW concentrations (Table 2).
The isotopic composition of DIC was determined for soil solution and GW. The mean δ13C-DIC of soil solution (-20.8 ‰ ± 1.2) was significantly lower than that of GW (-14.5 ‰ ± 1.5), and δ13C-DIC values also generally increased with proximity to the stream (Table 3).
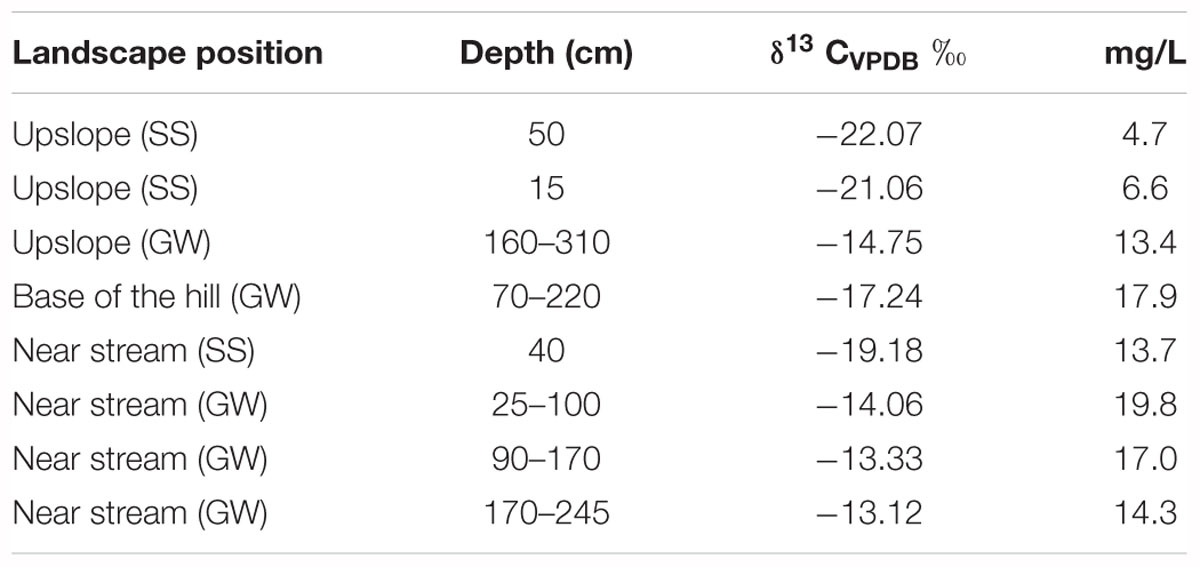
Table 3. δC13 of dissolved organic carbon and concentrations in soil solution (SS) and groundwater (GW) at different landscape positions and depths.
Spatial trends on transect samples generally showed depletions at upslope and midslope locations and accumulations in riparian areas (Figure 4 and Supplementary Figures S2, S3). The exception was Si that was, relative to the parent material, variably enriched or depleted in upslope and midslope positions (MTC values ranging from -0.51 to 0.64). Al was mildly depleted from upslope soils (-0.10 to -0.39) and accumulated in the top 45 cm of the profile closest to the stream. The base cations Na and Ca were typically depleted from the upslope soils (e.g., MTC values ranging from -0.86 to -0.08 for Ca) and accumulated in near stream soils, especially in the top 30 cm (up to 31.2 for Ca, Figure 4).
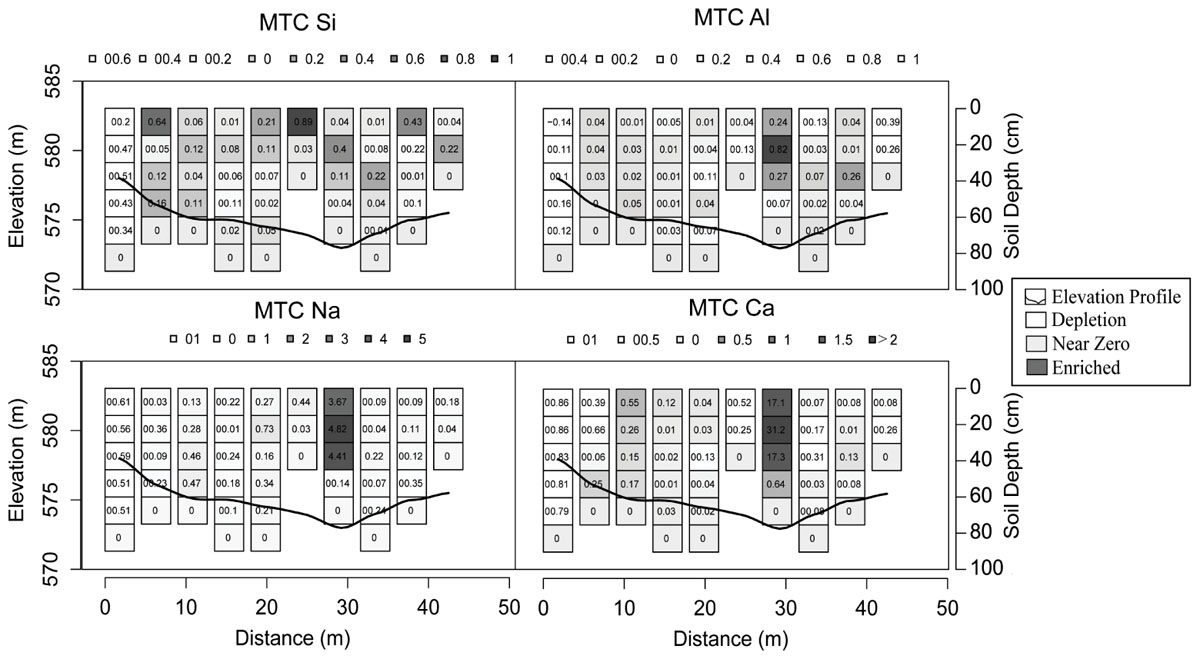
Figure 4. Mass transfer coefficient (MTC) values for selected elements on the exemplified transect with the greatest relief. Upslope soils are located on each end of the elevation contour, near stream soils are located at the lowest elevation, and all other soils are defined as midslope soils. The color ramp ranges from white to black indicating depletions (white), near zero values (gray), and enrichments (black).
Temporal trends in soil elemental composition were investigated by comparing MTC values from archived and modern samples (Figures 5–7). The variability in typical upslope soils (mostly Spodosols) was great, as indicated by the broad shaded areas (Figure 5), but generally showed a combined accumulation-depletion pattern (Figure 5). For example, MTC values for Si indicated mild enrichments (e.g., archived mean = 0.12 ± 0.36 in the O horizon) in the upper horizons (O, A, E) and depletions in lower horizons (e.g., archived mean = -0.28 ± 0.11 for the BC horizon). Aluminum also showed an addition-depletion profile where MTC values were negative at the surface and positive in the spodic horizon. Base cations were generally enriched and highly variable in the O horizon but depleted in underlying mineral soil (e.g., archived mean up to -0.58 ± 0.19 for Na). The differences between archived and modern samples were not significant for any of the investigated elements except Ca, which was generally more enriched in the top horizons of archived soils.
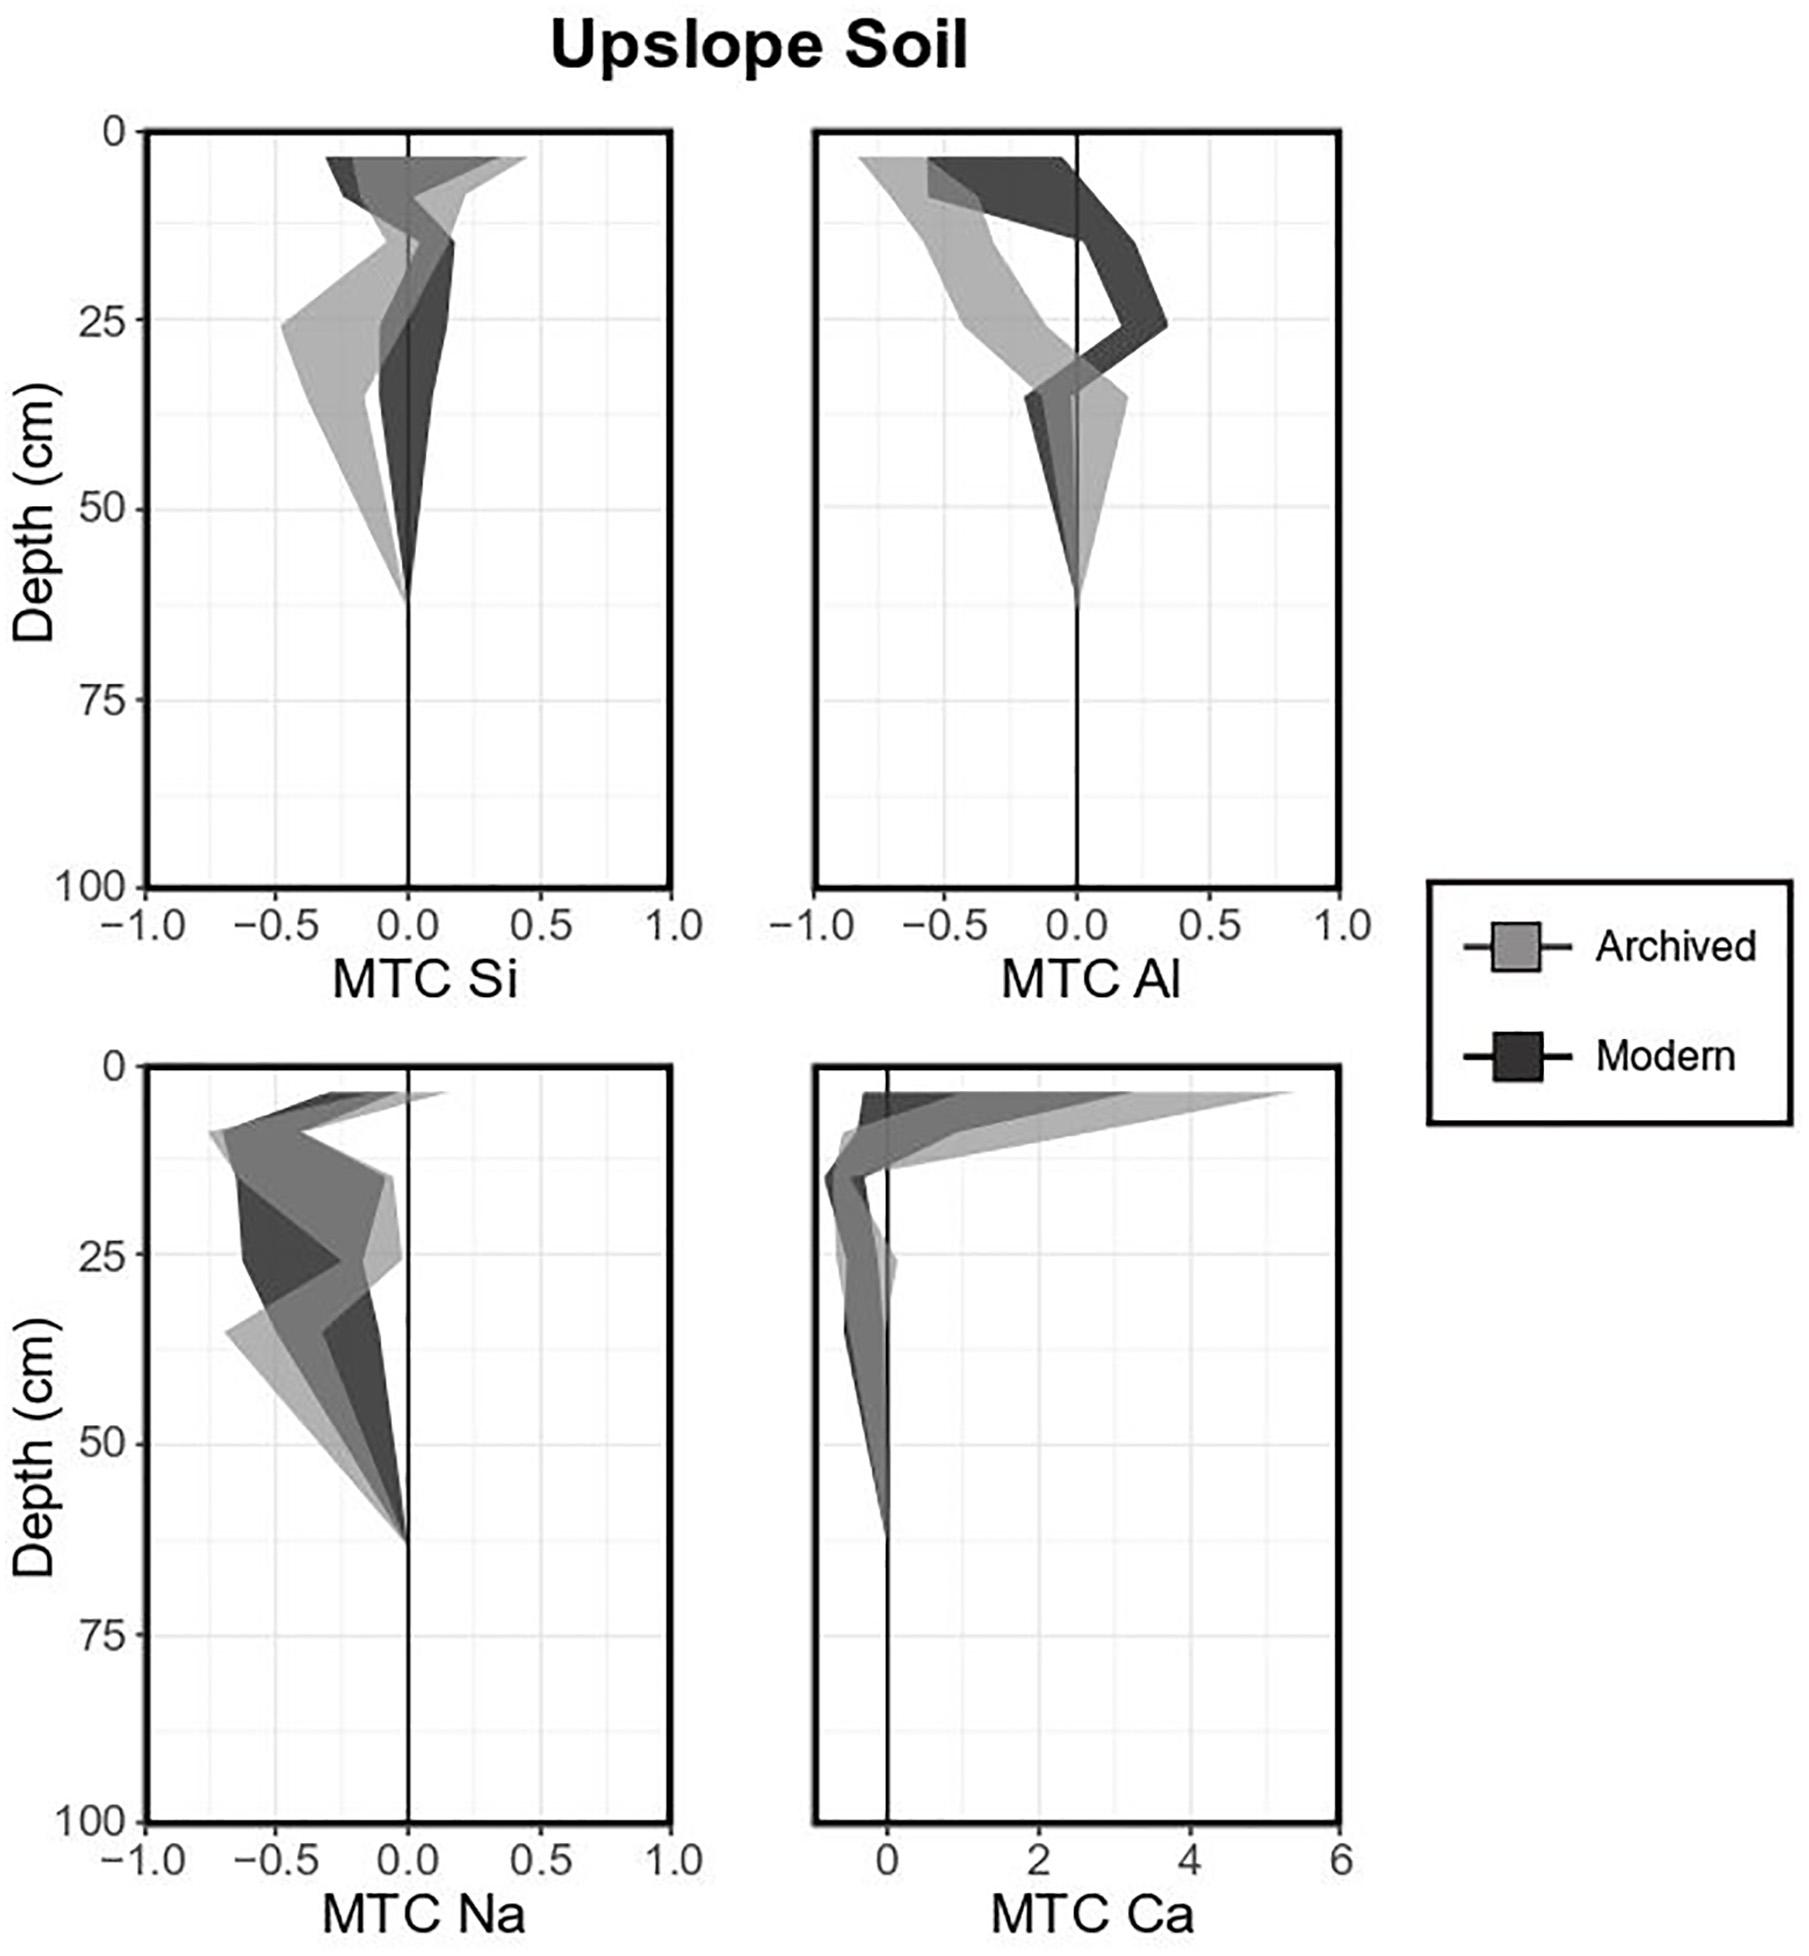
Figure 5. Mass transfer coefficient (MTC) values of selected elements for a typical upslope soil (Spodosol). Light gray shaded areas indicate means and standard deviations for each element measured in 1996 (8 pits), dark gray shaded areas indicate means and standard deviations for each element measured in 2017 (3 pits).
Midslope Inceptisol composition in the study area was less variable compared to Spodosols (shaded areas are less broad, Figure 6). Overall, Si was depleted throughout the profile (archived means between -0.04 ± 0.25 and -0.16 ± 0.17, Figure 6), while Al in archived samples was somewhat depleted in upper horizons and was depleted in lower horizons in modern samples. MTC values for base cations, especially Ca, were highly variable in the O horizon (e.g., archived mean = 3.65 ± 4.18 for Ca). As for Spodosols, differences between archived and modern samples was only significant for Ca in the top horizons, where Ca MTC values were significantly higher in archived soils.
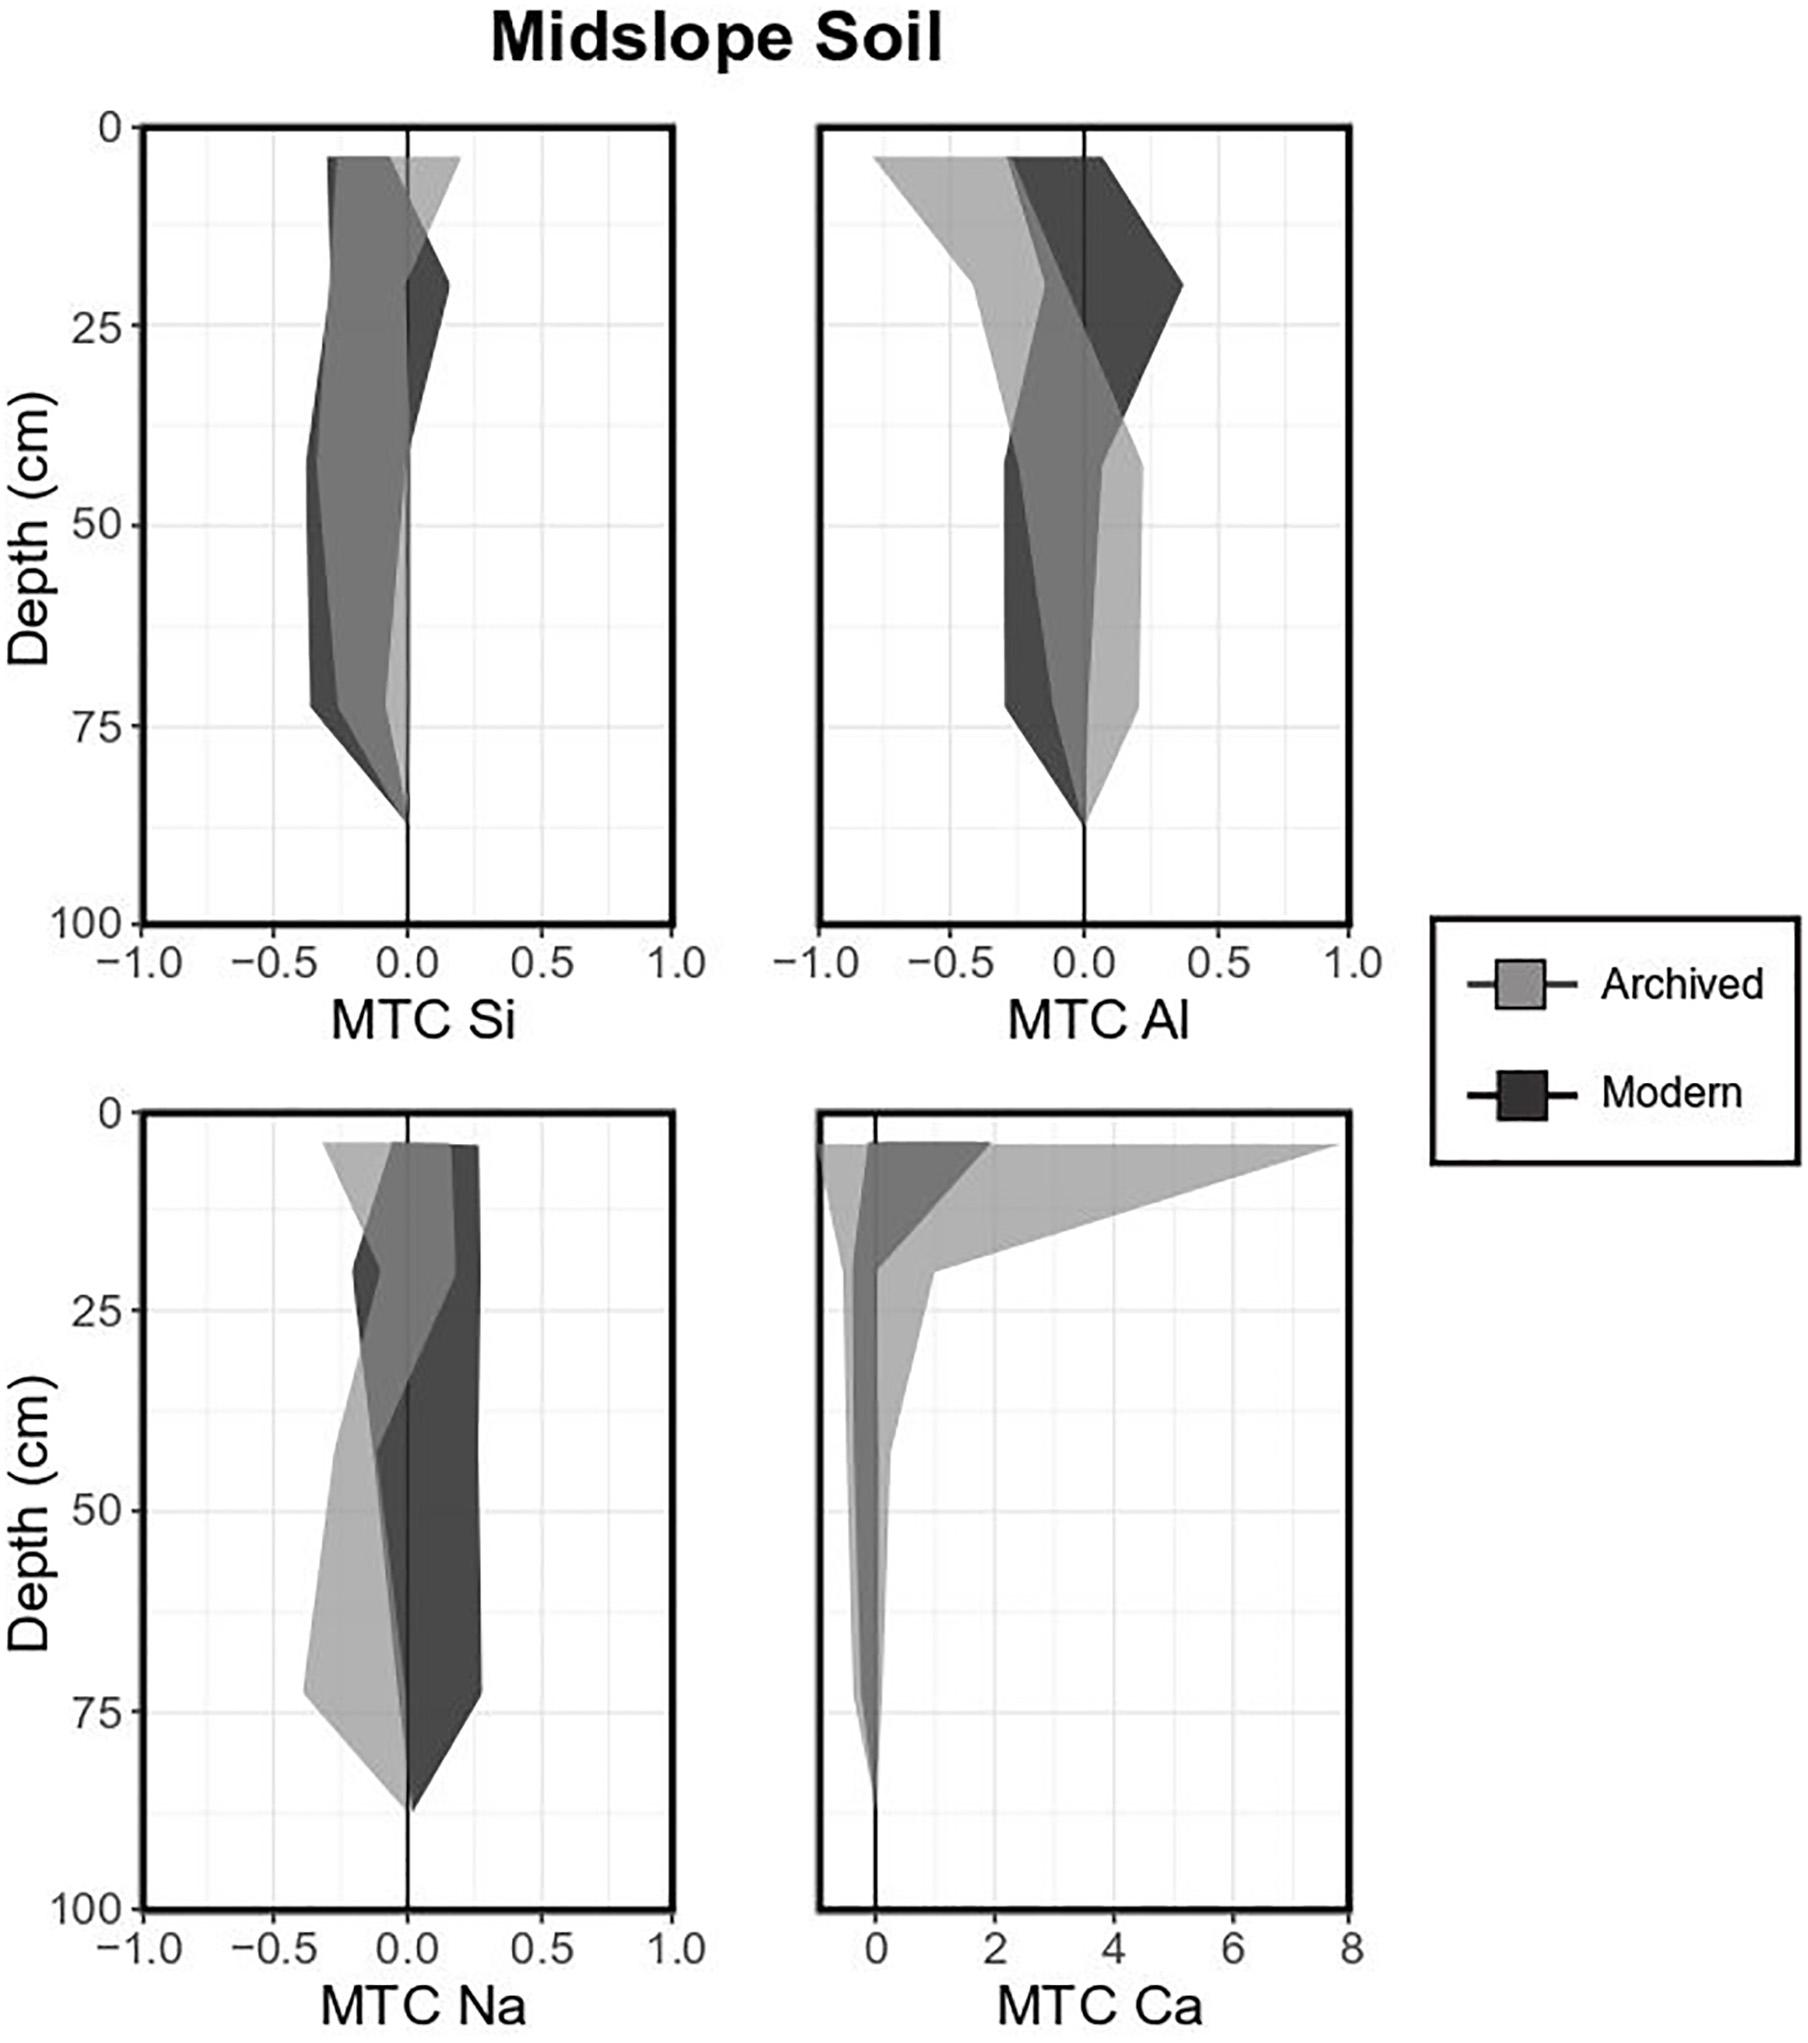
Figure 6. Mass transfer coefficient (MTC) values of selected elements for a typical midslope soil (Inceptisol). Light gray shaded areas indicate standard deviations of means for each element measured in archived samples (1996, 18 pits), dark gray shaded areas indicate standard deviations of means for each element of modern samples (2017, 4 pits).
The variability of riparian soil composition in the study area was high for most elements, especially in archived samples. For example, MTC values were generally positive for Si, negative for Al (especially in modern samples; Figure 7). Base cation MTC values were generally positive, especially for Ca, in the two uppermost organic horizons (32.1 ± 33.6 and 19.9 ± 29.7). Again, the differences between archived and modern samples was significant for Ca in the top horizons, where Ca MTC values were significantly higher in archived soils.
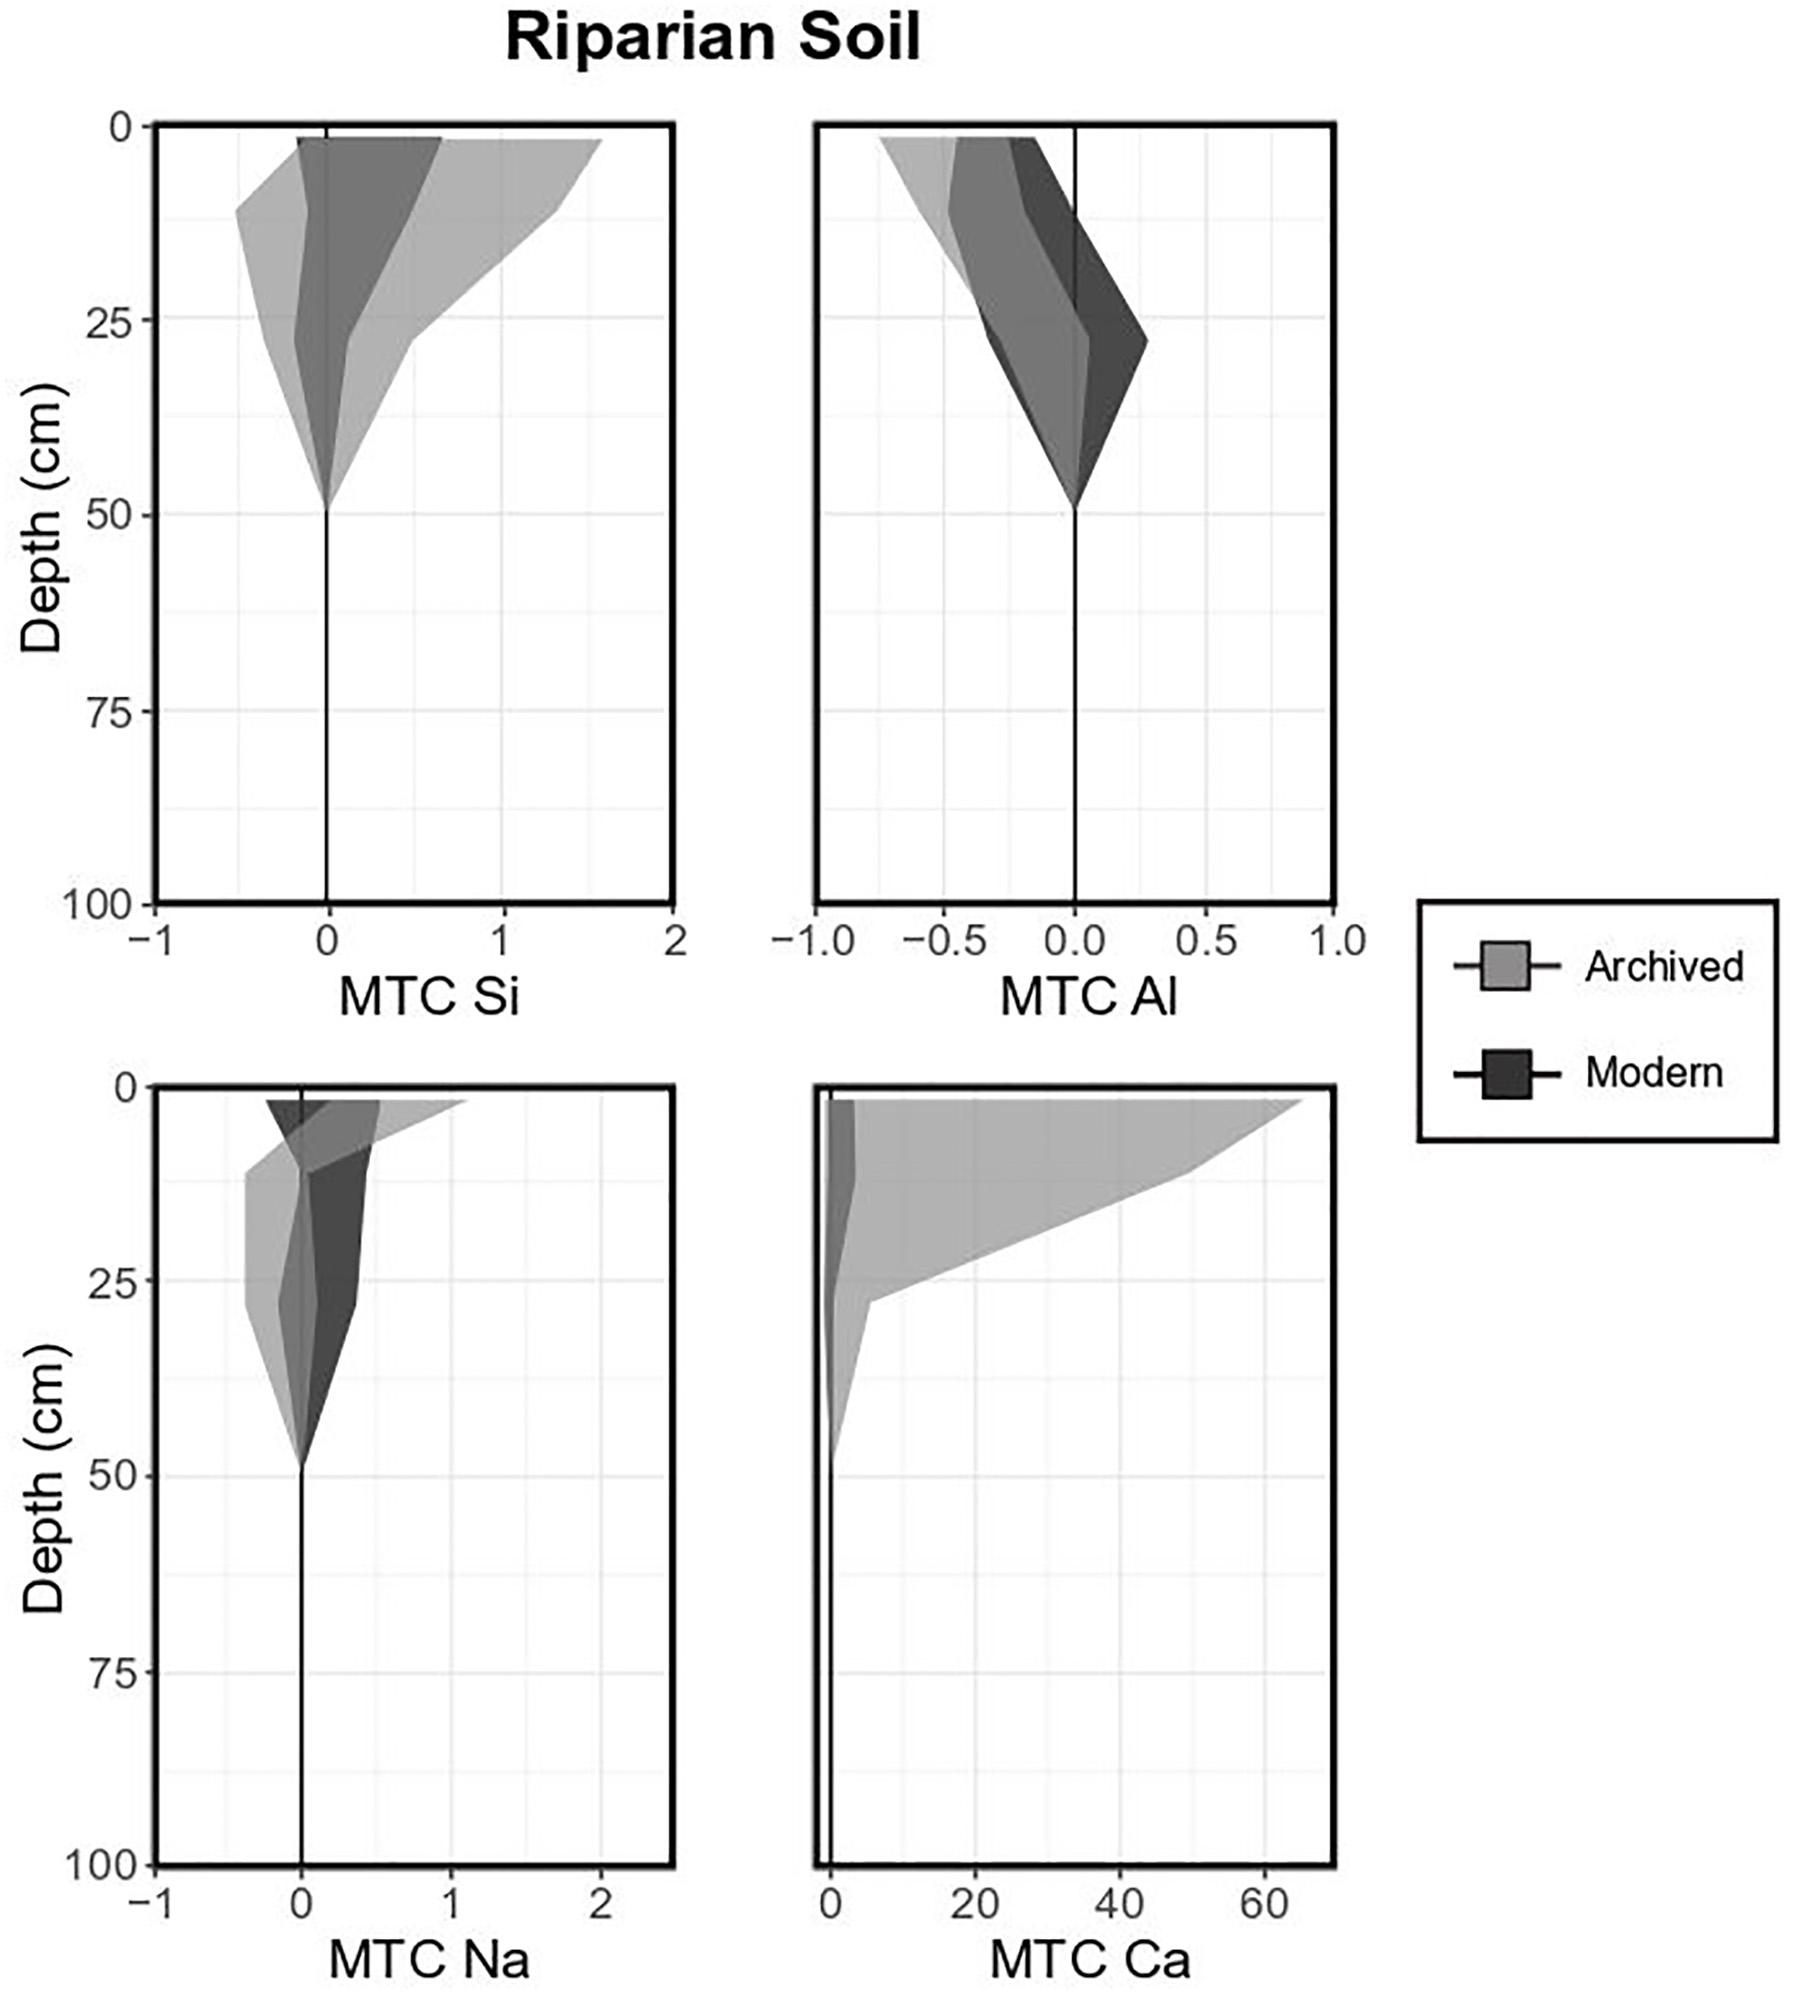
Figure 7. Mass transfer coefficient (MTC) values of selected elements for a typical base of the hill soil (Histosol). Light gray shaded areas indicate standard deviations of means for each element measured in archived samples (1996, 11 pits), dark gray shaded areas indicate standard deviations of means for each element of modern samples (2017, 3 pits).
The deepest horizons (weathered till) contained primary minerals of the Waits River and Gile Mountain Formations including micas (with a prominent peak at 10.0 Å), chlorite (14.2/7.1/3.5 Å), pyroxenes (e.g., at 3.0 Å), feldspars (e.g., at 3.1 Å), quartz (at 3.34/4.26 Å), amphibole (at 8.5 Å), oxides (rutile or spinel at 2.5 Å), and apatite (2.8 Å, see Supplementary Materials for diffractograms). Representative soils for all landscape positions (Spodosol for upslopes, Inceptisols for most midslopes and Histosols for riparian zones) showed most peaks for the primary minerals associated with contributing bedrock formations, but several of these peaks changed or disappeared toward upper horizons (Supplementary Figures S4–S6). For example, quartz peaks decreased in intensity toward shallower horizons, whereas feldspar, muscovite, amphibole and pyroxene peaks varied but became difficult to resolve in the organic horizon of all soils. Primary chlorite is present in all soils (intense peak at 14.2 Å in powder samples). The secondary swelling clay mineral smectite (confirmed by EG treatment, Supplementary Figures S4–S6) and illite were found in deeper horizons of most soils. Smectite was most prominent in Spodosols and not well resolved in the riparian Histosol. In contrast, calcite was only identified in the lowest horizons of the riparian Histosol.
Changes in stream water composition can indicate changes in CZ dynamics (Meybeck, 1993; Maher, 2011; McIntosh et al., 2017). However, a multitude of complex and coupled processes in the watershed and the stream itself can make the identification of specific processes or source locations difficult. Using the acid-impacted SRRW as a testbed, we investigated the potential and limitations of stream water composition as an indicator of watershed recovery from acidification and explored whether changes in soil composition contributed to a recovery signal.
Generally, decreasing stream water nitrate and sulfate fluxes and overall increases in stream water pH are typical indicators of chemical recovery at the watershed scale (Newell and Skjelkvåle, 1997; Driscoll et al., 2001; Skjelkvåle et al., 2001, 2005; Rogora et al., 2013; Garmo et al., 2014). At SRRW, sulfate fluxes in the stream indeed decreased significantly (Figure 2C) despite the fact that GW sulfate concentrations are high due to pyrite weathering at greater depth (Mayer et al., 2010). Over the past decades precipitation increased an average of 14 mm/yr (Shanley et al., 2016), which is reflected in the overall increase in discharge (Figure 2A). If sulfate still had a significant source in precipitation or release from soil stores, increases in annual precipitation may have led to stream sulfate flux increases, not decreases. The actual decreases in sulfate flux indicate that the stream is responding to the substantial reduction in sulfate deposition in the area (Shanley et al., 2004; Miles et al., 2012). In contrast, stream water nitrate flux did not change significantly, a finding that is consistent with the strong control of vegetation in a system that is not N saturated and the slower decrease in nitrate deposition (Burns et al., 2005). Stream water pH never dropped below 6.7, due to the high buffering capacity of the bicarbonate-rich waters (Shanley, 2000; Shanley et al., 2004) but the magnitude of pH variation decreased, especially after 2004 (Figure 2B).
Because the reduction of acid deposition reduces proton availability, we had hypothesized that stream water fluxes of Ca from base cation leaching would decrease significantly. Indeed, many recovering watersheds in the region show a substantial reduction in base cation fluxes including Ca and Na (Newell and Skjelkvåle, 1997; Stoddard et al., 1999; Burns et al., 2005; Garmo et al., 2014). However, SRRW Na (and Si) fluxes remained unchanged, whereas Ca fluxes increased (Figures 2E–G).
Because GW can indicate subsurface processes more directly than stream water (Peters and Aulenbach, 2009), we investigated temporal trends in GW Ca, Na and Si concentrations and found that the concentrations of Si remained stable, Na decreased slightly and that Ca decreased by over 30% since 2004 (Figures 3D–F). The relatively high δ13C-DIC values measured in GW are typical for a mixture of pedogenic DIC and carbonate weathering, confirming that carbonate is still actively weathering (Cerling, 1984; Amiotte-Suchet et al., 1999). Coupled with the decreases in GW Ca concentrations on the upslope and midslope, the isotopic patterns are consistent with either decreased carbonate weathering or increased plant Ca uptake during recovery, but they do not explain the increased Ca flux in stream water. We will discuss the potential role of Ca accumulation in the riparian zone as a mechanism to explain this pattern (section “The Riparian Zone: Integrator of Flow Paths and Soil Processes”).
We had hypothesized that long-term lateral transfer of leached base cations would lead to depleted shallow horizons, especially at upslope or midslope locations, while the accumulation of base cations, especially Ca, would be largest in near stream locations. Indeed, base cation and Si concentrations in soil water generally increased with depth and also increased toward low-lying landscape positions, which might reflect a combination of vertical and lateral transfer through shallow flowpaths and supply from GW when water tables rise (Sommer, 2006). Highly variable Si MTC values at all landscape positions and in all soil horizons (Figure 4) might reflect a combination of unweathered quartz high in the profile as well as transfer of Si from the weathering of less stable aluminosilicates (Figure 4). Aluminum, at upslope locations, showed a typical Spodosol depletion-enrichment pattern due to pH driven changes in Al solubility (Cronan and Schofield, 1979) but had significant enrichment in riparian soil horizons. XRD analyses indicate the weathering of aluminosilicate phases (especially amphiboles and pyroxenes) in most horizons and many of these minerals were still present in mineral soil horizons (Supplementary Figures S4–S6). Together with the high soil solution concentrations of Si (and partially for Na as well) these results indicate active silicate weathering in these soils.
Solid phase analyses of Na and Ca revealed negative MTC values for these elements in upslope and midslope soils but showed, again, substantial enrichment in riparian soils (Figures 5–7), a pattern that was also present in soils taken in transects associated with these landscape positions (Figure 4). E.g., Ca and Na were generally depleted in upslope-Spodosols (except for top horizons), relatively stable in the midslope-Inceptisols and enriched in riparian-Histosols, especially in top layers (Figure 4). Organic rich horizons tend to have less Ti, and hence the normalization to this otherwise immobile element to calculate MTC values can overestimate enrichments. However, riparian Histosol Ca content reaches up to 72000 mg kg-1, compared to a mean of 26000 ± 13000 mg kg-1 for midslope soils. XRD analyses of these soils explain most of these patterns through weathering and disappearance of amphiboles, chlorite, apatite, and pyroxenes. The lack of calcite in the till at upslope and midslope locations indicates that the carbonate weathering front is much lower than the silicate weathering front (i.e., in the deep till). The lack of significant amounts of secondary Ca-bearing minerals in near-stream locations further suggests that the large amounts of Ca are not accommodated in crystalline phases.
At SRRW, the riparian zones are areas of confluence where shallow and deep flow paths converge, GW discharges and base cations accumulate, hence the riparian zone has a high potential for impacting stream water composition for these solutes.
Si and Na concentrations were similarly high in GW at upslope and midslope locations, however, concentrations were significantly lower in riparian zone waters and even lower in stream water [e.g., base flow stream water Si concentrations were almost 6 mg L-1 lower than riparian GW (Figure 3 and Table 2)], an observation consistent with previous research (Kendall et al., 1999). The missing Si and Na might be stored in secondary minerals, such as smectites that were identified in weathered till (Supplementary Figures S4–S6). However, as mentioned above, we cannot explain the high riparian soil Ca content through only the accumulation of secondary minerals.
Cincotta et al. (this special issues) found riparian soils at SRRW were rich in both Ca and organic carbon. Ca is common in biofilms, and is the dominant exchangeable cation in organic soils with high pH and cation exchange capacity. As a divalent cation, Ca can help bridge charges between negative soil particles (Perdrial et al., 2009). Organic matter readily forms complexes with free Ca2+ ions (Ong and Bisque, 1968; Temminghoff et al., 1995), leading to DOM coagulation that, when Ca concentrations are high, is not pH dependent (Tipping and Ohnstad, 1984; Temminghoff et al., 1995). Therefore, Ca in riparian soils is likely associated with and stabilized by organic materials in soil aggregates. Cincotta et al. (this special issues) also showed that recovery from acidification can lead to the breakup of soil aggregates and the release of associated organic matter into soil solution. Their study did not investigate Ca release, but if Ca is associated with organic matter it would be liberated in the same process. Indeed, annual discharge has slightly increased since 1992 (Figure 2A) and so has stream water DOC flux (Schuster et al., 2007; Sebestyen et al., 2008; Cincotta et al., this special issues). Thus, the slight but significant increase in stream water Ca flux (Figure 2G) could have the same origin as the stream DOC increase, i.e., release from soil aggregates that served as transient store. Both indicate riparian processes driven by changes in aggregate stability and solubility (not increased carbonate weathering), with the result that Ca is effectively flushed into the stream. This effect is exacerbated by increased discharge (Figure 2A) and increased abundance of high intensity events (Peters et al., 2006), advectively transferring soil-derived material into the stream.
Furthermore, our results from modern vs. archived soil samples are in agreement with a gradual, recovery-induced, leaching of legacy Ca from riparian soils. The Ca concentration of the riparian soils decreased measurably between archived (1996) and modern samples (2017) throughout the study area as well (Figure 7). We illustrate the strong impact of riparian soils and near stream waters vs. midslopes on stream water in a mixing diagram of Na-normalized mole ratios (Figure 8). Here, composition of upslope and midslope soils have overall lower Ca/Na ratios than the riparian soils, which again have lower ratios than GW or stream water. These results confirm that riparian zones are highly reactive parts of the CZ and exert a strong control on stream composition (Peters and Aulenbach, 2009; Vidon et al., 2010; Lidman et al., 2017). In the case of SRRW, the complex interactions among base cation leaching, converging flow paths, GW upwelling (providing changes in pH and further accumulation of more reactants), temporal solute storage (i.e., transient legacy), and interaction with organics, produce a highly reactive zone that responds to the same driver (decrease of acid inputs) in fundamentally different ways than the midslopes.
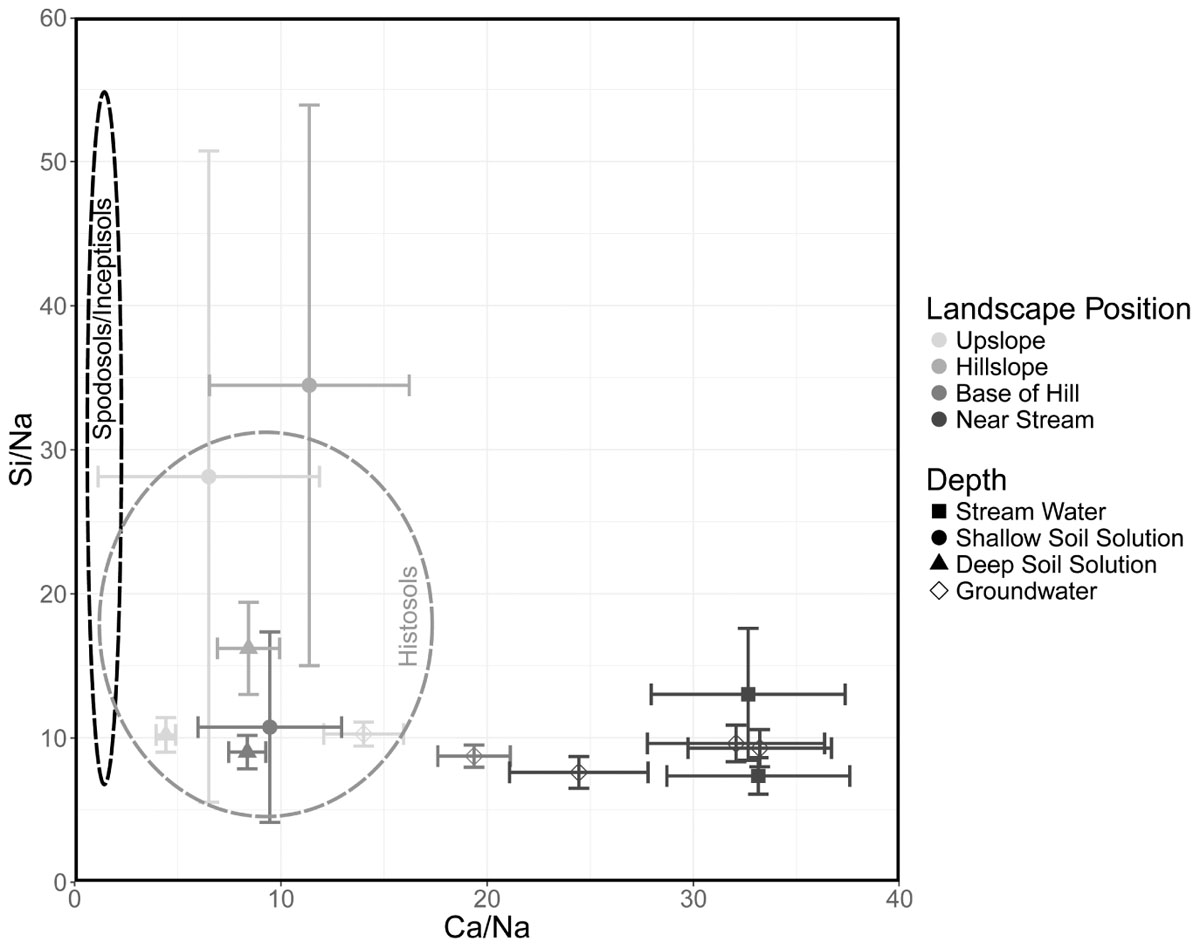
Figure 8. Mixing diagram of Na-normalized mean molar ratios and standard error for water composition by source (symbols) and landscape position (gray shades). Black dashed lines indicate the range of molar ratios in Spodosols and Inceptisols while gray dashed line represents this range in Histosols.
Figure 1 was modified from Hydrological Processes, 29, Shanley, James B., Stephen D. Sebestyen, Jeffrey J. McDonnell, Brian L. McGlynn, and Thomas Dunne. ‘Water’s Way at Sleepers River watershed – revisiting flow generation in a post-glacial landscape, VT, United States,’ 3447-59, Copyright 2014, with permission from John Wiley and Sons and from Journal of Hydrology, 219, ‘a hydrometric and geochemical approach to test the transmissivity feedback hypothesis during snowmelt,’ 188–205, Copyright 1999, with permission from Elsevier.
JA was responsible for sample collection, preparation, and analyses as well as figure production, table production, and primary authorship. JP as MS thesis advisor aided in interpretation, authorship, field work, lab work, lab training, as well as allowed lab use. AG and JE assisted with field sampling and lab work. NP contributed through interpretations, authorship, and lab training. MC assisted with field sampling, lab work, and interpretations through research published in this issue. DR assisted in interpretations and editing. JS provided soil solution, groundwater, and stream composition data as well as archived soil samples and also introduced authors to watershed installations, aided in interpretations and provided pre-research consulting. KU aided in statistical processing and interpretations as well as provided example R scripts. PR allowed the use of and provided training on the XRF at Middlebury College.
Funding supporting this research was made available through the Geology Department at the University of Vermont.
The authors declare that the research was conducted in the absence of any commercial or financial relationships that could be construed as a potential conflict of interest.
Scott Bailey provided pre-research consulting and archived soil samples. USGS participation was funded by the Land Change Science Program. USGS-collected data used in this paper is available at doi: 10.5066/P929KMVK (flow database) and doi: 10.5066/P9380HQG (chemistry database). Use of trade, product, or firm names is for informational purposes and does not imply endorsement by the United States Government.
The Supplementary Material for this article can be found online at: https://www.frontiersin.org/articles/10.3389/feart.2018.00246/full#supplementary-material
Amiotte-Suchet, P., Aubert, D., Probst, J. L., Gauthier-Lafaye, F., Probst, A., Andreux, F., et al. (1999). δ13C pattern of dissolved inorganic carbon in a small granitic catchment: the Strengbach case study (Vosges mountains, France). Chem. Geol. 159, 129–145. doi: 10.1016/S0009-2541(99)00037-6
Appling, A. P., Leon, M. C., and McDowell, W. H. (2015). Reducing bias and quantifying uncertainty in watershed flux estimates: the R package loadflex. Ecosphere 6:art269. doi: 10.1890/ES14-00517.1
Bailey, S. W., Brousseau, P. A., McGuire, K. J., and Ross, D. S. (2014). Influence of landscape position and transient water table on soil development and carbon distribution in a steep, headwater catchment. Geoderma 226–227, 279–289. doi: 10.1016/j.geoderma.2014.02.017
Bishop, K., Seibert, J., Köhler, S., and Laudon, H. (2004). Resolving the Double Paradox of rapidly mobilized old water highly variable responses in runoff chemistry. Hydrol. Process. 18, 185–189. doi: 10.1002/hyp.5209
Brantley, S. L., Goldhaber, M. B., and Ragnarsdottir, K. V. (2007). Crossing disciplines and scales to understand the critical zone. Elements 3, 307–314. doi: 10.2113/gselements.3.5.307
Brimhall, G. H., and Dietrich, W. E. (1987). Constitutive mass balance relations between chemical composition, volume, density, porosity, and strain in metasomatic hydrochemical systems: results on weathering and pedogenesis. Geochim. Cosmochim. Acta 51, 567–587. doi: 10.1016/0016-7037(87)90070-6
Burns, D. A., McHale, M. R., Driscoll, C. T., and Roy, K. M. (2005). Response of surface water chemistry to reduced levels of acid precipitation: comparison of trends in two regions of New York, USA. Hydrol. Process. 20, 1611–1627. doi: 10.1002/hyp.5961
Cerling, T. E. (1984). The stable isotopic composition of modern soil carbonate and its relationship to climate. Earth Planet. Sci. Lett. 71, 229–240. doi: 10.1016/0012-821X(84)90089-X
Cronan, C. S., and Schofield, C. L. (1979). Aluminum leaching response to Acid precipitation: effects on high-elevation watersheds in the northeast. Science 204, 304–306. doi: 10.1126/science.204.4390.304
Dawson, J. J., Bakewell, C., and Billett, M. F. (2001). Is in-stream processing an important control on spatial changes in carbon fluxes in headwater catchments? Sci. Total Environ. 265, 153–167. doi: 10.1016/S0048-9697(00)00656-2
Derrick, B., and White, P. (2016). Why Welch’s test is Type I error robust. Tutor. Quant. Methods Psychol. 12, 30–38. doi: 10.20982/tqmp.12.1.p030
Driscoll, C. T., Lawrence, G. B., Bulger, T. J., Cronan, C. S., Eagar, C., Lambert, K. F., et al. (2001). Acid Rain Revisited: Advances in Scientific Understanding Since the Passage of the 1970 and 1990 Clean Air Act Amendments. Thornton, CO: Hubbard Brook Research Foundation.
Ferry, J. M. (1991). Regional metamorphism of the waits river formation, eastern vermont: delineation of a new type of giant metamorphic hydrothermal system. J. Petrol. 33, 45–94. doi: 10.1093/petrology/33.1.45
Frisbee, M. D., Phillips, F. M., Campbell, A. R., Liu, F., and Sanchez, S. A. (2011). Streamflow generation in a large, alpine watershed in the southern Rocky Mountains of Colorado: is streamflow generation simply the aggregation of hillslope runoff responses? Water Resour. Res. 47:W06512. doi: 10.1029/2010WR009391
Garmo,Ø. A., Skjelkvåle, B. L., de Wit, H. A., Colombo, L., Curtis, C., Fölster, J., et al. (2014). Trends in surface water chemistry in acidified areas in Europe and North America from 1990 to 2008. Water Air Soil Pollut. 225:1880. doi: 10.1007/s11270-014-1880-6
Hornbeck, J., Bailey, S., Buso, D., and Shanley, J. (1997). Streamwater chemistry and nutrient budgets for forested watersheds in New England: variability and management implications. For. Ecol. Manag. 93, 73–89. doi: 10.1016/S0378-1127(96)03937-0
Huang, Q. B., Qin, X. Q., Liu, P. Y., Zhang, L. K., and Su, C. T. (2017). Impact of sulfuric and nitric acids on carbonate dissolution, and the associated deficit of CO2 uptake in the upper-middle reaches of the Wujiang River, China. J. Contam. Hydrol. 203, 18–27. doi: 10.1016/j.jconhyd.2017.05.006
Jin, L., Ravella, R., Ketchum, B., Bierman, P. R., Heaney, P., White, T., et al. (2010). Mineral weathering and elemental transport during hillslope evolution at the Susquehanna/Shale Hills Critical Zone Observatory. Geochim. Cosmochim. Acta 74, 3669–3691. doi: 10.1016/j.gca.2010.03.036
Johnson, C. E., Driscoll, C. T., Siccama, T. G., and Likens, G. E. (2000). Element fluxes and landscape position in a northern hardwood forest watershed ecosystem. Ecosystems 3, 159–184. doi: 10.1007/s100210000017
Kendall, K., Shanley, J., and McDonnell, J. (1999). A hydrometric and geochemical approach to test the transmissivity feedback hypothesis during snowmelt. J. Hydrol. 219, 188–205. doi: 10.1016/S0022-1694(99)00059-1
Kopáček, J., Hejzlar, J., Kaňa, J., Porcal, P., and Turek, J. (2016). The sensitivity of water chemistry to climate forested, nitrogen-saturated catchment recovering from acidification. Ecol. Indic. 63, 196–208. doi: 10.1016/j.ecolind.2015.12.014
Lagaly, G. (1993). “Reaktionen des tonminerale,” in Tonminerale und Tone: Struktur, Eigenschaften und Einsatz in Industrie und Umwelt, eds K. Jasmund and G. Lagaly (Darmstadt: Steinkopff Verlag), 89–167. doi: 10.1007/978-3-642-72488-6_3
Lawrence, G. B., Hazlett, P. W., Fernandez, I. J., Ouimet, R., Bailey, S. W., Shortle, W. C., et al. (2015). Declining acidic deposition begins reversal of forest-soil acidification in the northeastern U.S. and Eastern Canada. Environ. Sci. Technol. 49, 13103–13111. doi: 10.1021/acs.est.5b02904
Lidman, F., Boily, A., Laudon, H., and Köhler, S. J. (2017). From soil water to surface water – how the riparian zone controls element transport from a boreal forest to a stream. Biogeosciences 14, 3001–3014. doi: 10.5194/bg-14-3001-2017
Likens, G. E., Bormann, F. H., and Johnson, N. M. (1972). Acid rain. Environ. Sci. Policy Sustain. Dev. 14, 33–40. doi: 10.1080/00139157.1972.9933001
Lybrand, R. A., and Rasmussen, C. (2015). Quantifying climate and landscape position controls on soil development in semiarid ecosystems. Soil Sci. Soc. Am. J. 79, 104–116. doi: 10.2136/sssaj2014.06.0242
Maher, K. (2011). The role of fluid residence time and topographic scales in determining chemical fluxes from landscapes. Earth Planet. Sci. Lett. 312, 48–58. doi: 10.1016/j.epsl.2011.09.040
Matzner, E., and Murach, D. (1995). Soil changes induced by air pollutant deposition and their implication for forests in central Europe. Water Air Soil Pollut. 85, 63–76. doi: 10.1007/BF00483689
Mayer, B., Shanley, J. B., Bailey, S. W., and Mitchell, M. J. (2010). Identifying sources of stream water sulfate after a summer drought in the Sleepers River watershed (Vermont, USA) using hydrological, chemical, and isotopic techniques. Appl. Geochem. 25, 747–754. doi: 10.1016/j.apgeochem.2010.02.007
McGlynn, B. L., McDonnell, J. J., Shanley, J. B., and Kendall, C. (1999). Riparian zone flowpath dynamics during snowmelt in a small headwater catchment. J. Hydrol. 222, 75–92. doi: 10.1016/S0022-1694(99)00102-X
McIntosh, J. C., Schaumberg, C., Perdrial, J., Harpold, A., Vázquez-Ortega, A., Rasmussen, C., et al. (2017). Geochemical evolution of the Critical Zone across variable time scales informs concentration-discharge relationships: Jemez River Basin Critical Zone Observatory. Water Resour. Res. 53, 4169–4196. doi: 10.1002/2016WR019712
McLeod, A. I. (2011). Kendall: Kendall Rank Correlation and Mann-Kendall Trend Test. Available at: http://CRAN.R-project.org/package=Kendall
Meals, D. W., Spooner, J., Dressing, S. A., and Harcum, J. B. (2011). “Statistical analysis for monotonic trends,” in Developed for U.S. Environmental Protection Agency (Fairfax, VA: Tetra Tech, Inc.), 23. Available at: https://www.epa.gov/polluted-runoff-nonpoint-source-pollution/nonpoint-source-monitoring-technical-notes
Meybeck, M. (1993). Riverine transport of atmospheric carbon: sources, global typology and budget. Water Air Soil Pollut. 70, 443–463. doi: 10.1007/BF01105015
Miles, G., Mitchell, M., Mayer, B., Likens, G., and Welker, J. (2012). Long-term analysis of Hubbard Brook stable oxygen isotope ratios of streamwater and precipitation sulfate. Biogeochemistry 111, 443–454. doi: 10.1007/s10533-011-9670-3
Moore, D. M., and Reynolds, R. C. (1997). X-Ray Diffraction and the Identification and Analysis of Clay Minerals, 2nd Edn. New York, NY: Oxford University Press.
Mulholland, P. J., and Hill, W. R. (1997). Seasonal patterns in streamwater nutrient and dissolved organic carbon concentrations: separating catchment flow path and in-stream effects. Water Resour. Res. 33, 1297–1306. doi: 10.1029/97wr00490
Newell, A. D., and Skjelkvåle, B. L. (1997). Acidification trends in surface waters in the international program on acidification of rivers and lakes. Water Air Soil Pollut. 93, 27–57. doi: 10.1023/A:1022126704750
Nezat, C. A., Blum, J. D., Klaue, A., Johnson, C. E., and Siccama, T. G. (2004). Influence of landscape position and vegetation on long-term weathering rates at the Hubbard Brook Experimental Forest, New Hampshire, USA 11 Associate editor: K. L. Nagy. Geochim. Cosmochim. Acta 68, 3065–3078. doi: 10.1016/j.gca.2004.01.021
Ong, H. L., and Bisque, R. E. (1968). Coagulation of humic colloids by metal IonS. Soil Sci. 106, 220–224. doi: 10.1097/00010694-196809000-00011
Perdrial, J. N., Warr, L. N., Perdrial, N., Lett, M.-C., and Elsass, F. (2009). Interaction between smectite and bacteria: implications for bentonite as backfill material in the disposal of nuclear waste. Chem. Geol. 264, 281–294. doi: 10.1016/j.chemgeo.2009.03.012
Peters, N. E., Shanley, J. B., Aulenbach, B. T., Webb, R. M., Campbell, D. H., Hunt, R., et al. (2006). Water and solute mass balance of five small, relatively undisturbed watersheds in the U.S. Sci. Total Environ. 358, 221–242. doi: 10.1016/j.scitotenv.2005.04.044
Peters, N., and Aulenbach, B. (2009). Flowpath Contributions of Weathering Products to Stream Fluxes at the Panola Mountain Research Watershed, Georgia. Reston, VA: U.S Geological Survey.
Pohlert, T. (2018). trend: Non-Parametric Trend Tests and Change-Point Detection, R package version 0.0.1.
Poppe, L. J., Paskevich, V. F., Hathaway, J. C., and Blackwood, D. S. (2001). A Laboratory Manua for X-Ray Powder Diffraction (Open-File No. 1–41). Reston, VA: USGS.
R Core Development Team (2017). R: A Language and Environment for Statistical Computing. Vienna: R Foundation for statistical computing.
Raddum, G. G., Fjellheim, A., Erikson, L., Fott, J., Halvorsen, G. A., Heegaard, E., et al. (2007). “Biological recovery,” in Trends in Surface Water Chemistry and Biota; The Importance of Confounding Factors: Report 87/2007, eds H. de Wit and B. L. Skjelkvale (Warsaw: ICP Waters), 50–63.
Ratcliffe, N., Stanley, R., Gale, M., Thompson, P., and Walsh, G. (2011). Bedrock Geologic Map of Vermont. Scientific Investigations Series Map 3184. Reston, VA: U.S. Geological Survey.
Rice, K. C., and Herman, J. S. (2012). Acidification of Earth: an assessment across mechanisms and scales. Appl. Geochem. 27, 1–14. doi: 10.1016/j.apgeochem.2011.09.001
Rogora, M., Colombo, L., Lepori, F., Marchetto, A., Steingruber, S., and Tornimbeni, O. (2013). Thirty years of chemical changes in alpine acid-sensitive lakes in the alps. Water Air Soil Pollut. 224:1746. doi: 10.1007/s11270-013-1746-3
Runkel, R. L., Crawford, C. G., and Cohn, T. A. (2004). “Load estimator (LOADEST): a FORTRAN program for estimating constituent loads in streams and rivers,” in USGS Techniques and Methods Book 4, Chapter A5, eds S. M. Westenbroek, J. Doherty, J. F. Walker, and V. A. Kelson (Reston, VA: U.S. Geological Survey).
Schuster, P. F., Shanley, J., Marvin-Dipasquale, M., Reddy, M. M., Aiken, G. R., Roth, D. A., et al. (2007). Mercury and organic carbon dynamics during runoff episodes from a northeastern USA watershed. Water Air Soil Pollut. 187, 89–108. doi: 10.1007/s11270-007-9500-3
Sebestyen, S. D., Boyer, E. W., Shanley, J. B., Kendall, C., Doctor, D. H., Aiken, G. R., et al. (2008). Sources, transformations, and hydrological processes that control stream nitrate and dissolved organic matter concentrations during snowmelt in an upland forest. Water Resour. Res. 44:W12410. doi: 10.1029/2008WR006983
Shanley, J. B. (2000). Sleepers River Watershed – A USGS WEBB Program Site: U.S. Geological Survey Fact Sheet. Reston, VA: US Geological Survey.
Shanley, J. B., Chalmers, A. T., Mack, T. J., Smith, T. E., and Harte, P. T. (2016). Groundwater level trends and drivers in two northern New England glacial aquifers. JAWRA J. Am. Water Resour. Assoc. 52, 1012–1030. doi: 10.1111/1752-1688.12432
Shanley, J. B., Kram, P., Hruska, J., and Bullen, T. D. (2004). A biogeochemical comparison of two well-buffered catchments with contrasting histories of acid deposition. Water Air Soil Pollut. Focus 4, 325–342. doi: 10.1023/B:WAFO.0000028363.48348.a4
Shanley, J. B., Schuster, P. F., Reddy, M. M., Roth, D. A., Taylor, H. E., and Aiken, G. R. (2002). Mercury on the move during snowmelt in Vermont. EOS 83, 45–48. doi: 10.1029/2002EO000031
Shanley, J. B., Sebestyen, S. D., Mcdonnell, J. J., Mcglynn, B. L., and Dunne, T. (2015). Water’s Way at Sleepers River watershed – revisiting flow generation in a post-glacial landscape, Vermont USA. Hydrol. Process. 29, 3447–3459. doi: 10.1002/hyp.10377
Skjelkvåle, B. L. (2003). “The 15-year report: assessment and monitoring of surface waters in Europe and North America; acidification and recovery, dynamic modelling and heavy metals,” in NIVA Rep. 4716-2003, ICP Waters Report 73/2003, (Reston, VA: US Geological Survey).
Skjelkvåle, B. L., Stoddard, J. L., and Andersen, T. (2001). Trends in surface water acidification in Europe and North America (1989–1998). Water Air Soil Pollut. 130, 787–792. doi: 10.1023/A:1013806223310
Skjelkvåle, B. L., Stoddard, J. L., Jeffries, D. S., Tørseth, K., Høgåsen, T., Bowman, J., et al. (2005). Regional scale evidence for improvements in surface water chemistry 1990–2001. Environ. Pollut. 137, 165–176. doi: 10.1016/j.envpol.2004.12.023
Sommer, M. (2006). Influence of soil pattern on matter transport in and from terrestrial biogeosystems—A new concept for landscape pedology. Geoderma 133, 107–123. doi: 10.1016/j.geoderma.2006.03.040
Stoddard, J. L., Jeffries, D. S., Lukewille, A., Clair, T. A., Dillon, P. J., Driscoll, C. T., et al. (1999). Regional trends in aquatic recovery from acidification in North America and Europe. Nature 401, 575–578. doi: 10.1038/44114
Strawn, D. G., Hinrich, B. L., and O’Connor, G. A. (2015). Soil Chemistry, 4th Edn. Hoboken, NJ: John Wiley & Sons, Ltd.
Temminghoff, E. J. M., Van der zee, S. E. A. T. M., and Haan, F. A. M. (1995). Speciation and calcium competition effects on cadmium sorption by sandy soil at various pHs. Eur. J. Soil Sci. 46, 649–655. doi: 10.1111/j.1365-2389.1995.tb01361.x
Tipping, E., and Ohnstad, M. (1984). Aggregation of aquatic humic substances. Chem. Geol. 44, 349–357. doi: 10.1016/0009-2541(84)90148-7
Vidon, P., Allan, C., Burns, D., Duval, T. P., Gurwick, N., Inamdar, S., et al. (2010). Hot spots and hot moments in riparian zones: potential for improved water quality management1. JAWRA J. Am. Water Resour. Assoc. 46, 278–298. doi: 10.1111/j.1752-1688.2010.00420.x
Keywords: weathering, recovery, acid impact, Sleepers River, carbonate
Citation: Armfield JR, Perdrial JN, Gagnon A, Ehrenkranz J, Perdrial N, Cincotta M, Ross D, Shanley JB, Underwood KL and Ryan P (2019) Does Stream Water Composition at Sleepers River in Vermont Reflect Dynamic Changes in Soils During Recovery From Acidification? Front. Earth Sci. 6:246. doi: 10.3389/feart.2018.00246
Received: 27 July 2018; Accepted: 18 December 2018;
Published: 05 March 2019.
Edited by:
Samuel Abiven, University of Zurich, SwitzerlandReviewed by:
Patrick Durand, INRA Centre Bretagne-Normandie, FranceCopyright © 2019 Armfield, Perdrial, Gagnon, Ehrenkranz, Perdrial, Cincotta, Ross, Shanley, Underwood and Ryan. This is an open-access article distributed under the terms of the Creative Commons Attribution License (CC BY). The use, distribution or reproduction in other forums is permitted, provided the original author(s) and the copyright owner(s) are credited and that the original publication in this journal is cited, in accordance with accepted academic practice. No use, distribution or reproduction is permitted which does not comply with these terms.
*Correspondence: Julia N. Perdrial, SnVsaWEuUGVyZHJpYWxAdXZtLmVkdQ==
Disclaimer: All claims expressed in this article are solely those of the authors and do not necessarily represent those of their affiliated organizations, or those of the publisher, the editors and the reviewers. Any product that may be evaluated in this article or claim that may be made by its manufacturer is not guaranteed or endorsed by the publisher.
Research integrity at Frontiers
Learn more about the work of our research integrity team to safeguard the quality of each article we publish.