- 1NOAA Pacific Marine Environmental Laboratory, Newport, OR, United States
- 2CIMRS, Oregon State University, Newport, OR, United States
- 3JISAO, University of Washington, Seattle, WA, United States
- 4NOAA Pacific Marine Environmental Laboratory, Seattle, WA, United States
- 5Department of Earth Sciences, University of Ottawa, Ottawa, ON, Canada
- 6GEOMAR, Helmholtz Centre for Ocean Research, Kiel, Germany
Submarine volcanic eruptions are difficult to detect because they are hidden from view at the bottom of the ocean and far from land-based sensors. However, most of Earth’s volcanic activity is in the oceans along tectonic plate boundaries, and modern tools of oceanography now allow us to find and study recent eruptions in the deep sea. The first known historical eruption on the Mariana back-arc spreading center was discovered in December 2015 during exploration of the southern back-arc for new hydrothermal vent sites. A water-column survey along the axis of the back-arc showed hydrothermal plumes over the site characterized by low particle concentrations and relatively high reduced chemical anomalies. A dive with the autonomous underwater vehicle Sentry collected high-resolution (1 m) multibeam sonar bathymetry over the site, followed by a near-bottom photographic survey of a smaller area. The photo survey revealed the presence of a pristine, dark, glassy lava flow on the seafloor with no sediment cover. Venting of milky hydrothermal fluid indicated that the lava flow was still warm and therefore very young. A comparison of multibeam sonar bathymetry collected by R/V Falkor in December 2015, to the most recent previous survey of the area by R/V Melville in February 2013, revealed large depth changes in the same area, effectively bracketing the timing of the eruption within a window of less than 3 years. The bathymetric comparison shows the eruption produced a string of lava flows with maximum thicknesses of 40–138 m along a distance of 7.3 km (from latitude 15∘22.3′ to 15∘26.3′N) between depths of 4050–4450 m bsl (meters below sea level), making this the deepest known historical submarine volcanic eruption on Earth. The cross-axis width of the lava flows is 200–800 m. The Sentry bathymetry shows that the new lava flows are constructed of steep-sided hummocky pillow mounds and are surrounded by older flows with similar morphology. In April and December 2016, two dives were made on the new lava flows by remotely operated vehicles Deep Discoverer and SuBastian. The pillow lavas have many small glassy buds on the steep flanks of the mounds, locally thick accumulations of hydrothermal sediment near the tops of mounds, and small cones of radiating pillows at their summits. The 2015–2016 observations show a rapidly declining hydrothermal system on the lava flows, suggesting that the eruption had occurred only months before its discovery in December 2015. The morphology of the pillow lavas is similar to other historical eruption sites, so the greater depth and ambient pressure of this site had no apparent effect on the processes of lava extrusion and emplacement. This study reveals that some segments of the Mariana back-arc have active magmatic systems despite the relatively low spreading rate, and that other eruptions are possible in the near future.
Introduction
Documented historical volcanic eruptions in the deep-sea are relatively rare, because they usually have no expression at the ocean surface and only produce small earthquakes which are difficult to detect in the ocean basins. For example, Rubin et al. (2012) highlighted the fact that only 17 deep [>500 m bsl (meters below sea level)] submarine eruptions were known to have occurred in the last 500 years, compared to 497 known eruptions on land. Historical deep-sea eruptions have been found in a variety of ways, including by distinctive hydrothermal plumes detected during water-column surveys, repeated bathymetric mapping showing depth changes, time-series visual observations by camera or submersible, radiometric dating of young lava flows, remote detection of seismic swarms by hydrophone or seismometers, and rarely by pumice rafts appearing on the ocean surface (Cowen et al., 2004; Dziak et al., 2011; Baker et al., 2012; Rubin et al., 2012; Carey et al., 2018). Only two seamounts have been directly observed erupting, NW Rota-1 in the Mariana arc and West Mata in the NE Lau Basin (probably both long-lived eruptions) (Chadwick et al., 2008; Resing et al., 2011; Embley et al., 2014; Schnur et al., 2017). More recently, a cabled observatory established at Axial Seamount captured an eruption in 2015 (Kelley et al., 2014; Chadwick et al., 2016; Nooner and Chadwick, 2016; Wilcock et al., 2016). Most of these known eruptions have been found on mid-ocean ridges or in submarine volcanic arcs. We know even less about the character and frequency of deep-sea eruptions in back-arc settings.
Recent systematic exploration of the southern Mariana back-arc between 13 and 18.5°N during research cruises on R/V Falkor in 2015 and 2016 (FK151121 and FK161129) led to the discovery of new hydrothermal vent sites along the back-arc spreading axis (Baker et al., 2017; Butterfield et al., 2018). That work included the collection of new EM302 multibeam sonar bathymetry along the back-arc that permitted a refined mapping of the axis of spreading, and allowed geologic interpretation of the back-arc spreading segments and their tectonic and magmatic character (Anderson et al., 2017). The R/V Falkor cruises also included high-resolution bathymetric mapping of selected sites with the autonomous underwater vehicle (AUV) Sentry in 2015, followed by dives with the remotely operated vehicles (ROV) SuBastian in 2016. In between those, the NOAA Ship Okeanos Explorer made three exploratory dives with the ROV Deep Discoverer (D2).
During the exploration for new vent sites we discovered evidence of a very recent eruption on the axis of the central Mariana back-arc. The only other known historical submarine eruptions on back-arc spreading centers are on the NE Lau Spreading Center (NELSC), including one discovered in November 2008 when hydrothermal event plumes were encountered by chance in the overlying water column during a regional survey (Baker et al., 2011; Rubin et al., 2012), and eruptions near Tafu cone on the NELSC that were recently discovered by before-and-after bathymetric surveys and confirmed by ROV dives (Rubin et al., 2018a,b).
Here, we describe the physical setting of the recent eruption site, constrain the timing of the eruption to within a 3-year period based on before-and-after surveys, show high-resolution bathymetry and ROV visual observations of the young lava flows that provide information about their emplacement, and present observations and sensor data that show a rapidly diminishing hydrothermal system associated with the new lava flows. These results confirm the value of collecting repeated ship-based bathymetry in potentially active submarine volcanic settings for detecting eruptions, illustrate how AUV-based high-resolution bathymetry helps interpret submarine lava flow morphology and emplacement, and reveal that some segments of the Mariana back-arc have active magmatic systems, despite the relatively low spreading rate.
Geologic Setting
The Mariana back-arc spreading center is an example of upper plate spreading in an oceanic subduction setting (Fryer, 1995; Stern et al., 2003). Here the Pacific plate subducts beneath the Philippine Sea plate forming the Mariana trench and the active volcanic arc, which is made up of nine islands and over 60 seamounts, a third of which are hydrothermally active (Embley et al., 2007; Baker et al., 2008; Resing et al., 2009). The Mariana back-arc spreading center is located to the west of the volcanic arc and transitions from a relatively shallow ridge in the south (∼3000 m bsl) to a series of deep basins (up to 5000 m bsl) north of 13°N that are segmented and arranged in an en-echelon pattern (Figure 1).
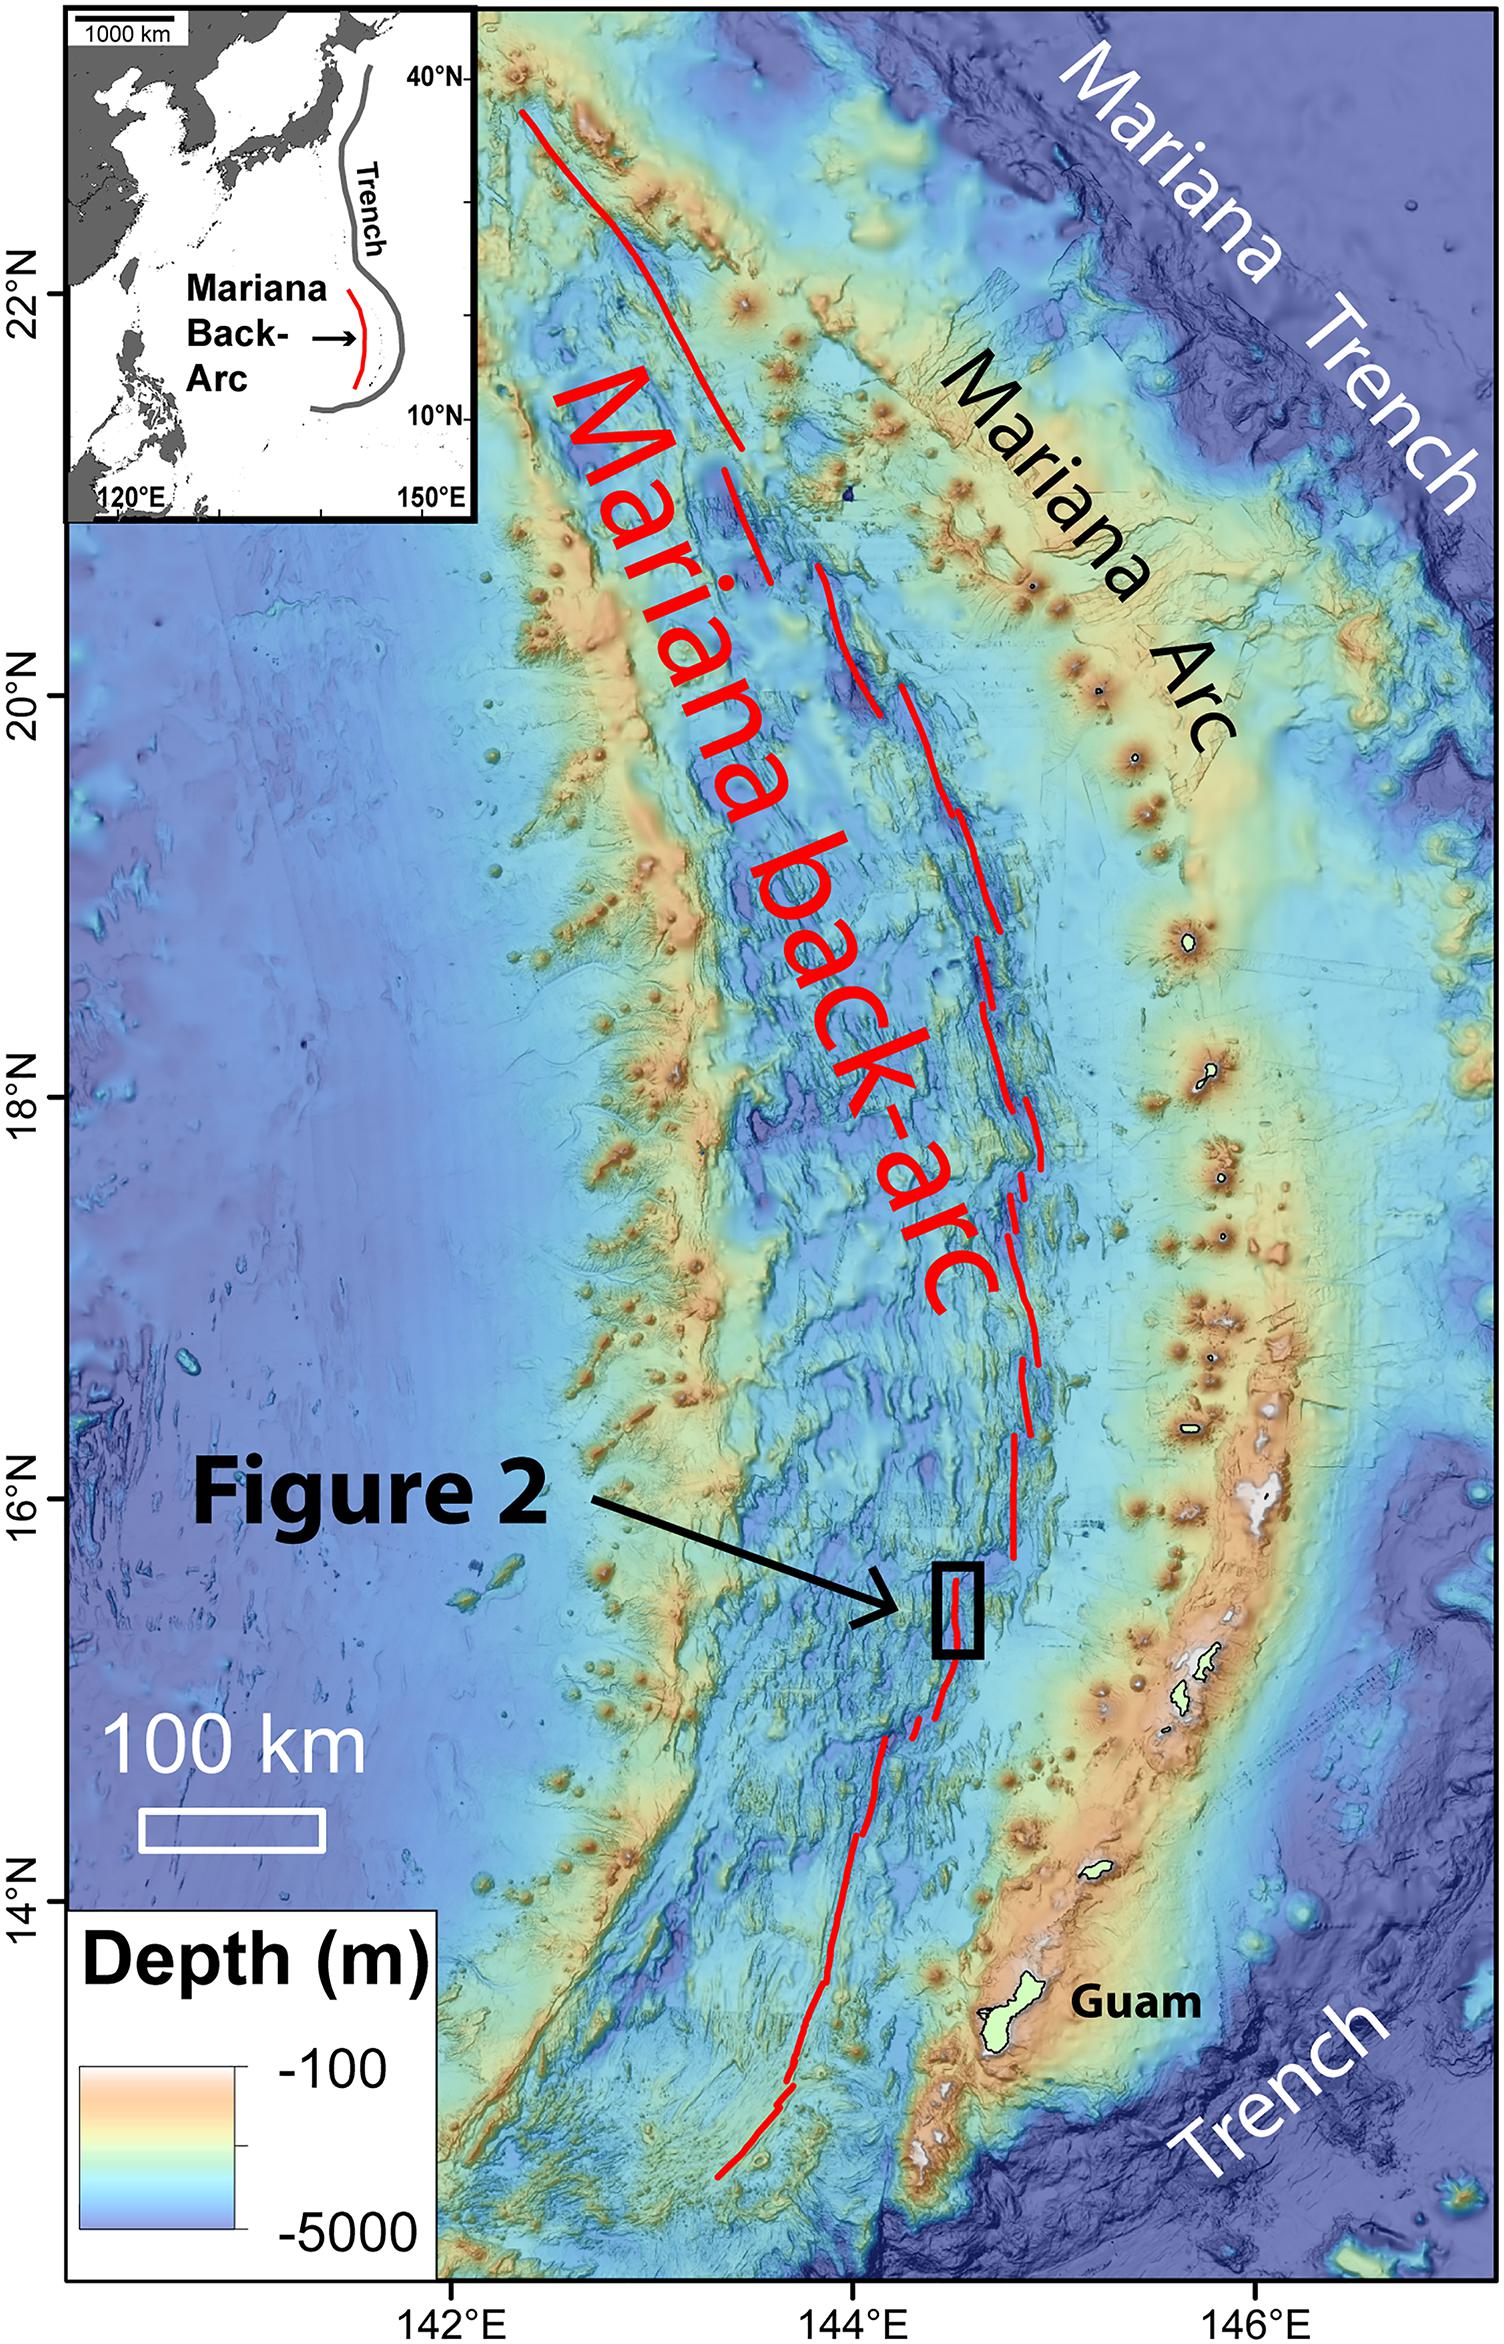
FIGURE 1. Regional map showing location of the study area on the 15.5°N segment of the Mariana back-arc. Black box shows area of Figure 2. Inset map shows the location of the Mariana back-arc relative to the western Pacific trenches, with Japan to the north and the Philippines to the west.
In this paper, we focus on the Mariana back-arc segment centered at 15.5°N [following the naming scheme of Anderson et al. (2017)], which has a spreading rate of ∼25–40 mm/yr (Kato et al., 2003). This segment is ∼34 km long, with an axial valley that is ∼22–25 km wide, with a maximum depth that ranges from 4650 m bsl in the south to 4350 m bsl in the north (Figure 2). The neovolcanic zone is dominated by hummocky volcanic morphology with little or no faulting and has an axial volcanic ridge that rises up to ∼1050 m above the surrounding seafloor with a shallowest depth of 3820 m bsl near 15.5°N (Anderson et al., 2017). Anderson et al. (2017) classified this segment as a tectonic segment currently undergoing magmatic extension, where extension is accommodated by the intrusion of dikes, and the morphology is characterized by an axial valley with moderate-to-high relief at the segment center (600–1300 m), a prominent hummocky axial volcanic ridge (800–1050 m) without a central graben, and limited faulting within the axial valley. Anderson et al. (2017) also calculated the volume of neovolcanic material on this segment as a first-order estimate of eruption rates and magma supply, in comparison to the other segments in the Mariana back-arc. Interestingly, the 15.5°N segment had the second-lowest calculated eruption rate per kilometer (3912 m3/yr/km) of all the segments in their study area (from 12.7°N to 18.3°N). So, in some ways, this segment was the least likely to have hosted a recent eruption. However, the calculated long-term eruption rate is based on its morphology produced by activity over perhaps the last 100,000 years. In contrast, the recent eruption is a manifestation of the present-day (or very recent) magma supply. Therefore, the recent eruption on this segment is consistent with the characterization that the segment is undergoing recent magmatic rejuvenation, as is the discovery of high-temperature black-smoker vents at the Perseverance vent field located on the along-axis high just 5 km north of the eruption site (Figure 2; Baker et al., 2017; Butterfield et al., 2018; Chadwick et al., 2018).
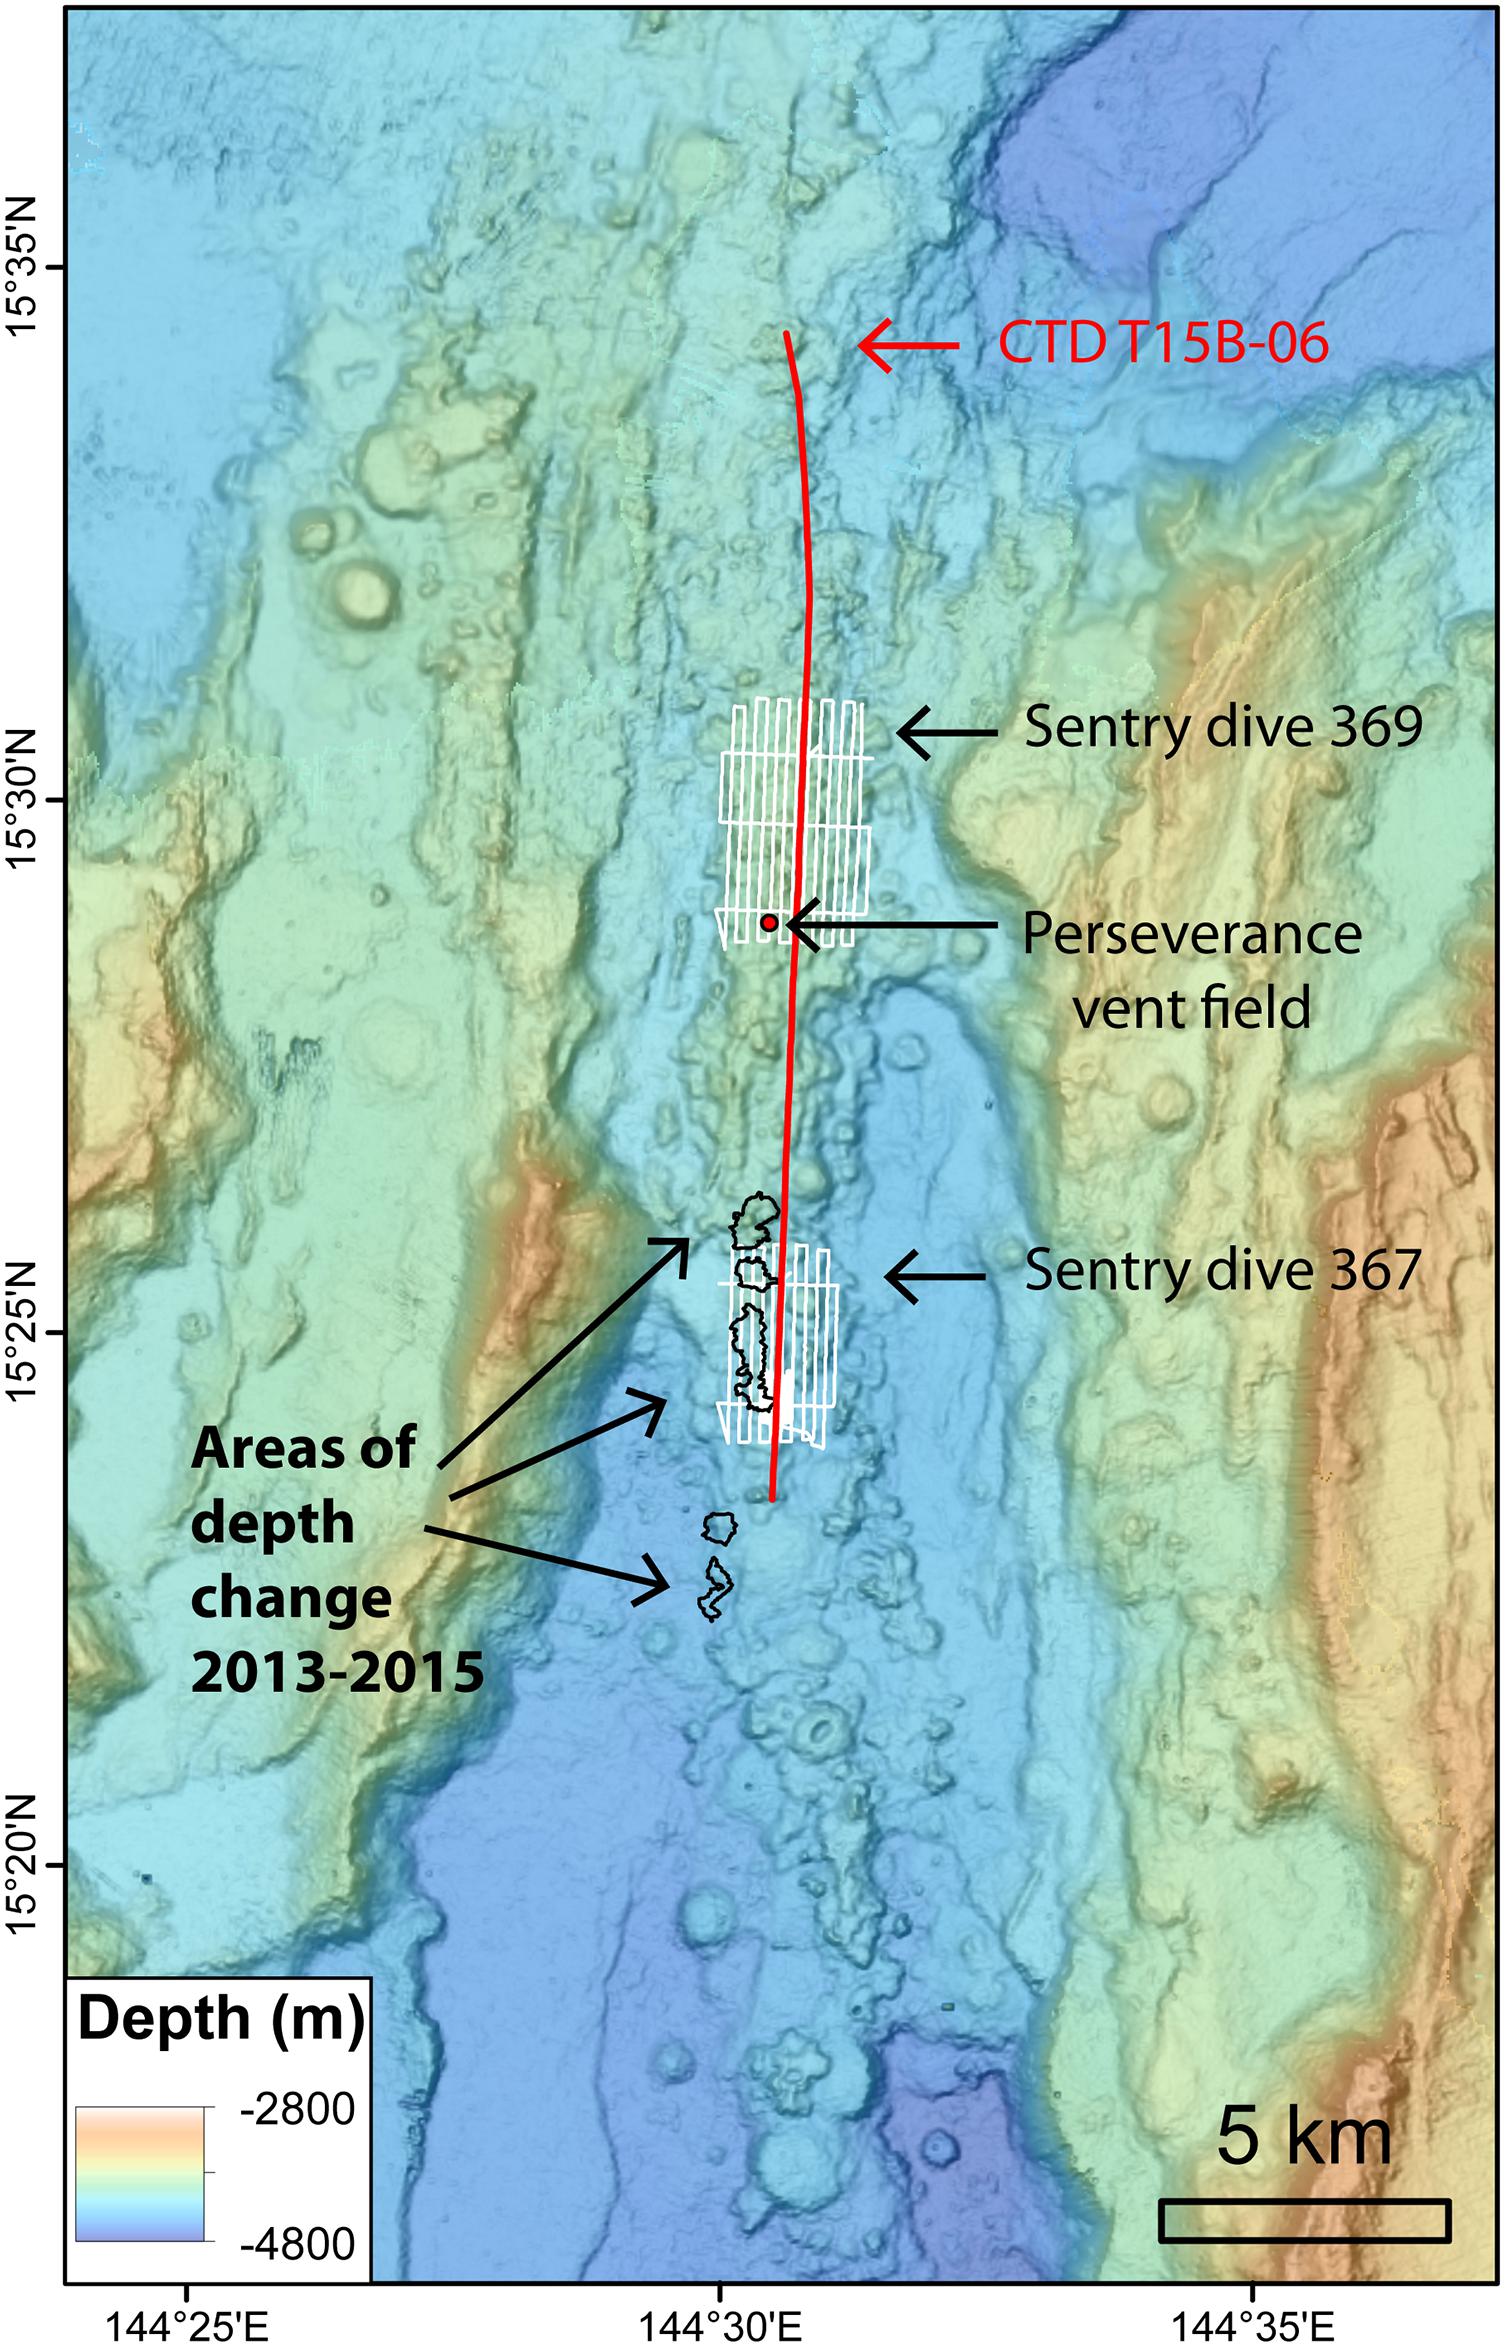
FIGURE 2. Bathymetric map of the 15.5°N segment of the Mariana back-arc showing the location of CTD tow T15B-06 (red line; data shown in Figure 3), AUV Sentry dives 369 and 367 (white lines; the latter shown in Figure 4), and areas of depth change between bathymetric surveys in 2013 and 2015 (black outlines; data shown in Figure 6). Red dot shows location of Perseverance vent field.
Discovery of the Recent Eruption Site at 15.4°N in December 2015
The search for new hydrothermal vent sites along the southern Mariana back-arc during the FK151121 expedition included first using a towed Conductivity, Temperature, Depth (CTD) instrument package. The CTD was raised and lowered from 10 s to several hundred meters above the seafloor as the ship slowly drove forward, resulting in the CTD producing a saw-tooth path in a vertical 2D profile above the seafloor along the tow track (Baker et al., 2017). Where hydrothermal plumes were discovered with the CTD, we deployed the Sentry to collect high-resolution bathymetry in those areas, which was used later when ROV dives were made to localize the source of the plume on the seafloor. Hydrothermal plumes can be detected by CTD sensors that measure temperature, light scattering [turbidity (ΔNTU, Nephelometric Turbidity Units) from hydrothermal particles], and oxidation reduction potential [or ORP (ΔE), for detecting reduced chemicals such as Fe2+, HS-, H2]. On the Sentry mapping dives these same sensors were housed in a self-contained instrument called a Miniature Autonomous Plume Recorder, or MAPR (Walker et al., 2007). The MAPR data from the Sentry dives were complementary to the CTD data (Walker et al., 2016a; Baker et al., 2017).
CTD tow T15B-06 was conducted along the axis of the back-arc segment centered at 15.5°N (Figure 2), and revealed two plumes with distinctly different character (Figure 3). To the south of the highest part of the segment, between 15°23.4′ to 15°27.6′N a plume was detected with relatively low ΔNTU values but high ΔE values. Further north, between 15°27.6′ to 15°33.0′N, the opposite was found in a plume that had relatively high ΔNTU values and lower ΔE values (Figure 3). This was interpreted as evidence for low-temperature diffuse venting in the south and high-temperature focused venting in the north (Baker et al., 2017).
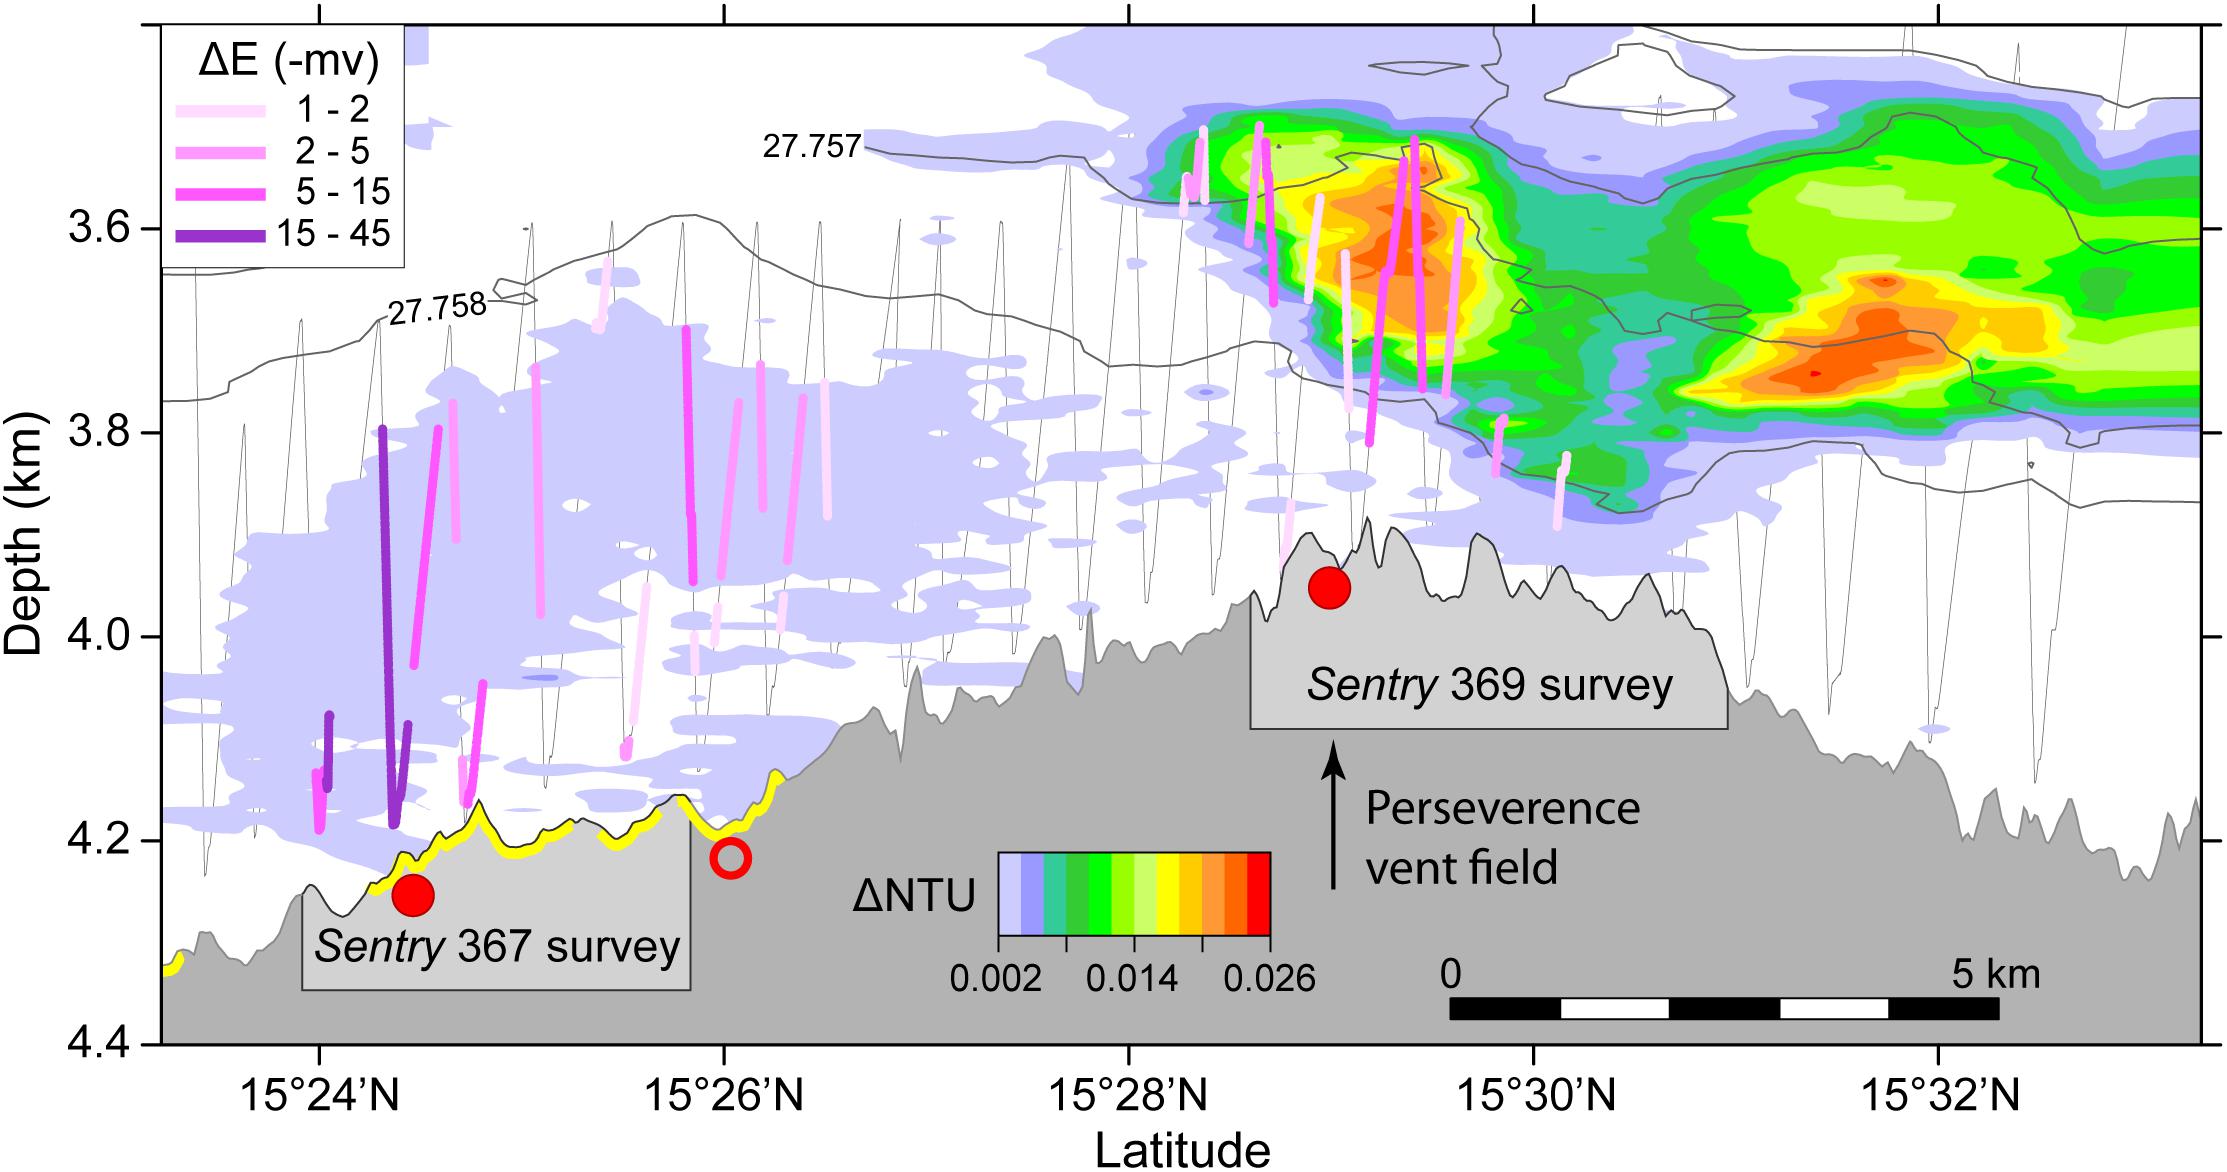
FIGURE 3. Depth cross-section along the axis of the 15.5°N segment of the Mariana back-arc showing data from CTD tow T15B-06 (from Baker et al., 2017). Gray is seafloor profile. Colors above seafloor show turbid particle plumes as ΔNTU anomalies. Colored lines along CTD tow path (gray zigzag lines) show ΔE anomalies in millivolts from ORP sensor (see inset for scale). Red dots are confirmed (solid) or inferred (open) hydrothermal sites from Baker et al. (2017). Yellow highlight on the bathymetry profile indicates extent of new lava flows. Note relatively high ΔE but low ΔNTU anomalies over new lava flows, and high ΔNTU and lower ΔE anomalies over northern-most hydrothermal site, at the Perseverance vent field with black-smoker chimneys.
To investigate further, we deployed Sentry for dive 367, which collected multibeam sonar and plume data in a 2- × -3.5-km area at an altitude of 70 m above the bottom, and then conducted a photo survey at a lower altitude of 5 m over a smaller area (500 m × 1000 m) centered on the highest ΔE anomaly from the CTD tow (Figure 4). We had anticipated that we might photograph some vent animals at a diffuse venting site, but unexpectedly the Sentry photo survey revealed pristine young pillow lavas covering some of the area (Figures 5a,b). The young lava flow was dark, glassy, and completely lacking in any sessile animals or even pelagic sediment. A very light dusting of hydrothermal sediment could be seen in a few areas at the tops of pillow mounds (Figure 5c), and within one of those areas a cloud of milky hydrothermal fluid was photographed coming out of the flow (Figure 5d). The surrounding lava flows are clearly much older with a few cm of sediment completely mantling the lava lobes (Figure 5e). On the eastern edge of the photo survey, in low-lying areas below 4300 m bsl that are noticeably more faulted, the older seafloor is locally completely buried by sediment (Figure 5f).
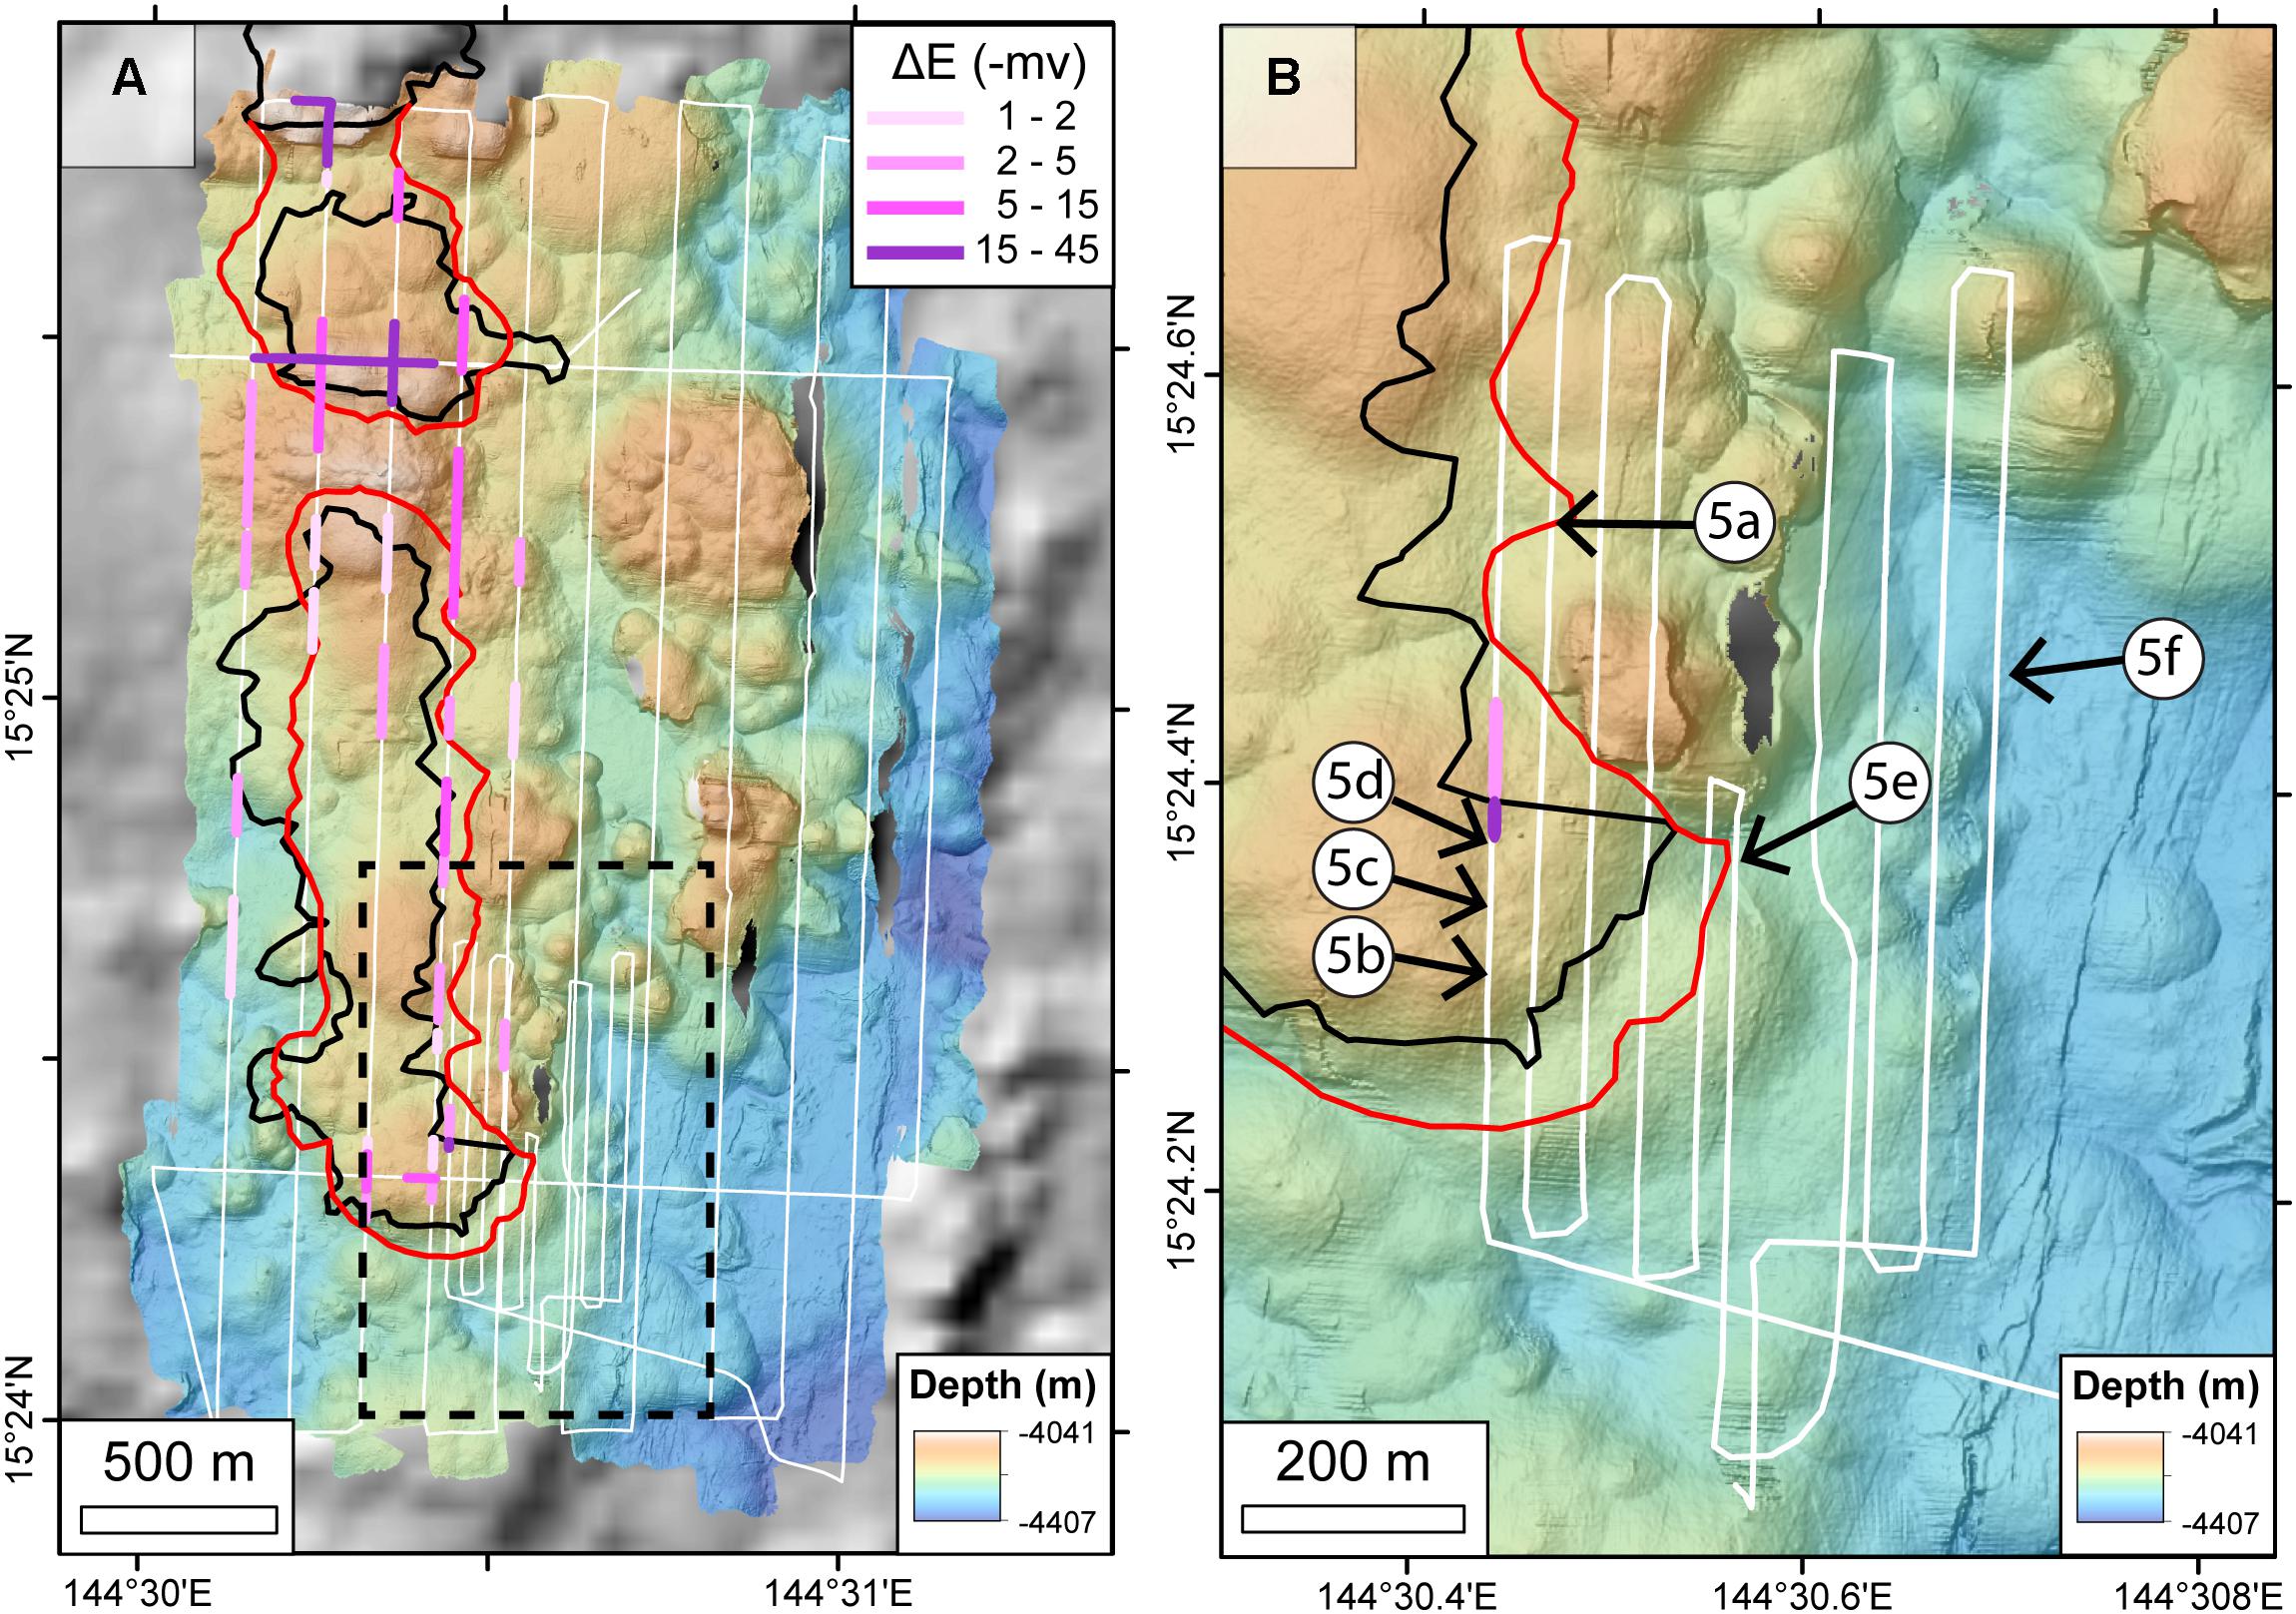
FIGURE 4. AUV Sentry bathymetry from dive 367 with ΔE anomalies from MAPR instrument shown as pink to purple colored lines (see inset for scale) overlain on Sentry track lines (white; widely spaced tracklines were 70 m above bottom). (A) Map of whole survey (modified from similar figure in Baker et al., 2017). Dashed black box is area of Figure 4B. (B) Detailed map of Sentry photo survey area (white track lines; 5 m above bottom). Black outlines show area of depth change between multibeam surveys; red outlines show edges of the 2013–2015 lava flows based on visual observations and interpreted from features in AUV Sentry bathymetry. AUV Sentry bathymetry was re-navigated and then shifted 60 m east and 20 m north to better match ground-truth from ROV dive observations.
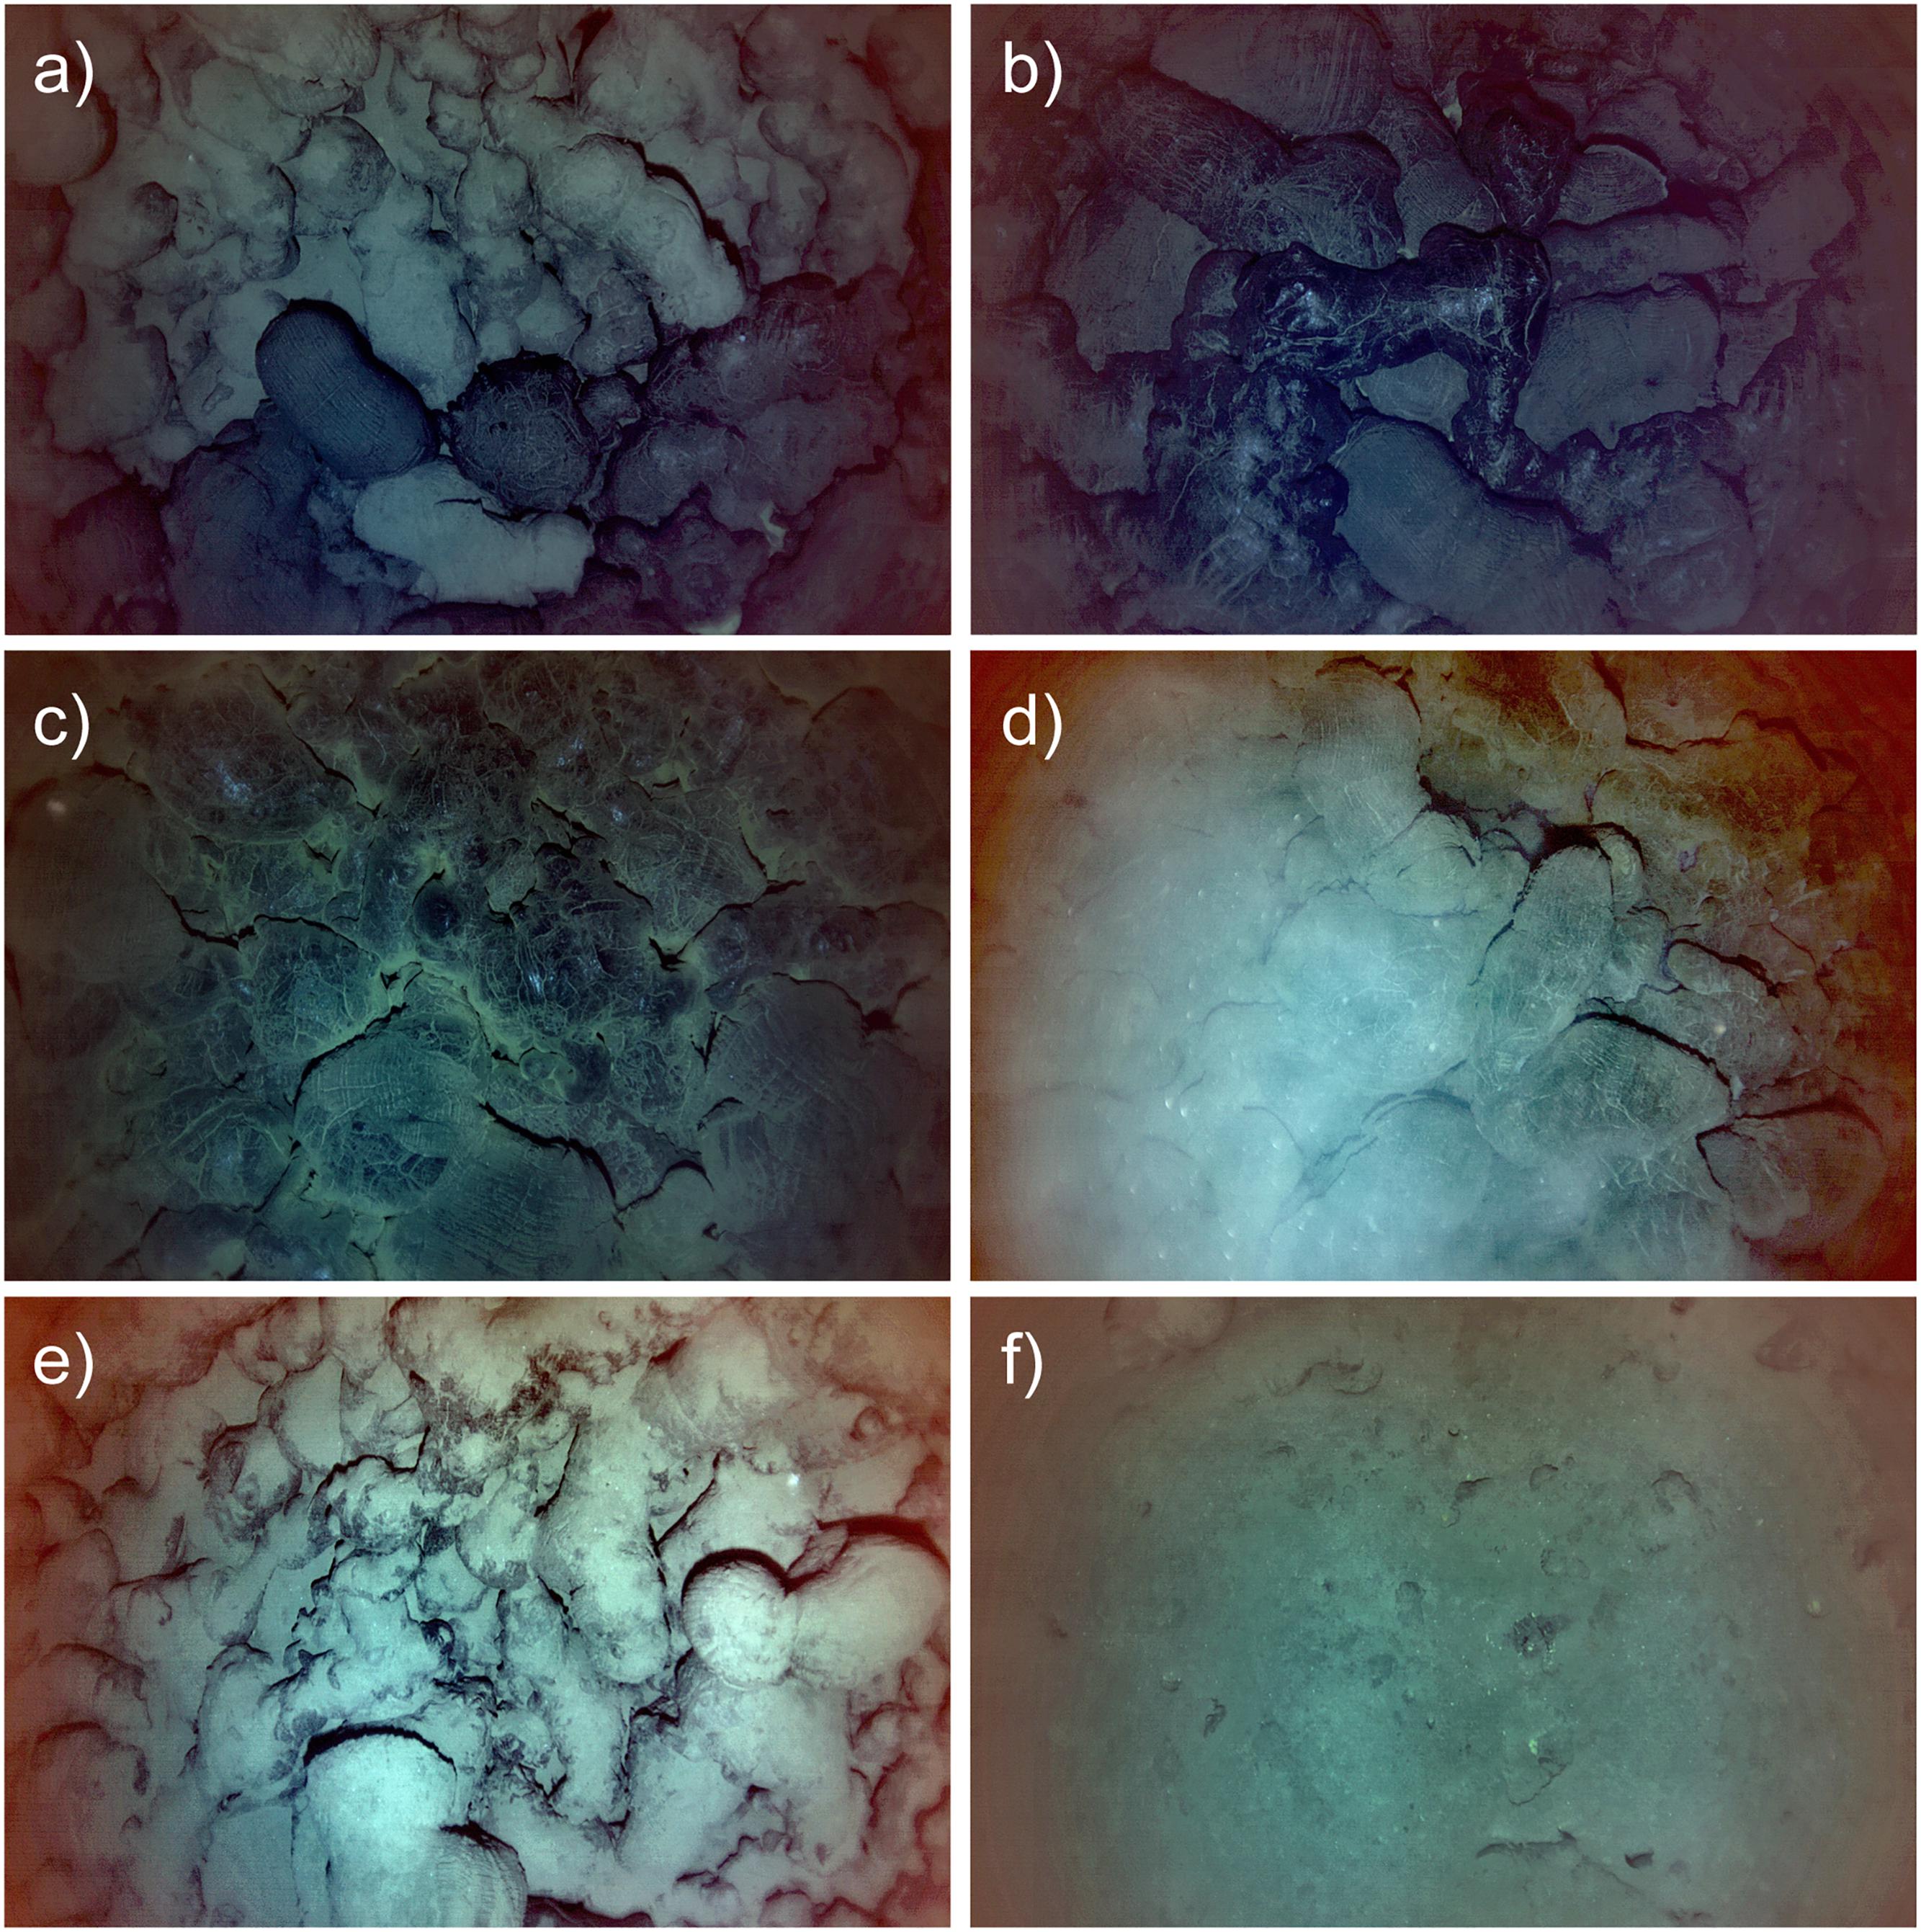
FIGURE 5. Images from AUV Sentry dive 367 photo survey on 03 December 2015 showing young lava flow, evidence of hydrothermal venting, and surrounding older seafloor. Horizontal dimension of photos is ∼5 m. See Figure 4B for photo locations. Numbers in parentheses are time of photo in GMT. (a) Contact between young and old lava (07:33:20), (b) glassy young pillow lava (07:03:43), (c) hydrothermal sediment on young flow (07:04:43), (d) milky hydrothermal venting from young flow (07:05:53), (e) surrounding older lava (09:42:10), (f) older seafloor at east edge of survey with almost complete sediment cover (12:05:26).
The MAPR data collected by Sentry during dive 367 (Walker et al., 2016b) showed multiple ΔE anomalies indicative of hydrothermal venting in the western half of the survey area during the mapping at 70 m above bottom (Figure 4A). During the photo survey at 5 m altitude, a large ΔE anomaly was recorded at the same time and location that the milky vent fluid was photographed (Figure 4B). The photograph of active venting and the number of anomalies detected by the MAPR on Sentry suggest that the lava flows were young enough to be still warm and actively cooling (implying the lavas were only months to years old). On the other hand, chemical analysis of water samples from the CTD tow over the young lava flows showed low levels of hydrogen, indicating that the eruption had ended at least days to weeks beforehand. Active submarine eruptions produce high levels of hydrogen from magma-water interaction, which has a short residence time in the water column (McLaughlin-West et al., 1999; Lilley et al., 2003; Baker et al., 2011; Resing et al., 2011; Baumberger et al., 2014). The 1-m resolution bathymetry collected by Sentry during dive 367 shows that the areas within the young lava flow photographed by Sentry have smooth (unfaulted) hummocky morphology, typical of pillow lava mounds (Figure 4B).
To constrain the age of the young lava flow eruption, we compared (post-eruption) ship-based multibeam bathymetry collected by R/V Falkor with its EM302 sonar system on 01 December 2015 [expedition FK151121 (Resing, 2016b)], with the last survey of the area collected by R/V Melville with its EM122 sonar on 14 February 2013 (expedition MV1302a). Comparing the two surveys revealed a string of five areas with maximum depth change from 40 m up to 138 m (Table 1), extending over a distance of 7.3 km along the back-arc spreading axis from latitude 15°22.3′ to 15°26.3′N (Figure 6). The cross-axis width of these depth changes was 200–800 m. For convenience, we number the areas of depth change 1 to 5, from north to south (Table 1). The third area of depth change includes the area photographed and mapped by Sentry (Figures 4, 6). The timing of the eruption can be bracketed within the 2.8-year period between the two bathymetric surveys. However, the fact that the young flows were still emitting hydrothermal fluids when first photographed suggests that the eruption was probably late within that time period (Baker et al., 2018). A search for anomalous seismicity in the area that might have narrowed the eruption time window further did not uncover any unusual activity1, so the eruption was not detected remotely.

TABLE 1. Estimates of the thicknesses, areas, and volumes of new lava flows, based on depth changes between 2013 and 2015 bathymetric surveys.
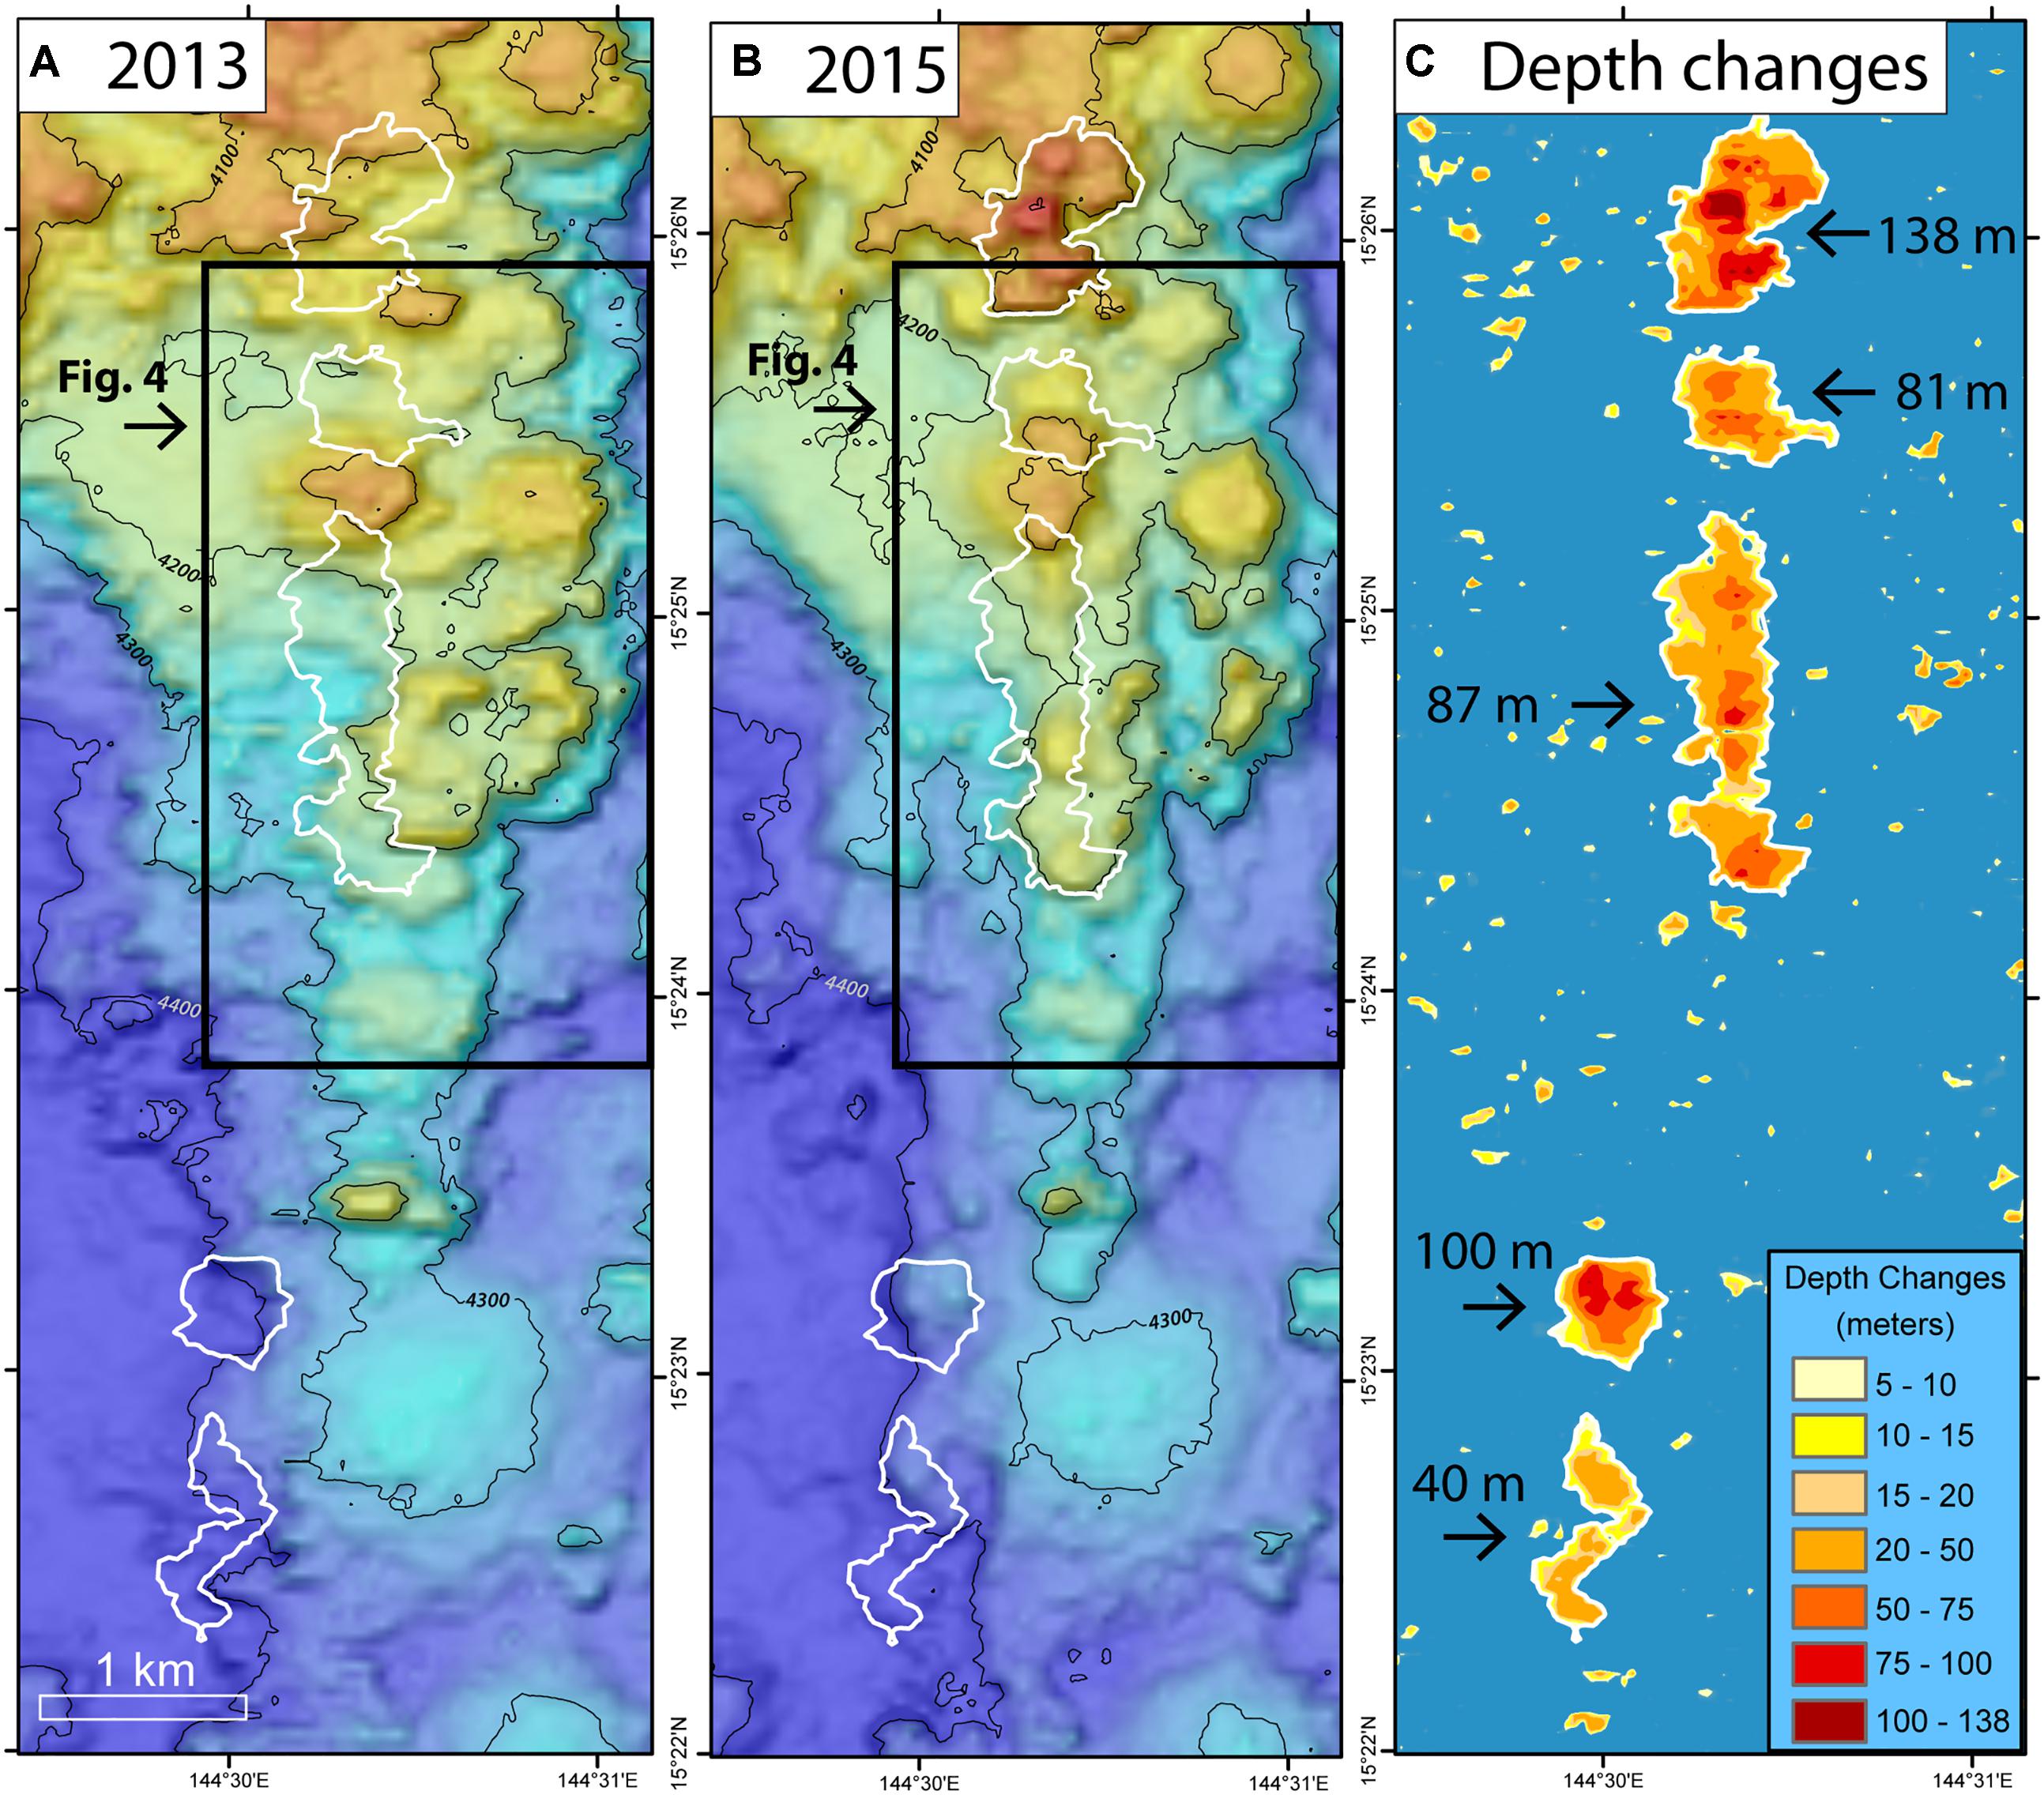
FIGURE 6. Depth changes between ship-based multibeam bathymetric surveys (numbered 1–5 from north to south in Table 1). (A) Pre-eruption bathymetry collected in February 2013 by R/V Melville (MV1302a; EM122 sonar). (B) Post-eruption bathymetry collected in December 2015 by R/V Falkor (FK151121; EM302 sonar). (C) Depth differences between the two surveys showing 5 areas of significant depth change (outlined in white; color scale at lower right). Numbers indicate maximum depth change within each area. Black boxes show area of Figure 4.
The 2013–2015 eruption is the deepest known historical submarine volcanic eruption, and extends over a depth range of 4050 to 4450 m bsl. The post-eruption bathymetry, the photo survey, and the relatively large magnitude of the depth changes between the surveys indicates that the eruption produced a chain of hummocky pillow lava mounds, which commonly accumulate to thicknesses of tens to over 100 m in divergent plate boundary settings (Caress et al., 2012; Yeo et al., 2012; Chadwick et al., 2013; Yeo et al., 2013; Chadwick et al., 2016; Clague et al., 2017). The outlines of the depth changes (and young lava flows) shown in Figure 6 are minimum areas, since the detection threshold used was a depth difference of 5 m, and therefore any areas where the flow thickness is less than that (including flow margins) are not resolved. For example, observations from later ROV dives show that some of the separate areas of depth change are actually connected by young lavas (described below). Nevertheless, the before-and-after bathymetry can be used to constrain the thickness and area of the lava flows and the volume of lava erupted (Table 1). Our analysis shows that the total area of the young flows is 1.81 × 10⁶m2 and the total eruptive volume was 66.3 × 10⁶ m3. For comparison, this volume is larger than all the previously documented historical eruptions on the Juan de Fuca and Gorda spreading ridges in the NE Pacific, except for the 2011 and 2015 eruptions at Axial Seamount, which is a hot spot volcano superposed on the Juan de Fuca spreading ridge (Chadwick et al., 1998; Rubin et al., 2012; Yeo et al., 2013; Clague et al., 2017).
The area surveyed during AUV Sentry dive 367 (Resing, 2016a) covered part of the northern half of the chain of lava flows along the back-arc spreading axis (covering the second and third areas of depth change), but did not extend all the way to the northern end where the thickest of the flows was located (Figures 4, 6). Superposing the outlines of the areas of depth change determined by the ship-based bathymetric comparison on the high-resolution Sentry bathymetry shows that all the ΔE anomalies recorded by the MAPR on Sentry were located over relatively thick accumulations of lava (Figures 4, 6). The Sentry bathymetry also shows that the hummocky flows produced by this most recent eruption (on the west side of the Sentry survey area) are very similar in morphology to previous eruptions along this segment of the back-arc (on the east side of Figure 4A). In fact, it would be impossible to map the boundaries of 2013–2015 lava flows on the AUV bathymetry without the additional information from multibeam depth changes and the visual observations. In general, the young lava flows have a smooth but hummocky morphology in the AUV bathymetry, which shows that they were emplaced from multiple local eruption centers along a N-S fissure system. The Sentry photo survey was fortuitously located spanning the southeastern edge of the third area of depth change (Figure 4B). The navigation of AUV Sentry dive 367 bathymetry was reprocessed using mbsystem navadjust software (Caress and Chayes, 2016) based on matching features in overlapping swaths, and then was shifted 60 m east and 20 m north to best match the ship-based EM302 bathymetry. The location of the edge of the young lavas mapped by the Sentry data and the ROV dives (described below) compared to the areas of depth change between bathymetric surveys gives an idea of the uncertainty in the ship-based multibeam comparison method. The lava flow boundary mapped by visual ground truth (red lines in Figure 4) is generally within 50–100 m of the depth change boundary (black outlines in Figure 4).
Visual Characterization of the 2013–2015 Lava Flows and Changes Over Time
After the discovery of the recent eruption site in December 2015, two later expeditions with ROVs visited the site in 2016: NOAA ship Okeanos Explorer cruise EX1605L1 with ROV Deep Discoverer (D2) in April 2016, and R/V Falkor cruise FK161129 with ROV SuBastian in December 2016. Each expedition made one ROV dive on the new lava flows, which allowed for visual observations over different parts of the eruption site, sampling of the lava flows, and a search for evidence of any on-going hydrothermal activity.
ROV Deep Discoverer (D2) made dive EX1605L1-09 on 29-30 April 2016 on the northern-most and thickest of the 2013–2015 lava flows (Figure 7), for which we only have ship-based bathymetry (∼40 m resolution), because it is north of the Sentry survey. The ROV dive made a north-to-south zig-zag traverse over three haystack-shaped mounds of young pillow lavas, each 50–100 m high and 200–400 m wide, along a horizontal traverse of ∼750 m, during ∼5.5 h of time on the bottom. The second of the three mounds has the thickest accumulation of pillow lavas, with a maximum depth difference of 138 m, although the ROV track skirted the very thickest part (Figure 7). The pillow lavas on the relatively steep sides of the mounds frequently were decorated with an extraordinary number of extremely glassy “buds” or “fingers” of lava (5–10 cm in diameter) extending outward for a few 10s of cm from the main pillow tubes (0.5–1.0 m in diameter) (Figures 8a,b). These are similar to the “knobby pillows” described by Ballard and Moore (1977) on the mid-Atlantic ridge, interpreted to be indicative of faster flow rates on the steeper flanks of pillow constructs. The flanks of the mounds had little or no hydrothermal sediment on the lava. In contrast, the tops of the pillow mounds had much broader and flatter pillows and were commonly dusted with low-temperature hydrothermal sediment composed mainly of iron oxy-hydroxide, which locally accumulated into thicker deposits between the lobes (Figures 8c,d). The pillow mounds were topped with small conical constructs that were ∼10 m high and ∼5 m in diameter and formed of radiating pillow tubes (Figures 8d,e), apparently representing late-stage eruption centers. These are similar to the “pillowed cones” described in Ballard and Moore (1977).
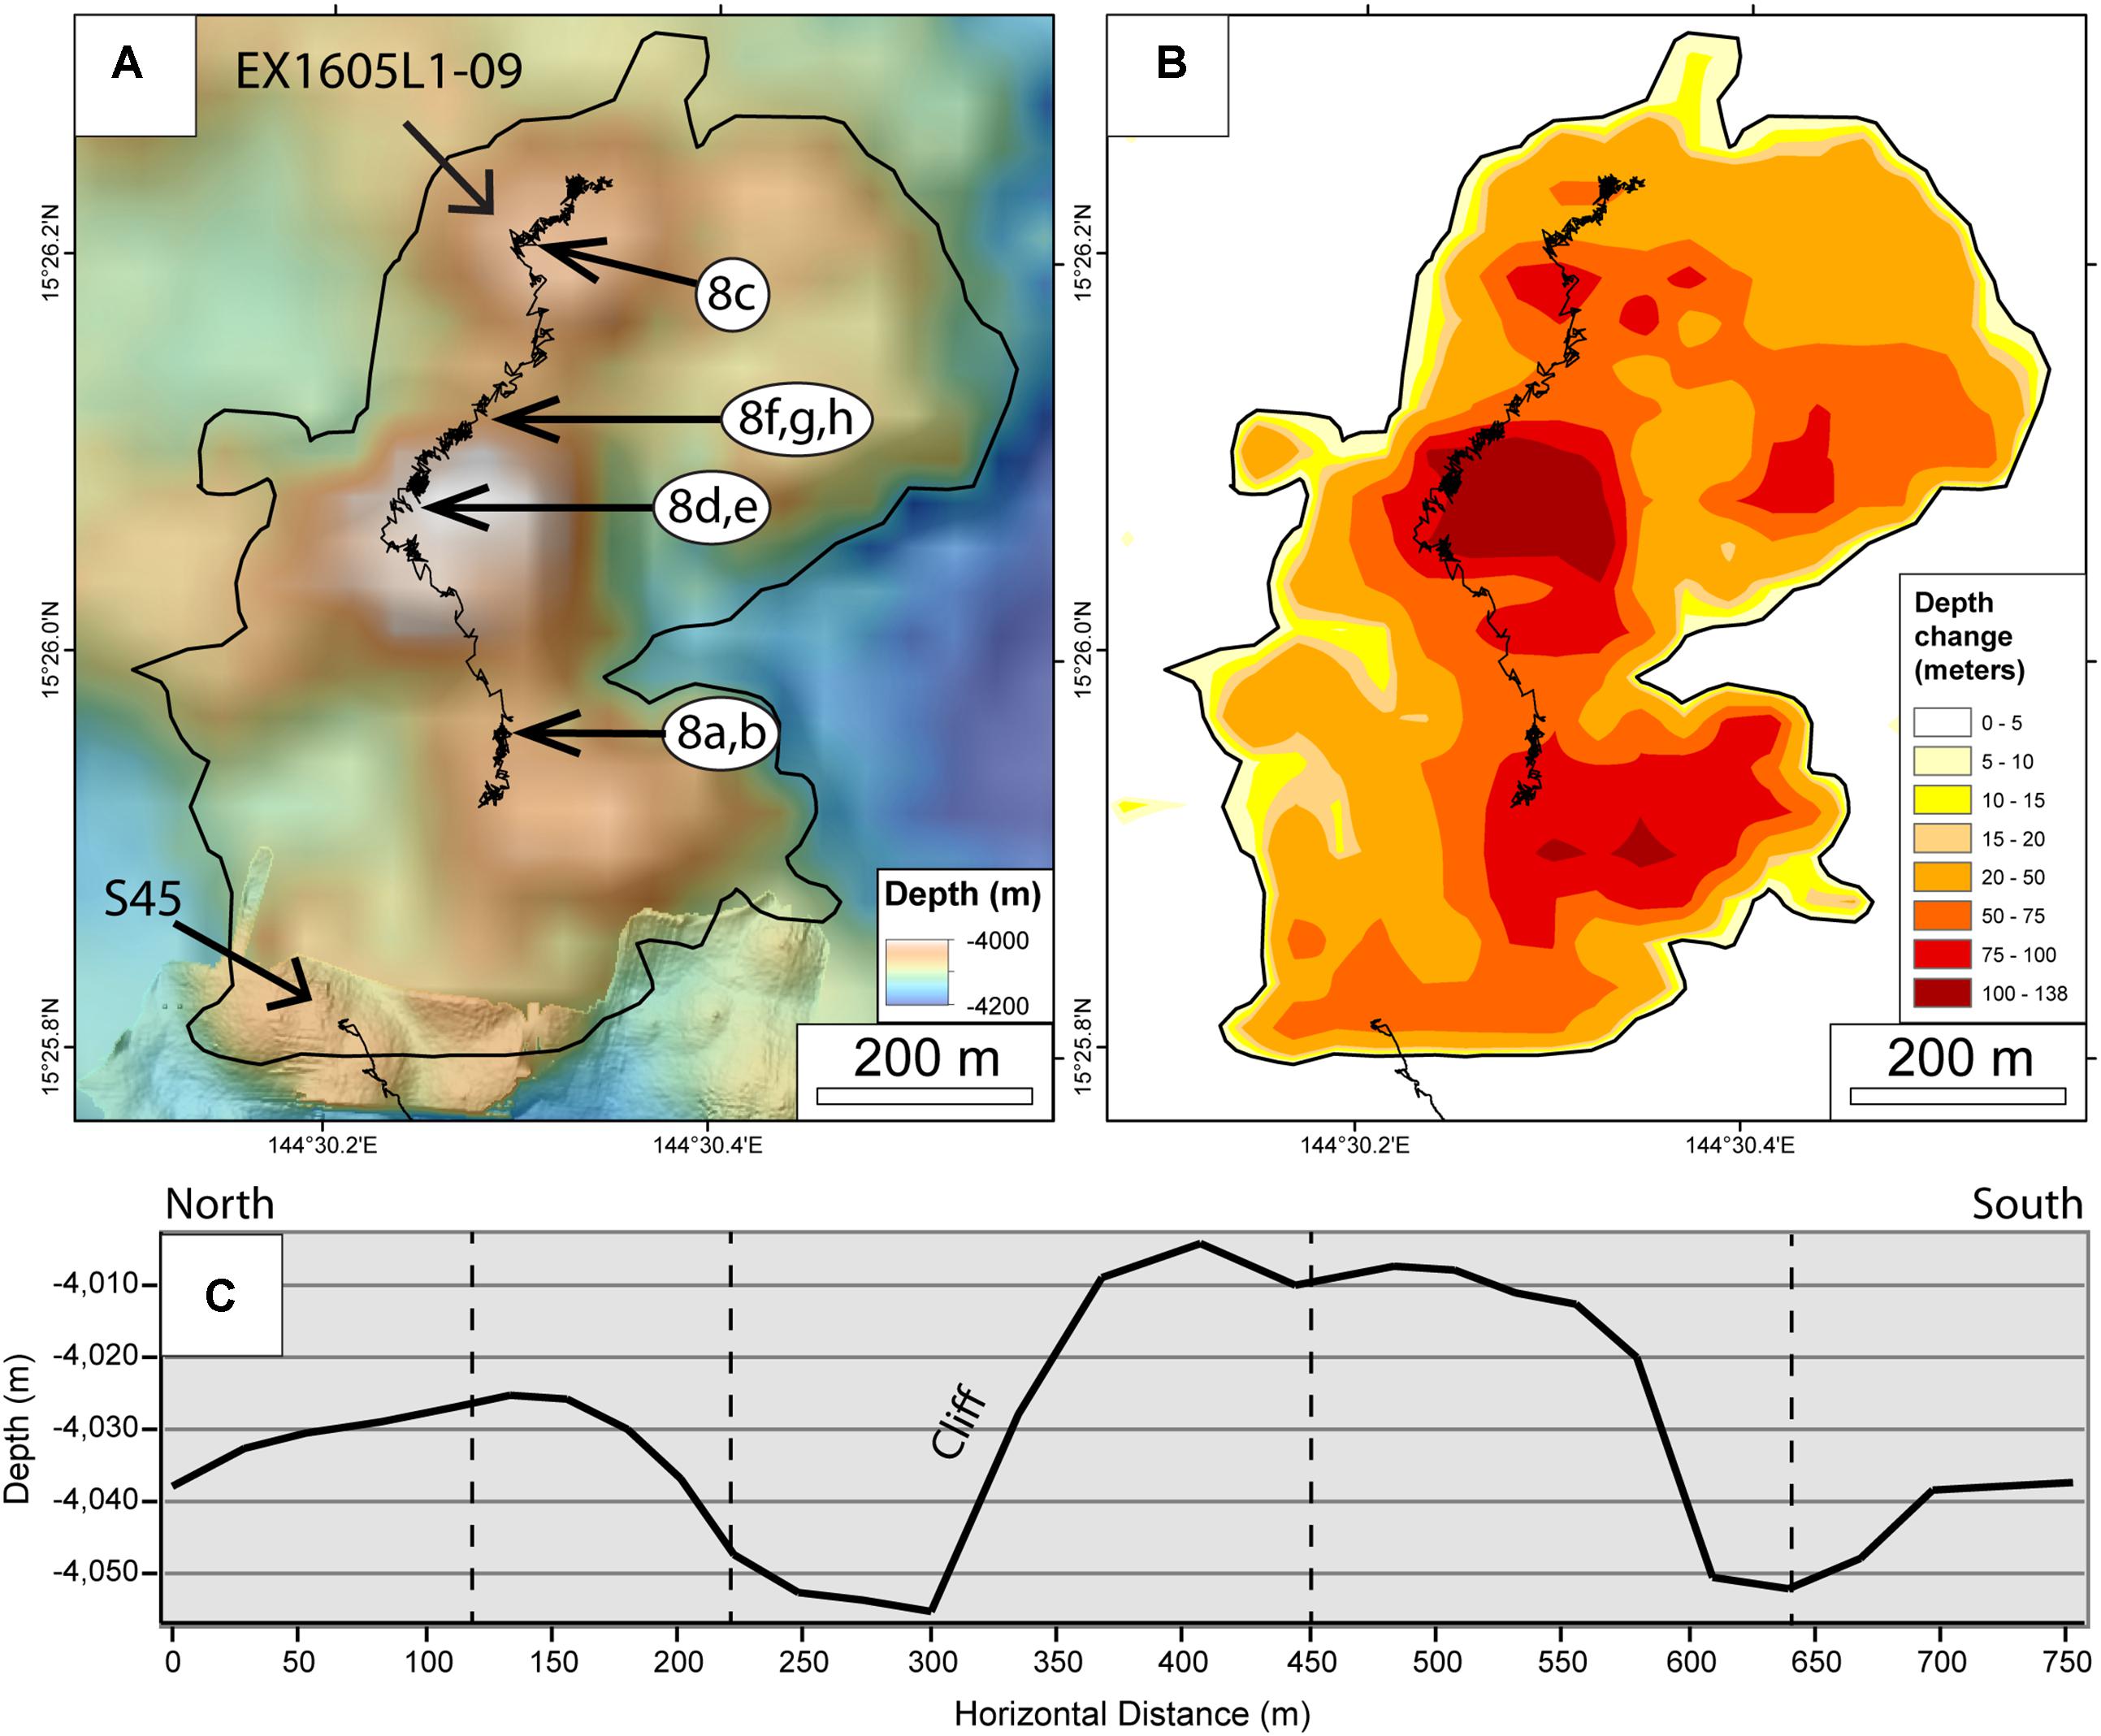
FIGURE 7. Detailed maps showing the track of ROV Deep Discoverer dive EX1605L1-09 (black squiggly line) across northern-most and thickest lava flow. (A) Bathymetric map, mostly ship-based data (40-m resolution) with a small sliver of AUV Sentry data (1-m resolution) at bottom. Arrows with numbers show locations of ROV images in Figure 8. (B) Depth changes between ship-based bathymetric surveys in 2013–2015. (C) Depth profile along ROV dive EX1605L1-09 track line, showing 3 haystack-shaped pillow mounds (ship-based bathymetry). Vertical dashed lines indicate major bends in the dive track.
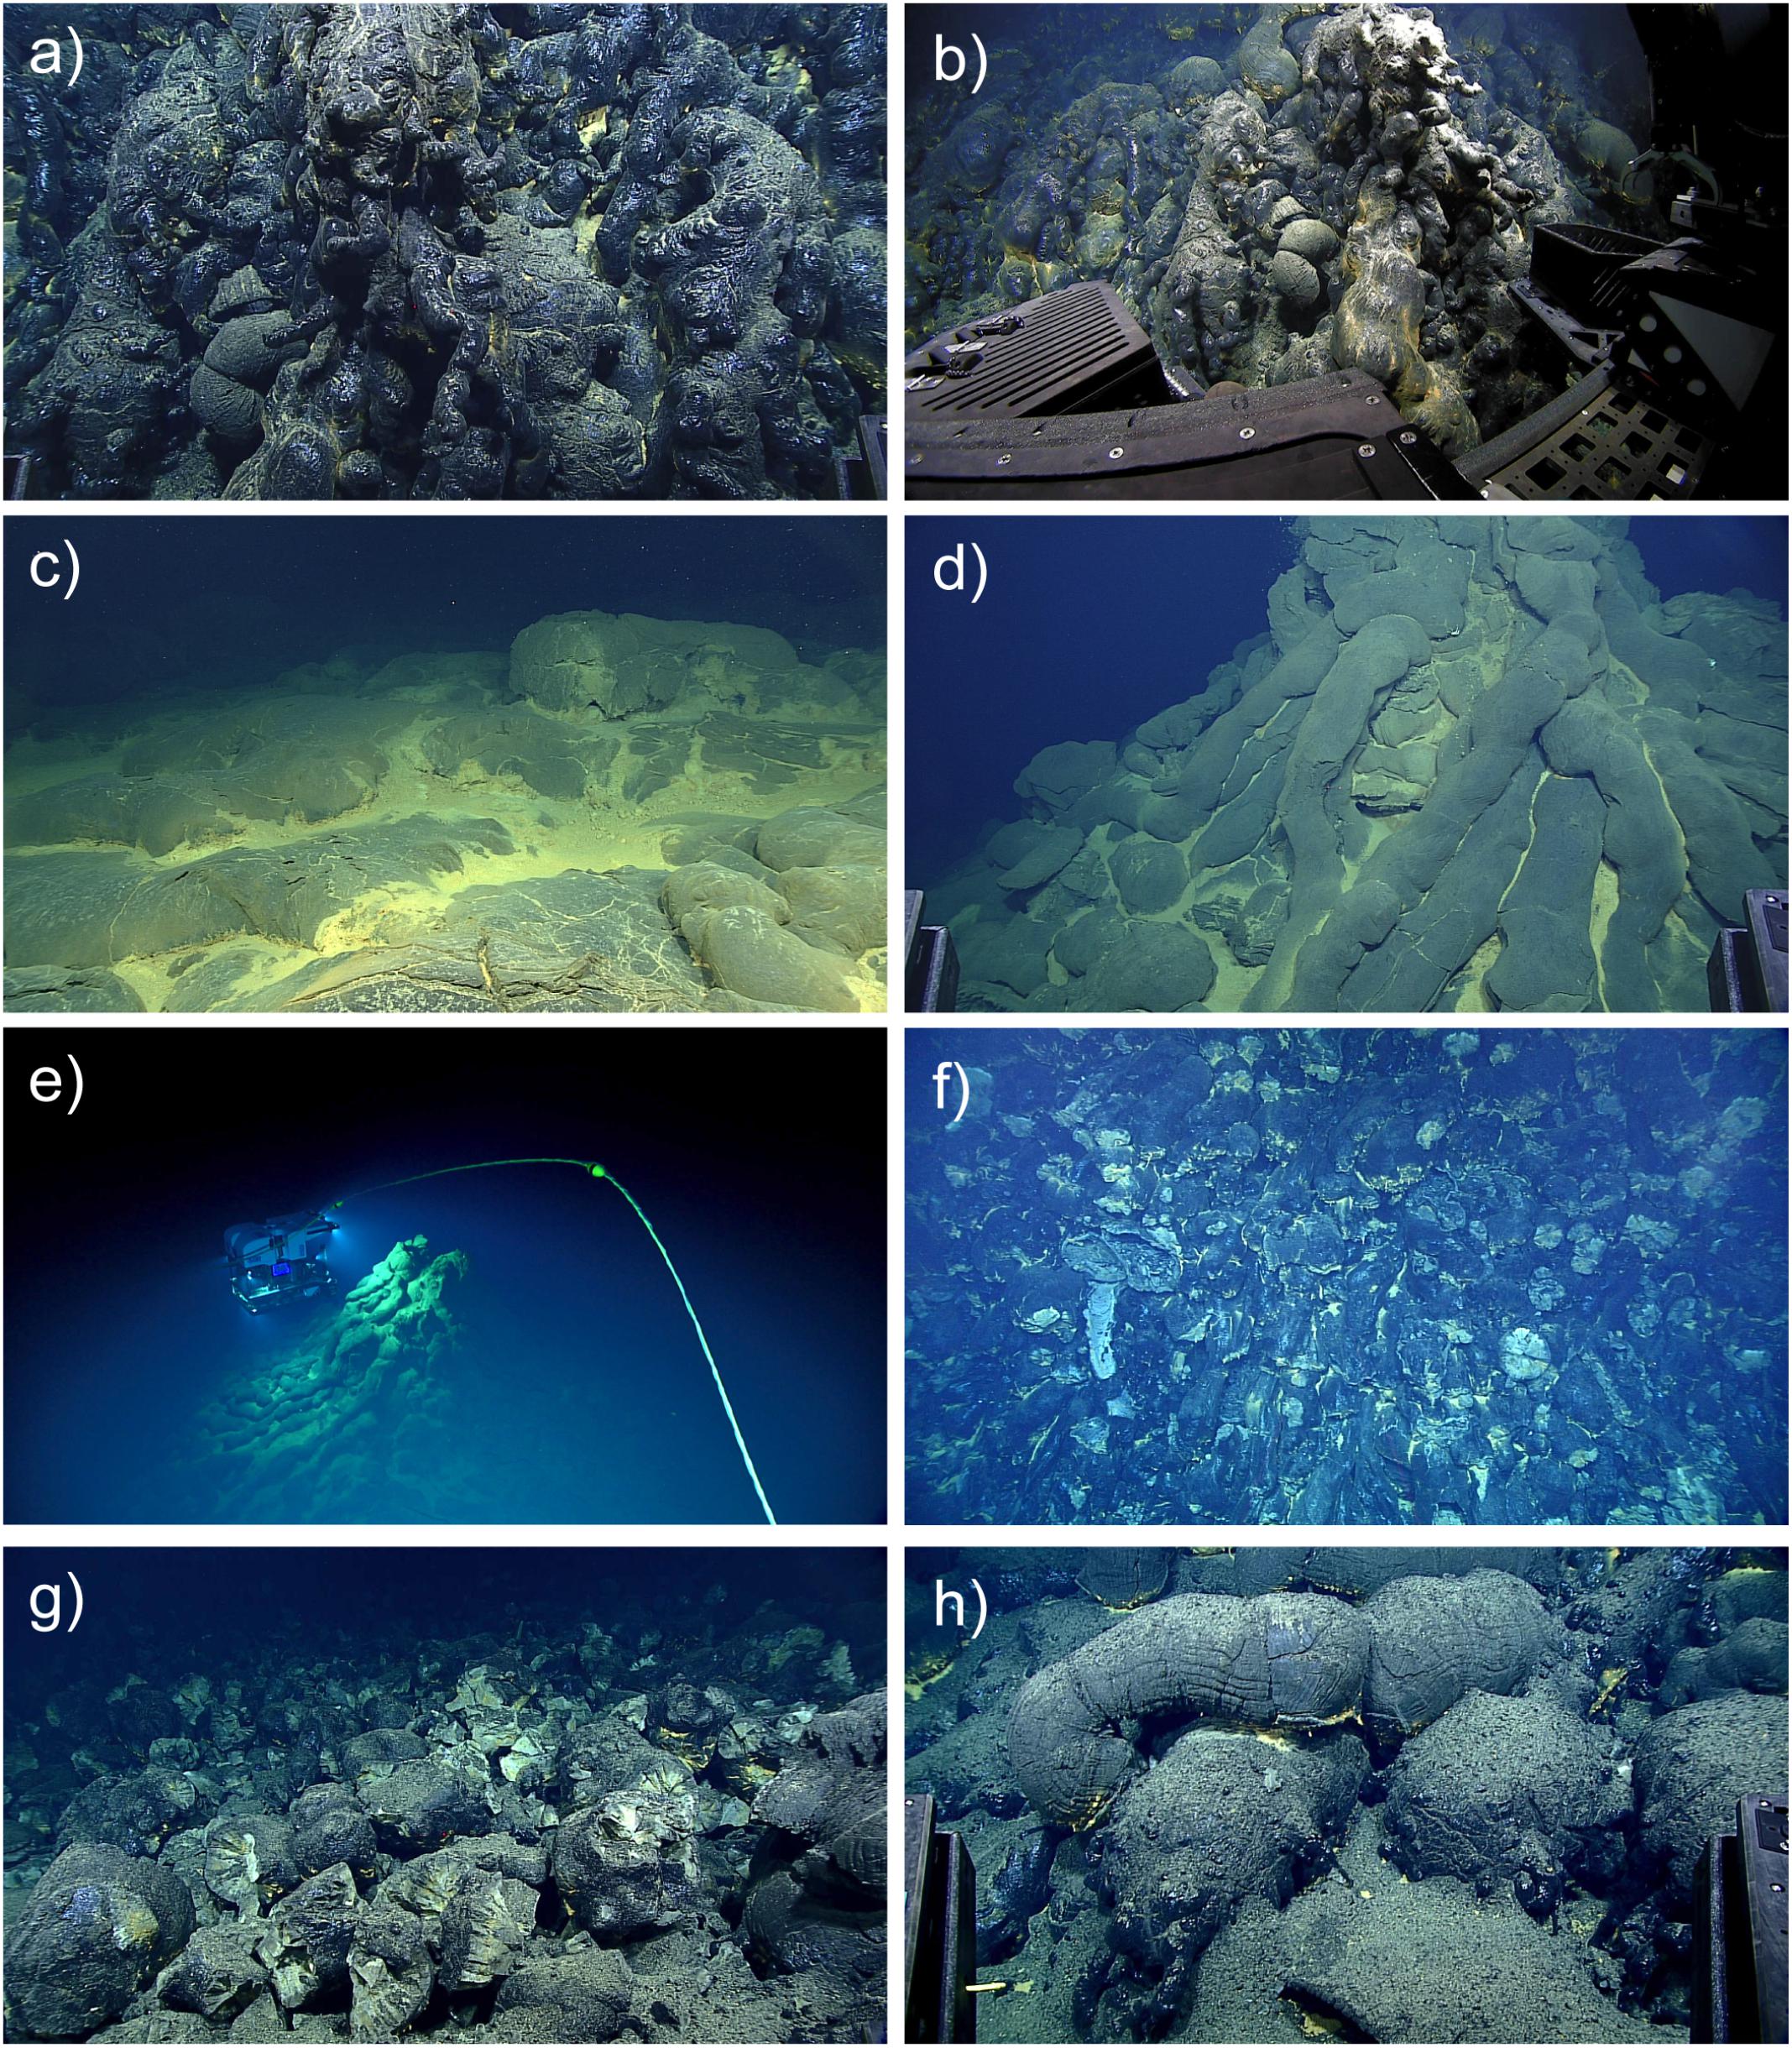
FIGURE 8. Images from ROV Deep Discoverer dive EX1605L1-09 on 29–30 April 2016, which crossed the northern-most and thickest of the 2013–2015 lava flows. See Figure 7 for photo locations. Numbers in parentheses are time of photo in GMT and horizontal scale. (a) Pillow lavas with extremely glassy finger-like buds (03:41:31, 2 m). (b) ROV set up to sample a glassy pillow bud (03:49:32, 4 m). (c) Broader lobes on top of one of the pillow mounds with hydrothermal sediment (00:03:48, 5 m). (d) Conical eruptive center at the top of a mound with radiating pillow tubes and hydrothermal sediment (02:43:00, 6 m). (e) View of ROV illuminating a conical eruptive center (02:40:20, 20 m). (f) Nearly vertical cliff with intact and truncated pillows (01:12:11, 10 m). (g) Primary pillow talus at base of cliff (01:06:06, 3 m). (h) Fragmental deposit on top of pillows beyond the talus apron (01:03:14, 2 m).
The north slope of the second, thickest mound was nearly vertical and consisted of a mix of intact and truncated pillows (Figures 7, 8f), with an apron of talus at the bottom consisting of pillow fragments (Figure 8g). The talus was likely primary and formed by auto-brecciation during lava flow emplacement and mound construction, rather than due to later tectonism. Beyond the apron of talus, smaller angular glassy fragments were deposited on top of pillow lavas and extended outward for 50–75 m from the base of the cliff (Figure 8h), a more distal component of auto-brecciation, also formed by pillow fragments tumbling down the cliff. The dive started and ended within the new lavas and no contacts with older lavas were seen.
During the dive we saw one area of noticeable diffuse hydrothermal venting where we measured a temperature of 7.0°C with the ROV’s temperature probe, well above the ambient temperature of 1.65°C (Figure 9a). Vent endemic species were commonly sighted throughout the dive, including polychaetes (Figure 9b), shrimp (Figure 9c), and squat lobsters (Figure 9d). This is additional evidence that the lava flows were still actively cooling in April 2016, and had hosted diffuse hydrothermal venting long enough to be colonized by mobile vent animals, but not by sessile species that take longer to colonize. This is consistent with the lava flows only being months to years old when first discovered. The nearest known hydrothermal site is the Perseverance vent field located ∼5 km to the north on the segment high (Figures 3, 4).
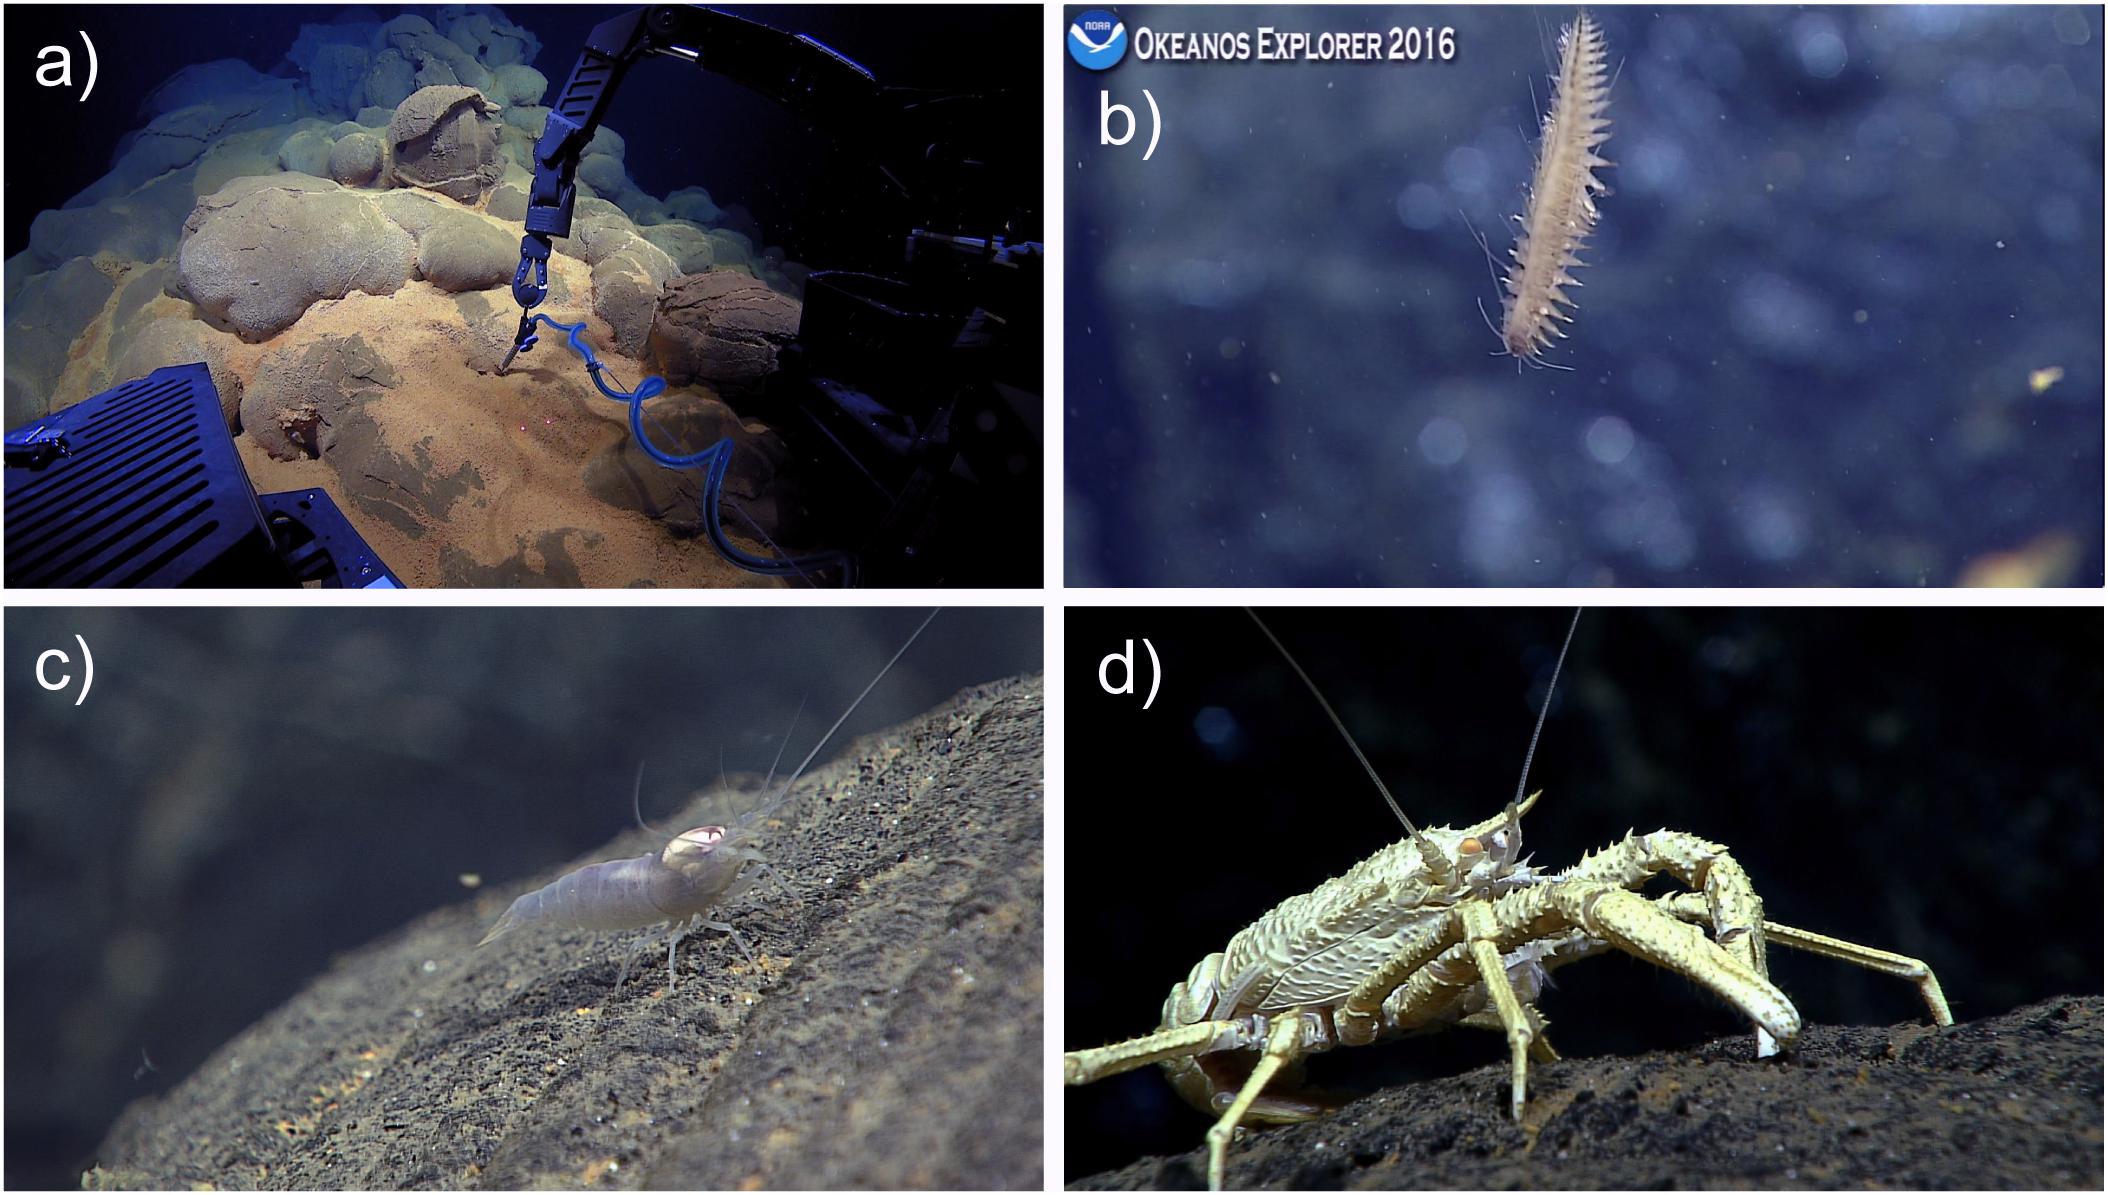
FIGURE 9. Images of hydrothermal vent animals observed on the new lavas during ROV Deep Discoverer dive EX1605L1-09 on 29–30 April 2016. Numbers in parentheses are time of photo in GMT and horizontal scale. (A) ROV manipulator arm measuring temperature of 7.0°C (ambient = 1.65°C) in an area of very diffuse venting (02:17:21, ∼5 m). (B) One of many polychaetes seen swimming above the bottom (23:03:48, ∼6 cm). (C) Shrimp (00:11:20, ∼3 cm). (D) Squat lobster (00:24:51, ∼5 cm).
Seven months later on 12 December 2016, a second ROV dive was made during expedition FK161129 from R/V Falkor with ROV SuBastian. Dive S45 started 240 m SSE of the end of the previous ROV dive and explored areas further south where high resolution bathymetry had been collected by AUV Sentry a year earlier (Figure 10) and where the MAPR on Sentry detected ΔE anomalies, indicating hydrothermal activity (Figure 4A). The dive started at a depth of 4045 m bsl in young lava with a light dusting of yellow hydrothermal sediment (Figure 11a) at the top of a pillow mound at the SW end of the northern-most area of depth change (Figure 10). The south side of that pillow mound was a nearly vertical cliff, over 110 m high, that was mantled by almost completely intact young pillow lavas (Figure 11b). The pillows on the cliff face were narrow glassy elongated tubes appearing like elephant trunks or the drips of wax on the outside of a candle (Figures 11c,d). It was remarkable how little talus was at the base of the cliff, in strong contrast to the cliff encountered on the previous dive (Figures 8f–h), apparently because these lavas were emplaced at a higher extrusion rate so the pillows remained intact even though the lava was flowing down such a steep slope. Extrusion rate would affect the thickness of lava crusts during pillow emplacement, with more rapidly emplaced pillows more likely to have a thinner plastic crust before solidification, rather than a thicker brittle crust that is more likely to result in auto-brecciation. The location of this cliff on the Sentry bathymetry coincides with a navigation artifact, so on the map it appears even more steep than it actually is (Figure 10). The cliff on the map is between the northern-most two areas of multibeam depth change, but this ROV dive showed that young lavas are continuous and actually connect the two areas (but the lava must be relatively thin there). On Figures 4, 10, the red outlines show our interpreted mapping of the extent of the young lava flows, based on ROV observations and the Sentry high-resolution bathymetry.
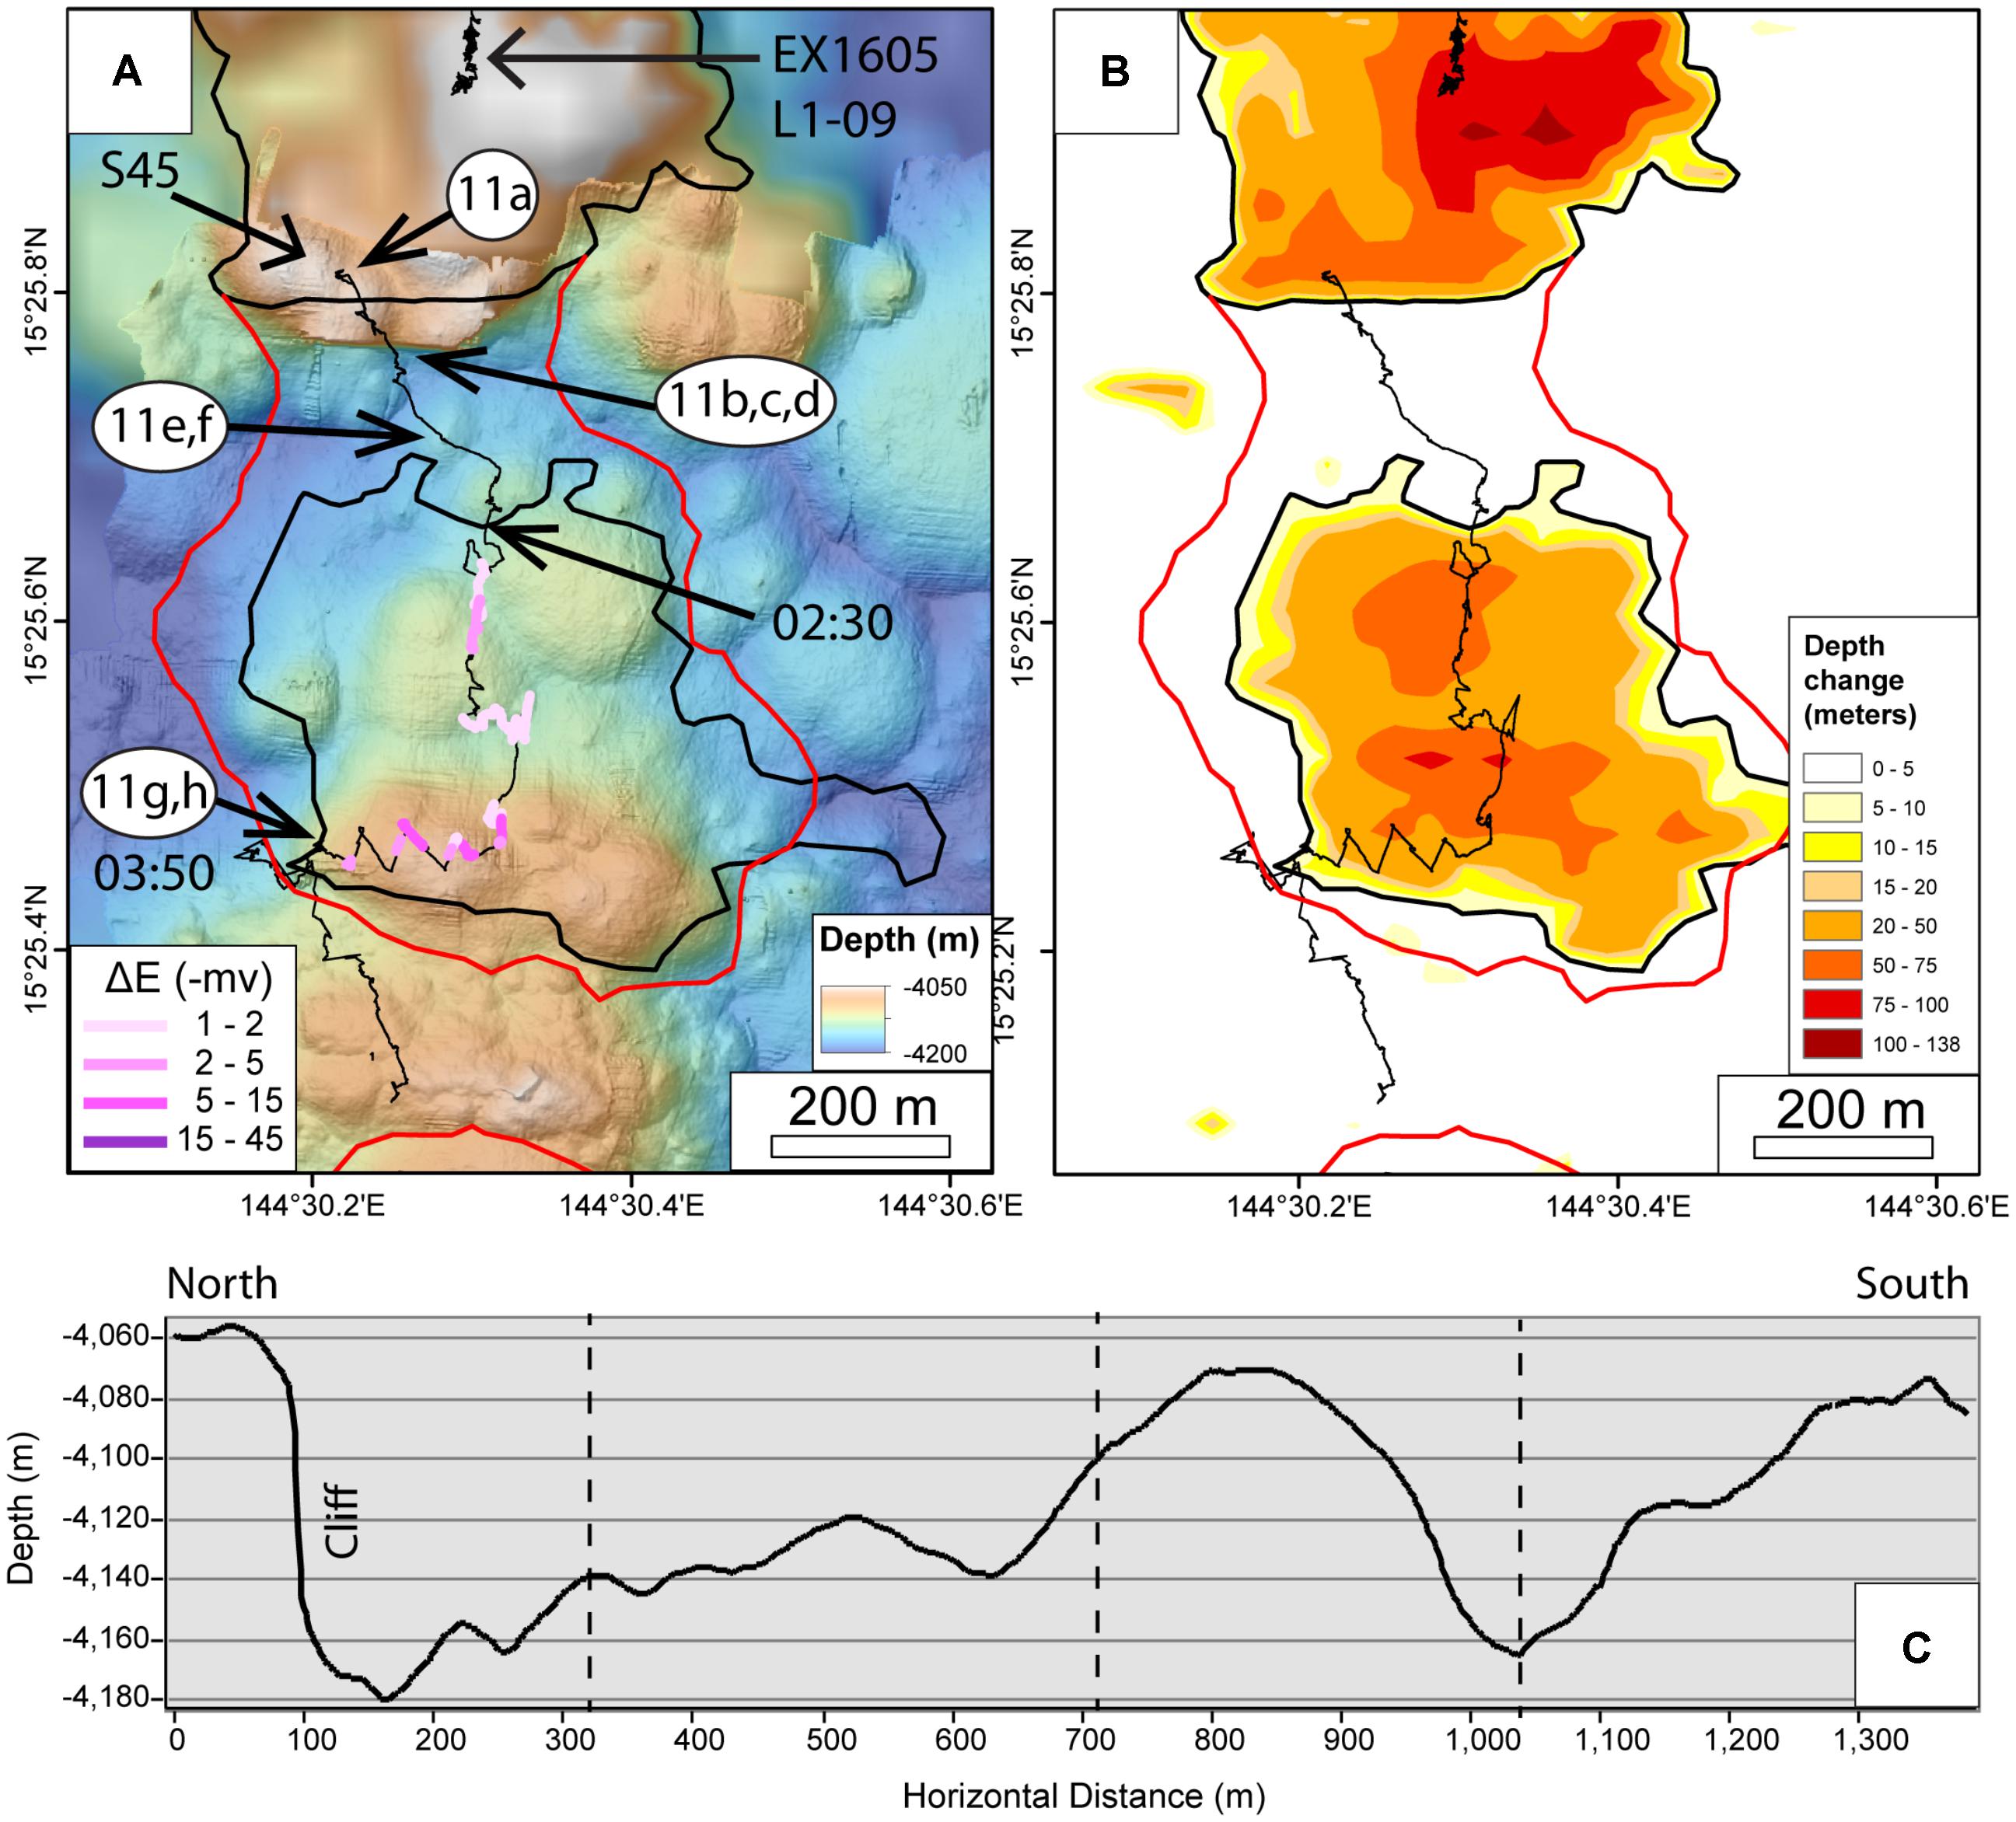
FIGURE 10. Detailed maps showing the track of ROV SuBastian dive S45 (thin black squiggly line), which crossed parts of the northern 2013–2015 lava flows. Thicker black outlines are areas of depth change from ship bathymetry; red outlines are interpreted edge of new lava, based on dive observations and AUV bathymetry. (A) Bathymetric map, mostly AUV Sentry bathymetry (1-m resolution), except at northern and western edges where it is ship bathymetry (40-m resolution). Pink to purple colored lines overlain on dive track show ΔE anomalies from MAPR instrument on ROV (see inset for scale). Labeled times (02:30 and 03:50) show beginning and end of MAPR time-series data in Figure 12. Arrows with numbers show locations of ROV images in Figure 11. The arrow pointing to the location of Figure 11b–d is the location of the nearly vertical cliff mentioned in the text. (B) Depth changes between ship-based bathymetric surveys in 2013–2015 with ROV dive track overlain. (C) Depth profile along ROV dive S45 track line, showing pillow mounds (Sentry bathymetry). Vertical dashed lines indicate major bends in the dive track.
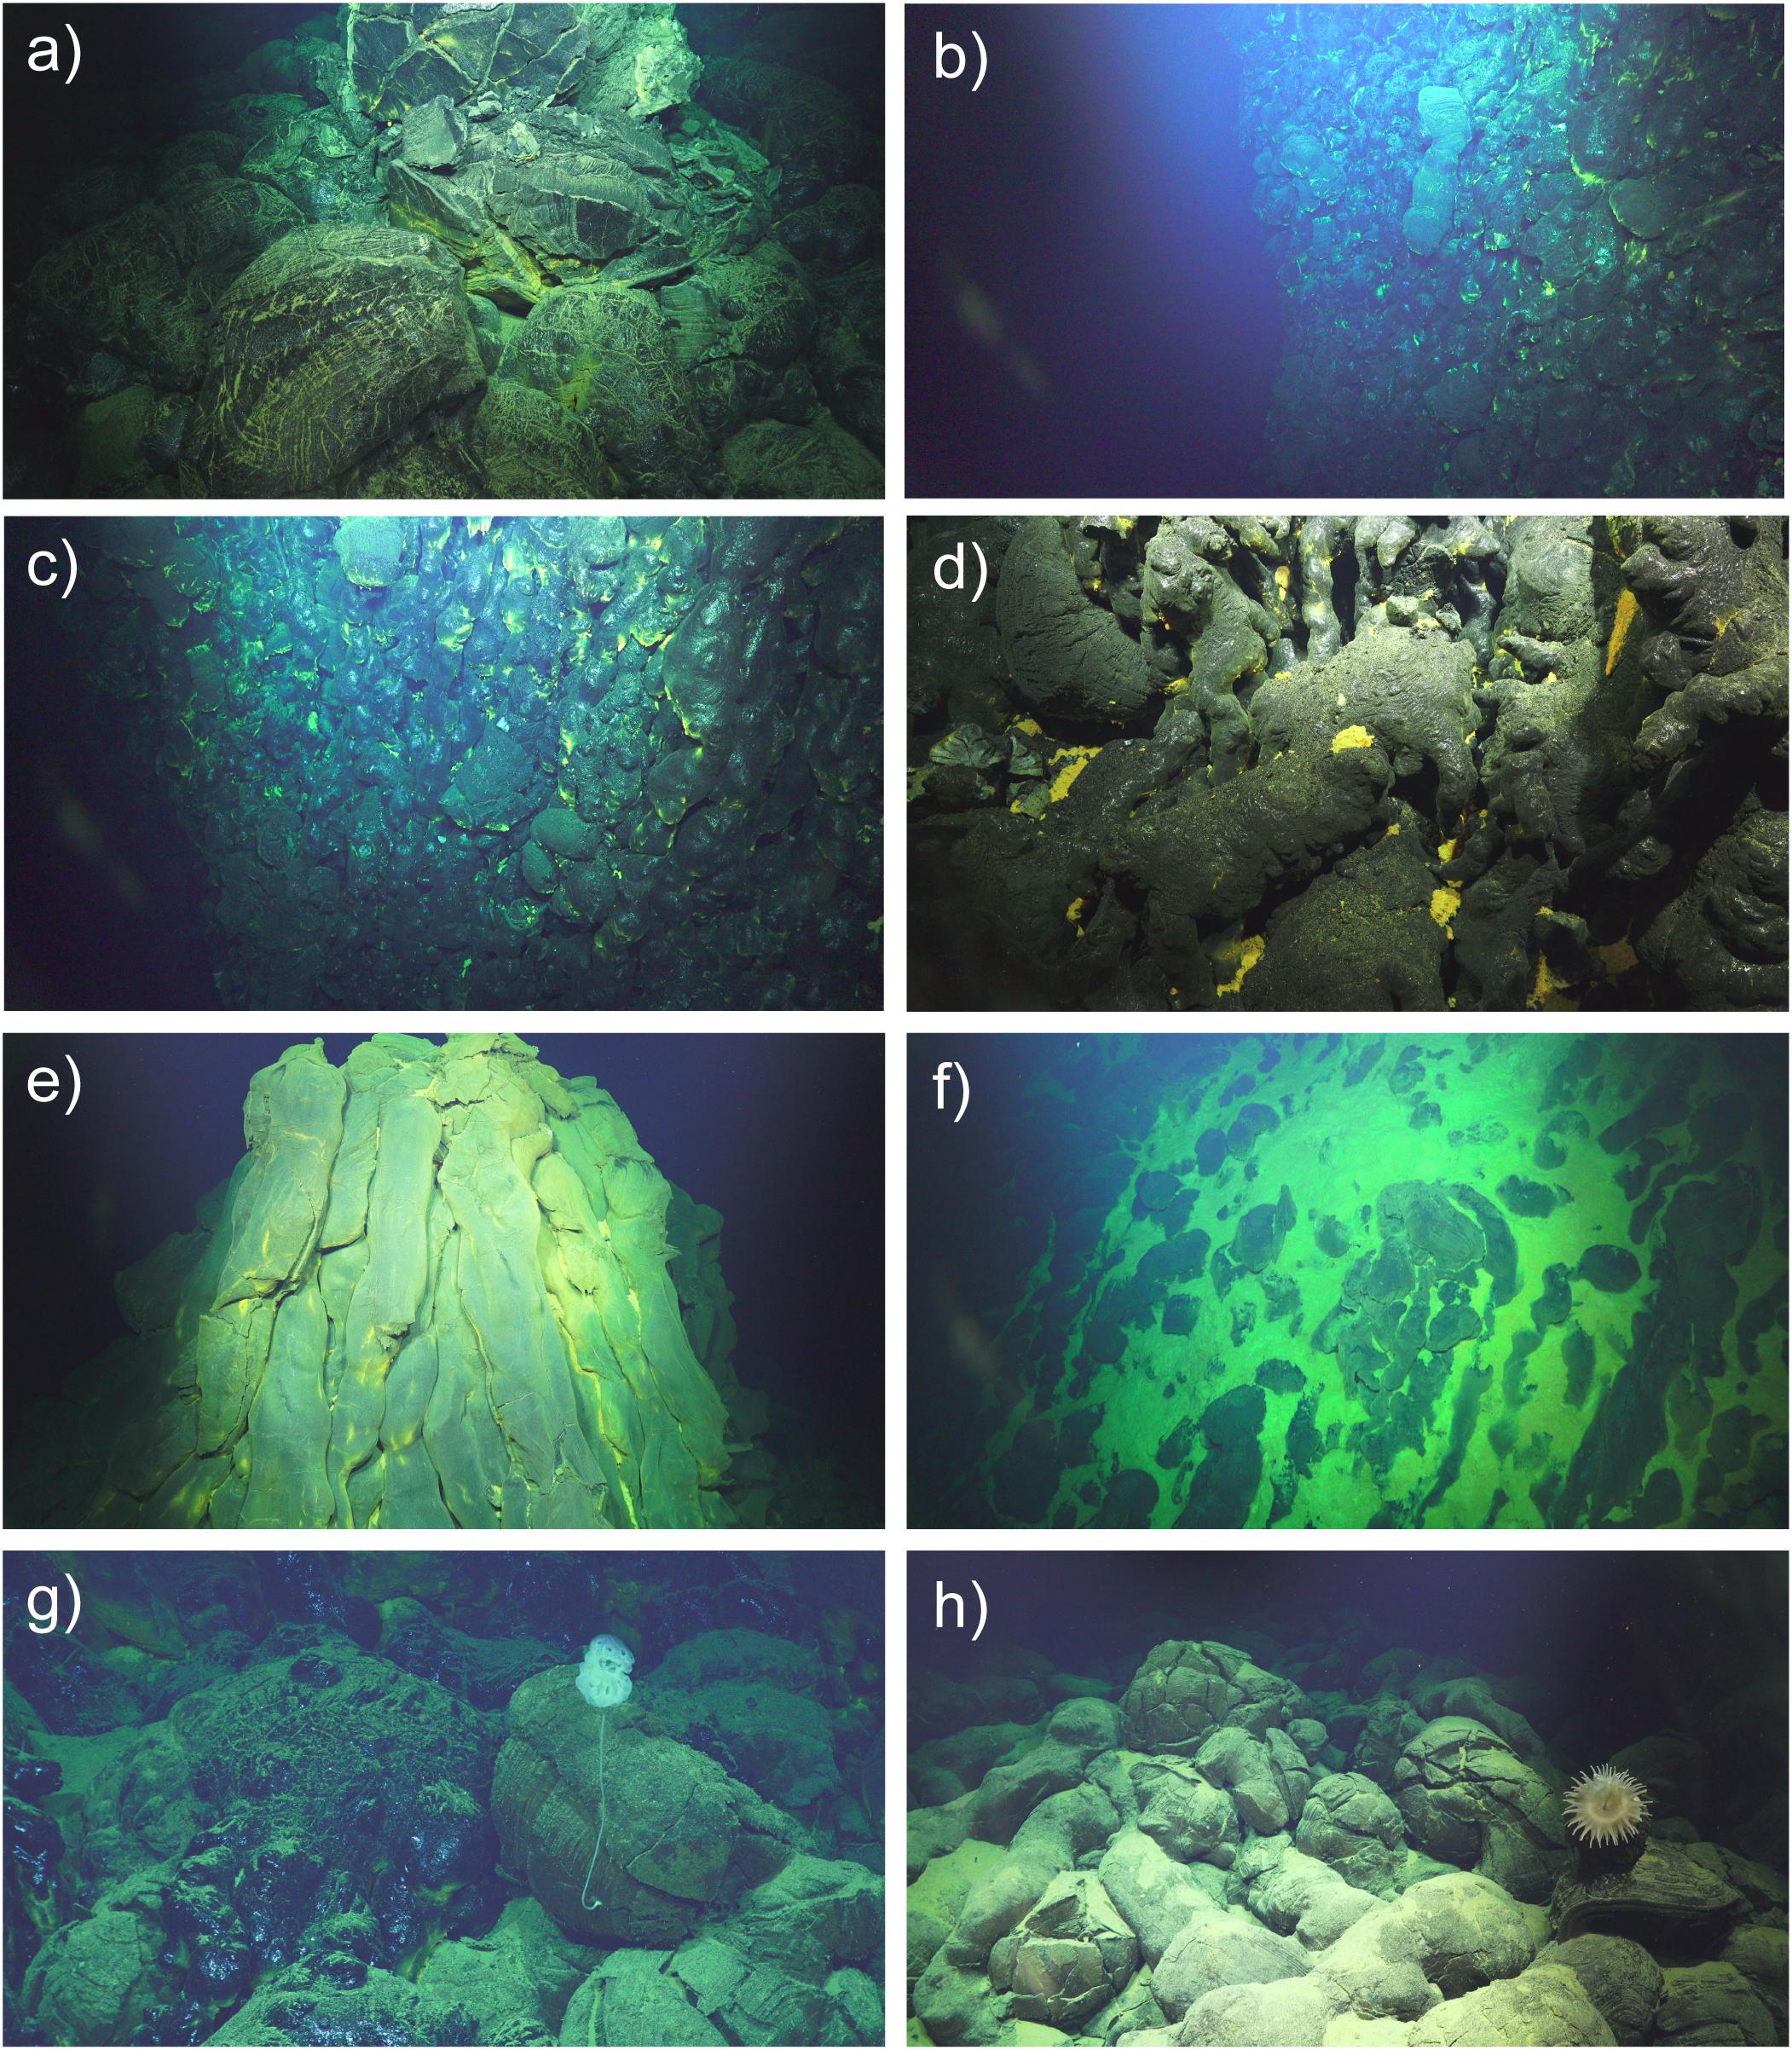
FIGURE 11. Images from ROV SuBastian dive S45 on 12 December 2016. See Figure 10 for photo locations. Numbers in parentheses are time of photo in GMT and horizontal scale. (a) Young pillow lava at the top of a mound at the beginning of the dive (01:31:24, 4 m). (b) Nearly vertical cliff mantled by intact young pillow lavas (01:47:42, 15 m). (c) Glassy narrow pillow tubes on the cliff face (01:48:26, 12 m). (d) Close up of glassy pillow buds about mid-way down the cliff face (01:57:36, 2 m). (e) Pillow cone atop a low pillow mound dusted with yellow hydrothermal sediment (02:14:58, 8 m). (f) Locally thick accumulation of hydrothermal sediment on a young pillow mound (02:21:05, 10 m). (g) Western contact of the young lavas (glassy in upper left) with surrounding older lavas (with sponge attached at lower right) (04:19:45, 5 m). (h) Surrounding older lavas with anemone attached (04:22:14, 5 m).
South of the cliff, the ROV track crossed over several low pillow mounds, each 20–25 m high and 70–100 m wide. At the top of the first one, we found another steep-sided pillow cone representing a local eruptive center, covered with a fine dusting of hydrothermal sediment (Figure 11e). The high-resolution bathymetry shows that many of the pillow mounds in this area (both young and old) have these pillow cones at the shallowest points (they appear as small dimples on the map). The dive proceeded southward to the top of the highest of the pillow mounds within the second area of multibeam depth change, which is located near the southern edge of the area of depth change, and is topped by a ridge with an E-W orientation (Figure 10). Here the ROV turned and headed west, zigzagging along the crest of the E-W pillow ridge and followed it down to the western contact between young and old lavas (Figures 11g,h). There, the young lavas were again characterized by larger pillows with many glassy pillow buds. The remainder of the dive continued south onto an older pillow ridge that separates the second and third areas of depth change (Figure 10). The older lavas had moderate sediment accumulation and were colonized by sessile animals such as sponges, anemones, and crinoids (Figures 11g,h). The dive covered 1.6 km on the bottom in 3.75 h (twice as far as the ROV D2 dive in less time), but the dive had to be terminated early due to deteriorating weather.
While traversing over the younger lavas during ROV SuBastian dive S45, we saw several areas with thick accumulations of yellow hydrothermal sediment (Figure 11f), but no visible fluid flow (shimmering water). However, we had a MAPR instrument on the ROV and the data show minor temperature and ΔE anomalies in the areas with thick hydrothermal sediment (Figure 12) especially on the E-W pillow ridge near the end of the dive, indicating that hydrothermal fluids must still have been seeping out, but so diffusely that they were not visible. Although the two ROV dives were in different (but adjacent) areas, the observations are consistent with a rapidly waning hydrothermal system as the lava flows were cooling in the aftermath of the eruption. Sentry saw robust ΔE anomalies 70 m above the lava flows in December 2015, then ROV D2 found only one area of visible venting and elevated temperature on the flows in April 2016, and finally ROV SuBastian did not encounter any visible diffuse flow, but still detected barely measurable instrumental anomalies near the seafloor. Likewise, CTD tow T15B-06 and vertical cast V15B-06 in 2015 showed the rise height of ΔE anomalies was > 400 m above bottom (Figure 3), whereas CTD cast V16A-03 in 2016 near the same location had only a weak ΔE anomaly at less than 100 m above bottom. In terms of biological colonization, on ROV SuBastian dive S45 we saw some of the same vent-endemic animals as on the previous ROV D2 dive (polychaetes, shrimp, and squat lobsters), but in much fewer numbers, also consistent with a rapidly waning hydrothermal system. All these observations suggest that the eruption occurred relatively late in the 2013–2015 time window constrained by the multibeam sonar surveys. They also imply that the hydrothermal activity from the lava flows was likely temporary and short-lived, consistent with observations of the hydrothermal response after multiple eruptions at Axial Seamount (Chadwick et al., 2013; Baker et al., 2018).
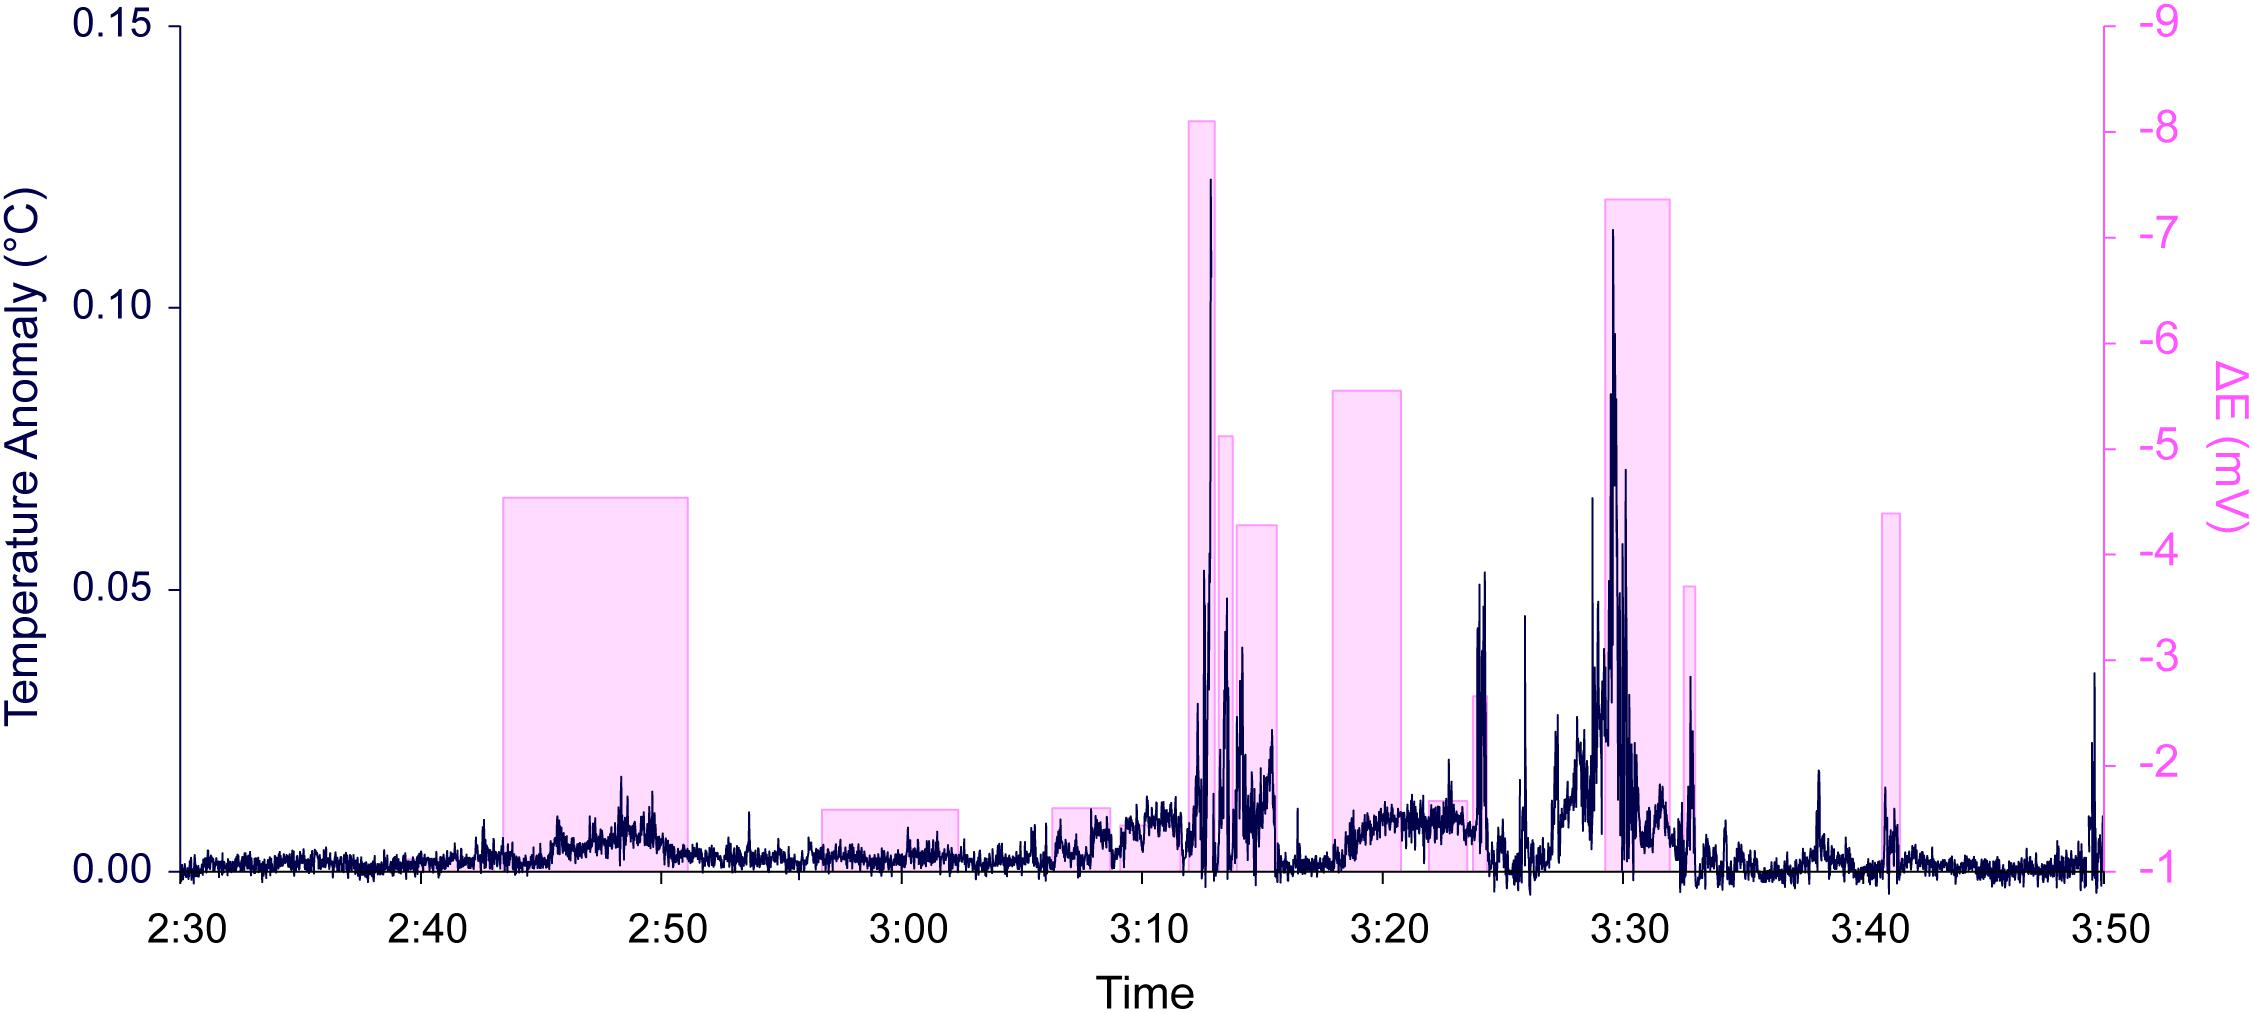
FIGURE 12. Time-series data from MAPR instrument on ROV SuBastian dive S45 showing that temperature and ΔE anomalies (black line and pink bars, respectively) are well-correlated, providing evidence of weak hydrothermal activity associated with the new lava flow. The largest anomalies are where the ROV crossed over the thickest parts of the pillow mound within the second area of depth change (see Figure 10). This was the same time interval when thick accumulations of hydrothermal sediments were observed (Figure 11f) along with occasional sightings of vent fauna.
Discussion
This study was a fortuitous outgrowth of a large-scale exploration of the spreading axis of the southern Mariana back-arc for new hydrothermal vent sites between 13 and 18.2°N, an area that had not been systematically surveyed previously. The discovery of the new vent sites (Baker et al., 2017) and characterization of their chemistry and biological communities (Tunnicliffe et al., 2017; Butterfield et al., 2018) will fill a knowledge gap to help interpret the biogeography of the region and the connections between geology, chemistry, and chemosynthetic ecosystems (Chadwick et al., 2018). Understanding such links will have important implications for management plans of the Mariana Trench Marine National Monument.
Judging from the relatively low spreading rate of the central Mariana back-arc segments [∼25–40 mm/yr (Kato et al., 2003)], individual eruptions would be expected to be relatively rare (perhaps only every 100 years or more). On the other hand, Baker et al. (2017) point out that back-arc basins can have both enhanced incidence of hydrothermal venting and an enhanced magma supply where they are close to adjacent magmatic arcs, although this back-arc segment is not particularly close to the Mariana arc. In any case, it was surprising to discover fresh new lava flows on the 15.5°N segment of the Mariana back-arc. There have been relatively few deep-sea (>500 m depth) eruptions documented worldwide (<40), due to the difficulty in detecting them far away from land-based sensor networks (Dziak et al., 2012; Rubin et al., 2012), despite the fact that ∼75% of Earth’s volcanic output is in the oceans (Crisp, 1984). That makes finding and characterizing recent deep-sea eruptions rare, valuable, and informative. The investigation of these historical eruption sites provides information on the frequency of eruptions, their volumes, and their chemical and biological impacts in the deep-sea. They also give us a glimpse of the fundamental process of seafloor spreading and ocean crust formation.
It is known from laboratory analog experiments that pillow lavas form at relatively low extrusion rates whereas sheet flows form at higher extrusion rates (Griffiths and Fink, 1992; Gregg and Fink, 1995). More recent studies have interpreted larger constructional volcanic features in terms of extrusion rate. For example, studies at the hotspot-influenced Axial Seamount on the Juan de Fuca ridge in the NE Pacific have used 1-m resolution AUV bathymetry and ROV observations to document a range of morphologies on lava flows erupted in 1998, 2011, and 2015 (Caress et al., 2012; Chadwick et al., 2013, 2016; Clague et al., 2017). Chadwick et al. (2013) introduced the concept of map-scale lava flow morphology to describe features that are on the scale of hundreds of meters, which are discernable in high-resolution AUV bathymetry. They proposed three types: inflated lobate flows, inflated pillow flows, and pillow mounds, mainly distinguished by the extent of a molten lava core within the interior of each flow type during emplacement. “Pillow mounds” were interpreted to be map-scale constructions without a significant molten core. Clague et al. (2017) modified this terminology and used the terms “channelized flows” and “hummocky flows” instead. The “channelized flows” of Clague et al. (2017) include the “inflated lobate flows” and “inflated pillow flows” of Chadwick et al. (2013), and are interpreted as near-vent and distal facies, respectively, of the same flow type. The “hummocky flows” of Clague et al. (2017) are pillow lavas that form mounds, coalesced mounds, or ridges. The main difference to the “pillow mounds” of Chadwick et al. (2013) is that “hummocky flows” also have small to voluminous molten cores, evident from summit collapses, levee-bounded lava ponds, surface tumuli, and off-fissure hummocky flows fed through tubes.
In this paper, we have used the terms “pillow mounds” and “hummocky flows” interchangeably, and we agree with Clague et al. (2017)’s interpretation that these flow types are commonly emplaced with molten cores in their interiors. However, although the “hummocky flows” erupted at Axial Seamount often show more obvious morphologic evidence of a molten interior, the 2013–2015 flows on the Mariana back-arc do not. While there were clearly multiple eruption centers distributed along their lengths and widths, based on the multiple pillow-cones encountered during the ROV dives and that are evident in the Sentry bathymetry, there are no areas of lava drain-out and collapse or the other features described above. This, and the prevalence of locally steep constructional pillow-lava slopes in some places suggest that the Mariana back-arc hummocky flows were emplaced relatively rapidly, perhaps within a time window of only a few days. This interpretation is based on the observation that the thickest hummocky flows emplaced during the 2015 eruption at Axial Seamount, which had levee-bounded lava ponds at their summits as mapped by Clague et al. (2017), were emplaced over a time period of nearly a month, based on the duration of summit deflation (Nooner and Chadwick, 2016) and the explosion-like sounds recorded by a local network of seismometers and hydrophones (Wilcock et al., 2016; Caplan-Auerbach et al., 2017). The Mariana back-arc flows are more consistent with the observations of “lava domes” or pillow mounds on the axis of the southern East Pacific Rise by White et al. (2000) who interpreted that they formed directly over eruptive fissures over time periods of days. The discontinuous distribution of the hummocky flows along-axis on the Mariana back-arc may be evidence of pre-eruption focusing of magma within a mildly overpressurized feeder dike as it rose to the surface, similar to the discontinuous pillow mounds documented by Yeo et al. (2013) on the Juan de Fuca and Gorda ridges.
This eruption in the central Mariana back-arc produced a series of hummocky pillow lava mounds along the spreading axis that were comparable in size and morphology to other recent eruption sites at back-arc and mid-ocean ridge spreading centers, as well as the older lavas at this site. In fact, despite being the deepest historical eruption documented thus far on Earth (>4000 m bsl), the morphology of the pillow lavas is otherwise indistinguishable from other historical eruption sites, so the greater depth and ambient pressure had no apparent effect on the processes of extrusion, flow, volcanic construction, and solidification. However, it was unusual in that it was one of the first discovered in an active back-arc setting. It was also one of the largest historical seafloor eruptions in terms of volume, 66.3 × 10⁶ m3 based on before-and-after bathymetric surveys, but that may also reflect the small number of documented submarine eruptions to date. Smaller eruptions are probably more frequent, and if so larger less frequent events will only become apparent over time (Perfit and Chadwick, 1998). Perhaps most significantly, this eruption, and the discovery of the Perseverance high-temperature vent field 5 km to the north, indicate that there is probably magma currently stored under the axial high of this segment of the Mariana back-arc, and that other eruptions on this segment may be possible in the not-too-distant future.
Conclusions
(1) A very recent volcanic eruption was discovered on the central Mariana back-arc spreading center between latitude 15°22.3′ to 15°26.3′N, and between depths of 4050–4450 m bsl. This is the first known historical eruption on the Mariana back-arc, and the deepest one documented anywhere on Earth.
(2) The date of the eruption is constrained between February 2013 and December 2015 by before-and-after bathymetric surveys, and the rapid decline in hydrothermal venting observed in 2015–2016 suggests it occurred only months before its discovery.
(3) The eruption produced a discontinuous chain of hummocky pillow lava mounds along a distance of 7.3 km that are 200–800 m wide and up to 40–138 m thick. The lack of collapse features or evidence of lava drain-out suggests they were emplaced relatively rapidly, perhaps in less than a week.
(4) The volume of lava erupted was at least 66.3 × 10⁶ m3, making this one of the largest historical submarine eruptions documented so far.
(5) The high ambient pressure at >4000 m bsl had no apparent effect on the eruptive processes that controlled the morphology of the lava flows, since they appear similar to those at other shallower eruption sites.
(6) This eruption shows there is magma currently stored beneath the 15.5°N segment of the Mariana back-arc spreading center that is likely providing heat to the newly discovered Perseverance vent field (5 km to the north), and could be mobilized to feed additional eruptions.
Data Availability Statement
The data presented in this study are available at the NOAA Centers for Environmental Information (ship bathymetry), the Rolling Deck to Repository (CTD data), the IEDA Marine Geoscience Data System (Sentry AUV and SuBastian ROV data), and ROV video is available on the Schmidt Ocean Institute YouTube channel.
Author Contributions
WC wrote the manuscript and made most of the figures, was co-Chief scientist on the FK151121 and FK161129 expeditions, and directed the ROV dives described here. SM processed and analyzed ship-based and AUV-based multibeam sonar bathymetric data. EB and SW collected and processed the CTD and MAPR data. JR and DB were Chief Scientists on the FK151121 and FK161129 expeditions respectively. MA mapped the young lava flow contact from the Sentry photo survey. TB analyzed CTD water samples for methane and hydrogen on FK151121. AB assisted with GIS data management, volume calculations, and figure preparation.
Funding
We gratefully acknowledge the funding of the NOAA Ocean Exploration and Research (OER) Program and NOAA’s Pacific Marine Environmental Laboratory (PMEL) for support of the science at sea and on shore. This research was supported by the PMEL Earth-Ocean Interactions Program, the Cooperative Institute for Marine Resources Studies (CIMRS), and the Joint Institute for the Study of the Atmosphere and Ocean (JISAO) under NOAA Cooperative Agreements NA11OAR4320091 and NA15OAR4320063. JISAO contribution number 2018-0157 and PMEL contribution number 4806.
Conflict of Interest Statement
The authors declare that the research was conducted in the absence of any commercial or financial relationships that could be construed as a potential conflict of interest.
Acknowledgements
We thank Patrick Shore and Doug A. Wiens of Washington University in St. Louis for collecting the 2013 multibeam sonar bathymetry during R/V Melville expedition MV1302a. We also thank the Schmidt Ocean Institute for supporting expeditions FK151121 and FK161129 on R/V Falkor, as well as the ship’s crews and the teams that operated AUV Sentry and ROV SuBastian, especially expedition leaders Karl Kaiser (Sentry) and Jason Williams (SuBastian). In addition, we also thank NOAA OER for supporting the Okeanos Explorer operations in the Mariana region in 2016, including the ship’s crew, science leads at sea, Deborah Glickson and Diva Amon, and the ROV Deep Discoverer team. The manuscript was improved by the helpful comments from reviewers JL and JW.
Footnotes
- ^ Matt Haney, USGS, personal communication, 2015.
References
Anderson, M. O., Chadwick, W. W. Jr., Hannington, M. D., Merle, S. G., and Resing, J. A. (2017). Geological interpretation of volcanism and segmentation of the Mariana back-arc spreading center between 12.7°N and 18.3°N. Geochem. Geophys. Geosyst. 18, 2240–2274. doi: 10.1002/2017GC006813
Baker, E. T., Chadwick, W. W. Jr., Cowen, J. P., Dziak, R. P., and Rubin, K. H. (2012). Hydrothermal discharge during submarine eruptions: the importance of detection, response, and new technology. Oceanography 25, 128–141. doi: 10.5670/oceanog.2012.11
Baker, E. T., Embley, R. W., Walker, S. L., Resing, J. A., Lupton, J. E., Nakamura, K., et al. (2008). Hydrothermal activity and volcano distributions along the Mariana Arc. J. Geophys. Res. 113:B08S09. doi: 10.1029/2007JB005423
Baker, E. T., Lupton, J. E., Resing, J. A., Baumberger, T., Lilley, M., Walker, S. L., et al. (2011). Unique event plumes from a 2008 eruption on the Northeast Lau spreading center. Geochem. Geophys. Geosyst. 12:Q0AF02. doi: 10.1029/2011GC003725
Baker, E. T., Walker, S. L., Chadwick, W. W. Jr., Butterfield, D. A., Buck, N. J., et al. (2018). Post-eruption enhancement of hydrothermal activity: a 33-year, multi-eruption time-series at Axial Seamount (Juan de Fuca Ridge). Geochem. Geophys. Geosyst. 19. doi: 10.1002/2018GC007802
Baker, E. T., Walker, S. L., Resing, J. A., Chadwick, W. W. Jr., and Merle, S. G. (2017). The effect of arc proximity on hydrothermal activity along spreading centers: new evidence from the Mariana back-arc (12.7°–18.3°N). Geochem. Geophys. Geosyst. 18, 4211–4228. doi: 10.1002/2017GC007234
Ballard, R. D., and Moore, J. G. (1977). Photographic Atlas of the Mid-Atlantic Ridge Rift Valley. New York, NY: Springer-Verlag. doi: 10.1007/978-1-4612-9920-2
Baumberger, T., Lilley, M. D., Resing, J. A., Lupton, J. E., Baker, E. T., Butterfield, D. A., et al. (2014). Understanding a submarine eruption through time series hydrothermal plume sampling of dissolved and particulate constituents: West Mata, 2008–2012. Geochem. Geophys. Geosyst. 15, 4631–4650. doi: 10.1002/2014GC005460
Butterfield, D. A., Chadwick, W. W. Jr., Larson, B., Tunnicliffe, V., Bates, A. E., et al. (2018). 2016 exploration shows contrasting fluid chemistry and hydrothermal vent communities between the Mariana arc and back-Arc. Paper Presented at 2018 Ocean Sciences Meeting, Portland, OR.
Caplan-Auerbach, J., Dziak, R. P., Haxel, J., Bohnenstiehl, D. R., and Garcia, C. (2017). Explosive processes during the 2015 eruption of Axial Seamount, as recorded by seafloor hydrophones. Geochem. Geophys. Geosyst. 18, 1761–1774. doi: 10.1002/2016GC006734
Caress, D. W., and Chayes, D. N. (2016). MB-System: Mapping the Seafloor. Open Source Software Distributed From the MBARI and L-DEO Web Sites. Available at: http://www.mbari.org/data/mbsystem/
Caress, D. W., Clague, D. A., Paduan, J. B., Martin, J., Dreyer, B., Chadwick, W. W., et al. (2012). Repeat bathymetric surveys at 1-metre resolution of lava flows erupted at Axial Seamount in April 2011. Nat. Geosci. 5, 483–488. doi: 10.1038/NGEO1496
Carey, R., Soule, S. A., Manga, M., White, J., McPhie, J., Wysoczanski, R., et al. (2018). The largest deep-ocean silicic volcanic eruption of the past century. Sci. Adv. 4:e1701121. doi: 10.1126/sciadv.1701121
Chadwick, W. W. Jr., Cashman, K. V., Embley, R. W., Matsumoto, H., and Dziak, R. P. (2008). Direct video and hydrophone observations of submarine explosive eruptions at NW Rota-1 Volcano, Mariana Arc. J. Geophys. Res. 113:B08S10. doi: 10.1029/2007JB005215
Chadwick, W. W. Jr., Clague, D. A., Embley, R. W., Perfit, M. R., and Butterfield, D. A. (2013). The 1998 eruption of Axial Seamount: new Insights on submarine lava flow emplacement from high-resolution mapping. Geochem. Geophys. Geosyst. 14, 3939–3968. doi: 10.1002/ggge20202
Chadwick, W. W. Jr., Embley, R. W., and Shank, T. M. (1998). The 1996 Gorda Ridge eruption: geologic mapping, sidescan sonar, and SeaBeam comparison results. Deep Sea Res. II 45, 2547–2570. doi: 10.1016/S0967-0645(98)00083-6
Chadwick, W. W. Jr., Paduan, B. P., Clague, D. A., Dreyer, B. M., and Merle, S. G. (2016). Voluminous eruption from a zoned magma body after an increase in supply rate at Axial Seamount. Geophys. Res. Lett. 43, 12063–12070. doi: 10.1002/2016GL071327
Chadwick, W. W. Jr., Tunnicliffe, V., Butterfield, D. A., Bates, A. E., Huber, J., Trembath-Reichert, E., et al. (2018). Newly discovered hydrothermal vent sites along the mariana back-arc spreading center support hypothesis of geological and chemical control on chemosynthetic ecosystems. Paper Presented at 2018 Ocean Sciences Meeting, Portland, OR.
Clague, D. A., Paduan, J. B., Caress, D. W., Chadwick, W. W. Jr., and Saout, M. L. (2017). High-resolution AUV mapping and targeted ROV observations of three historical lava flows at Axial Seamount. Oceanography 30, 82–99. doi: 10.5670/oceanog.2017.426
Cowen, J. P., Baker, E. T., and Embley, R. W. (2004). “Detection of and response to mid-ocean ridge magmatic events: implications for the subsurface biosphere,” in The Subseafloor Biosphere at Mid-Ocean Ridges, eds W. S. D. Wilcock, E. F. Delong, D. S. Kelley, J. A. Baross, and S. C. Cary (Washington, DC: American Geophysical Union), 227–243. doi: 10.1029/144GM15
Crisp, J. A. (1984). Rates of magma emplacement and volcanic output. J. Volcanol. Geotherm. Res. 20, 177–211. doi: 10.1016/0377-0273(84)90039-8
Dziak, R. P., Bohnenstiehl, D. R., and Smith, D. K. (2012). Hydroacoustic monitoring of oceanic spreading centers: past, present, and future. Oceanography 25, 116–127. doi: 10.5670/oceanog.2012.10
Dziak, R. P., Hammond, S. R., and Fox, C. G. (2011). A 20-year hydroacoustic time series of seismic and volcanic events in the Northeast Pacific Ocean. Oceanography 24, 280–293. doi: 10.5670/oceanog.2011.79
Embley, R. W., Baker, E. T., Butterfield, D. A., Chadwick, W. W. Jr., and Lupton, J. E. (2007). Exploring the submarine ring of fire: Mariana Arc - Western Pacific. Oceanography 20, 69–80. doi: 10.5670/oceanog.2007.07
Embley, R. W., Merle, S. G., Baker, E. T., Rubin, K. H., Lupton, J. E., Resing, J. A., et al. (2014). Eruptive modes and hiatus of volcanism at West Mata seamount, NE Lau Basin: 1996-2012. Geochem. Geophys. Geosyst. 15, 4093–4115. doi: 10.1002/2014GC005387
Fryer, P. (1995). “Geology of the Mariana trough,” in Backarc Basins: Tectonics and Magmatism, ed. B. Taylor (New York, NY: Plenum), 237–279.
Gregg, T. K. P., and Fink, J. H. (1995). Quantification of submarine lava-flow morphology through analog experiments. Geology 23, 73–76. doi: 10.1130/0091-7613(1995)023<0073:QOSLFM>2.3.CO;2
Griffiths, R. W., and Fink, J. H. (1992). Solidification and morphology of submarine lavas: a dependence on extrusion rate. J. Geophys. Res. 97, 19729–19737. doi: 10.1029/92JB01594
Kato, T., Beavan, J., Matsushima, T., Kotake, Y., Camacho, J. T., and Nakao, S. (2003). Geodetic evidence of back-arc spreading in the Mariana trough. Geophys. Res. Lett. 30:1625. doi: 10.1029/2002GL016757
Kelley, D. S., Delaney, J. R., and Juniper, S. K. (2014). Establishing a new era of submarine volcanic observatories: cabling Axial seamount and the endeavour segment of the Juan de Fuca Ridge. Mar. Geol. 352, 426–450. doi: 10.1016/j.margeo.2014.03.010
Lilley, M. D., Butterfield, D. A., Lupton, J. E., and Olson, E. J. (2003). Magmatic events can produce rapid changes in hydrothermal vent chemistry. Nature 422, 878–881. doi: 10.1038/nature01569
McLaughlin-West, E. A., Olsen, E. J., Lilley, M. D., Resing, J. A., Lupton, J. E., Baker, E. T., et al. (1999). Variations in hydrothermal methane and hydrogen following the 1998 eruption at Axial Volcano. Geophys. Res. Lett. 26, 3453–3456. doi: 10.1029/1999GL002336
Nooner, S. L., and Chadwick, W. W. Jr. (2016). Inflation-predictable behavior and co-eruption deformation at Axial Seamount. Science 354, 1399–1403. doi: 10.1126/science.aah4666
Perfit, M. R., and Chadwick, W. W. Jr. (1998). “Magmatism at mid-ocean ridges: constraints from volcanological and geochemical investigations,” in Faulting and Magmatism at Mid-Ocean Ridges, eds W. R. Buck, P. T. Delaney, J. A. Karson, and Y. Lagabrielle (Washington, DC: American Geophysical Union), 59–116.
Resing, J. A. (2016a). Processed Gridded Near-Bottom AUV Sentry Bathymetric Sonar Data from the Izu-Bonin-Mariana Volcanic Arc Acquired During the Falkor Expedition FK151121 (2015). Palisades, NY: Integrated Earth Data Applications (IEDA).
Resing, J. A. (2016b). Processed Ship-Based Swath Bathymetry and Acoustic Backscatter Sonar Data (EM302) from the Izu-Bonin-Mariana Volcanic Arc Acquired During the Falkor Expedition FK151121 (2015). Palisades, NY: Integrated Earth Data Applications (IEDA).
Resing, J. A., Baker, E. T., Lupton, J. E., Walker, S. L., Butterfield, D. A., Massoth, G. J., et al. (2009). Chemistry of hydrothermal plumes above submarine volcanoes of the Mariana Arc. Geochem. Geophys. Geosyst. 10:Q02009. doi: 10.01029/02008GC002141
Resing, J. A., Rubin, K. H., Embley, R. W., Lupton, J. E., Baker, E. T., Dziak, R. P., et al. (2011). Active submarine eruption of boninite in the northeast Lau Basin. Nat. Geosci. 4, 799–806. doi: 10.1038/NGEO1275
Rubin, K. H., Embley, R. W., Chadwick, W. W. Jr., Resing, J. A., Butterfield, D. A., Shank, T. M., et al. (2018a). Submarine volcanoes, ecosystems and landscape evolution in the NE Lau Basin. Paper Presented at 2018 Ocean Sciences Meeting, Portland, OR.
Rubin, K. H., Embley, R. W., Hellebrand, E., and Chadwick, W. W. Jr. (2018b). Weird magmas all over the place: young boninite-dacite-basalt occurrences in the NE Lau Basin. Paper Presented at 2018 Goldschmidt Conference, Boston, MA.
Rubin, K. H., Soule, S. A., Chadwick, W. W. Jr., Fornari, D. J., and Clague, D. A. (2012). Volcanic eruptions in the deep sea. Oceanography 25, 142–157. doi: 10.5670/oceanog.2012.12
Schnur, S. R., Chadwick, W. W. Jr., Embley, R. W., Ferrini, V. L., and De Ronde, C. E. J. (2017). A decade of volcanic construction and destruction at the summit of NW Rota-1 seamount: 2004–2014. J. Geophys. Res. 122, 1558–1584. doi: 10.1002/2016JB013742
Stern, R. J., Fouch, M. J., and Klemperer, S. L. (2003). “An overview of the Izu-Bonin-Mariana subduction factory,” in Inside the Subduction Factory, ed. J. Eiler (Washington, DC: American Geophysical Union), 175–222.
Tunnicliffe, V., Bates, A. E., Butterfield, D. A., and Larson, B. I. (2017). Diversity of the Mariana beogeographic region with a closer look at Alviniconcha hessleri, the original “hairy snail. Paper Presented at the 6th International Symposium on Chemosynthesis-Based Ecosystems (CBE6), Woods Hole, MA.
Walker, S. L., Baker, E. T., Resing, J. A., Chadwick, W. W. Jr., Merle, S. G., et al. (2016a). High resolution mapping of hydrothermal plumes in the Mariana back-arc relate seafloor sources to above-bottom plumes. Paper Presented at 2016 Fall Meeting, AGU, San Francisco, CA.
Walker, S. L., Baker, E. T., Resing, J. A., Chadwick, W. W. Jr., Merle, S. G., et al. (2016b). Raw Near-Bottom MAPR Data from the Izu-Bonin-Mariana Volcanic Arc Acquired by AUV Sentry During the Falkor Expedition FK151121 (2015). Palisades, NY: Integrated Earth Data Applications (IEDA).
Walker, S. L., Baker, E. T., Resing, J. A., Nakamura, K., and McLain, P. D. (2007). “A new tool for detecting hydrothermal plumes: an ORP sensor for the PMEL MAPR,” in Proceedings of the American Geophysical Union, Fall Meeting 2007, San Francisco, CA.
White, S. M., Macdonald, K. C., and Haymon, R. M. (2000). Basaltic lava domes, lava lakes, and volcanic segmentation on the southern East Pacific Rise. J. Geophys. Res. 103B, 25519–25536. doi: 10.1029/2000JB900248
Wilcock, W. S. D., Tolstoy, M., Waldhauser, F., Garcia, C., Tan, Y. J., Bohnenstiehl, D. R., et al. (2016). Seismic constraints on caldera dynamics from the 2015 Axial Seamount eruption. Science 354, 1395–1399. doi: 10.1126/science.aah5563
Yeo, I., Searle, R. C., Achenbach, K. L., Le Bas, T. P., and Murton, B. J. (2012). Eruptive hummocks: building blocks of the upper ocean crust. Geology 40, 91–94. doi: 10.1130/G31892.1
Keywords: submarine eruption, mariana back-arc spreading center, mariana trough, high-resolution mapping, submarine lava flow morphology
Citation: Chadwick WW Jr, Merle SG, Baker ET, Walker SL, Resing JA, Butterfield DA, Anderson MO, Baumberger T and Bobbitt AM (2018) A Recent Volcanic Eruption Discovered on the Central Mariana Back-Arc Spreading Center. Front. Earth Sci. 6:172. doi: 10.3389/feart.2018.00172
Received: 29 June 2018; Accepted: 02 October 2018;
Published: 23 October 2018.
Edited by:
Nancy Riggs, Northern Arizona University, United StatesReviewed by:
James D. L. White, University of Otago, New ZealandJan Marie Lindsay, University of Auckland, New Zealand
Copyright © 2018 Chadwick, Merle, Baker, Walker, Resing, Butterfield, Anderson, Baumberger and Bobbitt. This is an open-access article distributed under the terms of the Creative Commons Attribution License (CC BY). The use, distribution or reproduction in other forums is permitted, provided the original author(s) and the copyright owner(s) are credited and that the original publication in this journal is cited, in accordance with accepted academic practice. No use, distribution or reproduction is permitted which does not comply with these terms.
*Correspondence: William W. Chadwick Jr., d2lsbGlhbS53LmNoYWR3aWNrQG5vYWEuZ292
†Present address: Melissa O. Anderson, Department of Earth Sciences, University of Toronto, Toronto, ON, Canada
 William W. Chadwick Jr.
 Susan G. Merle
 Edward T. Baker
 Sharon L. Walker
 Joseph A. Resing3
 David A. Butterfield
 Melissa O. Anderson
 Tamara Baumberger
 Andra M. Bobbitt