 Sytle M. Antao
 James W. Nicholls
- Department of Geoscience, University of Calgary, Calgary, AB, Canada
Natural nepheline (Nph) samples are intermediate members of solid solutions that extend from the pure Na end-member Na[AlSiO4] to the pure K end-member K[AlSiO4] (=kalsilite, Kls). We examined two volcanic nepheline (ideally, K2Na6[Al8Si8O32] or Nph0.75Kls0.25) samples from Oldoinyo Lengai, Tanzania (samples 1 and 2) and a third sample 3 from Mount Nyiragongo, Eastern Congo. The crystal structure of these three samples was obtained using synchrotron high-resolution powder X-ray diffraction (HRPXRD) data and Rietveld structure refinements in space group P63. Satellite reflections were not observed in these samples. The EPMA composition of sample 1 is {K1.50Na0.19Ca0.07☐0.23}Σ2(Na)6[Si8.35Al7.48Fe0.18]Σ16.00O32. The A site contains 0.23 vacancies (☐) with some Na and Ca atoms, whereas the B site is completely filled with only Na atoms. From the EPMA formula, K(sof) = 0.844 and Na(sof) = 1.0. The refinement unit-cell parameters are a = 10.00247(1), c = 8.38396(1) Å, V = 726.431(1) Å3; K(sof) = 0.779(2) and Na(sof) = 0.988(2). The composition of sample 2 is {K1.67☐0.33}Σ2(Na5.76K0.174Ca0.06)Σ6[Si8.44Al7.37Fe0.20]Σ16.01O32, so K(sof) = 0.835 and Na(sof) = 1.030. Sample 2 has a = 10.01769(2), c = 8.39586(2) Å, V = 729.678(1) Å3, K(sof) = 0.812(2), and Na(sof) = 0.995(2). Sample 3 is a three-phase (3a, 3b, 3c) intergrowth with an average formula of {K1.77☐0.23}2(Na4.30K1.51Ca0.19)Σ6[Si8.13Al7.76Fe0.11]Σ16.00O32, K(sof) = 0.887, and Na(sof) = 1.208. A large amount of K and Ca atoms occur in the B site. Based on the weight percentages and sofs of the three phases, the Rietveld refinement gives an average K(sof) = 0.859 and Na(sof) = 1.145. The average <T-O> distances indicate a high degree of Al-Si disorder in samples 1, 2, and phase 3b. These African samples extend natural nepheline solid solutions to about Nph0.55Kls0.45. The average <Na-O> distance increases linearly with Na(sof) and V across nepheline solid solutions because K atoms enter the Na site. K-rich nepheline seems to always contain vacancies in the A site.
Introduction
Nepheline (Nph), ideally K2Na6[Al8Si8O32], is an important rock-forming mineral that has wide occurrences in many silica-poor alkaline igneous rocks and related pegmatites. Nepheline is an intermediate member of a solid solution that extends from Na[AlSiO4] to K[AlSiO4] (=kalsilite, Kls). Although the nepheline-kalsilite series is commonly thought to involve only K-Na substitution, these solid solutions vary in Al-Si ratio and with Ca atoms or vacancies substituting for K and Na atoms. Nepheline often contains an excess amount of Si over Al atoms, which creates vacancies ☐, because of the ☐Si4+ = (K,Na)+Al3+ and ☐Ca2+ = 2(K,Na)+ substitutions.
Both nepheline and kalsilite have a tridymite-type framework structure (e.g., Sahama, 1958; Capobianco and Carpenter, 1989; McConnell, 1991; Carpenter and Cellai, 1996; Xu and Veblen, 1996). Most common nepheline samples have a composition that is close to K2Na6[Al8Si8O32] with vacancies in the A site that contains K atoms, but nepheline from a few rare volcanic rocks are K-rich, so K atoms and vacancies occupy the A site and the remaining K atoms replace some of the Na atoms in the B site as indicated by the formula, K3.11Na4.20Ca0.31[Al7.64Si8.01O32], which is analysis # 3, p. 478 in Deer et al. (1992). Such volcanic nepheline samples have unusual chemical compositions and large unit-cell parameters. The crystal structure of such an unusual nepheline is not known, but such samples extend the nepheline solid solutions considerably. For example, analysis #3 above is given as Nph0.55Kls0.45. The structure for a K-rich nepheline with a Kls0.28 component was recently reported (Hamada et al., 2018). Because nepheline has a Na/K ratio of 3:1, the ideal formula corresponds to (NaAlSiO4)0.75(KAlSiO4)0.25 or Nph0.75Kls0.25. Nepheline from Oldoinyo Lengai, Tanzania contains Kls0.25-0.27 (Dawson, 1998), whereas those from Mount Nyiragongo contains about Kls0.45 (Sahama, 1962). The samples used in this study are from the above two localities. The crystal structure of such volcanic K-rich nepheline samples are unknown, so the aim of this study is to obtain the crystal structure of these samples. Such K-rich samples will also extend the natural nepheline solid solutions considerable, so the structural trends (bond distances and unit-cell parameters) are also analyzed in this study.
Diffraction data from some nepheline samples show satellite reflections with a wide range of intensity and sharpness (Sahama, 1958; McConnell, 1962, 1981, 1991; Sahama, 1962). The satellite reflections indicate that nepheline has a modulated structure with an incommensurate supercell. Various models have been proposed for the modulated structure of nepheline (McConnell, 1962; Parker and McConnell, 1971; Parker, 1972; McConnell, 1981; Merlino, 1984; McConnell, 1991; Hayward et al., 2000; Angel et al., 2008). Recently, a model for the incommensurately modulated structure of nepheline was presented in a superspace group by Friese et al. (2011). They indicated that all the atoms in the structure are displacively modulated with amplitudes below 0.1 Å.
The study examines two volcanic nepheline samples from Oldoinyo Lengai, Tanzania (samples 1 and 2) and a third sample 3 from Mount Nyiragongo, Eastern Congo (Zaïre), Africa. The crystal structure of these three samples was obtained using synchrotron high-resolution powder X-ray diffraction (HRPXRD) data and Rietveld structure refinements. The results indicate a high degree of Al-Si disorder in samples 1, 2, and phase 3b. The site-occupancy factors (sofs) for the A and B sites and the average <A-O> and <B-O> distances are rationalized in terms of the K, Na, and Ca atoms together with vacancies. These three samples extend nepheline solid solutions considerably to about Nph0.55Kls0.45, so variations in their unit-cell parameters are examined.
Background Information
The structure of nepheline is a stuffed derivative of tridymite with half the Si replaced by Al atoms, and with Na and K as interstitial charge-balancing cations (Schiebold, 1930; Buerger et al., 1954; Hahn and Buerger, 1955). The structure of nepheline consists of four independent tetrahedral T (=Al or Si) sites per unit cell (Figure 1). The T1 and T2 sites occupy special positions on the three-fold axes, whereas the T3 and T4 sites occupy general positions. The apices of the T1 and T4 tetrahedra point to one direction along the c axis, whereas the T2 and T3 tetrahedra point in the opposite direction. The apical oxygen atom, O1, is slightly off the threefold axis toward one of the three neighboring Na atoms. The Na atoms occupy the six small oval-shaped B cavities, and the K atoms occupy two large hexagonal-shaped A cavities, which gives Na6K2[Al8Si8O32] as the ideal formula for nepheline. However, small amounts of Ca occur with Na atoms on the B site and vacancies occur with K atoms on the A site. Chemical analyses show that the Si apfu (atom per formula unit) is slightly more than the Al apfu.
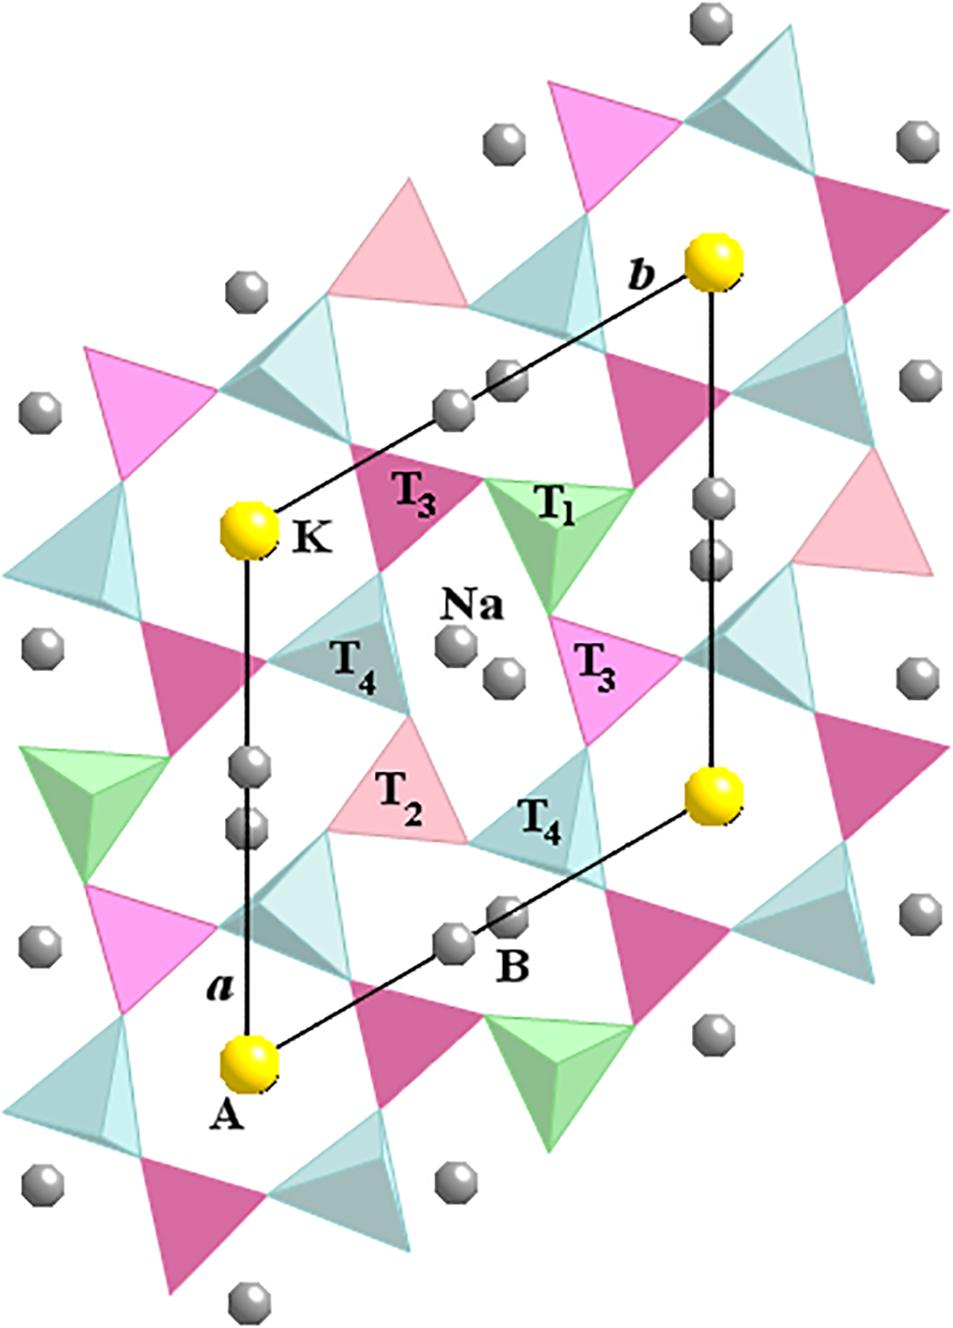
FIGURE 1. Crystal structure of nepheline projected down the c axis. A is the hexagonal site that contains K atoms and vacancies, and B is the oval-shaped site that contains mostly Na atoms that may be substituted by Ca and K atoms. The T2 and T3 tetrahedra have apices pointing downwards, whereas T1 and T4 tetrahedra point upwards. The Al and Si atoms are highly ordered in the T sites for most nepheline samples.
The Al and Si atoms are ordered over the tetrahedral sites to a high degree in nepheline. The T1–T2 (not T3–T4) pair is bonded to the positionally disordered O1 atoms. In addition, the T1 and T2 tetrahedra are surrounded by only Na atoms, whereas the T3 and T4 tetrahedra are surrounded by both K and Na atoms.
The structure of nepheline from various geological settings was refined (Dollase, 1970; Foreman and Peacor, 1970; Dollase and Peacor, 1971; Simmons and Peacor, 1972; Dollase and Thomas, 1978; Gregorkiewitz, 1984; Hassan et al., 2003; Tait et al., 2003; Angel et al., 2008). The structure of a Ge-substituted analog of nepheline is also available (Hammond and Barbier, 1998). The crystal structures of nepheline, tetrakalsilite, and kalsilite were reviewed (Merlino, 1984). Al and Si atoms are ordered over the tetrahedral sites in nepheline. In general, the T1 and T4 sites are Al-rich, and the T2 and T3 sites are Si-rich (Foreman and Peacor, 1970; Dollase and Peacor, 1971; Simmons and Peacor, 1972). Structure refinements of five crystals with different thermal histories indicate a variable degree of Si-Al ordering depending on crystallization history (Dollase and Peacor, 1971). The Al and Si atoms in a nepheline from a low-temperature pegmatitic environment are highly ordered over all four tetrahedral sites with T1 and T4 containing most of the Al atoms and T2 and T3 most of the Si atoms (Foreman and Peacor, 1970). In contrast, the Al-Si distribution in a volcanic nepheline shows considerable disorder between T1 and T2, but a high degree of order between T3 and T4 (Simmons and Peacor, 1972).
Variations in Unit-Cell Parameters for Synthetic Nepheline-Kalsilite Solid Solutions
Data for three ion-exchange series between nepheline (Nph; NaAlSiO4) and kalsilite (Kls; KAlSiO4) were reported in several related studies (e.g., Hovis et al., 1992, 2009; Hovis and Roux, 1999). The “natural” series 1 was made by K-Na ion exchange of a nepheline sample from Monte Somma with a composition Na0.747Ca0.036K0.129☐0.088[Al0.948Si1.052O4], which contains 5.2 mole % excess Si atoms and 3.6 mole % Ca atoms (Hovis et al., 1992). The amount of vacancies is, ☐0.088 = Si0.052 + Ca0.036. The “synthetic” series 2 was made by K-Na ion exchange of a sodic nepheline, (Na,K)0.983☐0.017[Al0.983Si1.017O4], hydrothermally synthesized from a gel and contain 1.7 mole % excess Si atoms and the same amount of vacancies (Hovis et al., 1992; Hovis and Roux, 1993). A “high-Si” series 3 contains 12.5 mole % excess Si atoms (Hovis and Roux, 1999; Hovis and Crelling, 2000; Hovis et al., 2009). Four chemical molecules or components were used to describe compositions in the nepheline–kalsilite series. These included Nph (NaAlSiO4), Kls (KAlSiO4), 2Qz (☐Si2O4), and 0.5An (☐0.5Ca0.5AlSiO4), where XNph and XKls indicate the mole fraction of Nph, and Kls, respectively, ☐ are vacancies (Vac), where XVac = X2Qz + 0.5 X0.5An. Mole fractions (X) are related to the mole fractions of the chemical molecules: XNa = XNph, XK = XKls, XCa = 0.5 X0.5An, and XVac = X2Qz + 0.5 X0.5An. Further details are given in the references above where they plot unit-cell parameters against compositions across the Nph-Kls series. Tetrakalsilite has the ideal formula K0.625Na0.375[AlSiO4]. Ideal nepheline, K2Na6[Al8Si8O16] or K0.25Na0.75[AlSiO4], corresponds to Nph0.75Kls0.25.
In the original papers, the unit-cell data for the synthetic nepheline-kalsilite series were plotted against composition XKls and X(Kls + Vac), as shown in Figure 2. The c/a parameter versus composition was not plotted in the original papers (e.g., Hovis and Roux, 1999). The original data were represented by three linear segments that intersect where X(Kls + Vac) is about 0.24 and 0.74 (see Hovis et al., 1992). In Figure 2, except for the c/a versus compositional plots, all the other graphs are fitted in this study by polynomials to the “synthetic” series 2 data. These polynomials do not seem to contain significant changes in slopes at X(Kls + Vac) ≈ 0.24 or 0.74. However, the c/a ratio versus composition plots do seem to contain changes in slopes at the above points (Figures 2C,G). These changes in slopes or break in linear trend lines was also observed by Smith and Tuttle (1957) and Donnay et al. (1959), and presumably corresponds to the point at which K atoms begin to occupy the smaller Na or B site at X(Kls + Vac) ≈ 0.24 (Hovis et al., 1992). Whether this statement is true or not can be answered definitively with structure refinement data. It is clear from the plots (Figures 2C,G), change in slopes for unit-cell dimensions occur at the Nph–tetrakalsilite–Kls transitions near X(Kls + Vac) ≈ 0.74.
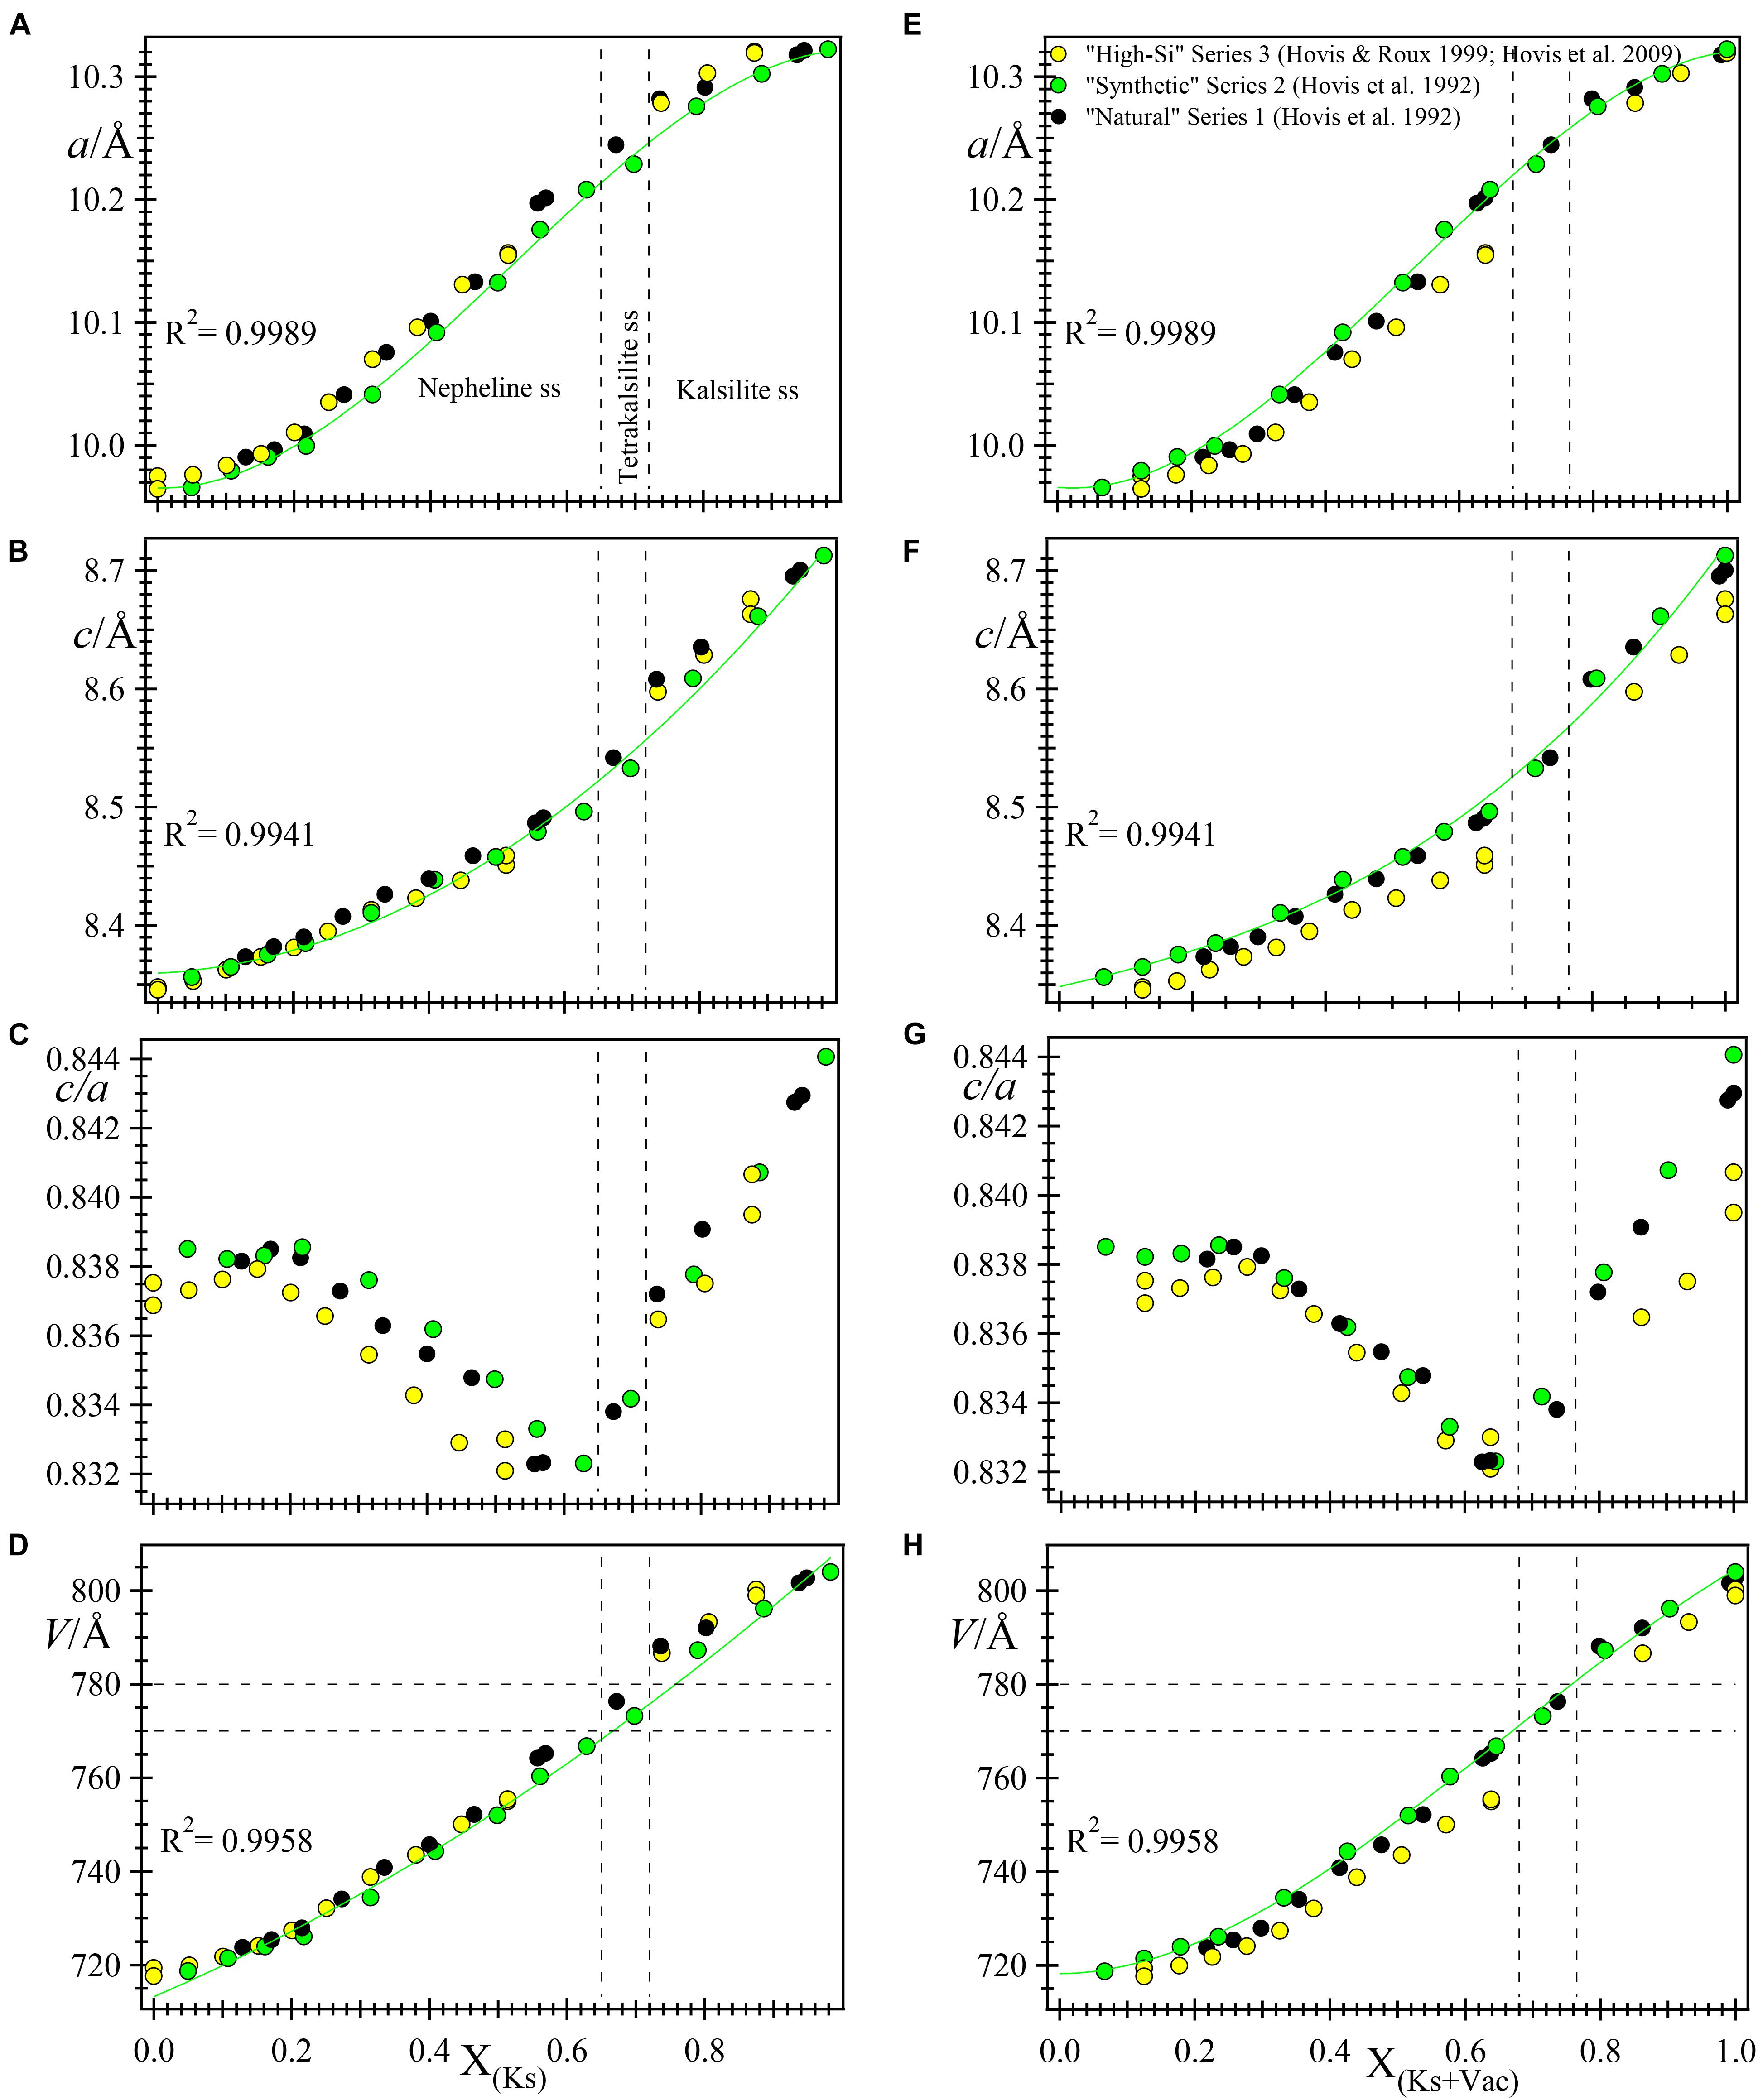
FIGURE 2. A re-plot of the unit-cell parameters against XKs (A–D, left column) and X(Kls + Vac) (E–H, right column) for samples from three ion-exchange nepheline-kalsilite series (see legend in E). Polynomials are fitted to the “synthetic” series 2 and their R2 values are given as inserts (a is fitted to a 3rd order polynomial, whereas c and V are fitted to 2nd order polynomials). The dashed vertical lines are the boundaries for the two tetrakalsilite samples: they are drawn at 0.65 and 0.72 XKls and 0.68 and 0.765 X(Kls + Vac). To the left of tetrakalsilite are nepheline solid solutions and to the right are data for the kalsilite series. Only the c/a variable, which was not plotted in the original papers, appear to show a kink at ≈ 0.24 X(Kls + Vac) where it was suggested that K atoms begin to enter the B site in nepheline solid solutions (C,G).
Sample Description
We examined three samples of nepheline from two different volcanoes in Africa. Sample 1 (ODL-2010-1) and sample 2 (ODL-2010-3) are from the Oldoinyo Lengai Volcano, Tanzania. Sample 1 contains hexagonal shaped euhedral nepheline crystals together with aegirine and biotite. Sample 2 was collected from an ash fall that contains large (>0.05 mm diameter), well-developed, euhedral crystals of nepheline that occur with aegirine, augite, and olivine. Sample 3 (Nyra-1) is from the Mount Nyiragongo Volcano, Eastern Congo and contains nepheline with leucite and melilite. Another sample (ODL-2010-2) contains small (about 0.05 mm diameter) nepheline crystals that occur with aegirine and titanite. Because two samples (ODL-2010-2 and ODL-2010-3) gave identical unit-cell parameters, sample (ODL-2010-2) was not investigated further.
Experimental
The three nepheline samples were analyzed using a JEOL JXA-8200 WD-ED electron-probe micro-analyzer (EPMA). The JEOL operating program on a Solaris platform was used for ZAF correction and data reduction. The wavelength-dispersive (WD) operating conditions were 15 kV accelerating voltage, 10 nA beam current, and 5 μm beam diameter. Kα radiation and the following standards were used: rutile (Ti), spinel (Al and Mg), hematite (Fe), wollastonite (Ca, Si), and feldspar (Na, K). The crystals appear to be homogeneous based on optical observations and microprobe analyses. Table 1 contains the average chemical compositions from 12 spots together with their standard deviations.
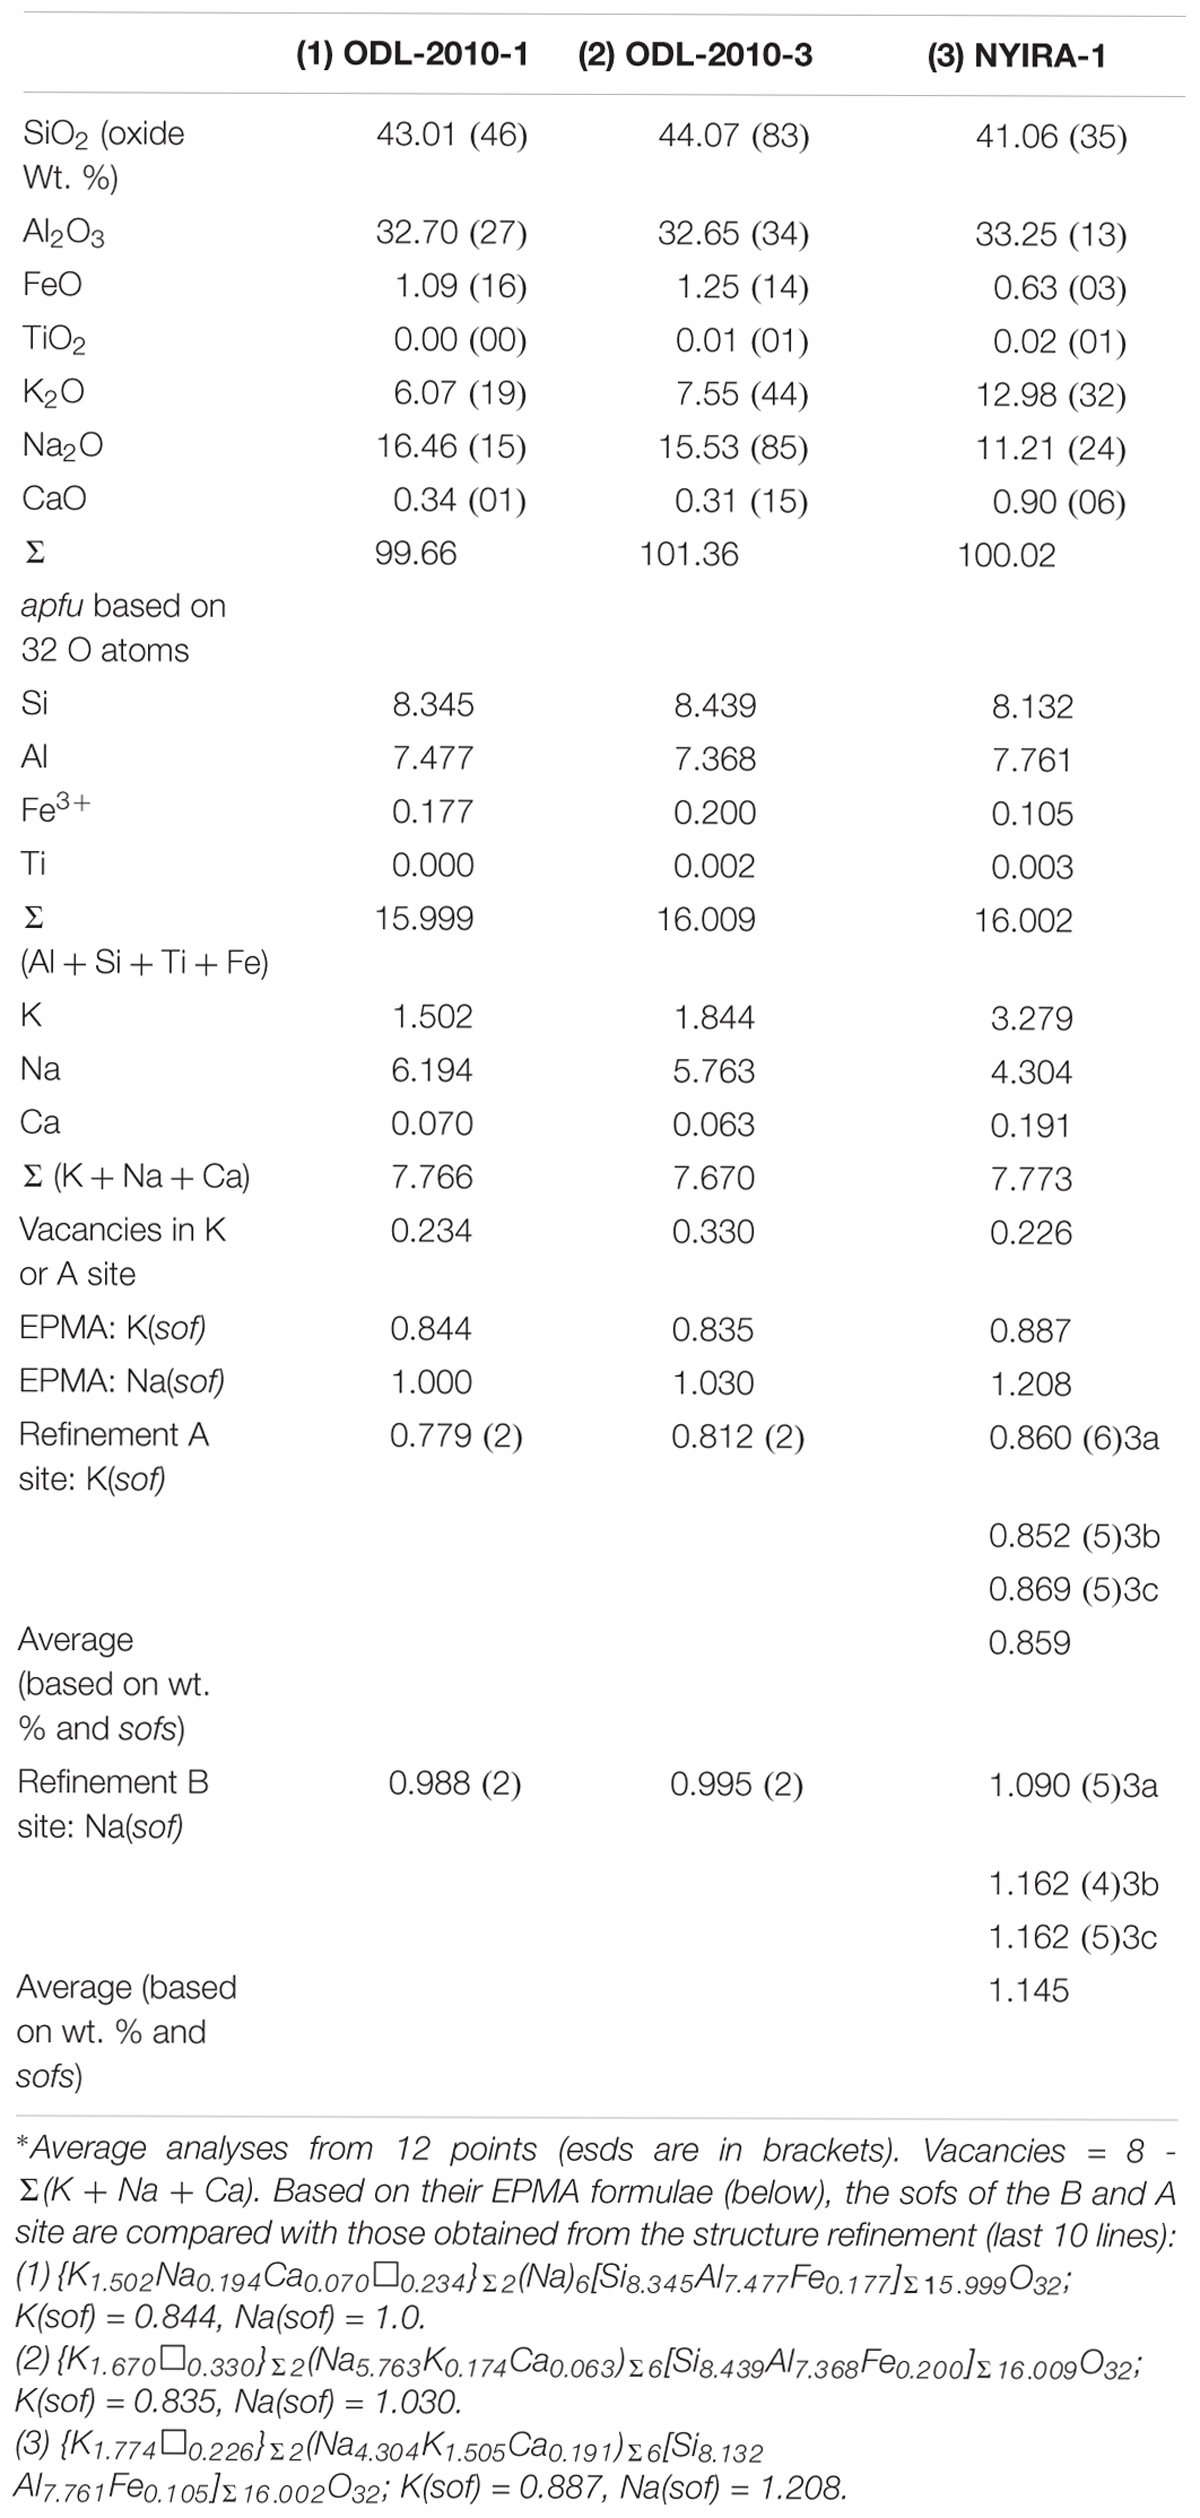
TABLE 1. Chemical composition∗ for three nepheline samples from Africa.
Large single crystals of nepheline about 0.05 mm in diameter were hand-picked under a binocular microscope and finely ground in an agate mortar and pestle for synchrotron high-resolution powder X-ray diffraction (HRPXRD) experiments performed at beamline 11-BM, Advanced Photon Source, Argonne National Laboratory. Each sample was loaded into a Kapton capillary (0.8 mm internal diameter) and rotated during the experiment at a rate of 90 rotations per second. The data were collected to a maximum 2θ of about 43° with a step size of 0.001° and a step time of 0.1 s per step. The HRPXRD traces were collected with a unique multi-analyzer detection assembly consisting of twelve independent silicon (111) crystal analyzers and LaCl3 scintillation detectors that reduce the angular range to be scanned and allow rapid acquisition of data. A silicon (NIST 640c) and alumina (NIST 676a) standard (ratio of 1/3 Si: 2/3 Al2O3 by weight) was used to calibrate the instrument and to refine the monochromatic wavelength [λ = 0.42465(2) Å] used in the experiment. Additional details of the experimental set-up are given elsewhere (Antao et al., 2008; Lee et al., 2008; Wang et al., 2008).
Rietveld Structure Refinement
The crystal structure was modeled using the Rietveld method (Rietveld, 1969) that is incorporated in the GSAS program (Larson and Von Dreele, 2000) and using the EXPGUI interface (Toby, 2001). Initial structural parameters were taken from Hassan et al. (2003). The background was modeled with a Chebyschev polynomial (8 terms). In the GSAS program, the reflection-peak profiles were fitted using type-3 profile (pseudo-Voigt; Cagliotti et al., 1958; Thompson et al., 1987). The structure refinements were carried out by varying parameters in the following sequence: scale factor, background, cell, zero shift, profile, atom positions, isotropic displacement parameters, U, and site-occupancy factor (sofs) for the K and Na sites. Finally, all variables were refined simultaneously. We constrained similar atoms to have the same value for U. For example, all the O atoms in each sample were constrained to have the same U value and all the T atoms were constrained to have the same U value. No constraints were used for the atoms coordinates, but those coordinates that are constrained by symmetry were fixed. Based on synchrotron data that are similar to that used in this study, the structure of three pegmatitic nephelines were successfully refined using the procedure outlined above (Antao and Hassan, 2010b).
Sample 3 was modeled as a three-phase intergrowth of nepheline with slightly different structural parameters. Table 2 contains the cell parameters and other information regarding data collection and refinement. Table 3 contains the atom coordinates and isotropic displacement parameters. Table 4 contains the bond distances and angles.
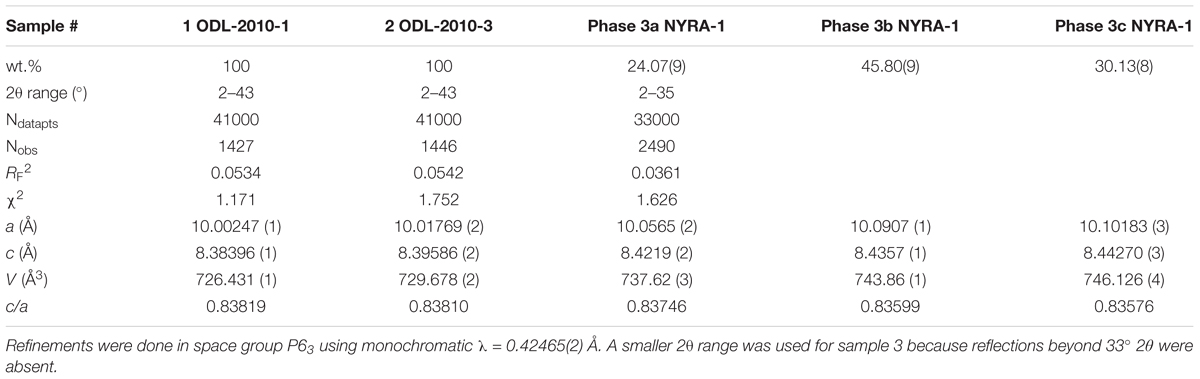
TABLE 2. Unit-cell and Rietveld refinement parameters for three nepheline samples.
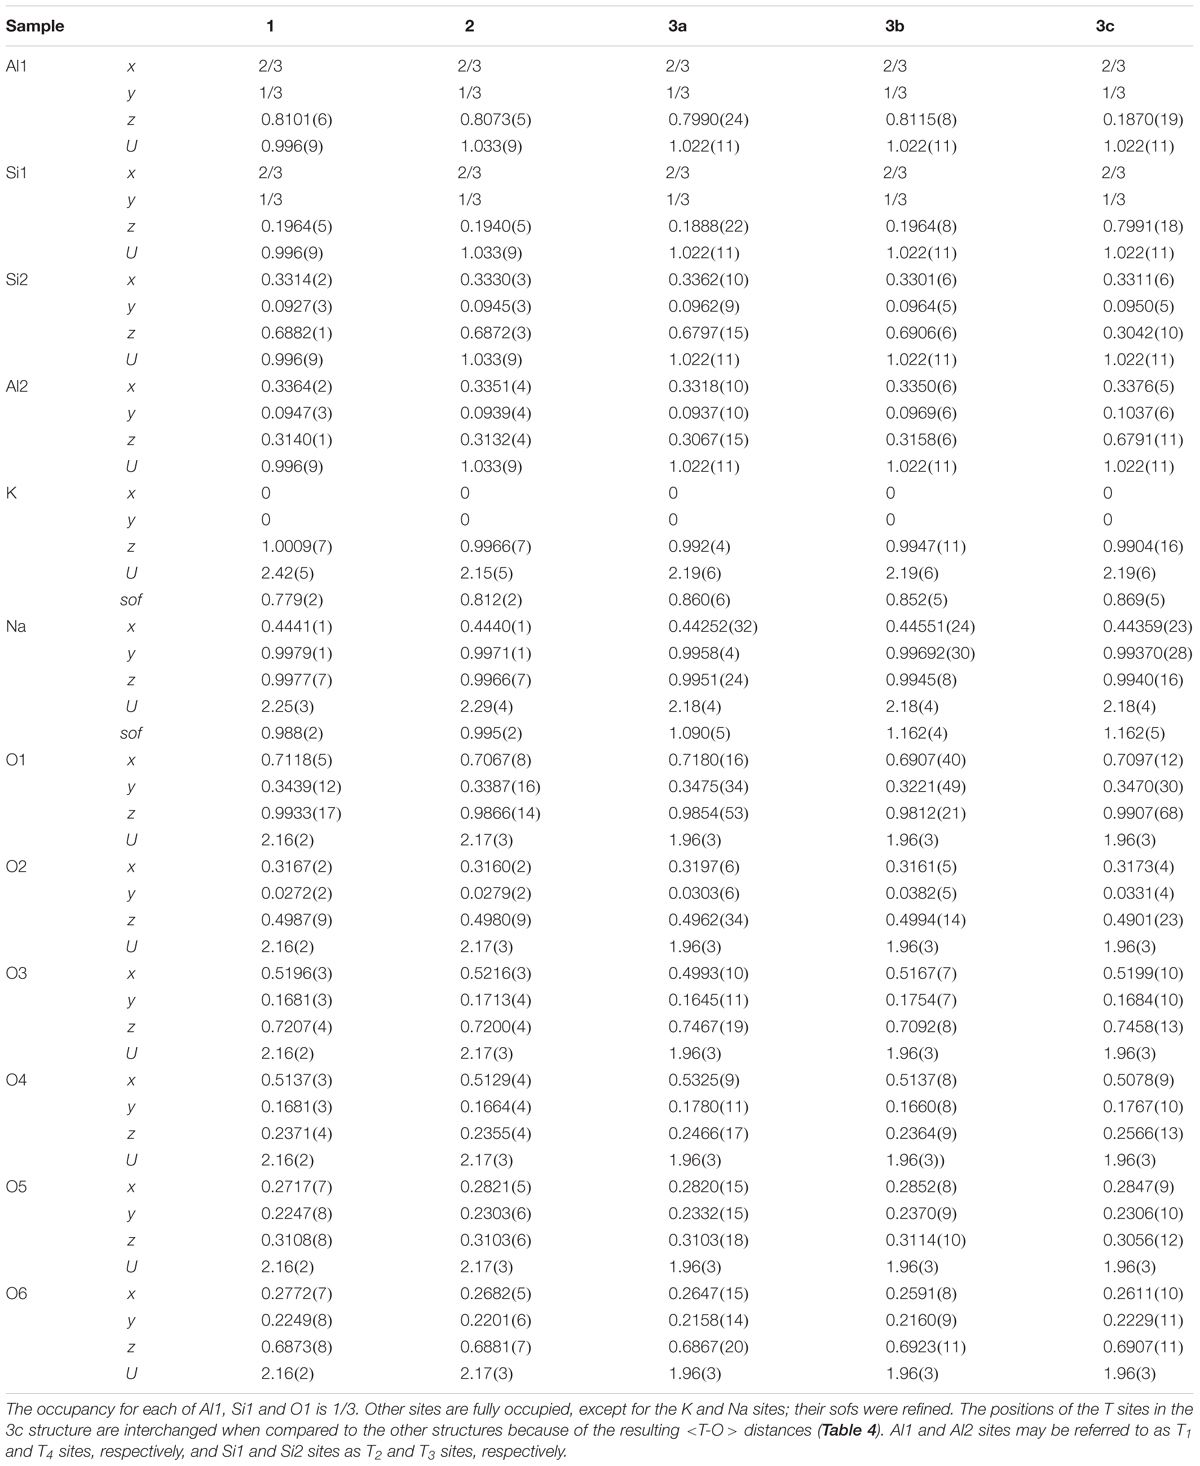
TABLE 3. Atom coordinates and U Parameters (x 100 Å2) for three nepheline samples.
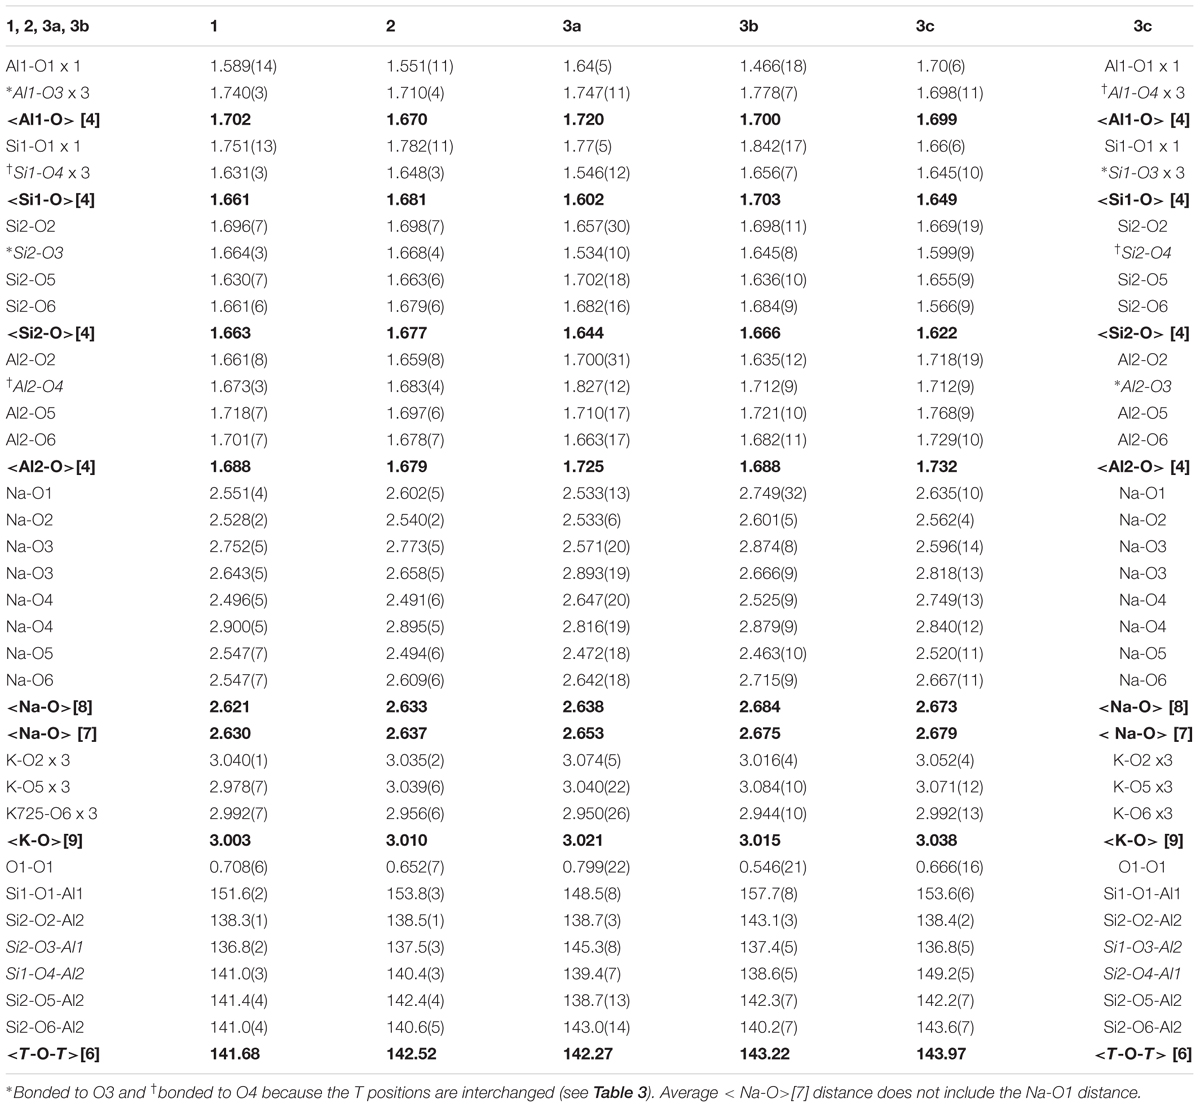
TABLE 4. Bond distances [Å] and angles [°] in three nepheline samples.
Results and Discussion
Chemical Analyses
The chemical analyses for the three samples show that they not only cover the usual range for nepheline compositions, but they also show a considerable extension of natural nepheline solid solutions to about Nph0.55Kls0.45 (Table 1). The samples contain a small excess of Si over Al atoms, which is typical for nepheline, ideally (A)2(B)6[Al8Si8]O32. The chemical formula for sample 1 is {K1.50Na0.19Ca0.07☐0.23}Σ2(Na)6[Si8.35Al7.48Fe0.18]Σ16.00O32, which contains 0.23 vacancies, ☐ in the A site that contains K together with some Na and Ca atoms because the B site is filled with only Na atoms to the maximum amount possible, 6. Based on the above formula, the A site has K(sof) = 0.844 and the B site has Na(sof) = 1.0 compared to K(sof) = 0.779(2) and Na(sof) = 0.988(2) obtained from the refinement (see last 10 lines in Table 1). Because some small amounts of Na and Ca atoms occur in the A site, the average < K-O > distance is the shortest for the three samples (Table 4). A significant amount of Fe3+ replaces Al3+ cations in the T site. The sum of the tetrahedral T cations is at the ideal value of 16 (Table 1). Sample 1 is a Na-rich nepheline. In most common nepheline samples, the A site usually contains K atoms and vacancies, whereas the B site is filled with mostly Na atoms and a small amount of Ca atoms.
The chemical formula for sample 2 is {K1.67☐0.33}Σ2 (Na5.76K0.17Ca0.06)Σ6[Si8.44Al7.37Fe0.20]Σ16.01O32. The A site content is typical of nepheline samples having only K atoms and vacancies, as do samples from Bancroft, Ontario (Hassan et al., 2003; Antao and Hassan, 2010b). However, the B site contains a small amount of K atoms together with the usual Na and Ca atoms, so these volcanic nepheline compositions are unusual. The A site has K(sof) = 0.835 and the B site has Na(sof) = 1.030 compared to K(sof) = 0.812(2) and Na(sof) = 0.995(2) obtained from the refinement (Table 1). A serious error can be made by using the K atoms to fill the A site first, thus eliminating A site vacancies, and then placing any remaining K atoms in the B site. We avoided this error because we have sofs from Rietveld refinements to compare with the EPMA data (Table 1). The results clearly show that all vacancies must be placed in the A site and perhaps vacancies are necessary for the A site. Sample 2 is more K-rich than sample 1, so sample 2 has a larger unit-cell volume, V. A small number of K atoms enter the B site in sample 2, but there is no significant change for unit-cell or structural parameters between samples 1 and 2. The ion-exchange nepheline solid solutions indicate changes in slopes for unit-cell parameters where K atoms enter the B site (Figure 2).
The most interesting average chemical formula was obtained for sample 3, {K1.774☐0.226}Σ2 (Na4.304K1.505Ca0.191)Σ6[Si8.13Al7.76Fe0.11]Σ16.01O32, from Mount Nyiragongo Volcano, Eastern Congo, which contains a large amount of K atoms that is more than the ideal value of 2. Such an unusually K-rich nepheline is uncommon. In spite of the large amounts of K atoms, the A site contains the usual amount of K atoms and vacancies. Some K atoms are placed in the B site together with Na and Ca atoms. Clearly, this sample is expected to have the largest unit-cell parameters among the three samples, which is indeed the case (Table 2). The A site has K(sof) = 0.887 and the B site has Na(sof) = 1.208 (Table 1).
Sample 3 contains a mixture of three phases, but only an average composition was obtained with EPMA. Based on the weight percentages of the three different phases (Table 2), the average K(sof) = 0.859 and average Na(sof) = 1.145 were obtained from the refinement (Table 1). Na(sof) > 1 is not unusual for nephelines because the B site contains Na, K, and Ca atoms. Other refinements of the nepheline structure also report Na(sof) > 1 (see Figure 7A). Moreover, it is not possible to constrain the refinement to the EPMA chemical composition because sample 3 contains a mixture of three phases. Vacancies and the presence of more than two different atoms on a site makes any chemical constraints unreliable for the nepheline structure. The structure refinement from Hamada et al. (2018) gives 0.968 Na + 0.032 K for the B site based on the assumption of full occupancy, whereas their EPMA gives 5.705 Na + 0.198 K + 0.031 Ca + 0.034 Mg with 0.032 vacancies. Both of these correspond to Na(sof) = 1.023.
In nepheline, the A site is not completely filled with K atoms. Vacancies are confined only to the A site. Some K atoms enter the B site, which is usually filled with mainly Na and minor amounts of Ca atoms. For assignments of atoms and vacancies to the A and B site to be correct, one must show from crystal structure refinements that the sofs and EPMA data match each other, which is the case in this study (Table 1).
Sahama (1962) also studied a nepheline sample from Nyiragongo, Congo (his sample no. 34) with a composition quite close to that obtained for sample 3 in this study. A recalculation of the data from Sahama (1962) gives the formula {K1.58☐0.42}2 (Na4.23K1.55Ca0.23)Σ6[Si8.15Al7.83Fe0.04]Σ16.02O32 with a = 10.096, b = 8.441 Å, and V = 745.1 Å3 (see his pages 66 and 77) and these values are quite close to that obtained in this study (Table 2). The crystal structure of only one K-rich nepheline, {K1.74☐0.26}Σ2 (Na5.44K0.51Ca0.03Mg0.02)6[Si8.34Al7.45Fe0.16]Σ15.95O32, from Japan was recently reported, but it is not as K-rich as our sample 3 (Hamada et al., 2018).
HRPXRD Traces and Satellite Reflections
The HRPXRD traces for the three nepheline samples used in this study contain no satellite reflections (Figure 3). Such reflections are easily observed in HRPXRD traces, and are common in nepheline that occurs in plutonic rocks and gneisses (see Antao and Hassan, 2010b). The trace shown in Figure 3A indicates a three-phase intergrowth of nepheline. The three phases are observed by the asymmetry and splitting in the reflection peaks. The reflection peaks for samples 1 (Figure 3B) and 2 (Figure 3C) are more symmetrical than those shown for sample 3 (Figure 3A).
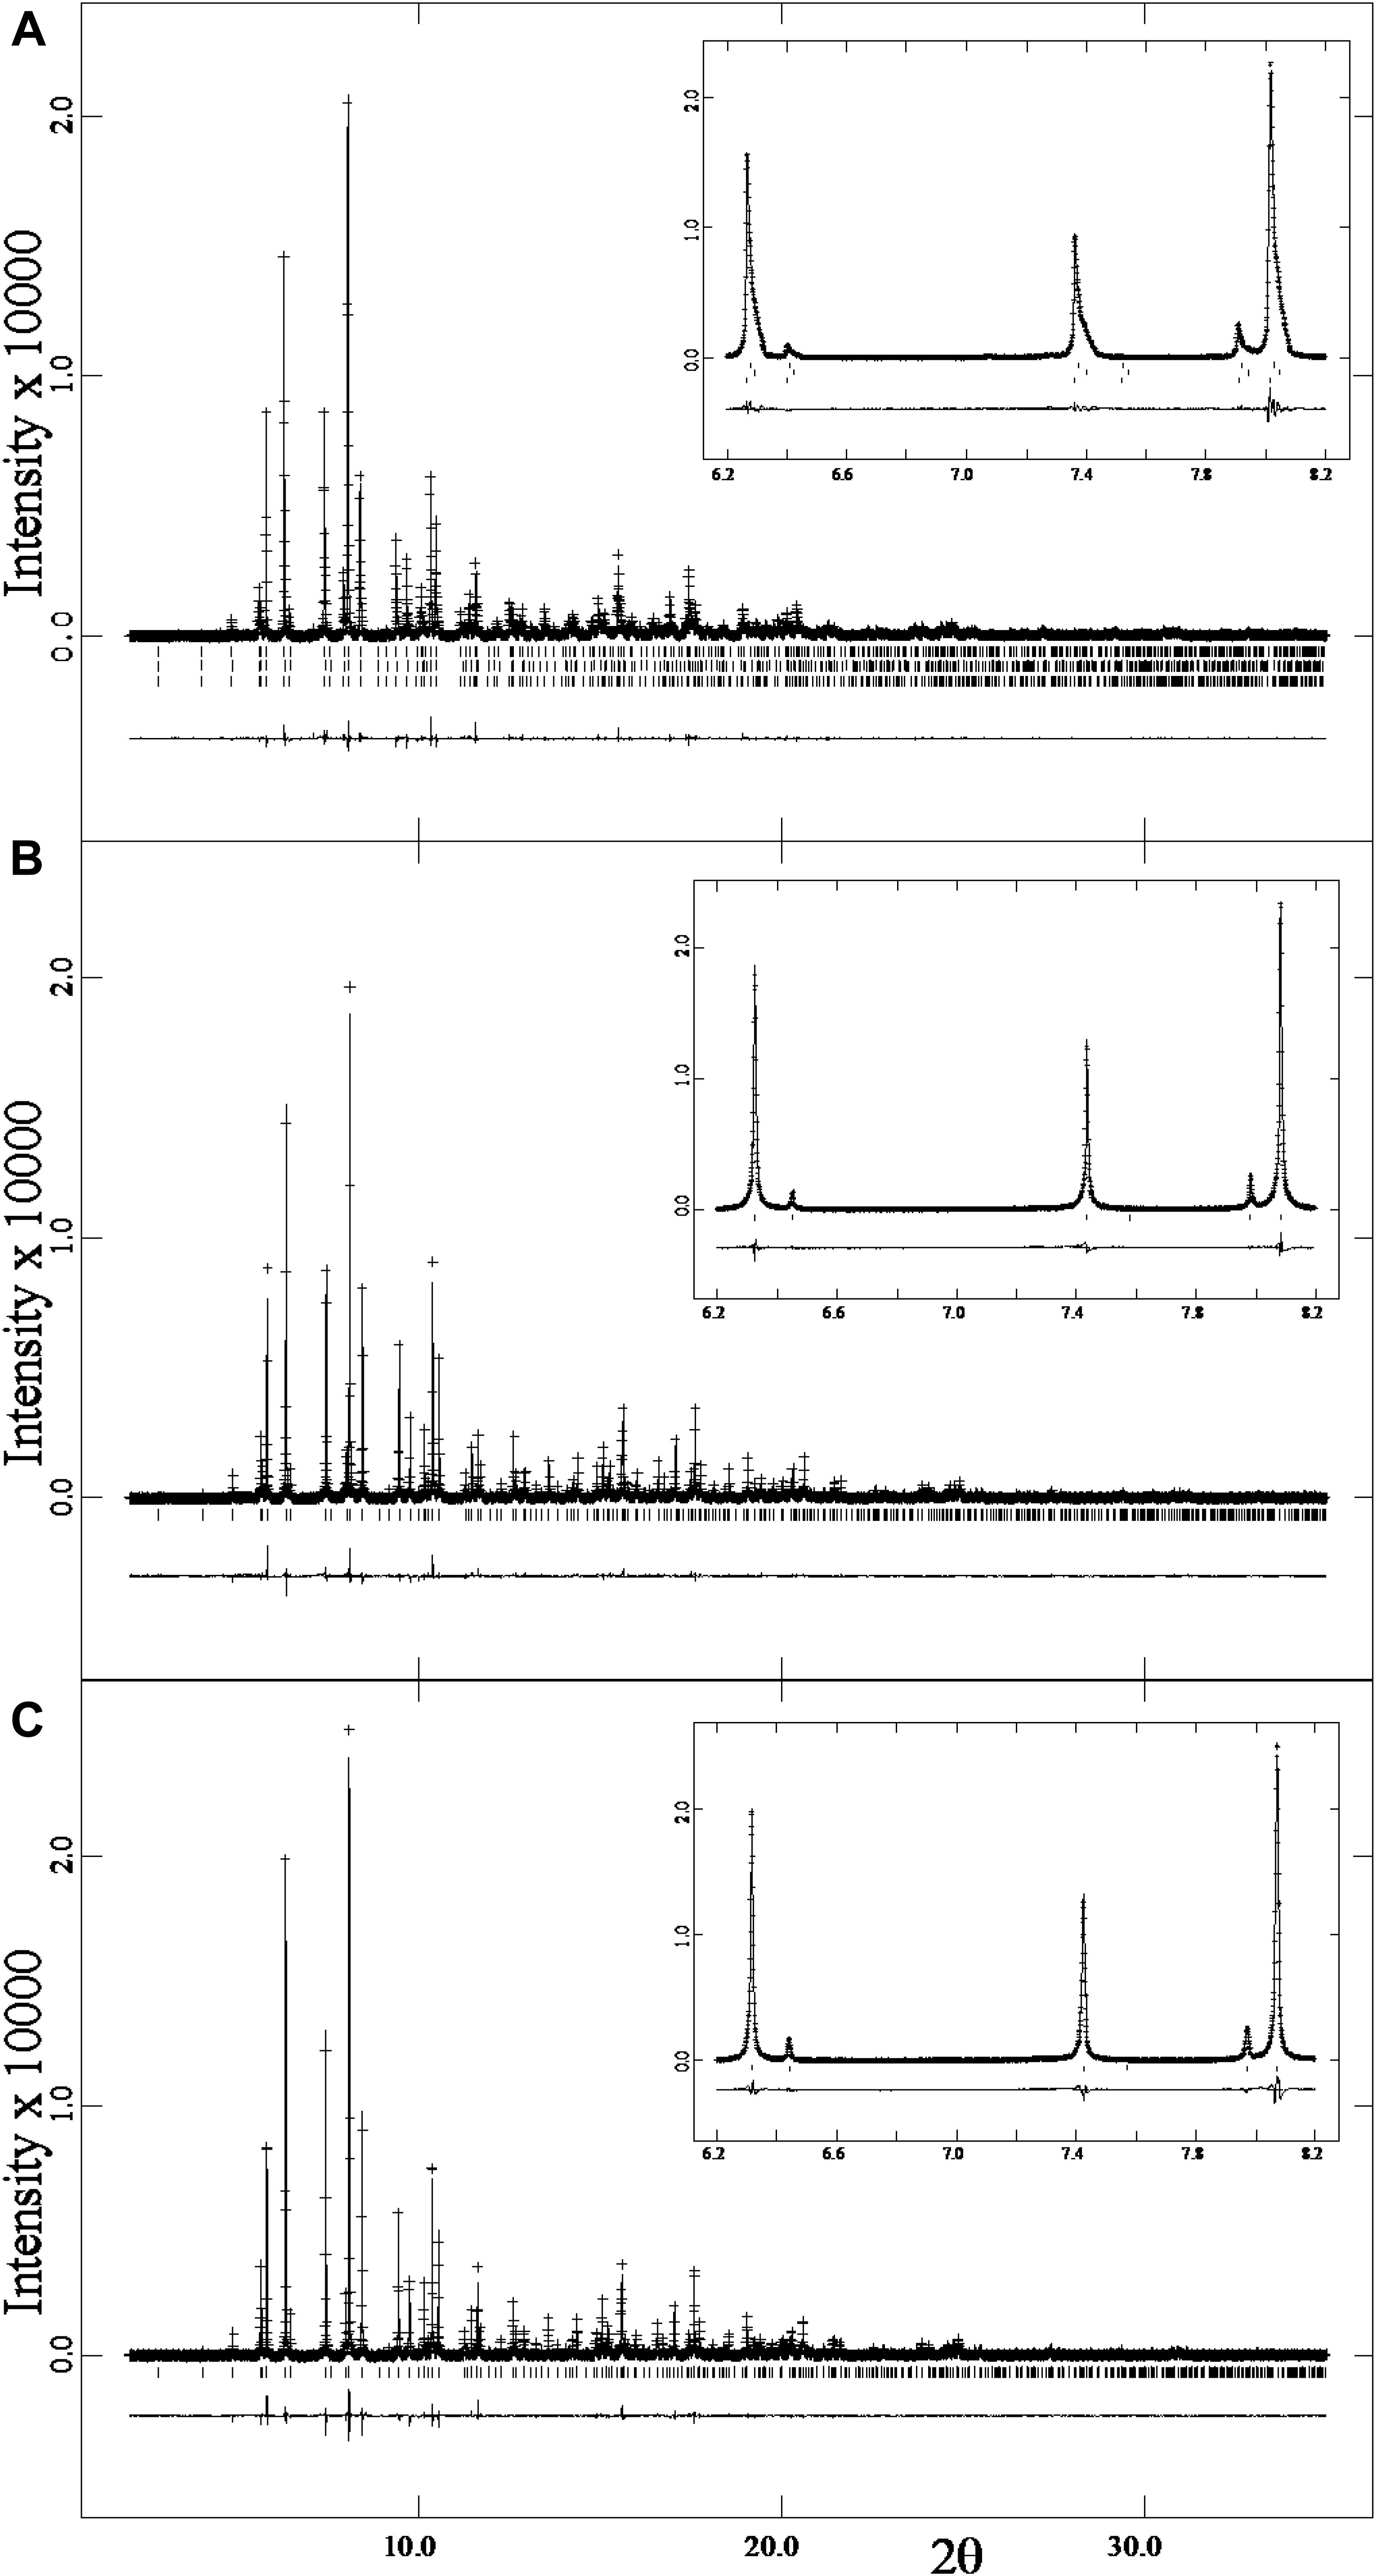
FIGURE 3. HRPXRD traces for three nepheline samples: (A) sample 3, (B) sample 1, and (C) sample 2. Calculated (continuous) and observed (crosses) profiles are shown. The difference curve (Iobs – Icalc) is shown at the bottom. The short vertical lines indicate the allowed reflection positions. The inserts show expanded views of a small 2θ range. No satellite reflections occur in these samples. The trace in (A) contains three different phases of nepheline, as shown more clearly on an expanded scale in Figure 4.
An expanded view of a small 2θ range shows a three-phase intergrowth for sample 3 (Figure 4A). The reflections peaks are symmetrical in Figure 4B compared to the asymmetrical peaks in Figure 4A and the “triplet” splitting or “humps” indicate a three-phase intergrowth of nepheline. Hovis et al. (2009) showed a solvus in the nepheline-kalsilite system, so exsolution and intergrowths are expected for nepheline that cools slowly. The three phase intergrowth in sample 3 was not observed in back-scattered electron (BSE) images, which is not unusual because all three phases have quite similar structural features and compositions. In the case of genthelvite and garnet-group minerals, multi-phase intergrowths were observed by splitting of diffraction peaks, but only sometimes were the different phases observed in BSE images (Antao and Hassan, 2010a; Antao, 2013; Antao and Klincker, 2013; Antao et al., 2015a,b; Antao and Cruickshank, 2016).
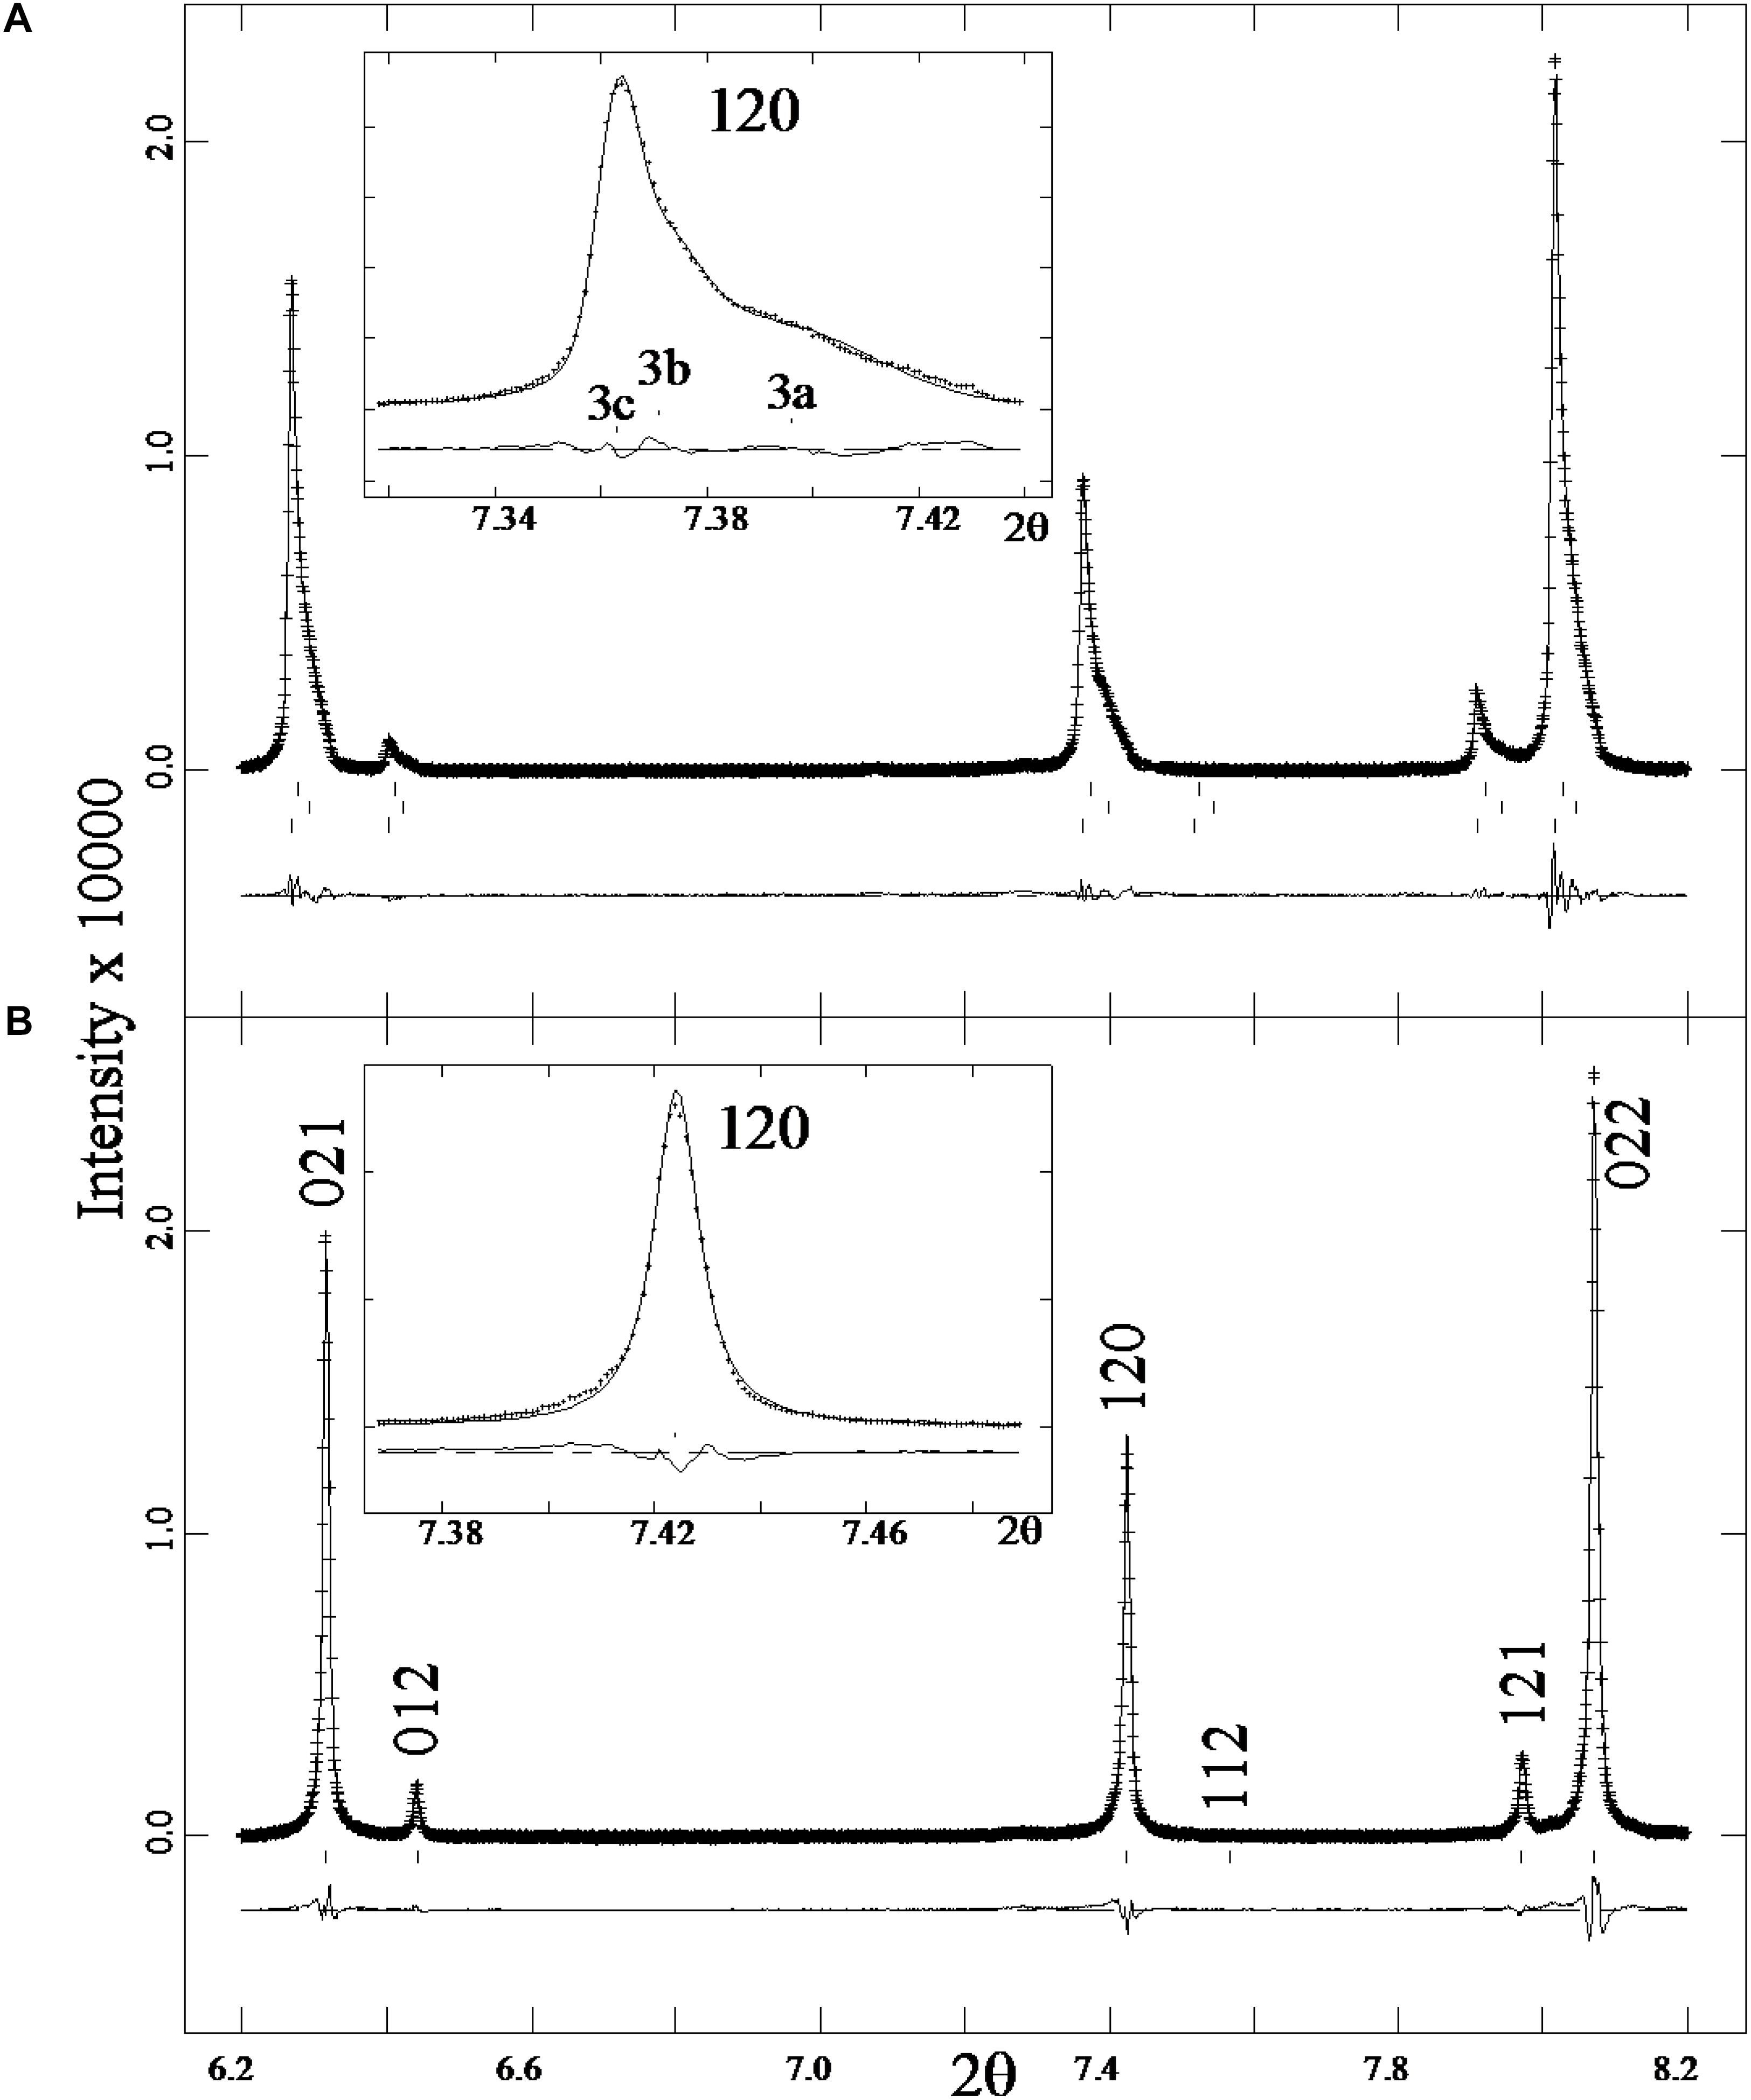
FIGURE 4. Expanded views of a small 2θ range from the HRPXRD traces for (A) sample 3 and (B) sample 2. The diffraction peaks are symmetrical in (B) compared to the asymmetrical peaks in (A) that contain a three-phase intergrowth of nepheline. These features are shown more clearly in the inserts for the 120 peak. The three phases (3a, 3b, 3c) are labelled in (A) and they give rise to a “triplet” of splitting or “humps” in each diffraction peak.
Variations in Unit-Cell Parameters for Natural Nepheline Solid Solutions
Graphs of unit-cell data that are independent of compositions (Figures 5, 6) are compared to those that have compositions as variables (Figure 2) to see if the same general features are observed. The variations in unit-cell parameters for natural nepheline samples were not available because of the limited range in chemical composition. Our samples considerably extend the range of nepheline solid solutions. About one-half of the nepheline solid solution range is now covered by natural samples. Some excellent linear relations are observed for our natural samples. The linear trend lines pass through unit-cell parameters for other natural nepheline samples that vary within a very narrow range (Figures 5, 6). “Literature” data shown in Figures 4–6 are taken from various studies (Dollase, 1970; Foreman and Peacor, 1970; Dollase and Peacor, 1971; Simmons and Peacor, 1972; Dollase and Thomas, 1978; Gregorkiewitz, 1984; Tait et al., 2003; Angel et al., 2008). Included in these figures are data from other studies as well, as indicated in their legends (Sahama, 1962; Antao and Hassan, 2010b; Vuliæ et al., 2011; Balassone et al., 2014; Hamada et al., 2018).
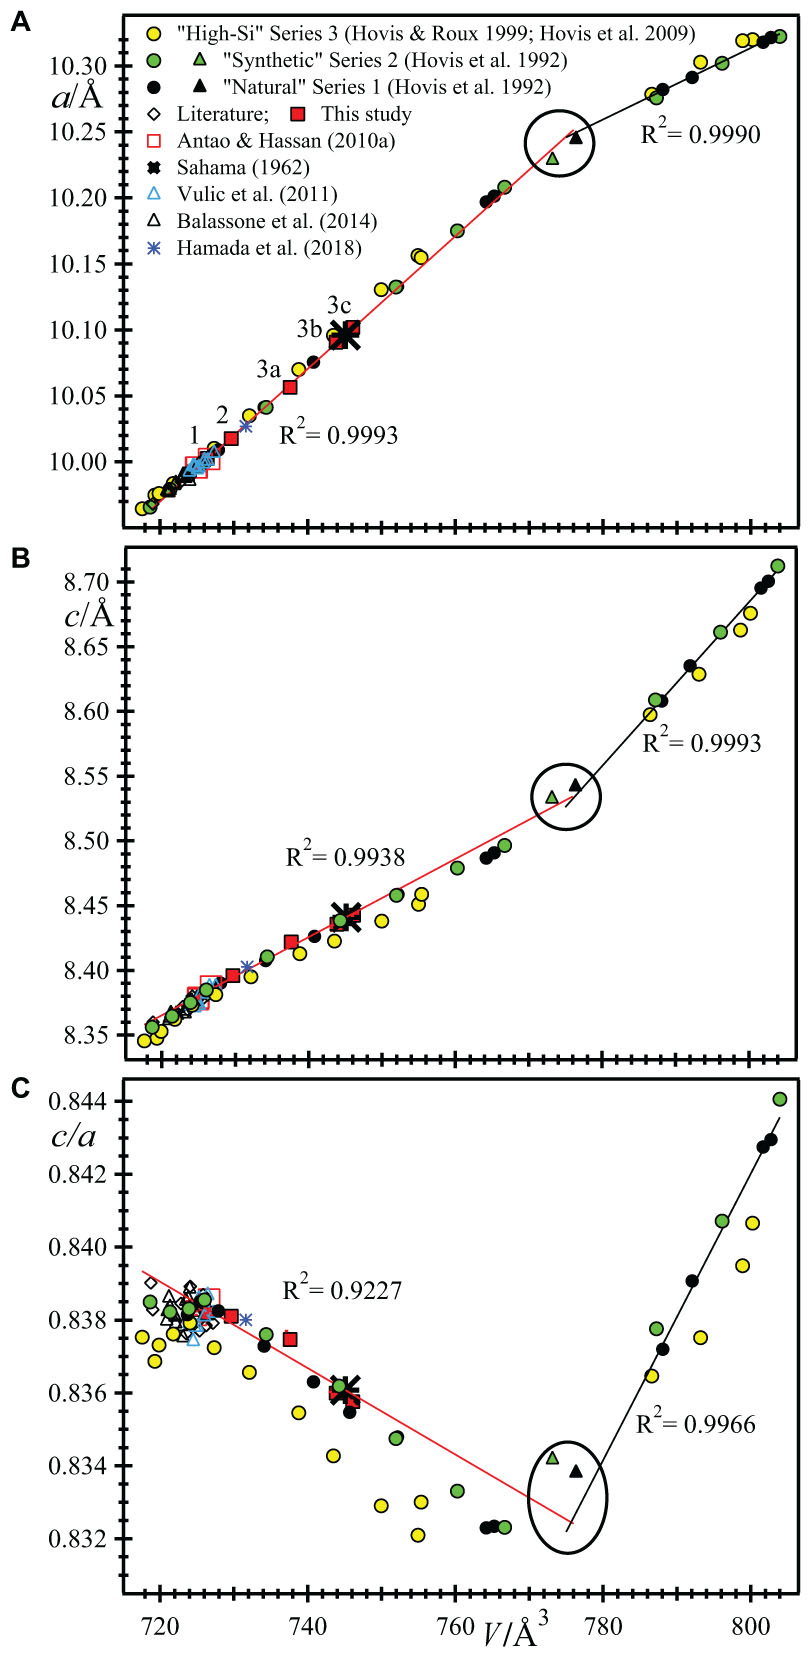
FIGURE 5. Linear trends among unit-cell parameters for nepheline-kalsilite solid solutions. The red trend lines were calculated using data from this study and from Antao and Hassan (2010b); they contain 8 data points. The linear a vs. V plot in (A) shows a high correlation factor (R2 = 0.9993) with very little scatter of the data points from the “Literature” (these references are given in the text), followed by c vs. V in (B) with R2 = 0.9938, and c/a vs. V in (C) with R2 = 0.9227. The agreements in trends for all natural samples are better than those for the three different ion-exchange series, but the agreement for the synthetic series 3 is not so good. Two tetrakalsilite samples are indicated by solid triangles near the intersection of the two straight lines (circled points). The black straight line is fitted to the four “natural” kalsilite series 1 samples and their R2 values are given as inserts. For comparison to nepheline data, a unit-cell values for kalsilite are doubled and those for tetrakalsilite are halved.
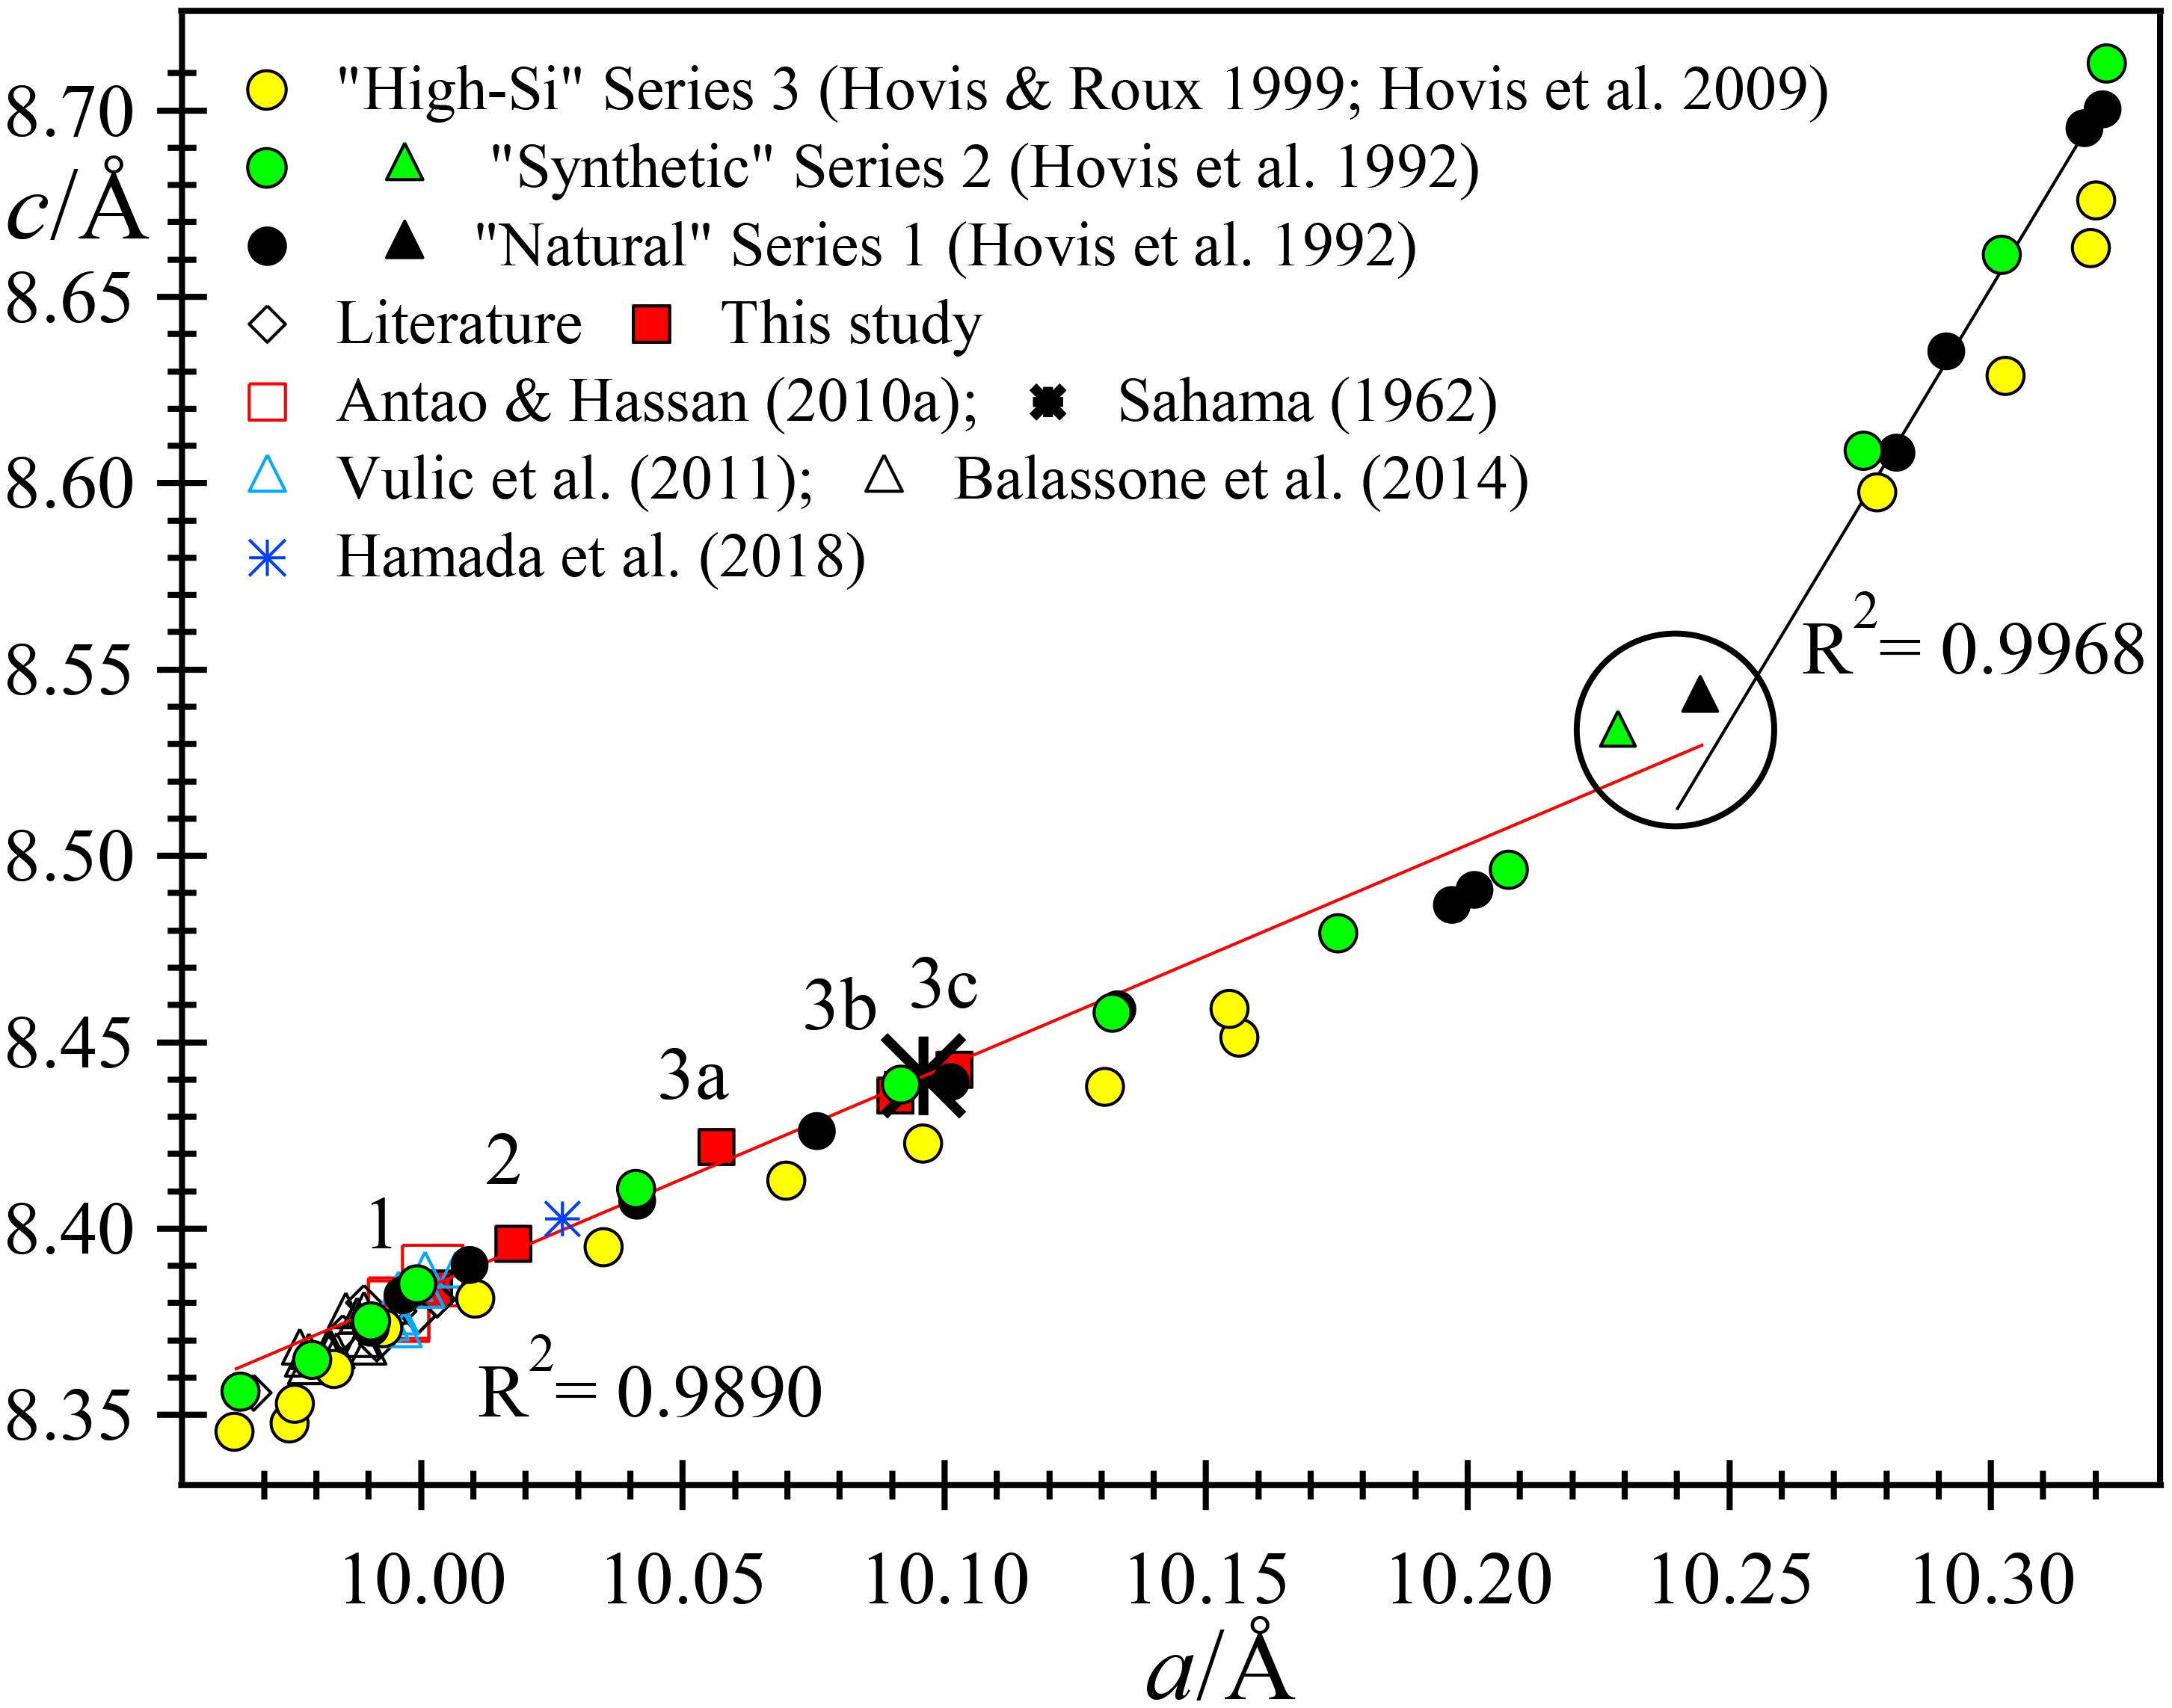
FIGURE 6. Linear trends between c and a unit-cell parameters for nepheline-kalsilite solid solutions. Most of the natural samples are close to the trend line, but the three ion-exchange series deviate somewhat, particularly series 3. “Literature” sources are given in the text.
The variations of the a and V unit-cell parameter across the Nph-Kls series can be represented by two straight lines that intersect at tetrakalsilite. All the data points fall very close to the two trend lines, especially in Figure 5A, but less so in Figure 5B. The linear fits are quite good for natural nepheline samples and series 1 and 2 data, but not too good for series 3. The c/a versus V plot shows considerable scatter, especially for series 3 data (Figure 5C). Near the Kls side of the series, the variation is linear for series 1 and 2, but not for series 3. When the a and c parameters are plotted against each other, it appears that the variations are again linear, except for series 3 (Figure 6).
In the nepheline side of the series, the series 3 data appears to match two linear segments that meet at V ≈ 725 Å3, which is not the case for the natural samples (Figure 5C). Is this break at V ≈ 725 Å3 real? Or are the unit-cell parameters for series 3 not measured accurately? The K atoms enters the B site between samples 1 (V = 724.4 Å3) and 2 (V = 729.7 Å3), where there are no significant changes in structural parameters, including unit-cell parameters. This substitution effect does not give rise to significant changes that were observed by others, e.g., Figures 2C,G (e.g., Hovis et al., 1992). It seems likely that all unit-cell parameters for both natural and synthetic samples should vary linearly among themselves (Figures 5, 6).
Sample 1 has small unit-cell parameters, which are similar to other Na-rich samples. Sample 3 has large unit-cell parameters, and sample 2 has intermediate values. Sample 3 contains an intergrowth of three phases that have different unit-cell parameters (Figures 5, 6). It is interesting to note that the unit-cell data from Sahama (1962) match phases 3b and 3c quite well.
Structural Characteristics of the Three Nepheline Samples From Africa
The atom coordinates are similar for each sample (Table 3). After the <T-O> distances were computed, the Al1 and Si1 positions on one hand, and Al2 and Si2 positions on the other had to be interchanged in phase 3c because of the resulting <T-O> distances (see Table 3). The long and short average <T-O> distances correspond to Al-rich and Si-rich T sites, respectively (Table 4). These distances indicate some Al-Si order because the average <Al-O> distance is larger than the average <Si-O> distance. Average <T-O> distances of about 1.61 and 1.74 Å correspond to filled Si and Al sites, respectively, and indicate complete Si-Al order, whereas an average <T-O> distance of about 1.68 Å corresponds to complete Al-Si disorder (Hassan et al., 2004, 2006). A high degree of disorder is observed in samples 1, 2, and phase 3b because their average <T-O> distances are close to 1.68 Å (Table 4). Phases 3a and 3c contain some Al-Si order.
The O1 position may not be located accurately because of O1 disorder, so the Na-O1 distance is not included in the average <Na-O> [7] distance. The average <K-O> [9] and <Na-O> [7] distances can be rationalized with the atoms occupying the A and B sites, their sofs, and their effects on the unit-cell volume, V. Two excellent linear relations are observed for the samples used in this study (Figures 7A,B). The average <Na-O> [7] distances vary linearly with Na(sof) and with V. The average <Na-O> [7] distances and V are large for phases 3b and 3c because they contain K atoms in the B site. Increase in Na(sof) causes the average <Na-O> [7] distance and V to increase because of increasing amounts of K atoms entering the B site. Phases 3b and 3c have the highest Na(sof) and have the largest average <Na-O> distance and V (Figures 7A,B). Although phases 3b and 3c have the largest but same Na(sof), the <Na-O> [7] distance in phase 3b is slightly shorter than that for phase 3c probably because phase 3b contains more Ca atoms in the B site. Phase 3a must contain some K atoms in the B site because <Na-O> is larger than that for samples 1 and 2. The B site in sample 1 is filled with the maximum amount of Na atoms (=6), which is confirmed by the structure refinement that gives Na(sof) = 0.988(2), average <Na-O> [7] = 2.630 Å, and V = 726.431(1) Å3. These are considered as base point values, so if Na(sof), <Na-O>, and V increase from these base values, only K atoms could enter the B site, and not smaller Ca2+ cations or vacancies. If average <Na-O> and V decrease from the base values, then some Ca atoms must enter the B site. If Ca atoms occur in the B site, the Na(sof) will increase, but not the average <Na-O> distance. It is important to note that K atoms begin to enter the B site between samples 1 and 2, where no significant structural changes are observed.
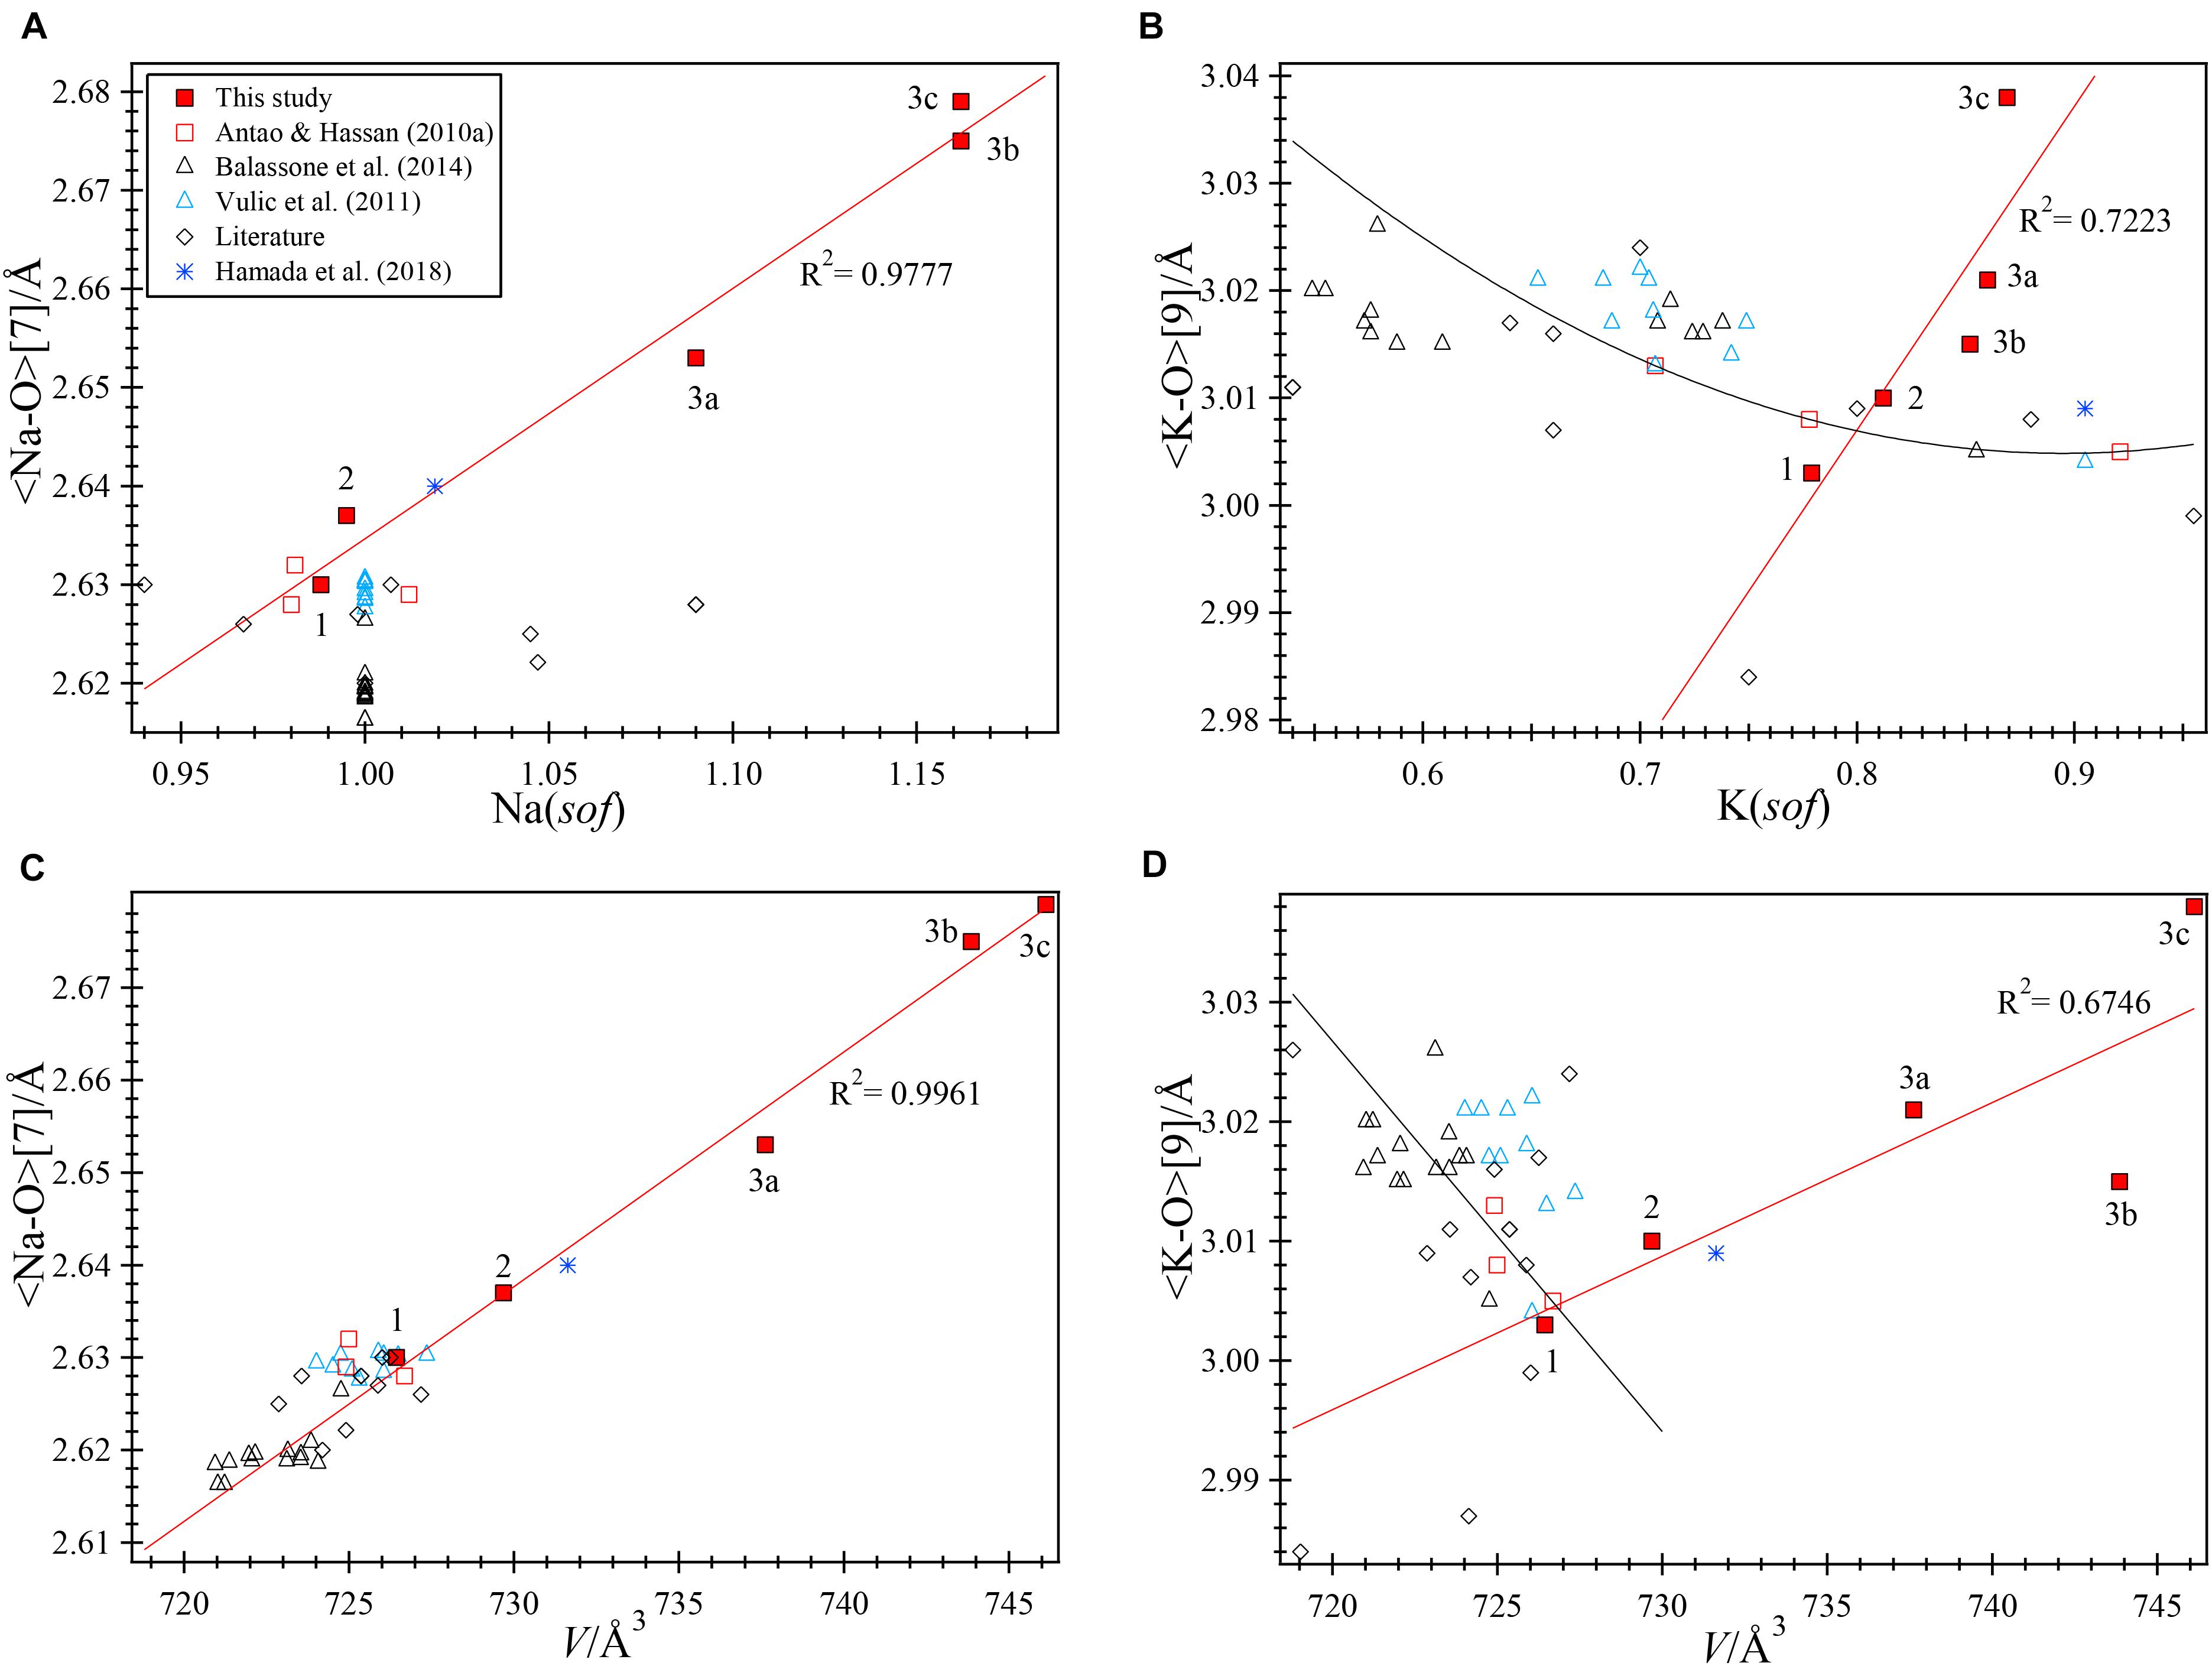
FIGURE 7. Structural variations in natural nepheline samples. The linear red trend lines are based on data for the three samples from this study containing five data points (1, 2, 3a, 3b, and 3c). The black trend lines are fitted to the three samples from Bancroft (Antao and Hassan, 2010b). (A) A good linear relation is observed between <Na-O> [7] and Na(sof) with R2 = 0.9777, but data for many other natural nepheline samples from the literature do not fall close to this trend line. “Literature” sources are given in the text. Note that Na(sof)> 1 for some of the samples from the literature. (B) A linear relation occurs between <Na-O> [7] and V (R2 = 0.9961). Data for all the natural nepheline samples fall close to this linear line. (C) An approximately linear relation is observed between <K-O> and K(sof) (R2 = 0.7223) for samples from this study, but data for most other samples fall near the non-linear black line. The average <K-O> distances occur within a narrow range. (D) A poor linear relation occurs between <K-O> and V for samples from this study, but most other samples fall close to the linear black line.
The average <Na-O> distances of all the samples studied by Balassone et al. (2014) are very similar to each other, which is consistent with full occupancy of the B site with Na atoms, so their Na(sof) was fixed at 1 (Figure 7A). Similar results were obtained for another set of samples (Vuliæ et al., 2011).
Vacancies and K atoms are present in the A site, but K(sof) influence on the V and <K-O> [9] are not strongly correlated (Figures 7C,D). The K(sof) vary from about 0.78 to 0.87 in our three samples and it varies approximately linearly with <K-O> (Figure 7C) and this distance increases approximately linearly with V (Figure 7D). Although K(sof) is changing, the average <K-O> distance changes within a narrow limit (about 0.06 Å) and most samples have values between 3 and 3.03 Å. Phases 3b and 3c contain the most K atoms in the B site and have the largest V. In terms of average <K-O> distance and V, nepheline samples may be placed in two groups (Figure 7D). One group contains K atoms in the B site (samples 2, 3, and that from Hamada et al., 2018) and the other group contains no K atoms in the B site and includes most of the other samples that fall close to the linear black line.
Conclusion
Natural nepheline has a small excess of Si over Al atoms and vacancies occur in the A site. The Na/K ratio deviates from 3:1 in the ideal formula, K2Na6[Al8Si8O16]. Our volcanic nepheline samples contain a high degree of Al-Si disorder in samples 1, 2, and 3b. Vacancies occur in the A site because of the (Na,K)+Al3+ = ☐Si4+ substitution (this may also be written as (Na,K)Al☐-1Si-1). If the B site is filled, Na and Ca substitute for K atoms in the A site, as in sample 1. The 2(K,Na)+ = ☐Ca2+ substitution (or 2(K,Na)☐-1Ca-1) also introduces vacancies in the A site. The above substitutions give rise to Na-rich nepheline solid solutions. The substitution of K for Na atoms in the B site gives rise to K-rich nepheline solid solutions, as in samples 2 and 3. The plagioclase feldspar substitution [CaAlNa-1Si-1] plays an insignificant role in the nepheline-kalsilite series. There is no significant change in unit-cell or structural parameters when K atoms enter the B site. The average <Na-O> [7] distance increases linearly with Na(sof) and V across nepheline solid solutions.
Author Contributions
SA selected the crystals and did the structure refinements. JN collected the samples and obtained the chemical compositions.
Conflict of Interest Statement
The authors declare that the research was conducted in the absence of any commercial or financial relationships that could be construed as a potential conflict of interest.
Acknowledgments
We thank the two reviewers and the Editor, F. Brunet, for useful comments that helped to improve this manuscript. Robert Marr is thanked for his help with the EPMA analysis. The HRPXRD data were collected at beamline 11-BM, Advanced Photon Source, Argonne National Laboratory. Use of the Advanced Photon Source was supported by the United States Department of Energy, Office of Science, Office of Basic Energy Sciences, under Contract No. DE-AC02-06CH11357. This work was supported with a NSERC Discovery Grant to SA.
References
Angel, R. J., Gatta, G. D., Boffa Ballaran, T., and Carpenter, M. A. (2008). The mechanism of coupling in the modulated structure of nepheline. Can. Mineral. 46, 1465–1476. doi: 10.3749/canmin.46.6.1465
Antao, S. M. (2013). Three cubic phases intergrown in a birefringent andradite-grossular garnet and their implications. Phys. Chem. Miner. 40, 705–716. doi: 10.1007/s00269-013-0606-4
Antao, S. M., and Cruickshank, L. A. (2016). Two cubic phases in kimzeyite garnet from the type locality Magnet Cove, Arkansas. Acta Crystallogr. B72, 846–854. doi: 10.1107/S2052520616014700
Antao, S. M., and Hassan, I. (2010a). A two-phase intergrowth of genthelvite from Mont Saint-Hilaire, Quebec. Can. Mineral. 48, 1217–1223. doi: 10.3749/canmin.48.5.1217
Antao, S. M., and Hassan, I. (2010b). Nepheline: structure of three samples from the bancroft area, Ontario, obtained using synchrotron high-resolution powder x-ray diffraction. Can. Mineral. 48, 69–80. doi: 10.3749/canmin.48.1.69
Antao, S. M., Hassan, I., Wang, J., Lee, P. L., and Toby, B. H. (2008). State-of-the-art high-resolution powder x-ray diffraction (HRPXRD) illustrated with rietveld structure refinement of quartz, sodalite, tremolite, and meionite. Can. Mineral. 46, 1501–1509. doi: 10.3749/canmin.46.5.1501
Antao, S. M., and Klincker, A. M. (2013). Origin of birefringence in andradite from Arizona, Madagascar, and Iran. Phys. Chem. Miner. 40, 575–586. doi: 10.1007/s00269-013-0594-4
Antao, S. M., Zaman, M., Gontijo, V. L., Camargo, E. S., and Marr, R. A. (2015a). Optical anisotropy, zoning, and coexistence of two cubic phases in andradites from Quebec and New York. Contrib. Mineral. Petrol. 169:10. doi: 10.1007/s00410-015-1104-0
Antao, S. M., Mohib, S., Zaman, M., and Marr, R. A. (2015b). Ti-rich andradites: chemistry, structure, multi-phases, optical anisotropy, and oscillatory zoning. Can. Miner. 53, 133–158. doi: 10.3749/canmin.1400042
Balassone, G., Kahlenberg, V., Altomare, A., Mormone, A., Rizzi, R., Saviano, M., et al. (2014). Nephelines from the Somma-Vesuvius volcanic complex (southern Italy): crystal-chemical, structural and genetic investigations. Mineral. Petrol. 108, 71–90. doi: 10.1007/s00710-013-0290-6
Buerger, M. J., Klein, G. E., and Donnay, G. (1954). Determination of the crystal structure of nepheline. Am. Mineral. 39, 805–818.
Cagliotti, G., Paoletti, A., and Ricci, F. P. (1958). Choice of collimators for a crystal spectrometer for neutron diffraction. Nucl. Instrum. 3, 223–228. doi: 10.1016/0369-643X(58)90029-X
Capobianco, C., and Carpenter, M. (1989). Thermally induced changes in kalsilite (KAlSiO4). Am. Mineral. 74, 797–811.
Carpenter, M., and Cellai, D. (1996). Microstructures and high-temperature phase transitions in kalsilite. Am. Mineral. 81, 561–584. doi: 10.2138/am-1996-5-604
Dawson, J. B. (1998). Peralkaline nepheline-natrocarbonatite relationships at Oldoinyo Lengai, Tanzania. J. Petrol. 39, 2077–2094. doi: 10.1093/petroj/39.11-12.2077
Deer, W. A., Howie, R. A., and Zussman, J. (1992). An Introduction to the Rock-Forming Minerals, 2nd Edn. New York, NY: John Wiley.
Dollase, W. A. (1970). Least-squares refinement of the structure of a plutonic nepheline. Z. Kristallogr. 132, 27–44. doi: 10.1524/zkri.1970.132.1-6.27
Dollase, W. A., and Peacor, D. R. (1971). Si-Al ordering in nephelines. Contrib. Mineral. Petrol. 30, 129–134. doi: 10.1007/BF00372253
Dollase, W. A., and Thomas, W. M. (1978). The crystal chemistry of silica-rich, alkali-deficient nepheline. Contrib. Mineral. Petrol. 66, 311–318. doi: 10.1007/BF00373415
Donnay, G., Schairer, J. F., and Donnay, J. D. H. (1959). Nepheline solid solutions. Mineral. Mag. 32, 93–109.
Foreman, N., and Peacor, D. R. (1970). Refinement of the nepheline structure at several temperatures. Z. Kristallogr. 132, 45–70. doi: 10.1524/zkri.1970.132.1-6.45
Friese, K., Grzechnik, A., Petøíæek, V., Schönleber, A., van Smaalen, S., and Morgenroth, W. (2011). Modulated structure of nepheline. Acta Crystallogr. B67, 18–29. doi: 10.1107/S0108768110050822
Gregorkiewitz, M. (1984). Crystal structure and Al/Si-ordering of a synthetic nepheline. Bull. Minéral 107, 499–509.
Hahn, T., and Buerger, M. J. (1955). The detailed structure of nepheline, KNa3Al4Si4O16. Z. Kristallogr. 106, 308–338.
Hamada, M., Akasaka, M., and Ohfuji, H. (2018). Crystal chemistry of K-rich nepheline in nephelinite from Hamada, Shimane Prefecture, Japan. Mineral. Mag. doi: 10.1180/mgm.2018.133
Hammond, R. P., and Barbier, J. (1998). Monoclinic and hexagonal nepheline structures of (Na3/4K1/4)AlGeO4. Acta Crystallogr. B54, 211–220. doi: 10.1107/S0108768197013177
Hassan, I., Antao, S. M., and Hersi, A. A. (2003). Single-crystal XRD, TEM, and thermal studies of the satellite reflections in nepheline. Can. Mineral. 41, 759–783. doi: 10.2113/gscanmin.41.3.759
Hassan, I., Antao, S. M., and Parise, J. B. (2004). Sodalite: high temperature structures obtained from synchrotron radiation and rietveld refinements. Am. Mineral. 89, 359–364. doi: 10.2138/am-2004-2-315
Hassan, I., Antao, S. M., and Parise, J. B. (2006). Cancrinite: crystal structure, phase transitions, and dehydration behavior with temperature. Am. Mineral. 91, 1117–1124. doi: 10.2138/am.2006.2013
Hayward, S. A., Pryde, A. K. A., De Dombal, R. F., Carpenter, M. A., and Dove, M. T. (2000). Rigid unit modes in disordered nepheline: a study of a displacive incommensurate phase transition. Phys. Chem. Miner. 27, 285–290. doi: 10.1007/s002690050257
Hovis, G. L., and Crelling, J. A. (2000). The effects of excess silicon on immiscibility in the nepheline-kalsilite system. Am. J. Sci. 300, 238–249. doi: 10.2475/ajs.300.3.238
Hovis, G. L., Mott, A., and Roux, J. (2009). Thermodynamic, phase equilibrium, and crystal chemical behaviour in the nepheline-kalsilite system. Am. J. Sci. 309, 397–419. doi: 10.2475/05.2009.02
Hovis, G. L., and Roux, J. (1993). Thermodynamic mixing properties of nepheline-kalsilite crystalline, solutions. Am. J. Sci. 293, 1108–1127. doi: 10.2475/ajs.293.10.1108
Hovis, G. L., and Roux, J. (1999). Thermodynamics of excess silicon in nepheline and kalsilite crystalline solutions. Eur. J. Mineral. 11, 815–827. doi: 10.1127/ejm/11/5/0815
Hovis, G. L., Spearing, D. R., Stebbins, J. F., Roux, J., and Clare, A. (1992). X-ray powder diffraction and 23Na, 27Al, and 29Si MAS-NMR investigation of nepheline-kalsilite crystalline solutions. Am. Mineral. 77, 19–29.
Larson, A. C., and Von Dreele, R. B. (2000). General Structure Analysis System (GSAS). Los Alamos, NM: Los Alamos National Laboratory Report, LAUR, 86–748.
Lee, P. L., Shu, D., Ramanathan, M., Preissner, C., Wang, J., Beno, M. A., et al. (2008). A twelve-analyzer detector system for high-resolution powder diffraction. J. Synchrotron. Radiat. 15, 427–432. doi: 10.1107/S0909049508018438
McConnell, J. D. C. (1962). Electron-diffraction study of subsidiary maxima of scattered intensity in nepheline. Mineral. Mag. 33, 114–125.
McConnell, J. D. C. (1981). Time-temperature study of the intensity of satellite reflections in nepheline. Am. Mineral. 66, 990–996.
McConnell, J. D. C. (1991). Incommensurate structures. Philos. Trans. R. Soc. Lond. A334, 425–437. doi: 10.1098/rsta.1991.0023
Merlino, S. (1984). “Feldspathoids: their average and real structures,” in Feldspars and Feldspathoids, Nato ASI Series C, ed. W. L. Brown (Dordrecht: D. Reidel Publishing Company), 137, 435–470.
Parker, J. M. (1972). The domain structure of nepheline. Z. Kristallogr. 136, 255–272. doi: 10.1524/zkri.1972.136.3-4.255
Parker, J. M., and McConnell, J. D. C. (1971). Transformation behaviour in the mineral nepheline. Nature 234, 178–179.
Rietveld, H. M. (1969). A profile refinement method for nuclear and magnetic structures. J. Appl. Crystallogr. 2, 65–71. doi: 10.1107/S0021889869006558
Sahama, T. G. (1958). A complex form of natural nepheline form Iivaara, Finland. Am. Mineral. 43, 165–166.
Sahama. T. H. G. (1962). Order-disorder in natural nepheline solid solutions. J. Petrol. 3, 65–81. doi: 10.1093/petrology/3.1.65
Schiebold, E. (1930). Zur strucktur von nepheline and analcim. Naturwiss 1S, 705–706. doi: 10.1007/BF01513361
Simmons, W. B., and Peacor, D. R. (1972). Refinement of the crystal structure of a volcanic nepheline. Am. Mineral. 57, 1711–1719.
Smith, J. V., and Tuttle, O. F. (1957). The nepheline-kalsilite system: i. x-ray data for the crystalline phases. Am. J. Sci. 255, 282–305. doi: 10.2475/ajs.255.4.282
Tait, K. T., Sokolova, E., Hawthorne, F. C., and Khomyakov, A. P. (2003). The crystal chemistry of nepheline. Can. Mineral. 41, 61–70. doi: 10.2113/gscanmin.41.1.61
Thompson, P., Cox, D. E., and Hastings, J. B. (1987). Rietveld refinement of Debye-Scherrer synchrotron x-ray data from alumina. J. Appl. Crystallogr. 20, 79–83. doi: 10.1107/S0021889887087090
Toby, B. H. (2001). EXPGUI, a graphical user interface for GSAS. J. Appl. Crystallogr. 34, 210–213. doi: 10.1107/S0021889801002242
Vuliæ, R., Baliæ-Žuniæ, T., Belmonte, L. J., and Kahlenberg, V. (2011). Crystal chemistry of nephelines from ijolites and nepheline-rich pegmatites: influence of composition and genesis on the crystal structure investigated by x-ray diffraction. Mineral. Petrol. 101, 185–194. doi: 10.1007/s00710-010-0143-5
Wang, J., Toby, B. H., Lee, P. L., Ribaud, L., Antao, S. M., Kurtz, C., et al. (2008). A dedicated powder diffraction beamline at the advanced photon source: commissioning and early operational results. Rev. Sci. Instrum. 79:085105. doi: 10.1063/1.2969260
Keywords: volcanic K-rich nepheline, kalsilite, crystal structure, Al-Si order, HRPXRD, intergrowths
Citation: Antao SM and Nicholls JW (2018) Crystal Chemistry of Three Volcanic K-rich Nepheline Samples From Oldoinyo Lengai, Tanzania and Mount Nyiragongo, Eastern Congo, Africa. Front. Earth Sci. 6:155. doi: 10.3389/feart.2018.00155
Received: 11 July 2018; Accepted: 24 September 2018;
Published: 22 October 2018.
Edited by:
Fabrice Brunet, UMR5275 Institut des Sciences de la Terre (ISTERRE), FranceReviewed by:
Anthony Martin Thomas Bell, Sheffield Hallam University, United KingdomMartin Charles Wilding, Sheffield Hallam University, United Kingdom
Copyright © 2018 Antao and Nicholls. This is an open-access article distributed under the terms of the Creative Commons Attribution License (CC BY). The use, distribution or reproduction in other forums is permitted, provided the original author(s) and the copyright owner(s) are credited and that the original publication in this journal is cited, in accordance with accepted academic practice. No use, distribution or reproduction is permitted which does not comply with these terms.
*Correspondence: Sytle M. Antao, antao@ucalgary.ca