
95% of researchers rate our articles as excellent or good
Learn more about the work of our research integrity team to safeguard the quality of each article we publish.
Find out more
ORIGINAL RESEARCH article
Front. Earth Sci. , 17 October 2018
Sec. Volcanology
Volume 6 - 2018 | https://doi.org/10.3389/feart.2018.00147
This article is part of the Research Topic Subaqueous Volcanism, from Ancient Successions to Modern Volcanoes and Modelling View all 9 articles
Silicic effusive eruptions in deep submarine environments have not yet been directly observed and very few modern submarine silicic lavas and domes have been described. The eruption of Havre caldera volcano in the Kermadec arc in 2012 provided an outstanding database for research on deep submarine silicic effusive eruptions because it produced 15 rhyolite (70–72 wt.% SiO2) lavas and domes with a total volume of ∼0.21 km3 from 14 separate seafloor vents. Moreover, in 2015, the seafloor products were observed, mapped and sampled in exceptional detail (1-m resolution) using AUV Sentry and ROV Jason2 deployed from R/V Roger Revelle. Vent positions are strongly aligned, defining NW-SE and E-W trends along the southwestern and southern Havre caldera margin, respectively. The alignment of the vents suggests magma ascent along dykes which probably occupy faults related to the caldera margin. Four vents part way up the steeply sloping southwestern caldera wall at 1,200–1,300 m below sea level (bsl) and one on the caldera rim (1,060 m bsl) produced elongate lavas. On the steep caldera wall, the lavas consist of narrow tongues that have triangular cross-section shapes. Two of the narrow-tongue segments are connected to wide lobes on the flat caldera floor at ∼1,500 m bsl. The lavas are characterized by arcuate surface ridges oriented perpendicular to the propagation direction. Eight domes were erupted onto relatively flat sea floor from vents at ∼1,000 m bsl along the southern and southwestern caldera rim. They are characterized by steep margins and gently convex-up upper surfaces. With one exception, the domes have narrow spines and deep clefts above the inferred vent positions. One dome has a relatively smooth upper surface. The lavas and domes all consist of combinations of coherent rhyolite and monomictic rhyolite breccia. Despite eruption from deep-water vents (most >900 m bsl), the Havre 2012 rhyolite lavas and domes are very similar to subaerial rhyolite lavas and domes in terms of dimensions, volumes, aspect ratio, textures and morphology. They show that lava morphology was strongly controlled by the pre-existing seafloor topography: domes and wide lobes formed where the rhyolite was emplaced onto flat sea floor, whereas narrow tongues formed where the rhyolite was emplaced on the steep slopes of the caldera wall.
Silicic effusive eruptions in deep submarine environments have not yet been directly observed, partly because the deep sea floor is a difficult environment to explore and partly because such eruptions are apparently rare. The majority of our knowledge comes from the study of silicic lavas and domes in ancient submarine successions now exposed on land (e.g., Cas, 1978; Yamagishi and Dimroth, 1985; Kano et al., 1991). However, such studies have yielded only limited information on the lava morphology and dimensions; also, the duration of lava emplacement, the details of the original setting and the water depth at the vent are typically poorly constrained.
Recently, autonomous underwater vehicles (AUVs) and remotely operated vehicles (ROVs) have allowed high-resolution observation and strategic sampling of silicic lavas on the modern sea floor, adding significantly to data on their characteristics. For example, Allen et al. (2010) utilized ROV to document the morphological and textural differences among rhyolite lava domes at Sumisu-I knoll, Izu-Bonin arc. At Myojin-knoll caldera, 70 km farther north, Honsho et al. (2016) produced a high-resolution AUV map of an intracaldera rhyolite dome. A series of studies in the Manus Basin, Papua New Guinea, including high-resolution bathymetry, seafloor observation, and sampling by underwater vehicles as well as drilling (Ocean Drilling Program Leg 193), provided a detailed description of a deep submarine dacite dome and lava complex on the modern sea floor (Bartetzko et al., 2003; Paulick et al., 2004; Binns et al., 2007; Thal et al., 2014). Embley and Rubin (2018) described dacitic lavas and domes in the northeastern Lau Basin that had been explored using multibeam sonar, camera tow and dredging.
This paper extends our understanding of deep submarine silicic lavas by adding examples produced during the 2012 eruption at Havre caldera, the first of such eruptions to be witnessed (Carey et al., 2018). The eruption produced 15 separate rhyolite lavas and domes from 14 vents between ∼880 m and 1,280 m bsl. In some cases, rhyolite was erupted onto flat sea floor and in others, it traversed steep slopes. The lavas and domes have been mapped using exceptionally high-resolution bathymetry, observed by video and still photography, and sampled. We present detailed information on dimensions, volumes, aspect ratios, textures, surface features, and morphology, and explore the influence of vent depth and substrate slope on lava morphology. We also compare these submarine rhyolite lavas and domes with subaerial counterparts, and demonstrate that despite eruption in more than 900 m of seawater, the Havre rhyolite lavas and domes are very similar to subaerial rhyolite lavas and domes.
The eruption of Havre caldera volcano (31°6.5′ S, 179°2.45′ W) in the Kermadec arc in 2012 (Figure 1A) was first detected by the appearance of extensive floating pumice rafts on 18th July, 2012 (Global Volcanism Program, 2012; Carey et al., 2014; Jutzeler et al., 2014; Carey et al., 2018). Carey et al. (2018) estimated the bulk volume of pumice in the rafts to be ∼1.2 km3. On the 15th October, 90 days after the production of the pumice rafts, R/V Tangaroa of NIWA (National Institute of Water and Atmospheric Research) visited the area and acquired bathymetry at Havre. In 2015, the MESH (Mapping, Exploration, & Sampling at Havre) voyage was conducted in order to perform more detailed investigation of the 2012 eruption products on the sea floor. As well as rhyolite lavas and domes, the 2012 eruption generated a layer of giant pumice (GP) clasts (GP deposit; ∼0.1 km3 bulk) and small-volume pyroclastic deposits (ash-lapilli-block deposit and ash-lapilli deposit; <0.07 km3 bulk) on the sea floor (Carey et al., 2018). Data were collected using two unmanned vehicles, Jason2 ROV and Sentry AUV from the US National Deep Submersible Facility. The AUV Sentry created a high-resolution bathymetry map covering the Havre caldera and adjacent areas. The ROV Jason2 operated in tandem, traversing the sea floor and sampling.
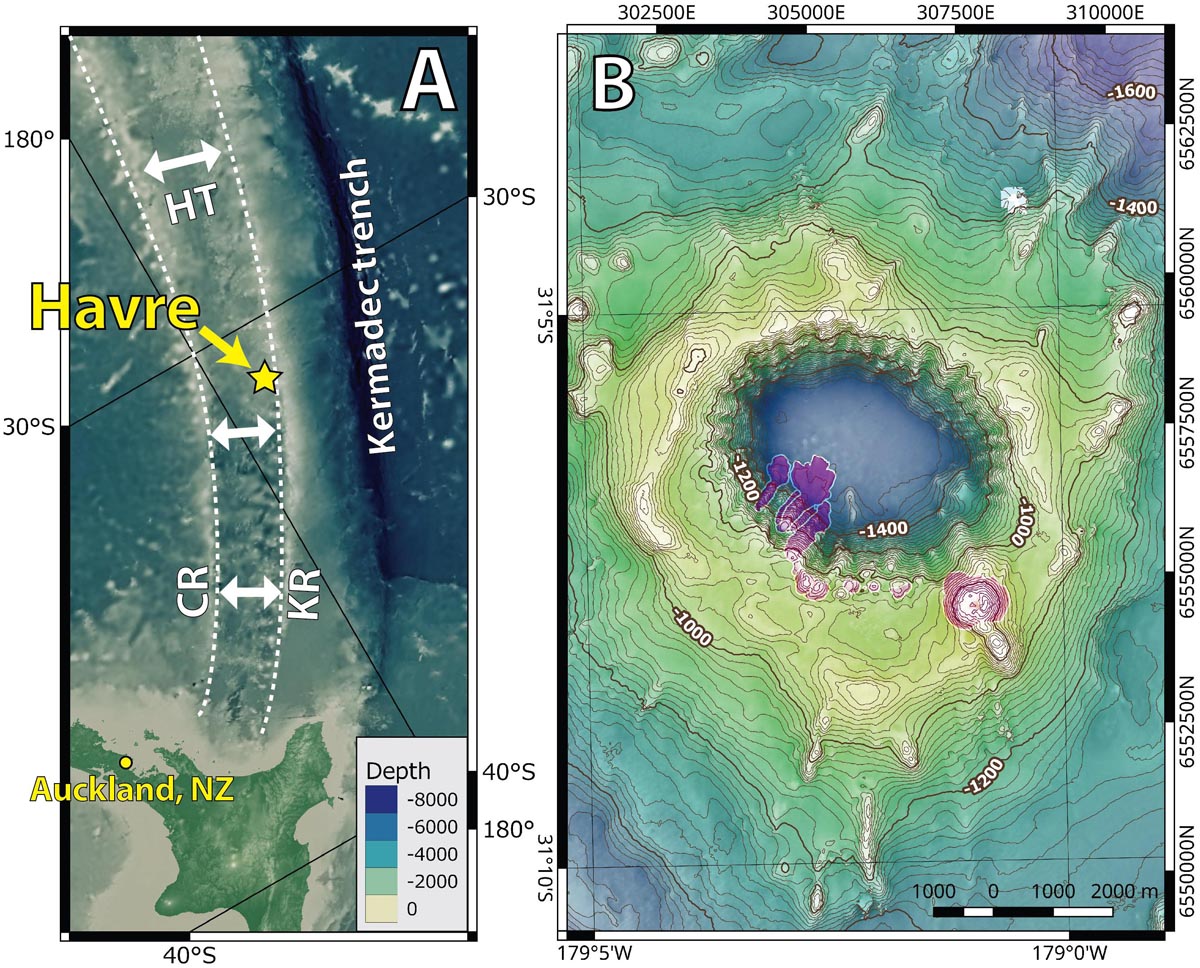
FIGURE 1. (A) The position of Havre caldera in the Kermadec arc (General Bathymetric Chart of the Oceans, 2014). Major tectonic features of the Kermadec arc are: Kermadec trench, Kermadec ridge (KR), Havre Trough (HT), and Colville Ridge (CR); (Wright et al., 2006). (B) Bathymetry map of Havre caldera in 2012 after the eruption (Carey et al., 2014). Approximate extent of the 2012 rhyolite lavas and domes shaded purple based on MESH 2015 data.
The MESH cruise acquired two bathymetry datasets with different platforms. The EM122 multi-beam echo sounder (12 kHz) on R/V Roger Revelle provided data resolution to create a 25-m gridded Digital Elevation Model (DEM) of the Havre caldera and surrounding areas. High-resolution bathymetry data (1-m gridded DEM) were collected with a Reson SeaBat 7125 multi-beam echo sounder (400 kHz) on the AUV Sentry. The Sentry bathymetry data cover 56.5 km2 (total 465 km track; Supplementary Figure S1).
Two other bathymetric DEMs acquired in the past are also used for comparison. The earlier data were acquired in 2002 (Wright et al., 2006) by the R/V Tangaroa which was equipped with a Simrad EM300 multi-beam echo sounder (30 kHz). The later data were acquired by the same R/V Tangaroa in 2012, 90 days after the pumice rafts appeared in the satellite imagery (Carey et al., 2014), using a Kongsberg EM302 multi-beam echo sounder (30 kHz) which allows the creation of an approximately 24-m gridded DEM. The topographic differences between the DEMs were calculated by Raster Calculator of QGIS 2.14 after datum and projection of the grids were adjusted to Zone 1S of Universal Transverse Mercator projection. The DEMs are referenced to best fit the AUV bathymetry data.
The ROV Jason2 conducted 12 dives (J2-802–J2-813) and traversed 50 km of sea floor over 238.5 h. The traverses were recorded by three video cameras and two still cameras. The dives covered the floor, walls, and rims of the Havre caldera (Supplementary Figure S2). Dives 802–808, 811, and 813 were dedicated to the investigation of the 2012 rhyolite lavas and domes, whereas the other dives observed the eastern, northern, and western part of the caldera. Eighty-nine lava and dome samples were collected during the ROV Jason2 traverses (Supplementary Figures S3–S5). A subset of 41 lava and dome samples was examined by both an optical microscope and scanning electron microscope (SEM). Whole-rock X-ray Fluorescence analyses of samples from each of the lavas and domes have been published in Carey et al. (2018).
Havre is a 5-km-wide caldera (Wright et al., 2006); the caldera rim is situated at ∼1,000 m bsl and the floor is at ∼1,500 m bsl (Figure 1B). Very little is known about the formation of Havre caldera. Wright et al. (2006) recovered samples of basalt, andesite, and dacite lavas and intrusions thought to form the pre-caldera sequence.
Comparison of the 2002 and 2012/2015 bathymetry shows that the 2012 eruption changed the southern and southwestern caldera margin dramatically, with the appearance of 15 new lavas and domes (Figure 2 and Supplementary Figure S6). Syn-eruptive mass-wasting events also modified the western and southwestern caldera margin and the caldera floor. No significant changes have been recognized elsewhere on the edifice. The lavas and domes have been labeled A to P from west to east. Note that J is also a silicic dome but it was already present in 2002. The 2012 lavas and domes are rhyolitic, ranging between 70.7 and 72.5 wt.% SiO2 (Carey et al., 2018). Vents for the lavas and domes are located around the southwestern and southern margin of the caldera (Figure 2). The vents extend along 4.2 km of the caldera perimeter, the total length of which is 15 km. Five of the vents (A to E) are part way up the steep southwestern caldera wall and the rest (F to I, K to P) are on the southwestern and southern rim of the caldera.
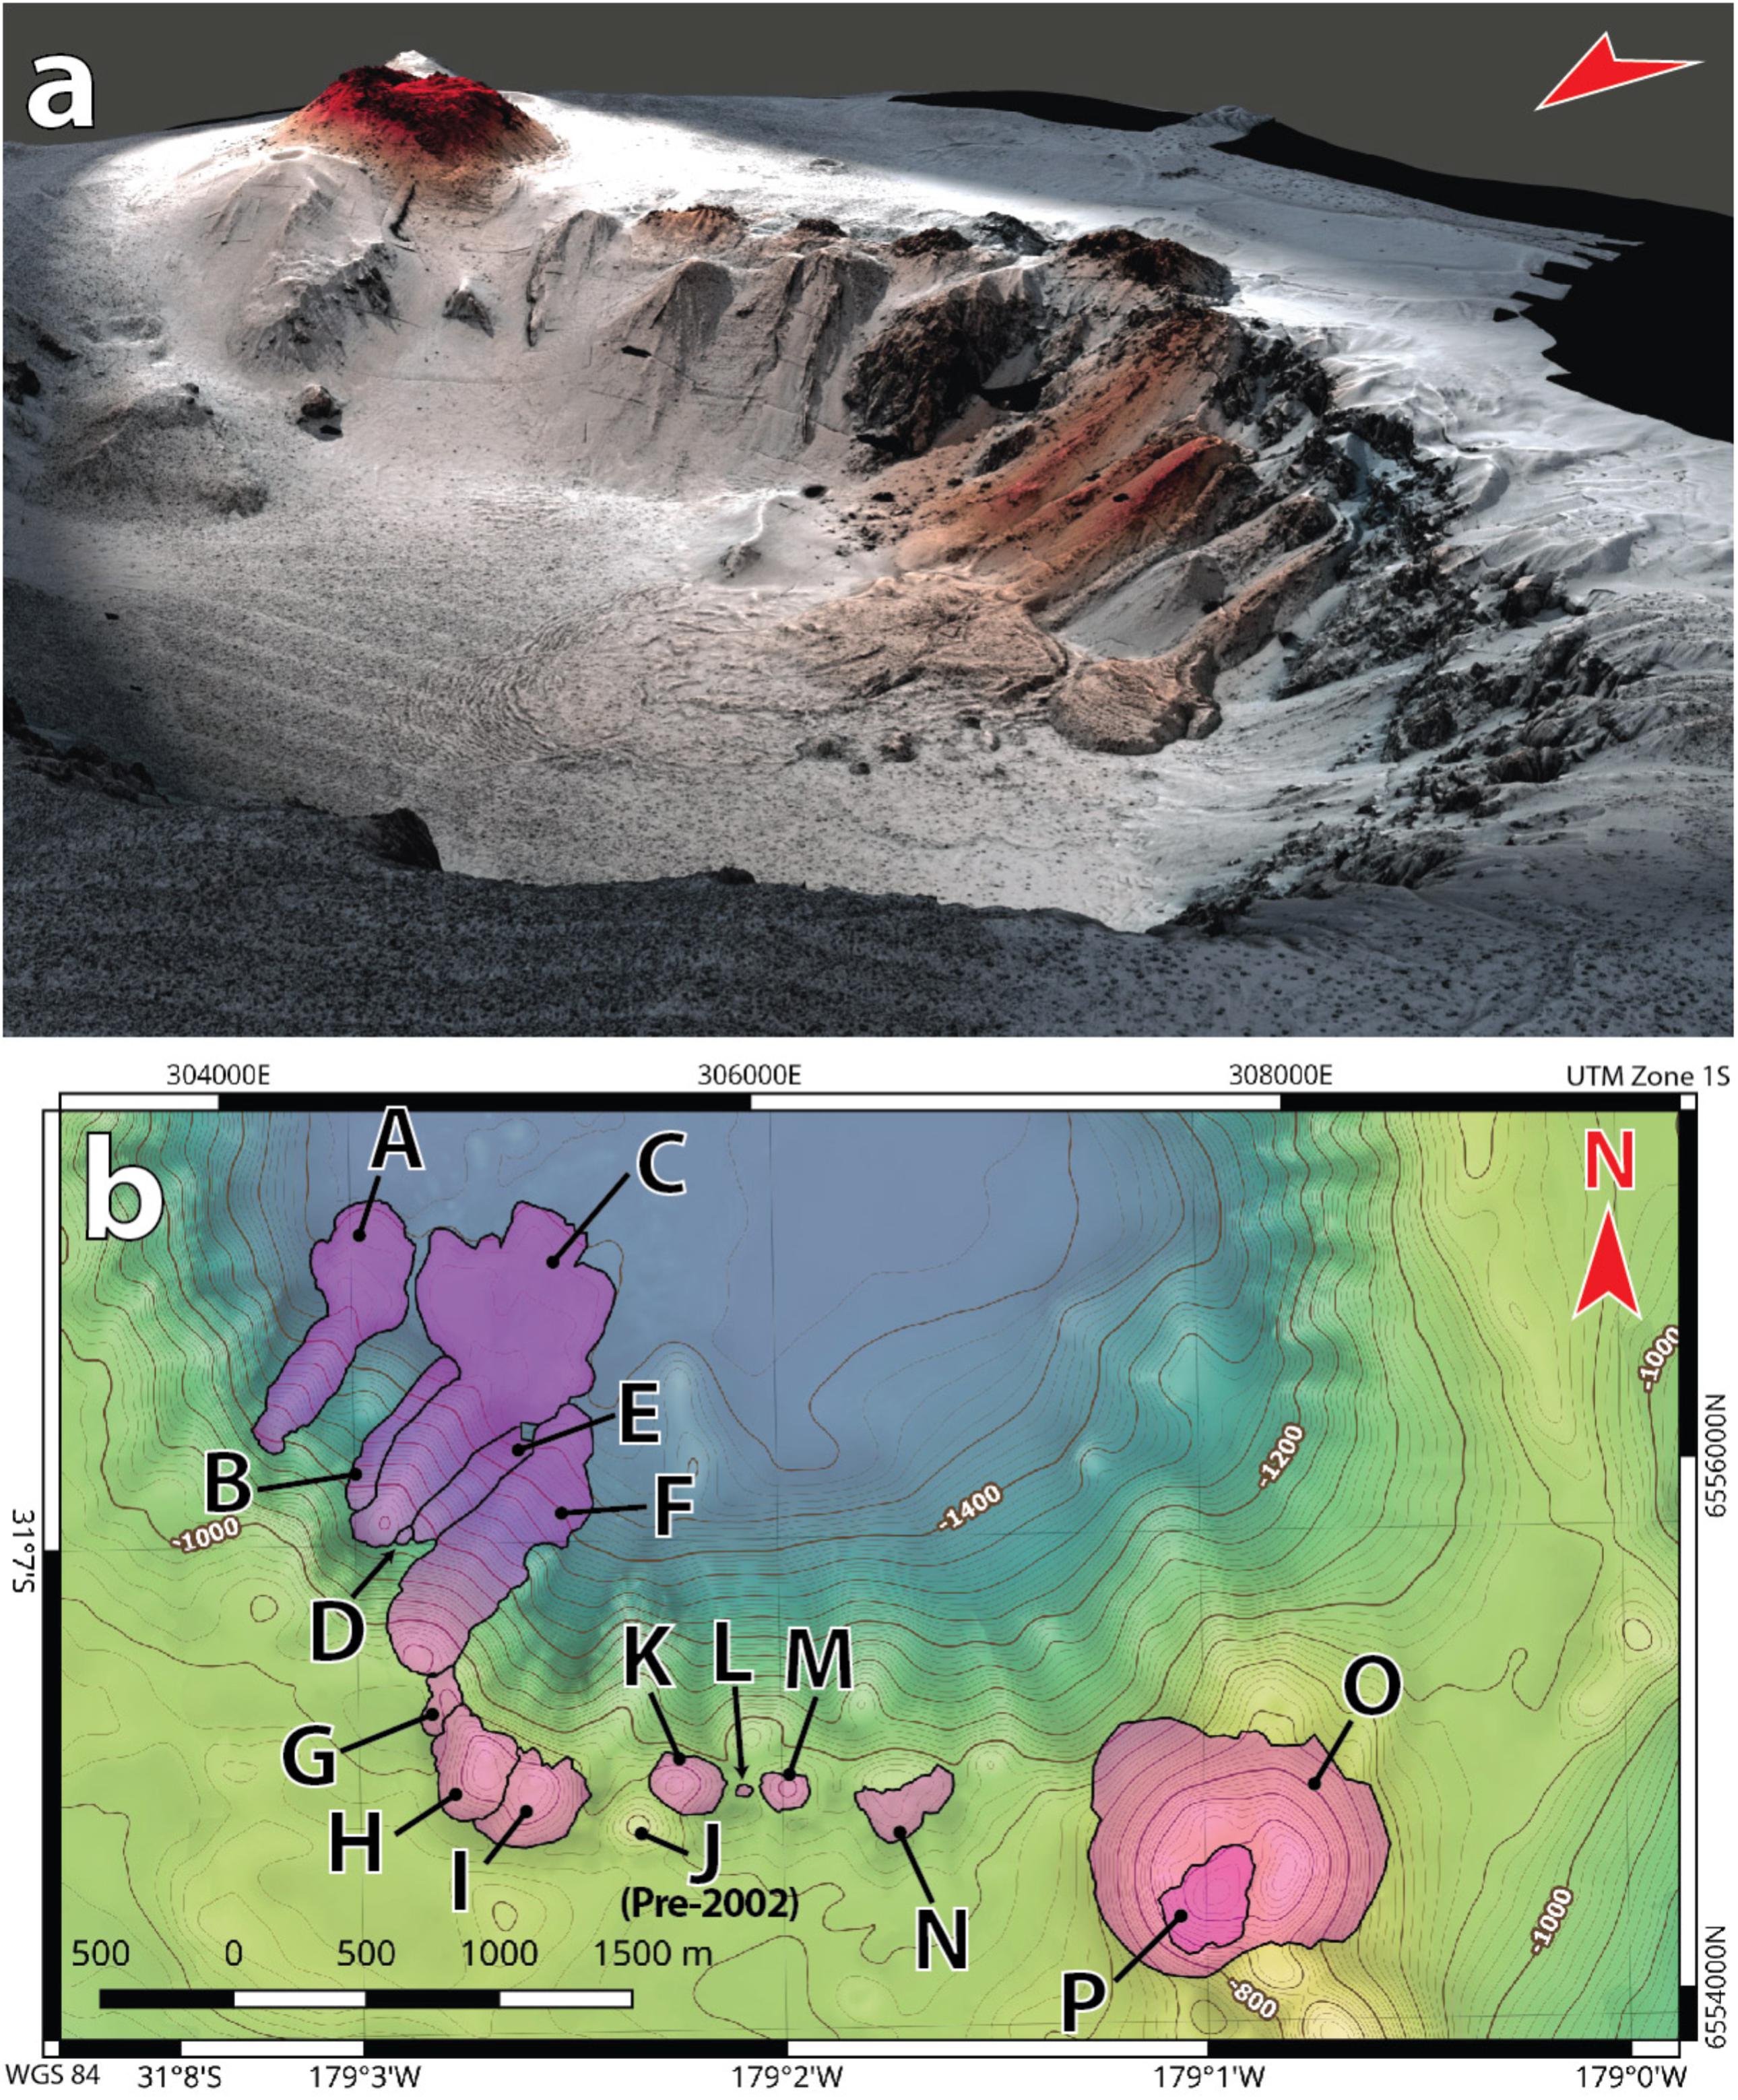
FIGURE 2. (a) 3D-rendered high-resolution AUV bathymetry map (2015) showing the southern margin of Havre caldera, viewed from the northwest. The red shade indicates areas where there is a positive topographic change between 2002 and 2015. (b) Contour map showing the southern caldera margin and the extent of 2012 lavas and domes determined by morphological and visual observations. Note that J is a pre-2002 dome which was already present in 2002 bathymetry.
The typical texture is porphyritic (<5 modal% phenocrysts, 100–500 μm) (Figure 3) and microlite-rich (>60 modal%) in glassy groundmass (Figure 4). The phenocryst population comprises plagioclase, pyroxene, and Fe-Ti oxides, and a minor amount of quartz and apatite. The microlites are mainly plagioclase (>70 modal%); pyroxene (∼20 modal%) and Fe-Ti oxides (∼10 modal%) make up the rest. The vesicularity varies from <5 modal% to >50 modal%. The most vesicular samples (>50 modal%; e.g., L and the carapace of G) have a pumiceous texture and are exceptionally poor (<5 modal%) in microlites although their phenocryst populations are the same as in other samples collected. Extremely elongate vesicles and bands characterized by different microlite contents are common in the carapace of G (Figures 3c, 4d); L samples are microvesicular.
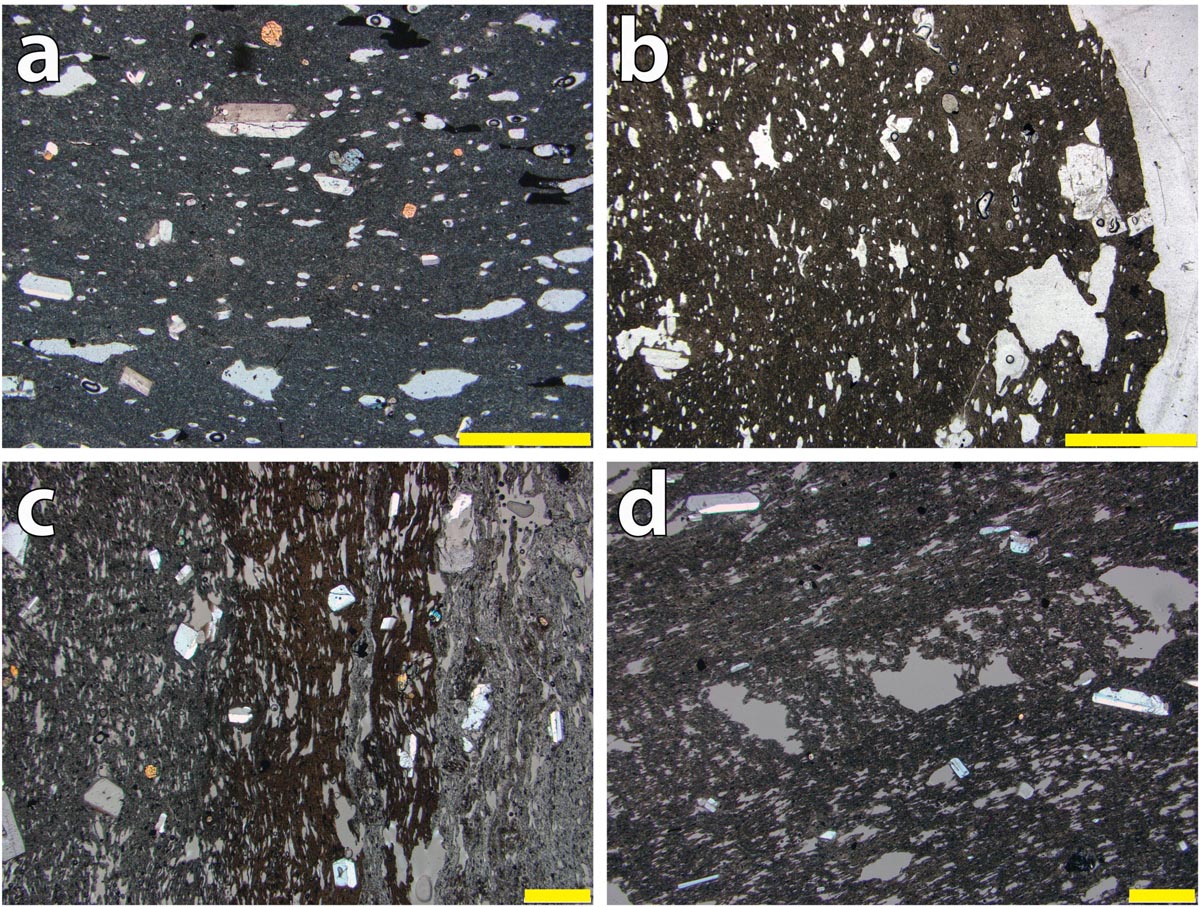
FIGURE 3. Photomicrographs of Havre 2012 rhyolite lava and dome samples. The yellow bars are 1 mm long. (a) XPL image of HVR141 from C, representing typical low-vesicularity texture (<15 modal% vesicles) and glassy groundmass. Plagioclase and pyroxene phenocrysts are <1 mm and sparse (<10 modal%). (b) PPL image of HVR144 from C, showing abundant small vesicles. The groundmass contains abundant microlites. (c) XPL image of HVR099 from L, showing dark gray, black, and pale gray groundmass bands defined mainly by differences in microlite abundance. (d) XPL image of HVR090 from I, showing heterogeneous vesicularity and irregular-shaped vesicles forming a band.
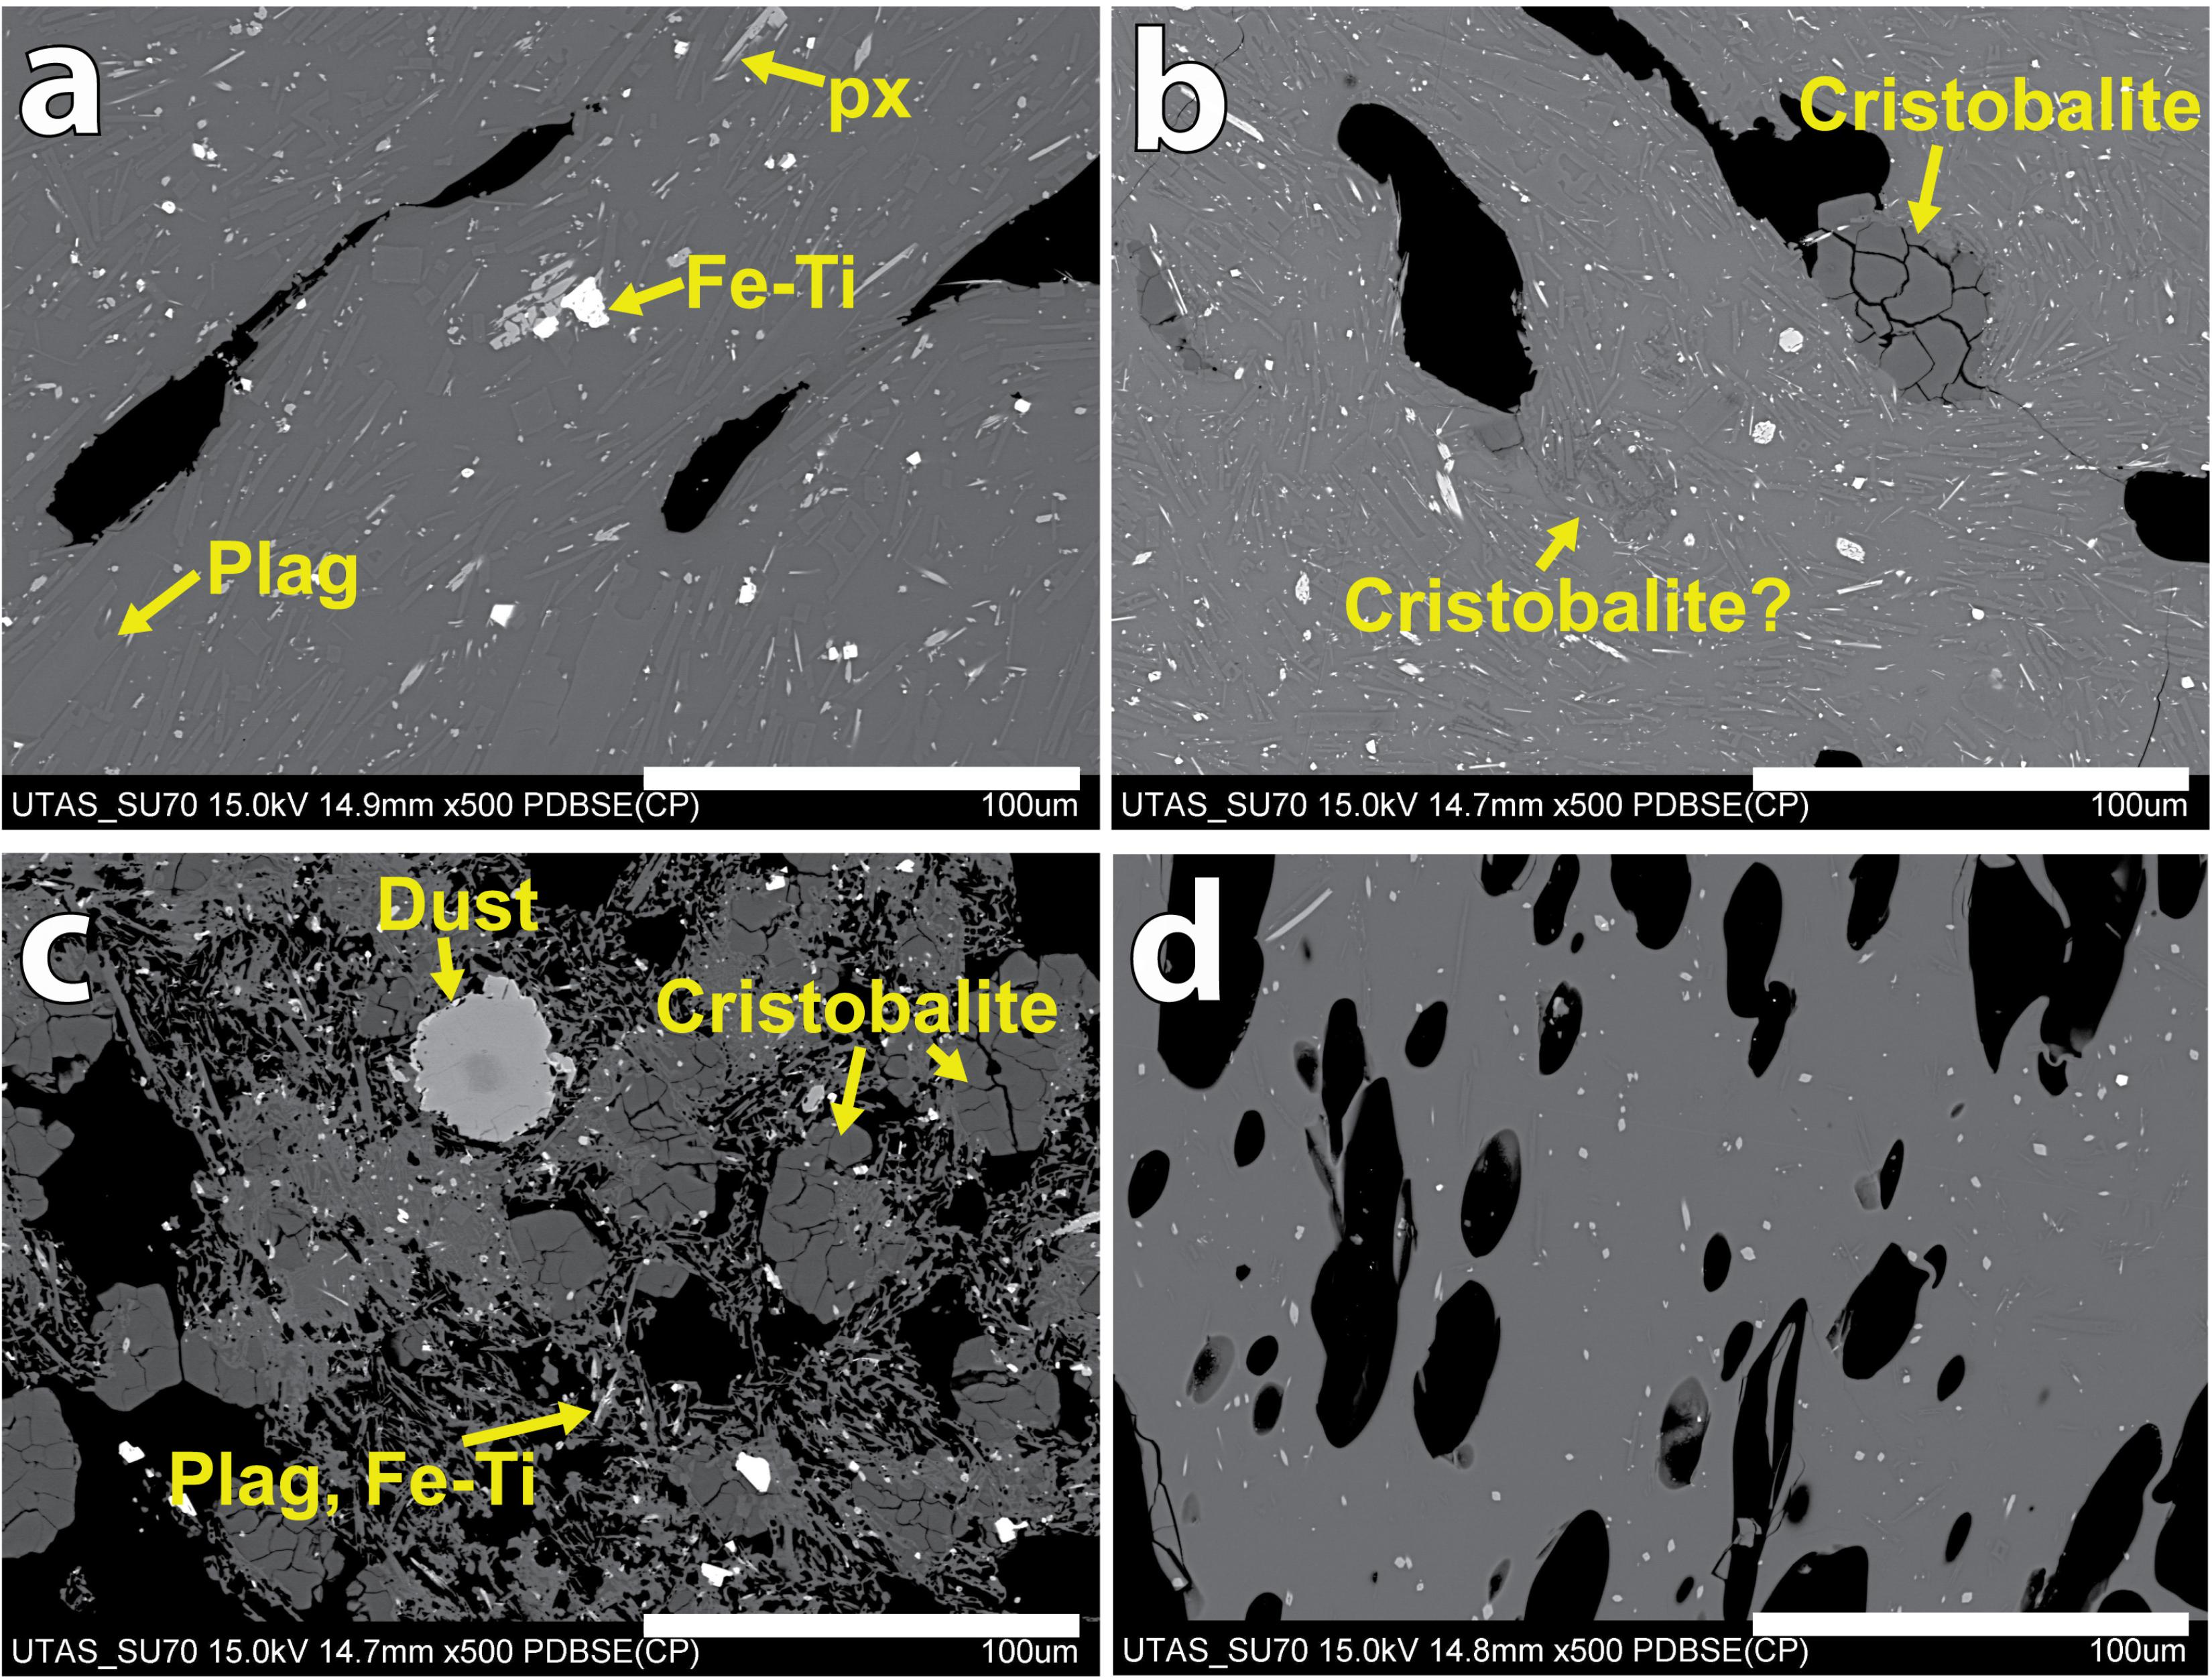
FIGURE 4. Backscatter Scanning Electron Microscope images of Havre 2012 rhyolite lava and dome samples. (a) Microlite-rich (∼70 modal% microlites) groundmass of HVR147 from C which is typical of Havre 2012 lavas. The microlites consist of plagioclase (gray, almost indistinguishable from the glass), pyroxene (pale gray), and Fe-Ti oxides (white) which are ubiquitous in all Havre 2012 lavas. (b) Microlite-rich groundmass of HVR088 from H. Cristobalite is present in the both groundmass and within vesicles. A patch of cristobalite is also present in the groundmass. (c) Glass-free groundmass texture of HVR010 from O. Cristobalite is abundant; plagioclase and Fe-Ti oxide microlites are also present. Note that the large pale gray feature is aluminum foil dust attached during drying of the section. (d) Microlite-poor (<5 modal% microlites) groundmass of HVR085 from the vesicular carapace of G.
Cristobalite is common in the microlite-rich samples. Cristobalite is a high-temperature devitrification or vapor-phase crystallization product (Baxter et al., 1999; Horwell et al., 2013). The size (typically ∼50 μm) and amount of cristobalite are highly variable in the Havre rhyolite samples although the abundance is commonly higher in microlite-rich samples. Cristobalite occurs in vesicles or groundmass (Figure 4b), and in extreme cases, cristobalite has completely replaced the groundmass (Figure 4c). The Havre cristobalite is identical to cristobalite found in subaerial silicic lava domes (e.g., Horwell et al., 2013; Schipper et al., 2015).
The Havre 2012 rhyolites are divided into lavas (A, B, C, E, F) and domes (D, G to I, K to P) (Figure 5) based on overall morphology. All the lavas and domes consist of combinations of coherent rhyolite and monomictic rhyolite breccia. Monomictic rhyolite breccia comprises coarse, angular fragments of dense to pumiceous, massive or flow-banded rhyolite; the fragments are prismatic or polyhedral and bounded by curviplanar surfaces.
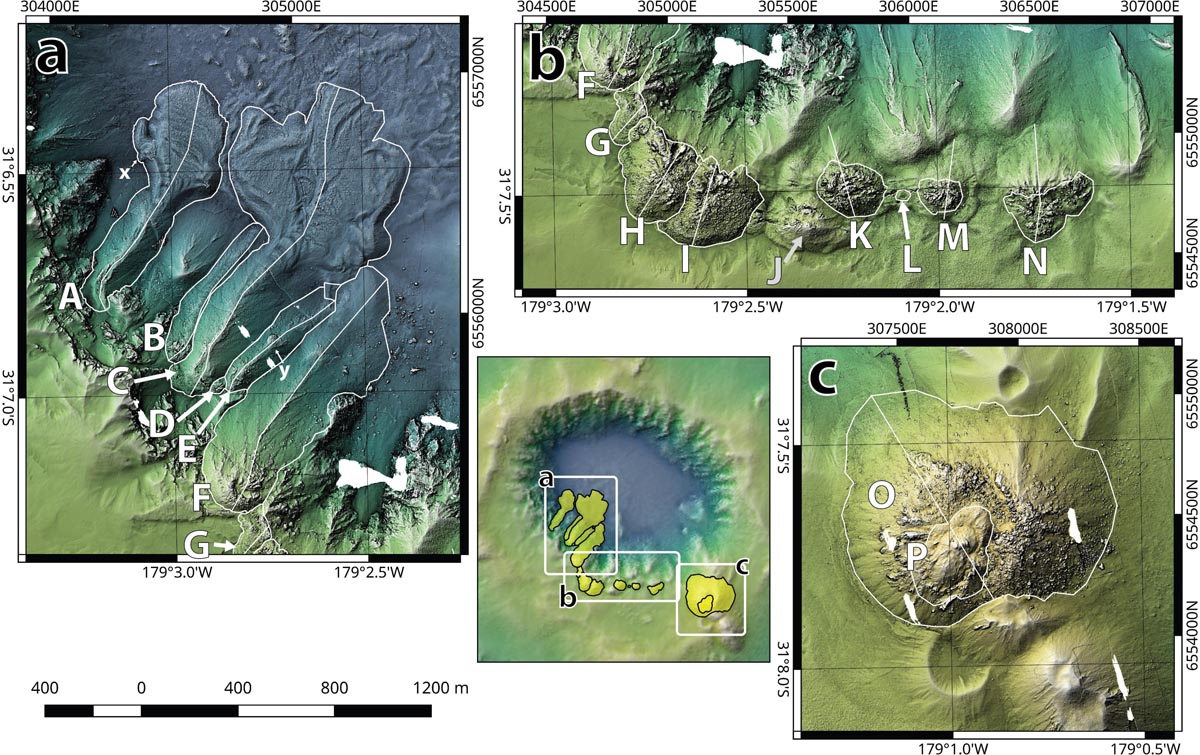
FIGURE 5. Enlarged relief maps (a–c) based on AUV bathymetry map (2015) of the Havre 2012 lavas and domes. The extent of each map is shown in the small inset map. The capital letters identify the lavas and domes following Figure 2b. The bright lines are the profiles given in Figure 6. Lower case letters “x” and ‘y” indicate the areas shown in detail in Figure 9.
The lavas are narrow, elongate tongues of rhyolite that were erupted from the vents on the southwestern caldera wall and rim, and descended 300–600 m to the caldera floor (Figure 5a). Lavas A and C extended farther across the caldera floor (A, ∼450 m; C, ∼650 m) and also spread laterally. The lavas have relatively high aspect ratios (lateral extent:thickness; Walker, 1973; 5.5–47.7; Supplementary Table S1). The domes on the other hand were erupted from vents on the southwestern and southern caldera rim (Figures 5b,c), except for D which is on the southwestern caldera wall. The domes are round or oval in plan view although G, H, and I have been truncated along their northeastern edges by a mass-wasting scarp. The domes have relatively low aspect ratios (lateral extent:thickness; 2.0–3.8; Supplementary Table S1).
The combination of bathymetric differences (2002 versus 2015; Supplementary Figure S7) as well as the precisely mapped extents of the Havre 2012 lavas and domes, have been used to calculate their median thicknesses and volumes (Supplementary Table S1). Near-vent thicknesses of the lavas (A, B, C, E, F) range from 50 to 100 m, and they maintain near-uniform thickness with distance from the source down the steep caldera wall (Figure 6a and Supplementary Figure S8). Most of the domes (G–I, K–N) have maximum thicknesses between 50 and 110 m (Figure 6b). The exception is the largest dome pair, OP, which has a maximum thickness of 210 m. The total volume of all lavas and domes is 0.21 km3. The largest component (>50%; 0.11 km3) of this volume is contained by the dome pair, OP, on the southern caldera margin (Figure 2). The aggregate volume erupted from vents on the southwestern caldera wall (A–F) is also significant (0.08 km3). In comparison, the domes on the southwestern and southern caldera rim (G–I, K–N) are very small (aggregate volume 0.02 km3). The smallest “dome” is L which comprises the top of a rhyolite body still largely contained in its vent and too small to measure.
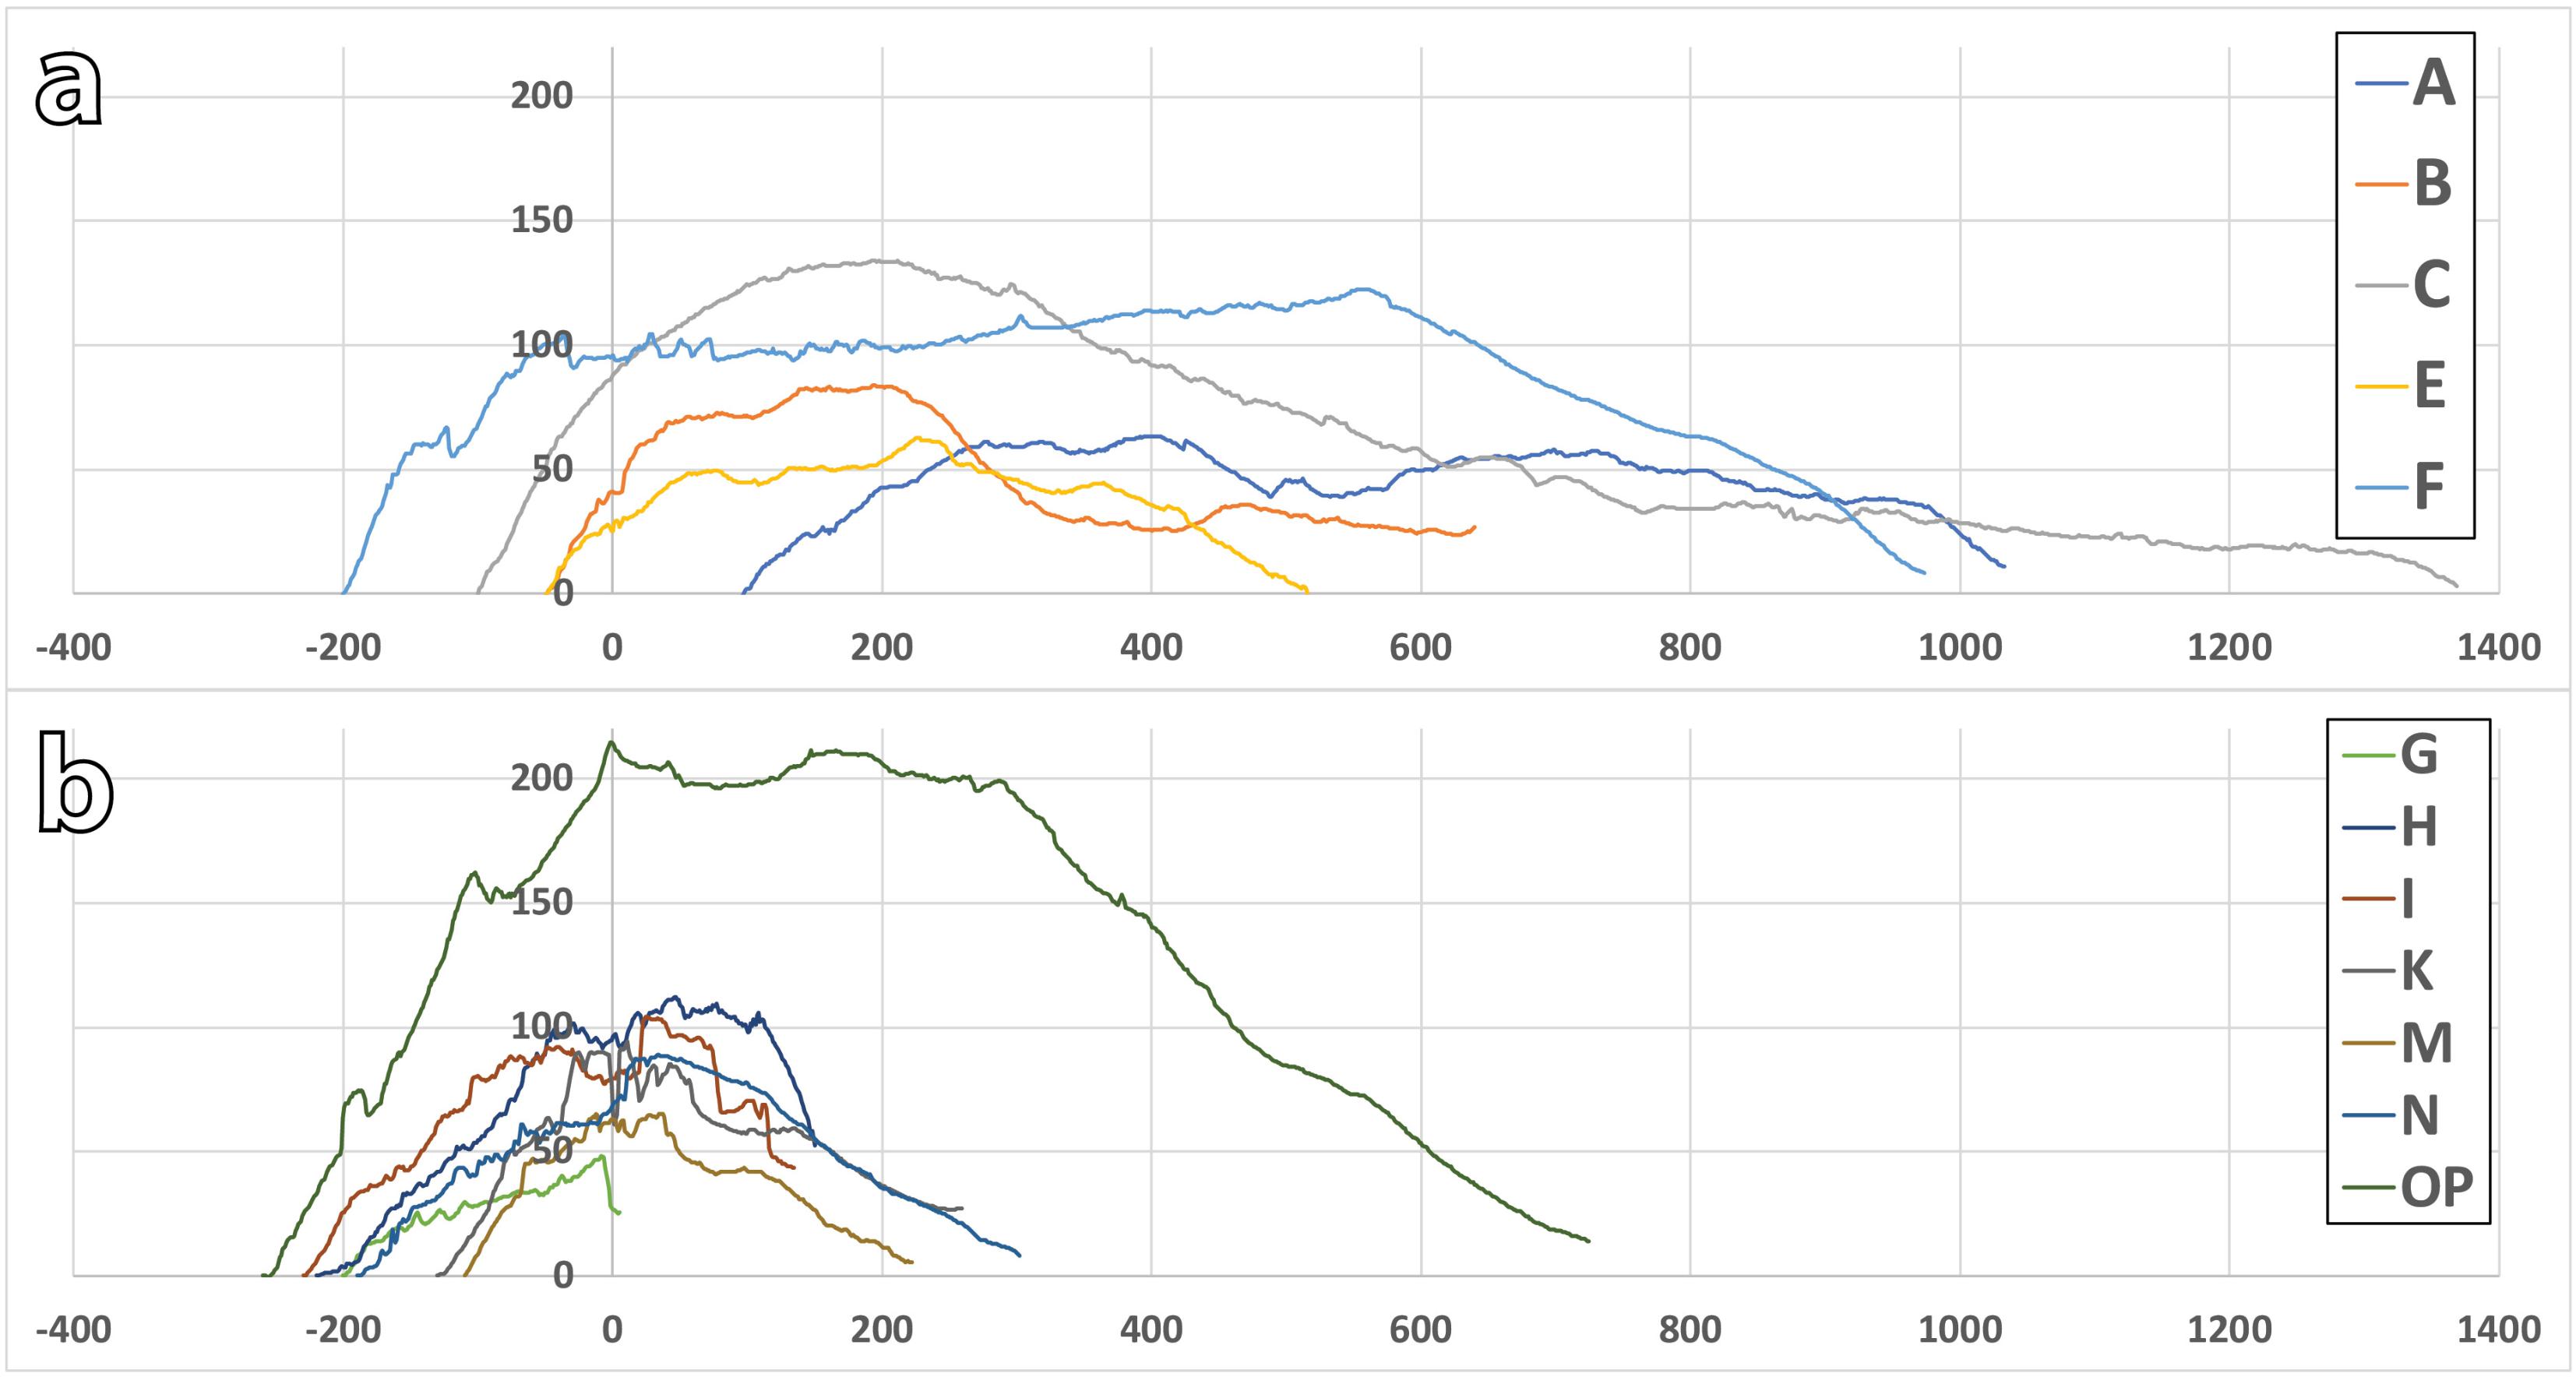
FIGURE 6. Comparison of cross-sections through Havre 2012 lavas and domes. The sections are oriented parallel to the longest dimension of each unit. The profile locations are shown on Figure 5. The caldera rim is at the left and the caldera wall and floor are at the right. The horizontal and vertical scales are in metres. The vertical axis is exaggerated 200% and adjusted to the surrounding topography. The cross-sections are aligned so all the vents are at zero. (a) The lavas that descended the caldera wall (A, B, C, E, F). (b) The domes on the caldera rim (G–I, K–OP). D and L are excluded from the comparison as they are too small. Domes O and P are shown together as the basal topography of dome P is not known.
All the lavas traversed the ∼40° slope of the caldera wall (Figure 7a). On this steep slope, the lavas are narrow tongues, more-or-less triangular in cross-section (∼200 m across and ∼50 m high; Figure 7b). The surfaces of the narrow tongues are almost entirely monomictic rhyolite breccia; sparse exposures of coherent rhyolite occur exclusively at the top of the narrow tongues. Along much of the narrow-tongue segment of A, there is a shallow depression (∼15 m across and <10 m deep; Figure 7b). Lavas A and C also have wide-lobe segments emplaced on the flat caldera floor (Figures 2, 7a,c). The wide-lobe segments have similar rough surfaces to the narrow-tongue segments, composed of monomictic rhyolite breccia; coarsely vesicular coherent rhyolite is locally exposed beneath the breccia.
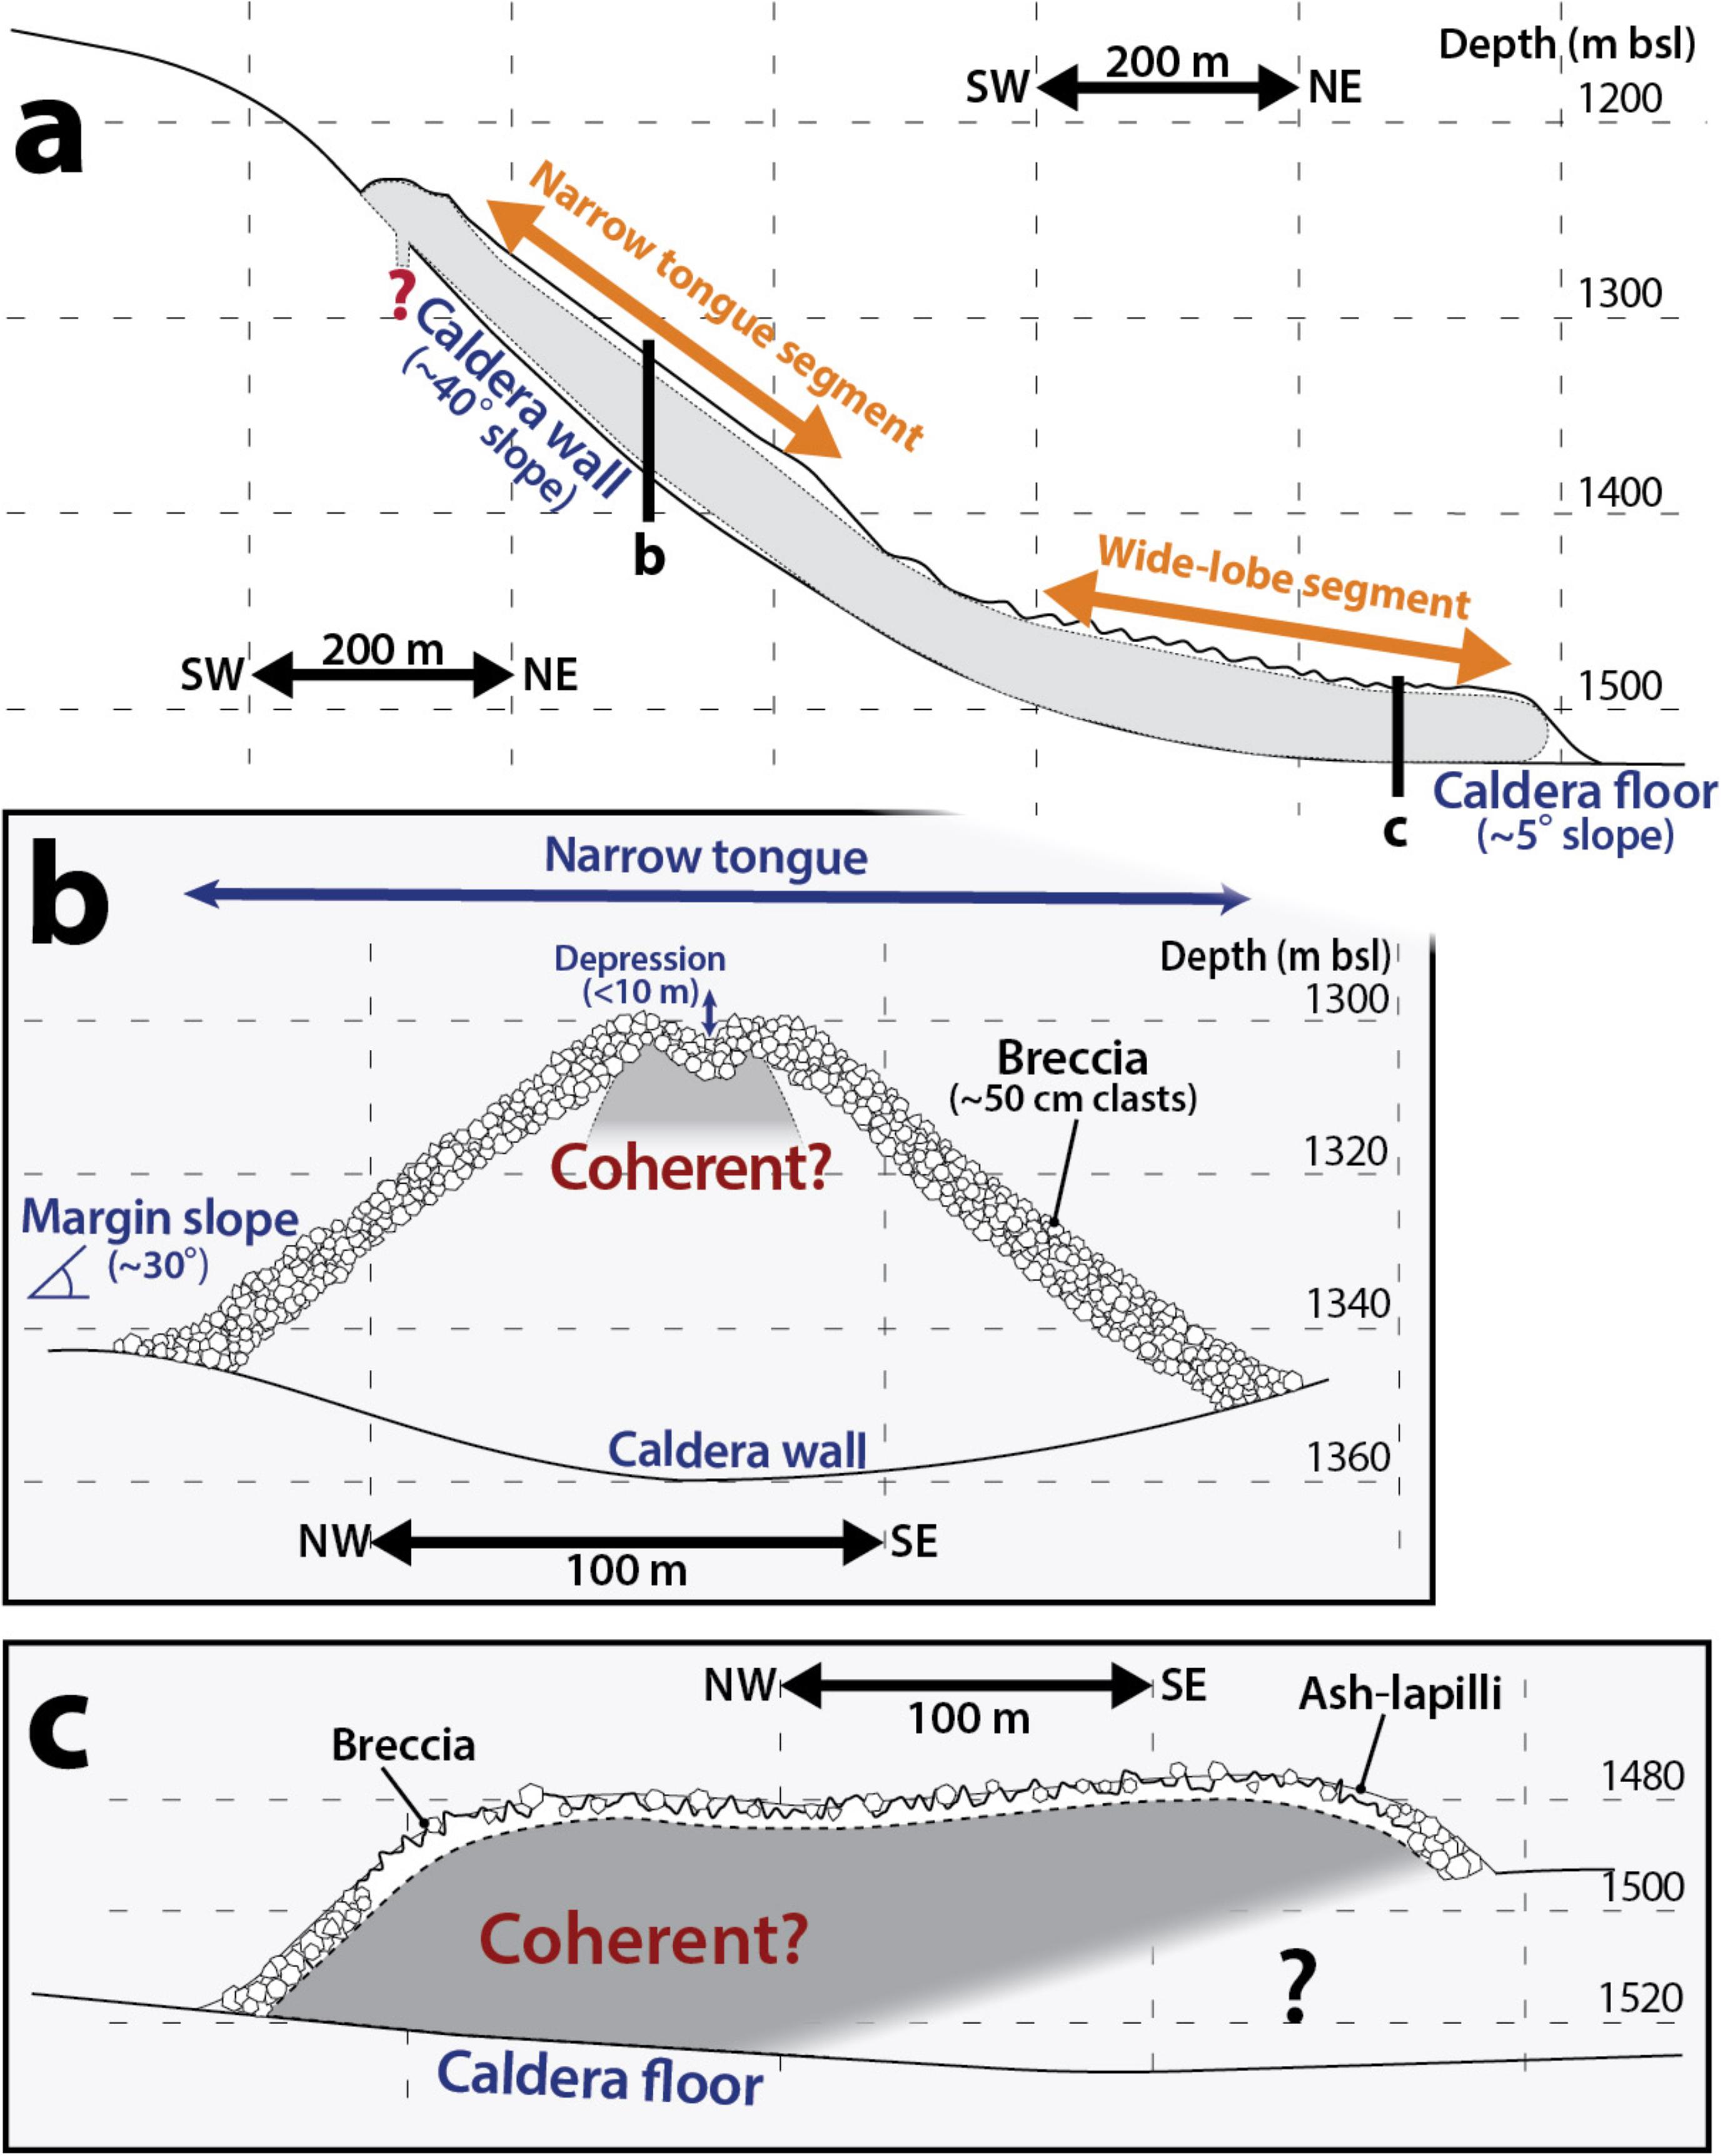
FIGURE 7. (a) Cross-section of lava A parallel to its length, showing the steep slope of the caldera wall and gentle slope of the caldera floor. (b) Transverse cross-section of the narrow-tongue segment of A [position shown on (a)]. (c) Transverse cross-section of the wide-lobe segment of A [position shown on (a)]. The brecciated surface of the lava is covered by thin pyroclastic deposits (ash-lapilli deposit; <20 cm). Note that each of the figures has a different scale and 150% vertical exaggeration.
Arcuate surface ridges are present on the wide-lobe segments of A and C, and on parts of the narrow-tongue segments of A, B, C, and F (Supplementary Figure S9), though the best example of this feature is on A (Figure 8). The ridges are oriented perpendicular to the long axes of the lavas and curve away from the leading edge of the lavas. On A, the ridges are sub-parallel and have wavelengths of 10–30 m and amplitudes of 1–2 m (Figures 8d,e). There is one small domain in which the pattern of ridges is slightly offset (Figure 8b). The pattern of ridges on the wide-lobe segment of C is complex and includes several domains where the ridges have different orientations (Figure 2a and Supplementary Figure S9). Also, the distal margin of C is indistinct where it meets variably deformed caldera-floor sediment. The emplacement of the wide-lobe segment of C and its impact on the caldera-floor sediment are the subject of a separate study.
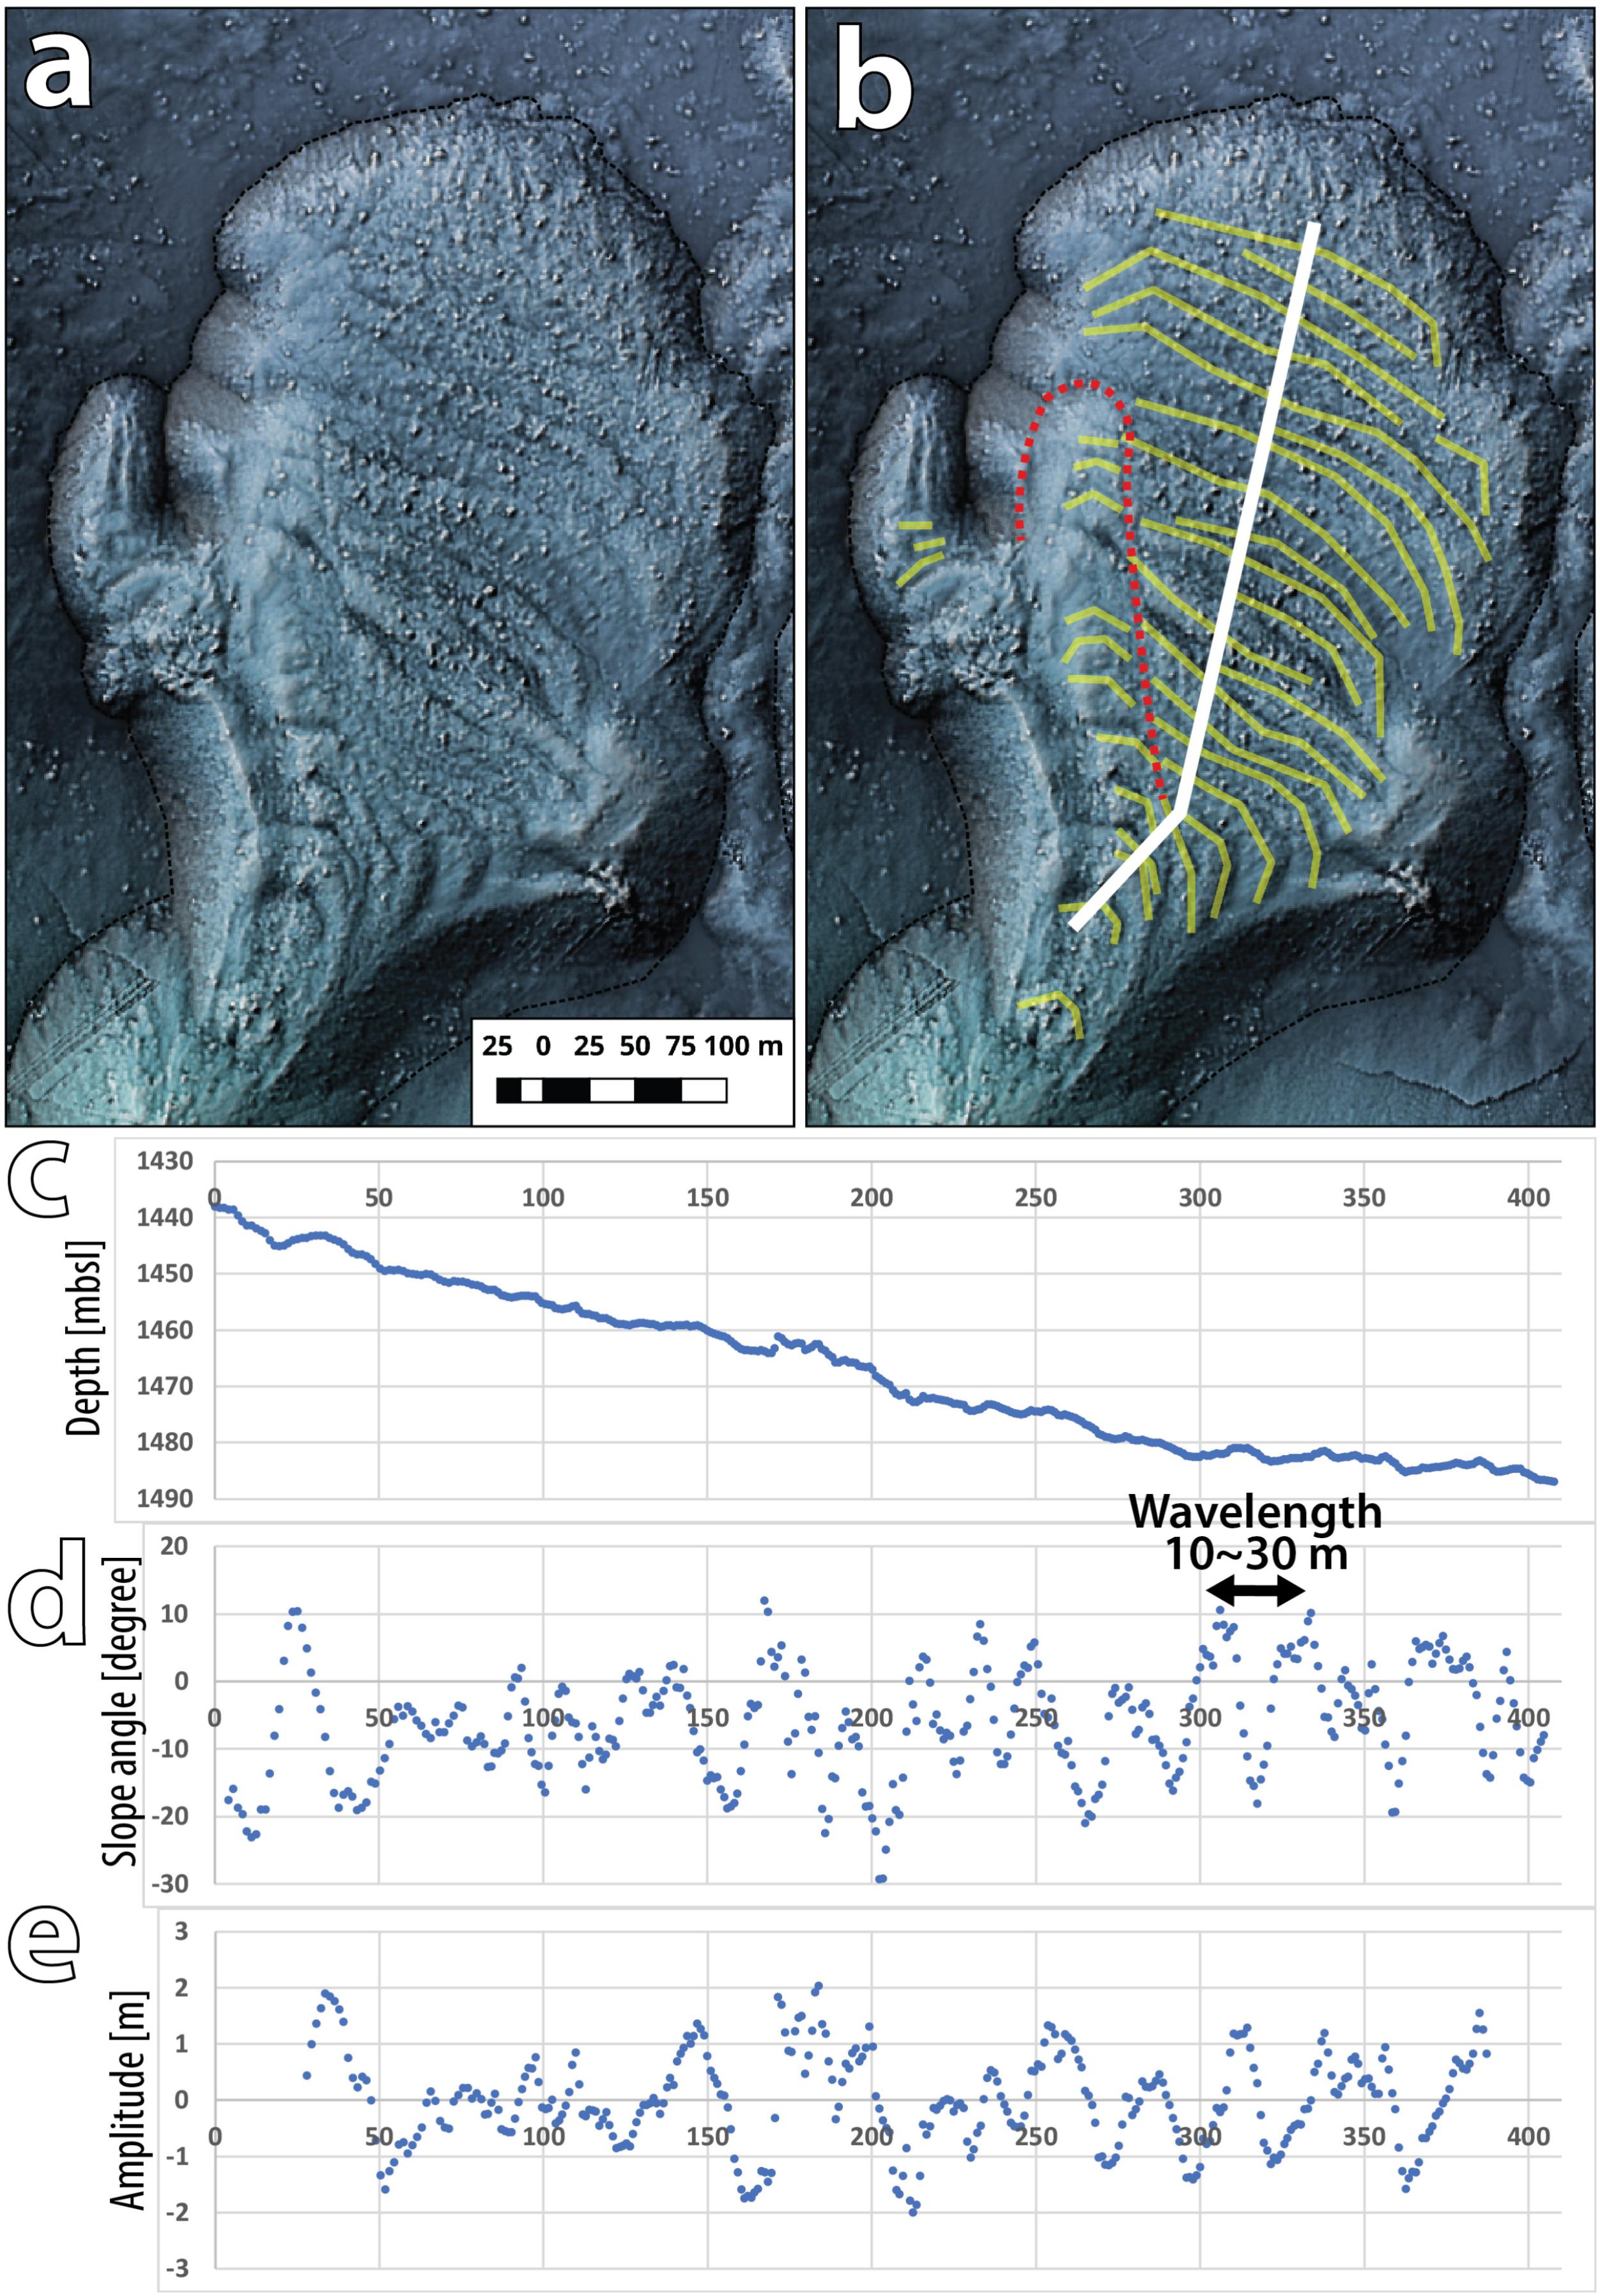
FIGURE 8. High-resolution AUV bathymetry maps and topographic profiles showing arcuate surface ridges on lava A. (a) Plain relief map showing the morphology. (b) Traces of arcuate surface ridges (yellow) on A. The red dotted outline traces the boundary of a domain in which the pattern of surface ridges has been slightly offset from the main pattern. The white stroke indicates the position of the data shown in (c–e). (c) Depth of the surface of A along the longitudinal profile [white stroke on (b)]. (d) Slope angle profile with an averaging of approximately 6 m. The cyclic variations suggest the presence of surface ridges separated by 10–30 m intervals. (e) Amplitude profile with an averaging of approximately 41 m. The data indicate amplitudes of 1–2 m for the surface ridges.
Breakout lobes are present on the wide-lobe segment of A (“x” on Figures 5a, 9a,b) and the narrow-tongue segment of E (“y” on Figures 5a, 9c,d). On the western margin of A close to the start of the wide-lobe segment, there is a stack of three breakout lobes. The largest is at the base and is 150 m long and ∼15 m high; two smaller breakout lobes occur immediately above. The largest breakout lobe appears to connect directly with the narrow-tongue segment of A on the steep caldera wall. The breakout lobe on E is 50 m long, 60 m across, and 15 m high. It emerges from the crest of the narrow tongue about two-thirds of the way down the caldera wall.
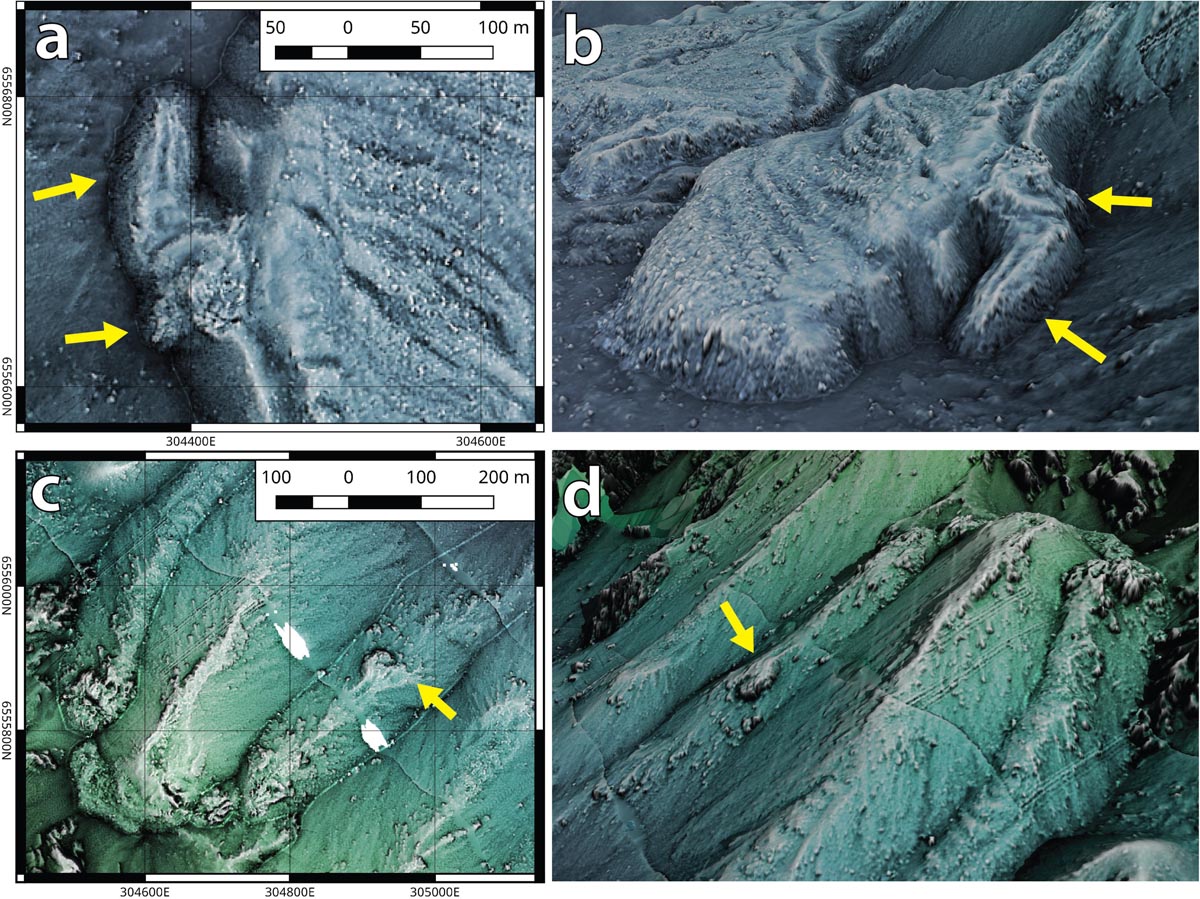
FIGURE 9. (a) Enlarged relief map and (b) 3D rendered image of the breakout lobes on A (indicated by yellow arrows). The area is marked as “x” on Figure 5a. The largest breakout lobe is 150 m long and ∼15 m thick, and has a depression < 2 m deep on the top. Multiple smaller lobes < 10 m thick are also present beside and above the large breakout lobe. (c) Enlarged relief map and (d) 3D rendered image of the breakout lobe on the narrow-tongue segment of E (indicated by yellow arrows). The area is marked as “y” in Figure 5a. The breakout lobe is 60 m across, 50 m long and surrounded by a cliff ∼15 m high. White patches are places where bathymetric data capture was incomplete. All maps and images based on AUV bathymetry data collected in 2015.
All the domes have very rough surfaces composed of jagged and spiny coherent rhyolite (Figures 10a,b), surrounded by aprons of coarse breccia. The spines rise almost vertically and have widths of a few m and heights up to 20 m; their surfaces are smooth and planar or gently curved (Figure 10c), or very rough and irregular. In some cases, spines form a ridge 10–100 m across and ∼40 m high at the center of the dome (Figures 10a,b). The ridges are aligned either parallel to the caldera rim (K and N) or radially (H, I, and M). On K, the central ridge is cut by a narrow, deep (∼30 m) cleft (Figure 10b) parallel to fissures that extend between K and M (Figure 10a).
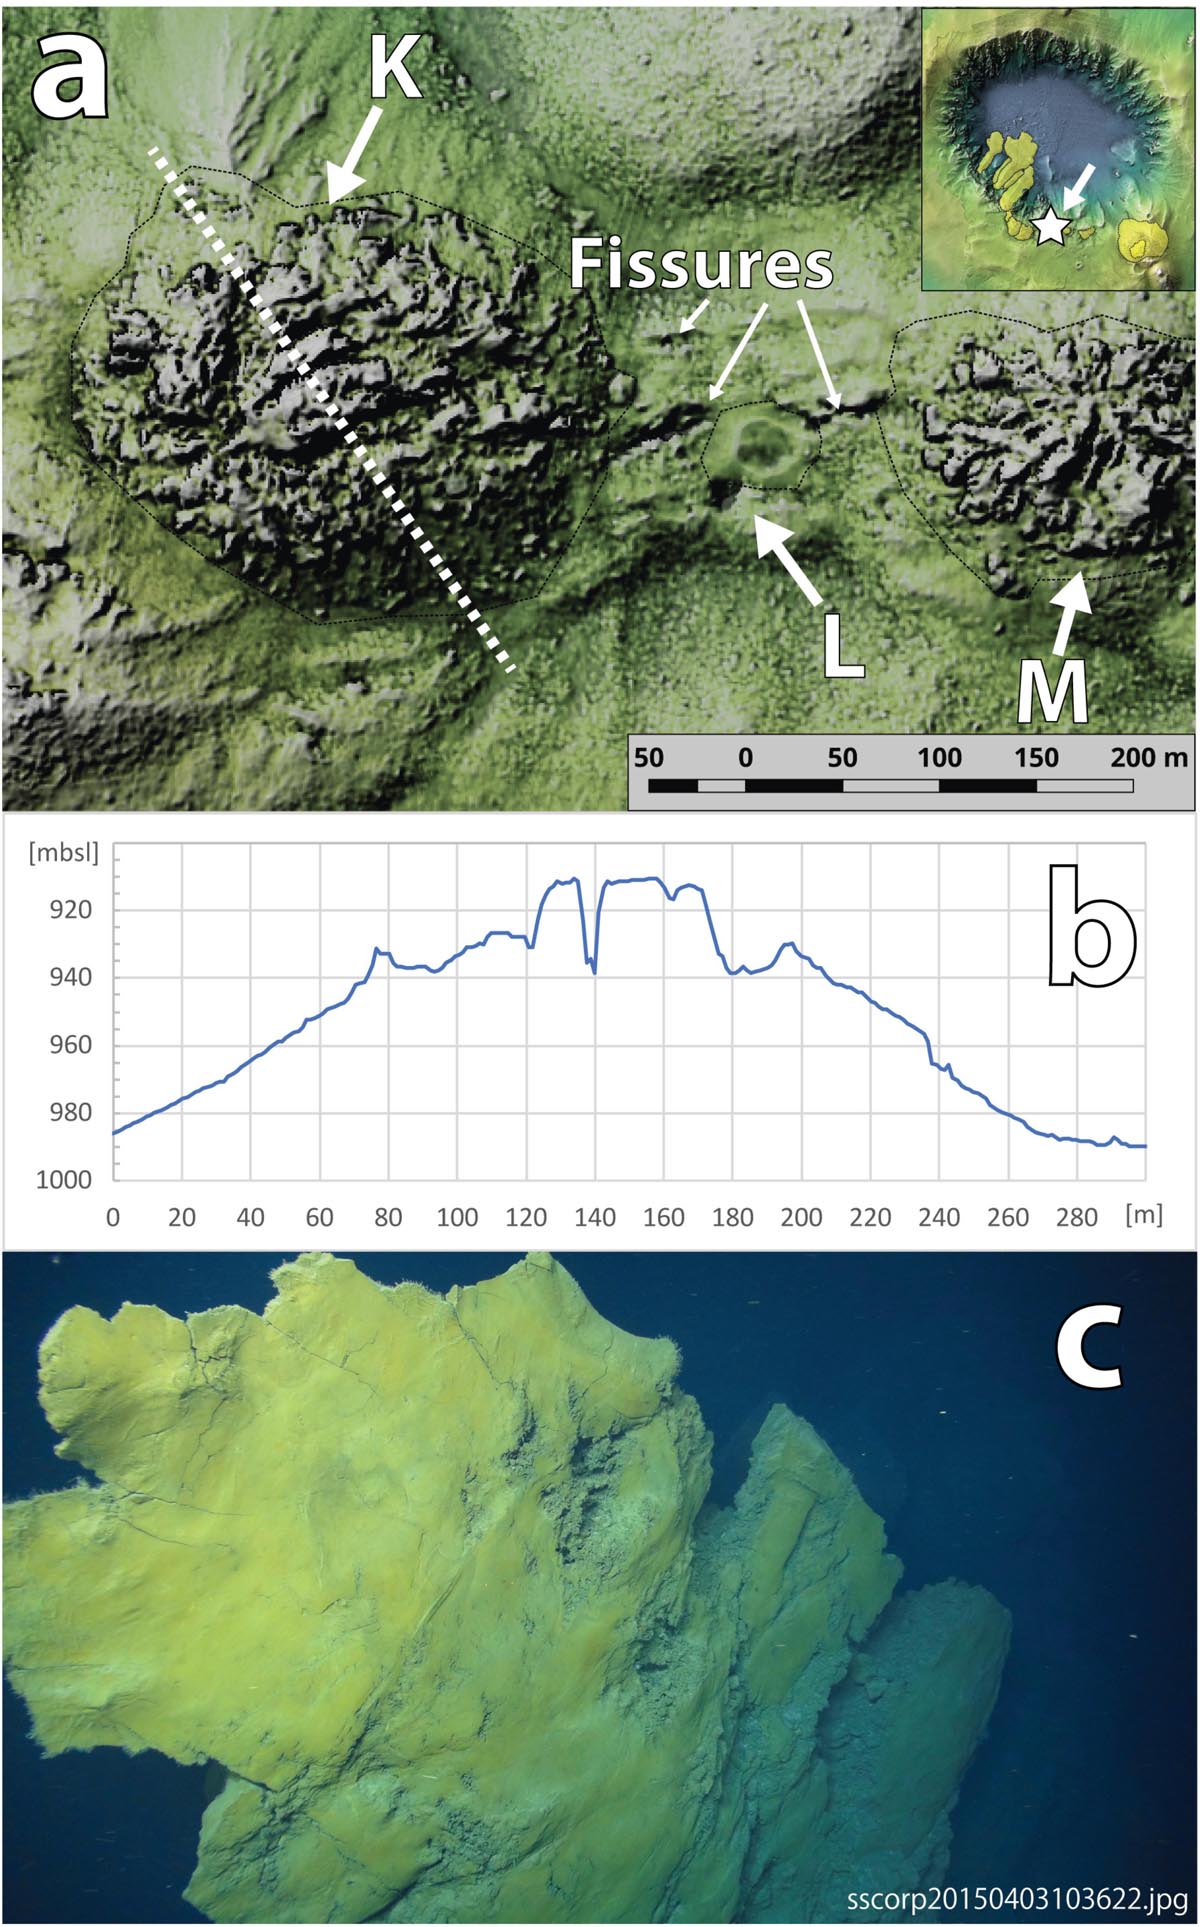
FIGURE 10. (a) Map of domes K, L and M, and connecting fissures, based on AUV bathymetric map of the area. The white dashed line across K shows the position of the topographic profile given in (b) and the small inset map shows the location of these domes on the caldera rim. The fissures extend east-west across the gap between K and M, to the north of L. They are a few m across and 150–180 m long. The fissures lie within a bench that extends from K to M and has been uplifted by ∼10 m. (b) Northwest (LHS)-southeast (RHS) topographic profile of K, showing the central ridge > 30 m tall and 50 m across with a steep axial cleft more than 20 m deep. (c) Full view of a spine on H. The spine is ∼5 m across.
The large dome pair OP has a more complicated morphology due to the two extrusions apparently sharing one vent. Dome O is slightly elongate in a NE-SW direction (Figure 5b). The top surface slopes gently westward and consists of numerous spines and ridges. The ridges define weak horseshoe-shaped alignments opening to the west and the highest point of the dome (635 m bsl) is located on its eastern margin. The top is surrounded by steep aprons of breccia (∼40o for 200 m of height). Dome P sits on the top of O and its highest point is 50 m higher than the top of O. P is elongate, being slightly longer in the northeasterly direction (∼450 m) than the northwesterly direction (∼300 m). The southwestern margin of P overlaps that of O, making their boundaries hard to distinguish. The surface of P slopes gently and is composed of decimeter-sized rhyolite fragments which produce a smooth morphology on the AUV bathymetric map (Figure 5b). A half-dome shaped spine (3 m across, 5–10 m high) which is the highest point on P (650 m bsl) sits at the center.
Dome G is the only dome with arcuate surface ridges, similar to the arcuate surface ridges on lava A in terms of wavelength (10–20 m) and amplitude (∼2 m). The carapace of G was sampled at the top of a mass-wasting scarp that faces the caldera, and about 120 m Southwest of the scarp (Figure 11). The carapace is vesicular and glassy (Figure 4d). The interior of G was observed and sampled on the mass-wasting scarp. The vesicular coherent rhyolite extends ∼2 m into the interior. Dome F also has a vesicular carapace. The inner part of G consists of massive coherent rhyolite that grades deeper down into jointed coherent rhyolite.
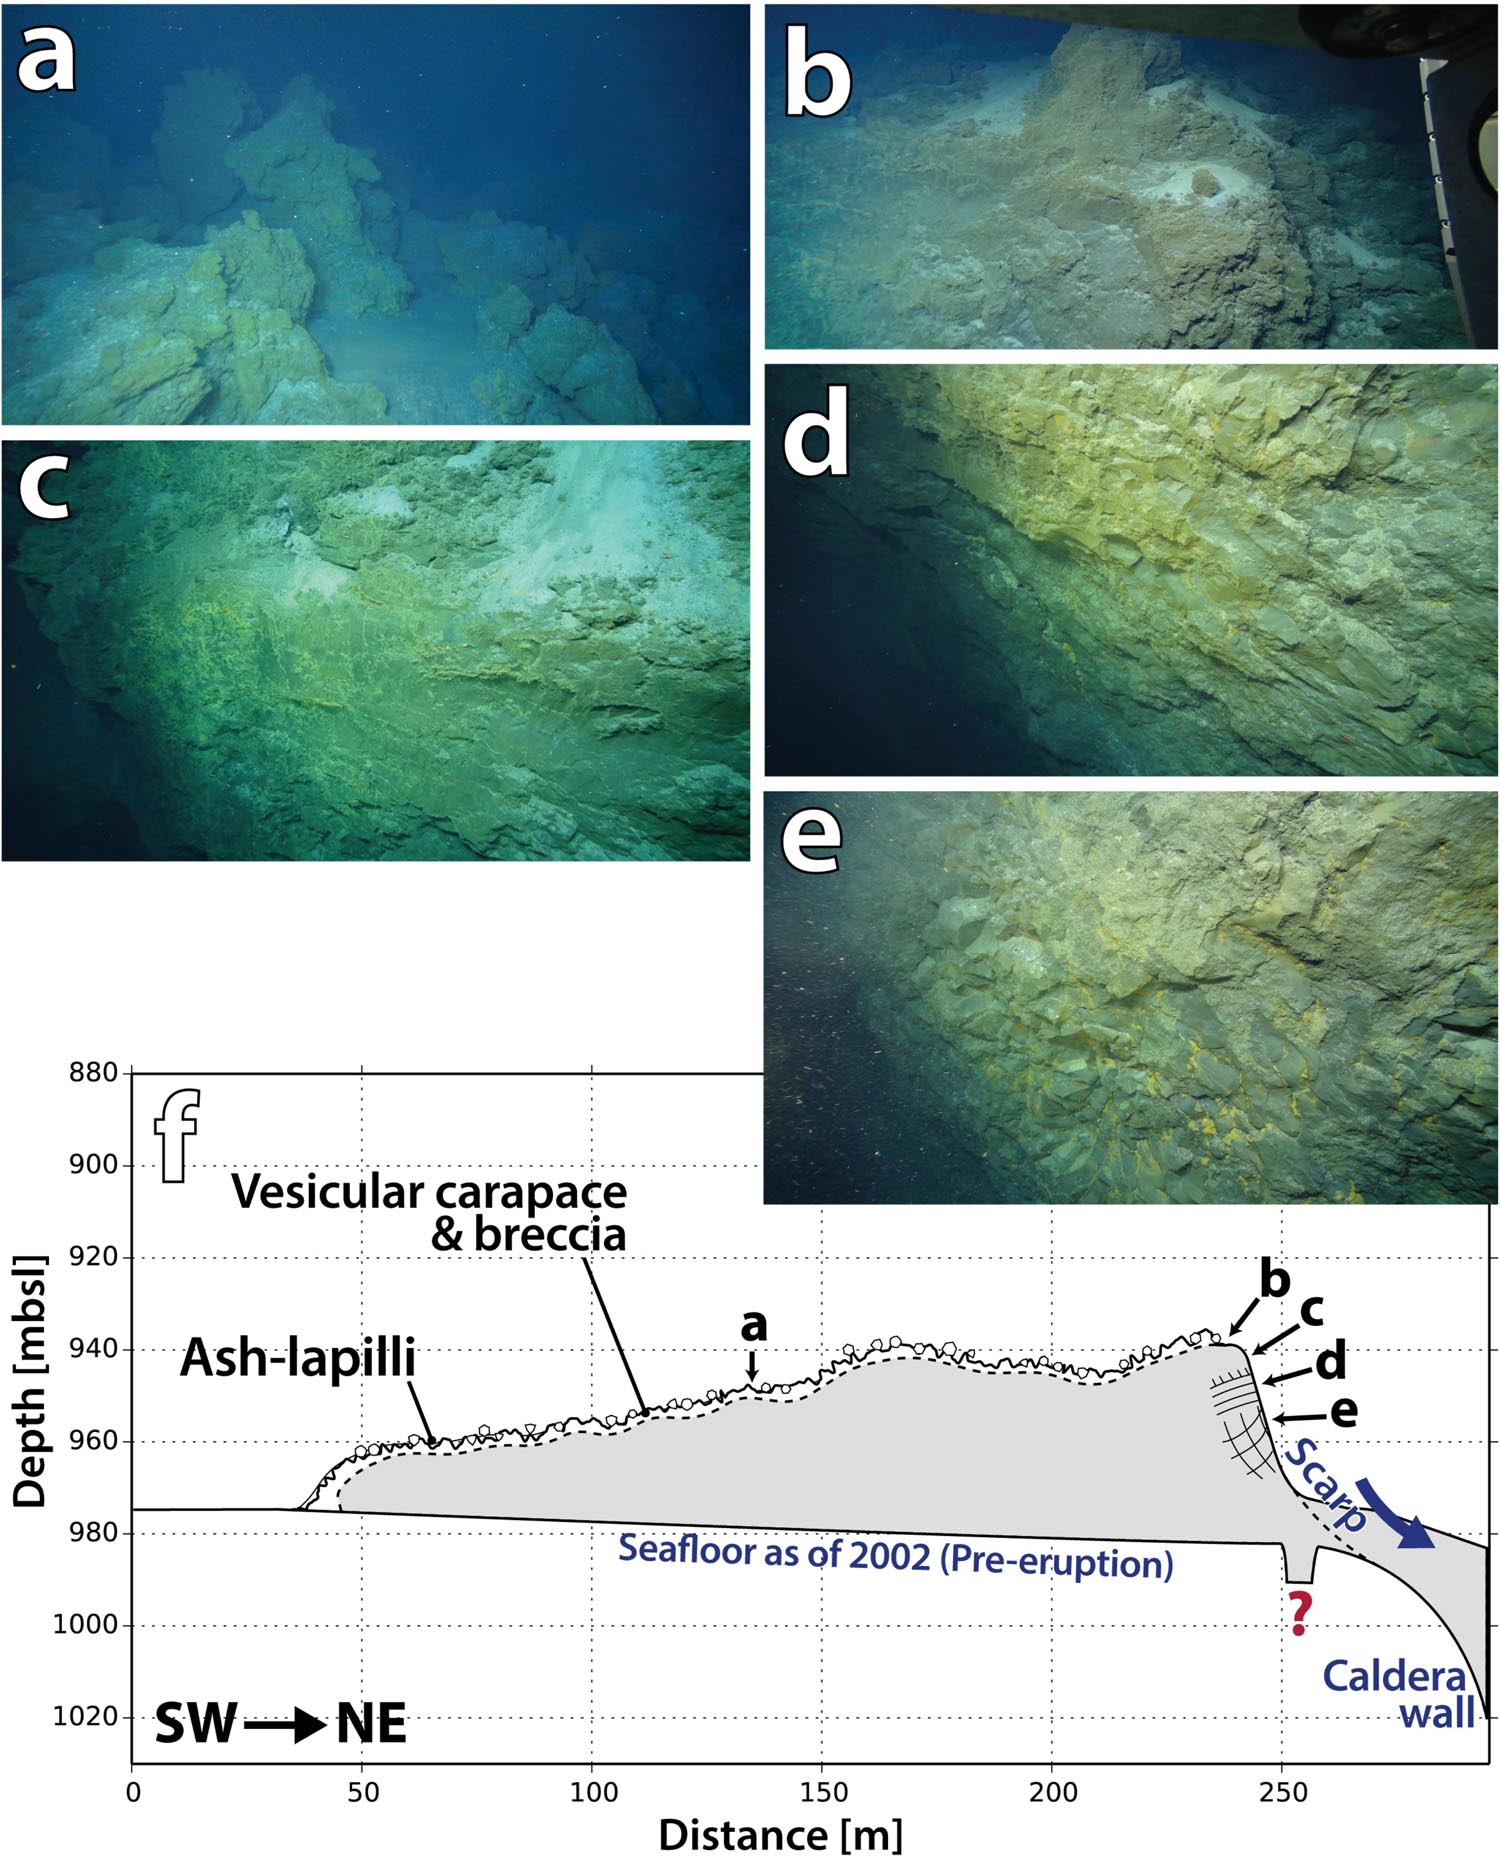
FIGURE 11. Dome G morphology and facies exposed in a scarp facing the caldera wall. (a) Vesicular carapace. The rough surface is created by ∼1-m-high spines and breccia, both of which are covered by the thin ash-lapilli deposit. (b) At the edge of the scarp, the vesicular carapace is less than a few meters thick. (c) Massive coherent core at the top of the scarp. (d) Laterally jointed coherent rhyolite in the middle of the scarp. (e) Complex radial joints in coherent rhyolite at the base of the scarp. (f) Schematic cross-section of G based on the pre- and post-eruption bathymetry in 2002 and 2015, and the facies exposed in the scarp.
Most of the surface of N is rough and jagged, similar to the other domes, but part of its northern edge is smoother and shows subtle tonal differences (Figure 12). This northern area was uplifted ∼100 m between 2002 and 2012, and both morphologically and visually, the surface resembles the surface of the nearby caldera rim, rather than the rough rhyolite. One explanation is that N is partially intrusive, a portion of the northern side of the dome having stalled and intruded instead of emerging at the sea-floor. Intrusion resulted in subtle local uplift of the caldera rim that can be detected in the detailed bathymetry.
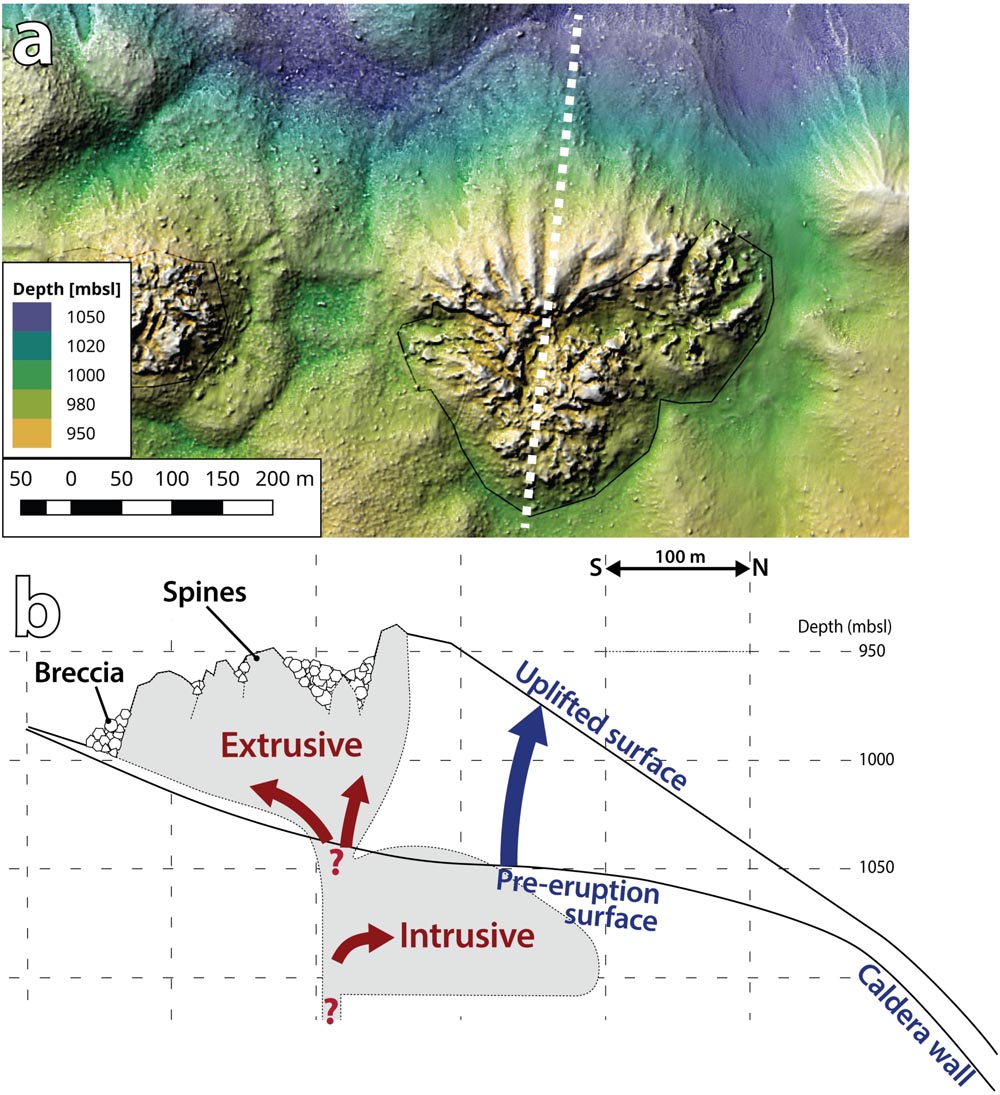
FIGURE 12. Partially intrusive dome N. (a) Relief map of N showing the subtle contrast in surface texture between the northern and southern parts. The white dashed line shows the position of the cross-section in (b). (b) Cross-section of N, showing the interpreted subsurface intrusion responsible for the uplift on the northern side of the extrusive part.
The order of emplacement of the 15 rhyolite lavas and domes has been deciphered using a combination of stratigraphic relationships with other 2012 seafloor products and contact relationships between adjacent lavas or domes. Among the 2012 seafloor products, the deposit of GP clasts is most useful because it was formed by settling from suspension of temporarily buoyant pumice clasts (Carey et al., 2018) and serves as a stratigraphic marker. This deposit is distinguishable in the high-resolution bathymetry map and was sampled in many places. One limitation of using the GP deposit as a marker is that its dispersal area is strongly elongate in a northwesterly direction (Carey et al., 2018) and some domes (G, H, I) on the caldera rim are outside the dispersal area. A second limitation is that the GP clasts can be found only on flat sea floor so relationships could not be identified for B, D, and E, all of which are limited to the steep caldera wall. For F, the top is on the caldera rim but outside the GP dispersal area, and the rest of F is on the steep caldera wall. Nevertheless, among the 15 lavas and domes, only A and C are overlain by numerous clasts of GP whereas K, L, M, N, and OP (all within the dispersal area and on flat sea floor) are not. Considering A in more detail, a small breakout lobe on its northwestern margin is not covered by GP clasts (Figures 9a,b and Supplementary Figure S10), implying that the breakout occurred after the GP deposit. Therefore, most of A and all of C pre-date the GP deposit whereas the breakout lobe on A, and K, L, M, N, and OP post-date the GP deposit (Figure 13). The relationship between the GP deposit and each of B, D, E, F, G, H, and I is not known.

FIGURE 13. Stratigraphic relationships among the Havre 2012 lavas and domes, the giant pumice deposit (GP), ash-lapilli deposit (AL), and ash-lapilli-block deposit (ALB), along the southwestern and southern caldera margin. Note that J is a pre-2002 feature. The pink shape below K, L, and M represents a possible shallow intrusion responsible for the uplifted bench that connects K, L, and M. The small cone beside L post-dates the GP deposit but was not systematically examined. Part of N was extrusive; this part is not covered by the GP deposit; the GP deposit covers the surface above the intrusive part of N.
Some contact relationships between adjacent lavas or domes imply their order of emplacement. On the steep southwestern caldera wall, well-sorted decimeter-sized talus breccia of C overlies less-sorted coarser breccia of B to the northwest and E to the southeast (Figures 14a–c). Although these observations imply only the final relationship when the lavas stopped moving, the simplest interpretation is that B, E, and probably D (a small dome between C and E) either preceded or are contemporaneous with C. This finding therefore suggests that all of the units erupted from vents on the southwestern caldera wall (A–E) except the small breakout on A were emplaced before the GP deposit.
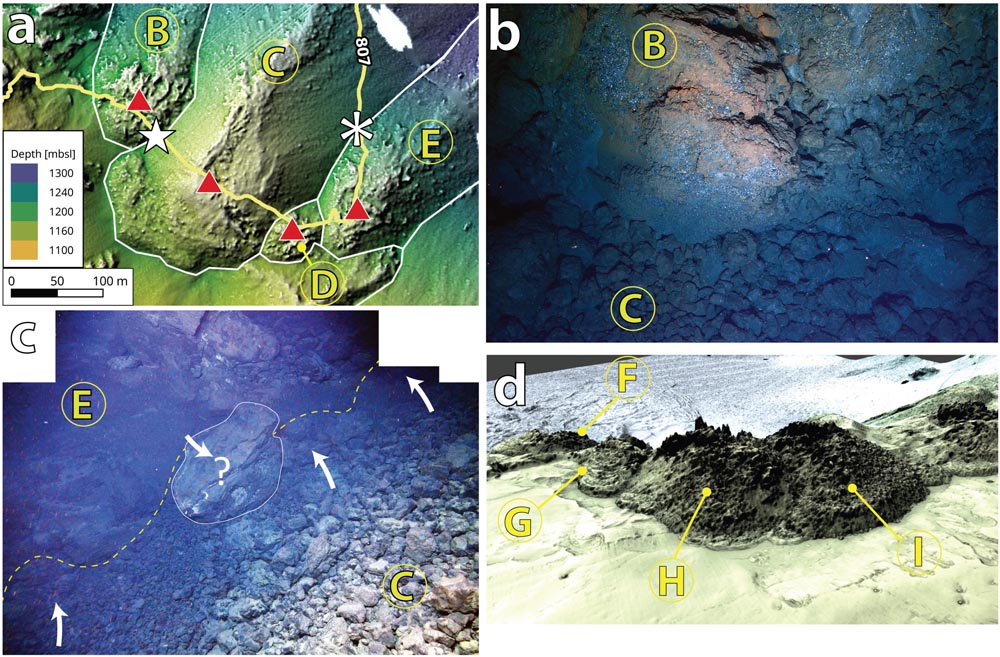
FIGURE 14. Observations used to determine relative ages of the lavas and domes. (a) AUV bathymetry map of the southwestern caldera wall. The extents and inferred vents of B, C, and E are highlighted by solid borders and red triangles, respectively. The yellow line is the ROV dive traverse J2-807. The white star and asterisk show the positions of the outcrops in (b,c), respectively. White patch lacks bathymetric data. (b) Talus of C overlies the carapace of B. Image from down-looking still camera on ROV Jason. Field of view is ∼4 m across. (c) Talus of C overlies the carapace of E. Composite image from front-looking still camera on ROV Jason. The rock outlined in the center is ∼1 m across. (d) 3D AUV bathymetry map of the southern caldera rim showing that the edges of H overlap I and G. The 2D map in Figure 5 gives an orthographic view of the area.
Overlapping relationships also exist among G, H and I on the southwestern caldera rim. Their morphologies suggest that H overlaps G and I (Figure 14d) and is therefore younger than both. However, the relationship between these domes and the GP deposit remains unknown as they are outside of the GP dispersal area.
Using the GP deposit as a marker on the sea floor and the recorded formation of the pumice raft at the sea surface, three main stages can be defined for the Havre 2012 eruption. This approach requires assuming that the GP deposit on the sea floor is the counterpart of the pumice raft recorded in satellite imagery on July 18, 2012, and is valid only if this correlation is correct.
The first stage involved the effusion of A, B, C, D, and E from vents at 1,200 to 1,300 m bsl on the southwestern caldera wall (Figures 15a,b). A small dome formed at D while lavas with greater volumes descended the steep caldera wall to the caldera floor at 1,500 m bsl. A and C advanced hundreds of meters farther across the flat surface of the caldera floor. At least 0.05 km3 of rhyolite was erupted at this stage, including C (0.034 km3) which is the longest (1.35 km) among the Havre 2012 lavas. The beginning and duration of the first stage are unknown. However, a rhyolitic lava as long as C may have taken months to be fully emplaced. For comparison, the obsidian lava from the 2011 eruption of Cordón-Caulle in Chile took ∼3 months to reach ∼3 km from the source (Tuffen et al., 2013), and was active for another 18 months (Farquharson et al., 2015).
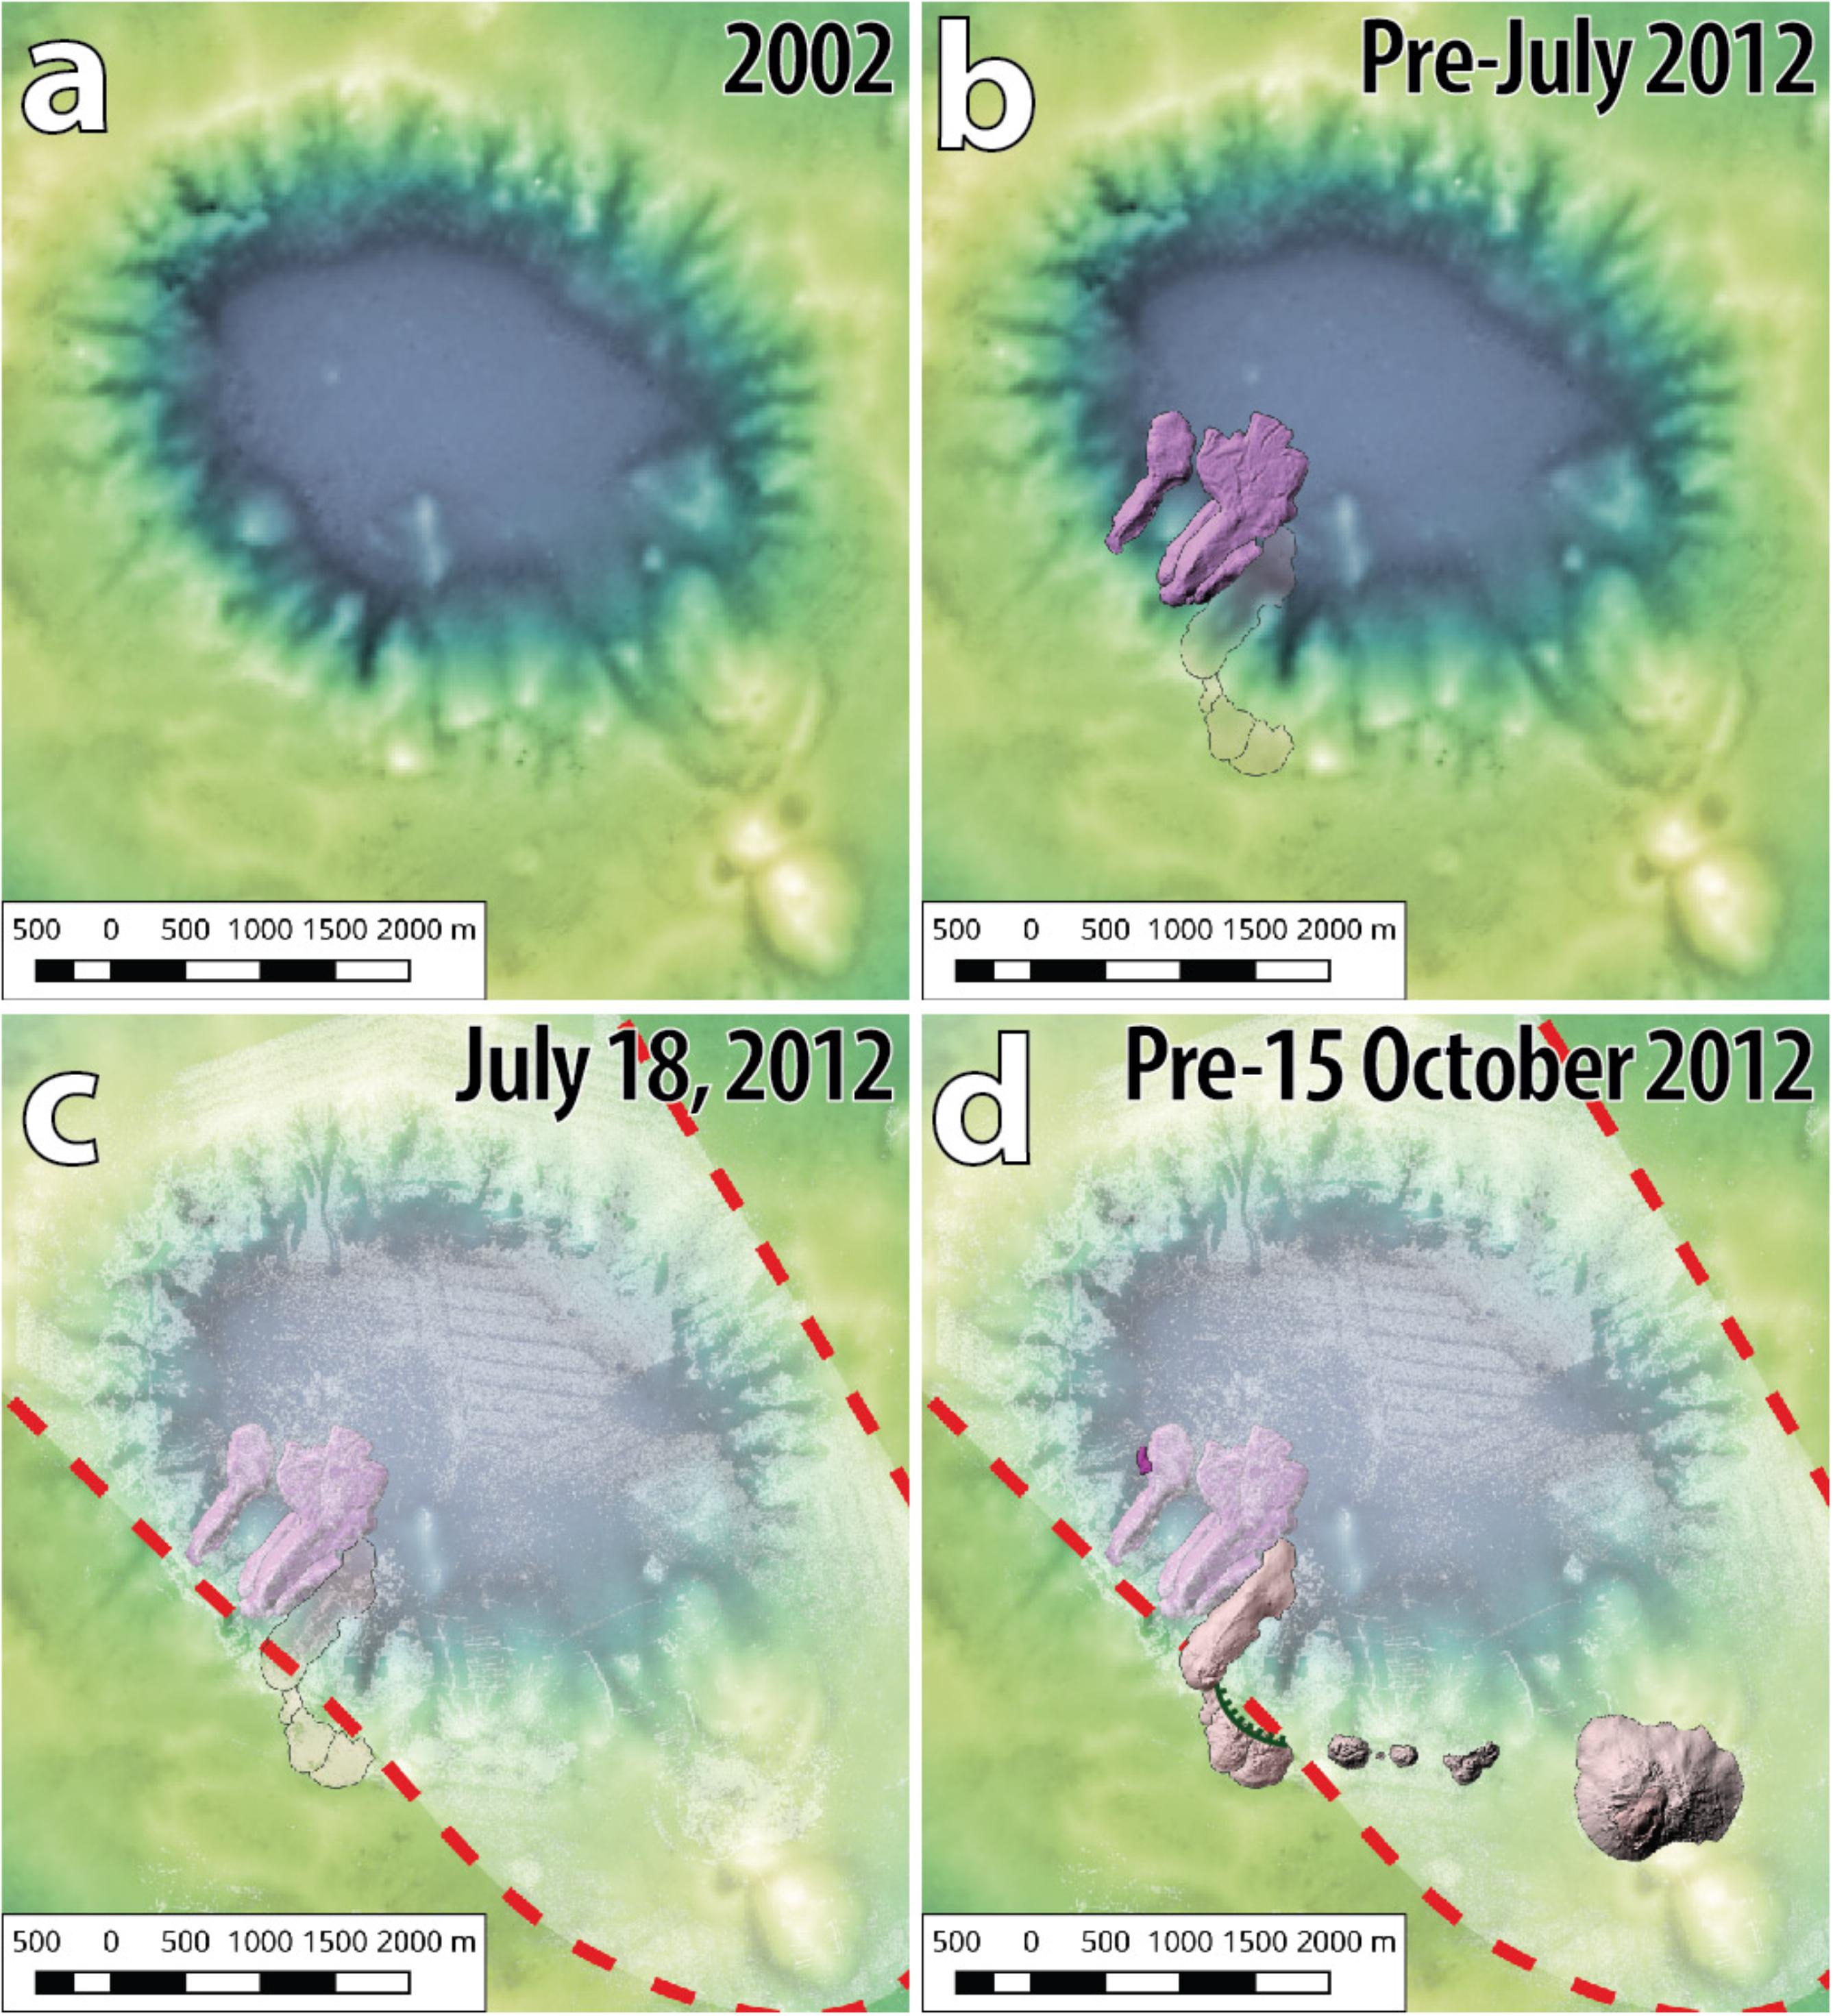
FIGURE 15. Chronology of the Havre 2012 lava and dome eruptions. (a) Havre caldera in 2002 (based on Wright et al., 2006). (b) Effusive eruption of A, B, C, D, and E from vents at 1,200 to 1,300 m bsl on the southwestern caldera wall. A small dome formed at D; lavas A, B, C, E descended the steep caldera wall. F, G, H, and I may have also been erupted during this stage, or else after the GP deposit. (c) Eruption of the GP; providing the correlation of the GP deposit and the pumice raft is correct, then the GP-forming event began on July 18th, 2012. The GP deposit has a northwesterly dispersal area that covers all the caldera floor but only parts of the caldera rim. (d) Effusive eruption of domes K, L, M, N, O, and P and breakout of a small lobe on intracaldera lava A, before October 2012 when Havre was surveyed by R/V Tangaroa. F, G, H, and I may have also been erupted during this stage, or else before the GP deposit. After or during emplacement, part of G, H, and I collapsed, forming a scarp along their northern margins.
The second stage is defined by the widespread deposition of GP on the sea floor (Figure 15c) and is based on the observation that most of A, and all of C are overlain by the GP deposit. The breakout lobe on A formed after deposition of the GP deposit, implying that the initial lava- and dome-producing stage immediately preceded the second stage (rather than being a long time earlier). Assuming the GP deposit correlates with the pumice raft, the second stage began on 18 July, 2012, and lasted less than 24 h (Jutzeler et al., 2014). The dispersal trajectory of the GP deposit and lateral grain size variations within it (Carey et al., 2018) strongly suggest that the source was the same vent that subsequently produced the large dome pair OP on the southern caldera rim. The significant seismicity associated with this stage (Global Volcanism Program, 2012), the short duration, and the large combined volume of the GP deposit and the pumice raft (∼1.3 km3 bulk; 0.3 km3 DRE; Jutzeler et al., 2014; Carey et al., 2018) indicate that this stage involved rapid ascent of newly supplied magma.
The third stage is characterized by the eruption of lava domes K, L, M, N, and OP along the southwestern and southern rim of the caldera (Figure 15d). The breakout lobe on A (Figures 9a,b and Supplementary Figure S10) was also extruded during this stage, and requires that the earlier part of A (pre-GP) was still sufficiently mobile to undergo farther advance. The vent on the southern caldera margin inferred to have been the source of the GP deposit (Carey et al., 2018) in the second stage now became the vent for dome pair OP which is exceptionally large among the Havre 2012 rhyolite units (∼0.11 km3). The ash-lapilli-block deposit is found only around OP and probably underlies, and therefore predates them (Carey et al., 2018). After the majority of dome O was built, a small-volume effusion created P, displacing O sideways so that O now forms an annulus around P. The domes K–N emerged from vents on benches along the caldera rim. Although the aggregate erupted volume of K–N is small (∼0.0063 km3), the 1.4-km-long alignment of these domes, and fissures connecting them (Figure 10), suggest that an additional volume of rhyolite was intruded as a dyke at the same time.
The timing of the emplacement of F, G, H, and I is not clear because they are beyond the dispersal area of the GP deposit. They could have been emplaced about the same time as A–E, before the GP (Figure 15b), or about the same time as K to OP, after the GP (Figure 15d). The northern parts of G, H, and I are truncated by an arcuate scarp (Figure 5c and Supplementary Figure S11), indicating that they underwent partial collapse after emplacement. The collapse event occurred after the emplacement of the GP deposit because GP clasts on the caldera floor are partly buried by mass-wasting deposits.
The widespread ash-lapilli deposit is found on the GP deposit and on all the lavas and domes except P. However, its stratigraphic and temporal relationships are complex (Murch et al., unpublished). Internal subdivisions appear to record deposition that began following the eruption of the GP deposit, and persisted at least until the emplacement of P. It is inferred to have been produced by explosive and effusive events, as well as intracaldera mass-wasting events, none of which was large enough to have an expression above the sea surface.
The major part of the Havre 2012 eruption is considered to have ended by October 15, 2012, because there was no significant change in the bathymetry data between October 15, 2012 when R/V Tangaroa completed mapping the area and 2015 (MESH voyage). This chronology suggests that the Havre 2012 eruption began and ended with relatively slow lava effusion from multiple vents, which was interrupted by a brief period of higher discharge rate on July 18, 2012 when the pumice raft and GP deposit were erupted.
The Havre 2012 lavas and domes were erupted from vents distributed along ∼one third (4.2 km) of the 15-km-long perimeter of the caldera. In detail, the 4.2 km of vents is made up of shorter linear segments (Supplementary Figure S6): BCDE, 0.3 km long, trend 120°; FGHI, 0.7 km long, trend 145°; KLMN, 1.1 km long, trend 090°. The vent of A is located on the northwestern extension of the BCDE vent alignment, but there is a 250 m gap between A and B. The BCDE and FGHI vent alignments have similar trends but are offset and separated by a 400-m-wide gap and an elevation difference of 200 m. The large dome pair OP does not fall on any of the other 2012 vent alignments but it lies at the northwestern end of a line of older vents with a trend of 150° (Supplementary Figure S6).
The linear arrangement of the 2012 vents, proximity of adjacent vents and the uniform composition of the rhyolite erupted (Carey et al., 2018) suggest that the 2012 lavas and domes were fed by three structurally controlled dykes (e.g., Fink and Pollard, 1983; Mastin and Pollard, 1988), corresponding to the three distinct vent alignments. The three segments evident from the vents at the surface could be connected at depth, as has been demonstrated in studies of dyke-fed subaerial rhyolite eruptions (e.g., Reches and Fink, 1988). At least for the KLMN vent alignment, there are additional surface features consistent with this interpretation. In particular, domes K and M on the KLMN vent alignment have large spines and clefts parallel to the vent alignment (Figure 10a). A bench ∼10 m high and ∼150 m wide extends between K and M (Figure 10a); the bench is cut by fissures to the north of L; the bench and the fissures are both parallel to the KLMN vent alignment. The uplift and extension associated with the bench and fissures could result from a shallow syn-eruptive intrusion (pink shape beneath K, L, and M, Figure 13). Uplift inferred to be related to a shallow syn-eruptive intrusion has been identified at Cordón-Caulle (Castro et al., 2016) and at Medicine Lake Volcano (Fink and Anderson, 2017). Given the location of the vent alignments along the caldera perimeter, we conclude that the prime structural control on the 2012 rhyolite feeder dyke(s) was a new or pre-existing caldera-margin fault or fault set.
It is also possible to infer that shallow-level dyke emplacement proceeded from the west to south around the perimeter of the caldera during the course of the whole eruption. The basis for this interpretation is the fact that the lavas (A, B, C, E) and dome (D) at the western end predate the domes on the southwestern and southern caldera rim. Furthermore, available compositional data suggest the 2012 Havre rhyolites become progressively more silicic from the west to the south though the overall change is very small (<2 wt.% SiO2; Carey et al., 2018). The western dyke may have tapped slightly deeper (less evolved) and the southern dyke slightly shallower (more evolved) levels of a weakly vertically zoned magma source.
Here, we consider whether the Havre 2012 lavas and domes, erupted in ∼900 to 1,300 m of water, differ significantly from subaerial counterparts in terms of dimensions, volumes, aspect ratios, surface features, textures, eruption rates, and structural controls on vents.
The range in diameter (tens of meters to 720 m), maximum thickness (∼20 to 270 m) and volume (0.0003 to 0.11 km3) of the ten Havre 2012 domes is comparable to that of subaerial dacitic and rhyolitic domes (e.g., Walker, 1973; Calder et al., 2015). The surface features of the submarine Havre domes are also similar to those of small subaerial domes, particularly those named spiny or Pelean domes, characterized by tall vertical spines (e.g., Fink and Griffiths, 1998; Fink and Anderson, 2000). The overall organization of a coherent (though jagged and spiny) core surrounded by talus is shared by both subaerial domes (e.g., Swanson et al., 1987; Calder et al., 2015) and the Havre submarine domes, and in both settings, the outer part of the core is vesicular (Figures 11a,b). Texturally, the Havre domes match the “obsidian dome” category of Calder et al. (2015), given the low abundance of phenocrysts, but the proportion of genuine obsidian (dense glass) within them is unknown.
Being covered almost entirely by breccia, the Havre 2012 lavas resemble subaerial, intermediate to silicic, blocky lavas (Kilburn, 2000; Harris and Rowland, 2015). In both settings, the breccia is autoclastic; in the Havre case, both quench fragmentation and dynamic stressing probably operated. Among the best subaerial examples of silicic, blocky lavas are the Roche Rosse rhyolite lava (Italy; ∼2 km long, 0.03 km3; Bullock et al., 2018), the Cordón-Caulle obsidian lava (Chile; ∼3.6 km long, 0.8 km3; Tuffen et al., 2013) and rhyolite lavas of Newberry volcano (e.g., Big Obsidian Flow, 1.8 km long, ∼0.13 km3; Interlake Obsidian Flow, 1.8 km long, 0.025 km3; MacLeod et al., 1995), all of which have dimensions comparable to the Havre 2012 lavas. The arcuate surface ridges on the Havre lavas, especially those on A (Figure 8), appear to be identical to similar ridges on subaerial silicic lavas (commonly referred to as surface folds, compressional ridges or ogives). In subaerial settings, surface ridges form where the crust buckles in response to compression behind a stalled lava-flow front (Fink, 1980). The same explanation appears valid in the case of the arcuate surface ridges on the Havre submarine lavas. Although not common or not widely recognized, subaerial rhyolite lavas may include small breakout lobes emplaced after the main lava advance ceased (e.g., breakouts associated with the 2011–2012 Cordón-Caulle obsidian lava, Tuffen et al., 2013). Among the lavas produced during the Havre 2012 eruption, both A and E include small breakout lobes.
The aspect ratios of the Havre 2012 lavas (Supplementary Table S1) fall in the range considered typical of subaerial high-viscosity lavas by Walker (1973; <50 and commonly <8). Lava C has an aspect ratio of 47.7, near the high end of the range whereas the other lavas (A, B, E, F) have much lower aspect ratios (5.5–16; Supplementary Table S1).
The narrow-tongue segments of the Havre 2012 lavas on the steep caldera wall superficially resemble channelized lavas (e.g., Harris and Rowland, 2015). However, the strongly triangular cross-section shape and very shallow depth of the central depression (Figures 7a,b) are important differences, especially with regard to the identification of levees which are an integral part of channelized lavas. Although there are very few exposures of coherent rhyolite on the narrow-tongue segments, it is reasonable to infer that the interior of the ridges comprised molten rhyolite while the lavas were active, because (1) in the cases of A and C, the narrow-tongue segments fed the wide-lobe segments on the caldera floor, and (2) there is a breakout lobe on the narrow-tongue segment of E (Figures 9c,d). In this respect, the narrow-tongue segments appear to have delivered molten rhyolite to the flow front beneath an insulating cover of breccia. This mechanism of propagation strongly resembles that of subaerial a’a and blocky lavas (Kilburn, 1993; Harris and Rowland, 2015).
By assuming that the GP deposit and the observed pumice raft were contemporaneous, and noting that there was no significant topographical change between the bathymetry mapped on October 15, 2012 and March 2015, Carey et al. (2018) concluded that domes K to P were likely erupted within (or less than) 90 days. The minimum mean discharge rate of dome OP (0.11 km3) was 14.4 m3/s whereas the rates for each of K, M, and N were between 0.14 and 0.37 m3/s.
Recent subaerial eruptions of Chaiten in 2008 and Puyehue Cordón-Caulle in 2011 demonstrated that rhyolitic effusive eruptions can have maximum discharge rates as high as 70 m3/s (Pallister et al., 2013; Bertin et al., 2015) which surpasses the rate for typical subaerial dacitic dome eruptions such as Mt. St. Helens (∼0.59 m3/s; Fink et al., 1990), Unzen (∼3.5 m3/s; Nakada and Fujii, 1993) or Santiaguito (∼1.4 m3/s; Harris et al., 2003) by more than an order of magnitude. However, the mean discharge rates of Chaiten (∼16 m3/s) and Puyehue Cordón-Caulle (16.7 m3/s) were much lower than the maxima, and comparable to the minimum mean discharge rate of Havre dome OP. The rates for other small Havre 2012 domes K, M and N are comparable to those of small subaerial silicic domes.
We have interpreted the linear alignment of the vents for the Havre 2012 lavas and domes to result from structural control, most likely a fault or fault set. Alignment of multiple vents along faults is commonly shown by subaerial rhyolite lava and dome fields. Well-studied examples include Cordón-Caulle (Lara et al., 2004), the Inyo volcanic chain (Sampson, 1987; Miller, 1985), Newberry volcano (MacLeod et al., 1995), South Sister volcano (Scott, 1987) and Kaharoa domes (Leonard et al., 2002) (Supplementary Figure S12).
Comparison of rhyolitic lavas and domes in subaerial and deep submarine (Havre 2012 rhyolitic lavas and domes) settings has shown the two are closely similar. Deep water above vents might be expected to influence morphology, because elevated confining pressure favors retention of volatiles that lowers the magma viscosity (Murase and McBirney, 1973). On the other hand, enhanced cooling, due to the greater heat capacity of water versus air, might be expected to raise the viscosity (Murase and McBirney, 1973). It could be that in the case of Havre 2012, the two influences were balanced or that neither was significant. The latter option appears most plausible: the Havre melts were probably relatively low in dissolved water, given the anhydrous phenocryst assemblage of the lavas and domes, so elevated confining pressure did little to modify the viscosity of the melt. Enhanced cooling probably influenced only the rate of crust development, and once formed, the crust very effectively insulated the interior from any further cooling by seawater.
Because some Havre 2012 lavas and domes were erupted on a steep slope and others onto flat sea floor, we can assess the influence of substrate slope on morphology. Clearly, the influence was profound – narrow tongues formed in all cases where the rhyolite propagated across the steep caldera wall, and either wide lobes or domes formed where the rhyolite propagated across flat sea floor, both within the caldera or on the caldera rim. On the flat sea floor, the contrast between wide lobes and domes was probably primarily controlled by the available magma volume, small volumes producing domes and larger volumes producing wide lobes.
Observations of active subaerial domes and analog experiments of dome growth have shown that the ratio of discharge rate to cooling rate has a strong influence on dome morphology (e.g., Fink and Griffiths, 1998). In this approach, dome morphology can be used to infer discharge rate. The Havre 2012 domes except G are spiny or Pelean domes; this dome morphology is associated with the lowest discharge and highest cooling rates. The discharge rates for domes K, M, and N (between 0.4 and 1.2 m3/s; Carey et al., 2018) are at the low end of the known range, consistent with the prediction based on morphology alone. However, the effusion rate of the dome pair OP was substantially higher (14.4 m3/s; Carey et al., 2018). This much higher effusion rate relates mainly to the effusion of O because P is a lot smaller than O. The morphological interpretation of O is complicated because it was modified when P was emplaced, but it best fits the spiny category of Fink and Griffiths (1998), despite the much higher effusion rate. It could be that application of this morphological approach to the Havre domes requires that the original scaling and dimensional analysis be revisited for the different ambient conditions in the submarine environment.
Among the domes, G is distinctive in being much lower in relief than the other domes and having well-developed arcuate surface ridges rather than spines typical of the other domes (Figures 6c, 14d). This morphology matches the axisymmetric dome category of Fink and Griffiths (1998), associated with relatively high discharge and low cooling rates. This difference in effusion style was presumably viscosity-controlled, the viscosity of the magma that produced G being lower than that of the other domes. Lower viscosity favors higher discharge rate which in turn influences crust development and outflow distance (e.g., Walker, 1973; Fink and Griffiths, 1990). The cause of G rhyolite having a lower viscosity than the rhyolite that formed the other domes has not been identified.
The Havre 2012 eruption produced 15 submarine rhyolite lavas and domes with a collective volume of 0.21 km3 from 14 separate vents. Five vents (A–E) are aligned along the steep caldera wall between 1,200 and 1,300 m bsl. Four of the five vents produced lavas that flowed to the base of caldera wall, two of which (A, C) extended 450–650 m farther across the flat caldera floor. On the caldera rim (960–1,060 m bsl), eight vents produced domes (G–I, K–P) and one vent produced a lava (F) that flowed 1,070 m down the caldera wall. One caldera-rim vent built two domes (OP), the collective volume of which (∼0.11 km3) is the largest of all the Havre 2012 lavas and domes.
On the steep caldera wall, the lavas consist of narrow tongues. The narrow-tongue segments of lavas A and C are connected to wide lobes on the caldera floor. Although covered by breccia, the narrow tongues probably fed molten rhyolite to the lava flow fronts and also to small breakout lobes. Well-developed arcuate surface ridges on the lavas are the crests of folds developed in response to compression during flowage. With the exception of G, the surfaces of the domes consist of jagged, spiny coherent rhyolite surrounded by aprons of talus and have morphologies typical of low discharge rates. The low profile of G and its lobate morphology imply higher discharge rates which in turn probably reflect lower magma viscosity. The presence of narrow-tongue morphology on the steeply sloping caldera wall versus domes and wide lobes on flat sea floor demonstrates that substrate slope was a major control on morphology. Additional analysis of the Havre lava and dome morphologies could yield information on discharge rates for the lavas erupted from the caldera-wall vents and the domes that lie outside the dispersal of the GP deposit.
The dome and lavas erupted from vents on the caldera wall are older than the GP deposit but probably only slightly older because a breakout lobe from one of them (A) is younger than the GP deposit. Domes K, L, M, N, and OP on the caldera rim are younger than the GP deposit. For these domes, minimum mean eruption rates from 0.14 to 14.4 m3/s can be estimated providing correlation of the GP deposit with the pumice raft witnessed on July 18, 2012, is correct. The ages of lava F and domes G, H, and I relative to the GP deposit could not be established because they are located outside the dispersal area of the GP deposit.
The Havre 2012 vents define three alignments close to the caldera margin. The similar magma composition, strong alignment of vents, small separation between adjacent vents and local presence of ground fissures suggest the vents were fed by fault-controlled dykes.
The Havre 2012 lavas and domes are very similar to subaerial rhyolite lavas and domes in terms of dimensions, volumes, aspect ratios, textures, morphology, discharge rate, and structural controls on vent positions.
FI, JM, RC, AS, and MJ were on the 2015 MESH voyage. FI, JM, and RC led the writing and revision of the article and created the figures. RM conducted a scientific study on one component of this study which has been used in this manuscript. AS contributed to expertise on bathymetry and vehicle data. AS and MJ contributed to discussions, and revision of text and figures.
This research was funded by an Australian Research Council Postdoctoral fellowship to RJC (DP110102196 and DE150101190), and National Science Foundation grants OCE1357443 and OCE1357216. FI was supported by a Tasmanian Government Postgraduate Award.
The authors declare that the research was conducted in the absence of any commercial or financial relationships that could be construed as a potential conflict of interest.
This science would not be possible without the captain, operations teams, marine technicians and crew of the RV Roger Revelle, who we thank for their expert help at sea. We thank the Operations team of the ROV Jason and the AUV Sentry. We particularly thank Dana Yoerger from WHOI for the significant level of assistance on the ship preparing AUV surveys and data processing during and after the MESH voyage. We also thank Sandrin Feig, Karsten Goemann and staff of the Central Science Laboratory at the University of Tasmania. Comments from reviewers Jon Fink and Ilya Bindeman are gratefully acknowledged.
The Supplementary Material for this article can be found online at: https://www.frontiersin.org/articles/10.3389/feart.2018.00147/full#supplementary-material
Allen, S. R., Fiske, R. S., and Tamura, Y. (2010). Effects of water depth on pumice formation in submarine domes at Sumisu, Izu-Bonin arc, western Pacific. Geology 38, 391–394. doi: 10.1130/G30500.1
Bartetzko, A., Paulick, H., Iturrino, G., and Arnold, J. (2003). Facies reconstruction of a hydrothermally altered dacite extrusive sequence: evidence from geophysical downhole logging data (ODP Leg 193). Geochem. Geophys. Geosyst. 4:1087. doi: 10.1029/2003GC000575
Baxter, P. J., Bonadonna, C., Dupree, R., Hards, V. L., Kohn, S. C., Murphy, M. D., et al. (1999). Cristobalite in volcanic ash of the Soufriere Hills Volcano, Montserrat, British West Indies. Science 283, 1142–1145. doi: 10.1126/science.283.5405.1142
Bertin, D., Lara, L. E., Basualto, D., Amigo,Á., Cardona, C., Franco, L., et al. (2015). High effusion rates of the Cordón Caulle 2011-2012 eruption (Southern Andes) and their relation with the quasi-harmonic tremor: effusion rates and quasi-harmonic tremor. Geophys. Res. Lett. 42, 7054–7063. doi: 10.1002/2015GL064624
Binns, R. A., Barriga, F. J. A. S., and Miller, D. J. (2007). “Leg 193 synthesis: anatomy of an active felsic-hosted hydrothermal system, eastern manus basin, papua new guinea,” in Proceedings of the Ocean Drilling Program, 194 Scientific Results Proceedings of the Ocean Drilling Program, eds F. J. A. S. Barriga, R. A. Binns, D. J. Miller, and P. M. Herzig (College Station, TX: Joint Oceanographic Institutions). doi: 10.2973/odp.proc.sr.193.201.2007
Bullock, L. A., Gertisser, R., and O’Driscoll, B. (2018). Emplacement of the Rocche Rosse rhyolite lava flow (Lipari, Aeolian Islands). Bull. Volcanol. 80:48. doi: 10.1007/s00445-018-1222-4
Calder, E.S., Lavallée, Y., Kendrick, J.E., and Bernstein, M. (2015). “Chapter 18 - Lava Dome Eruptions,” in The Encyclopedia of Volcanoes, 2nd Edn, ed. H. Sigurdsson (Amsterdam: Academic Press), 343–362. doi: 10.1016/B978-0-12-385938-9.00018-3
Carey, R., Soule, A. S., Manga, M., White, J., McPhie, J., Wysoczanski, R., et al. (2018). The largest deep-ocean silicic volcanic eruption of the past century. Sci. Adv. 4:e1701121. doi: 10.1126/sciadv.1701121
Carey, R. J., Wysoczanski, R., Wunderman, R., and Jutzeler, M. (2014). Discovery of the largest historic silicic submarine eruption. EOS Trans. AGU 95, 157–159. doi: 10.1002/2014EO190001
Cas, R. (1978). Silicic lavas in Paleozoic flyschlike deposits in New South Wales, Australia: behavior of deep subaqueous silicic flows. Geol. Soc. Am. Bull. 89, 1708–1714. doi: 10.1130/0016-7606(1978)89<1708:SLIPFD>2.0.CO;2
Castro, J. M., Cordonnier, B., Schipper, I. C., Tuffen, H., Baumann, T. S., and Feisel, Y. (2016). Rapid laccolith intrusion driven by explosive volcanic eruption. Nat. Commun. 7:13585. doi: 10.1038/ncomms13585
Embley, R. W., and Rubin, K. H. (2018). Extensive young silicic volcanism produces large deep submarine lava flows in the NE Lau Basin. Bull. Volcanol. 80:36. doi: 10.1007/s00445-018-1211-7
Farquharson, J. I., James, M. R., and Tuffen, H. (2015). Examining rhyolite lava flow dynamics through photo-based 3D reconstructions of the 2011–2012 lava flow field at Cordón-Caulle, Chile. J. Volcanol. Geotherm. Res. 304, 336–348. doi: 10.1016/j.jvolgeores.2015.09.004
Fink, J. A., and Anderson, S. W. (2017). Emplacement of Holocene Silicic lava flows and Domes at Newberry, South Sister, and Medicine Lake volcanoes, California and Oregon. Reston: US Geological Survey.
Fink, J. H. (1980). Surface folding and viscosity of rhyolite flows. Geology 8, 250–254. doi: 10.1130/0091-7613(1980)8<250:SFAVOR>2.0.CO;2
Fink, J. H., and Griffiths, R. W. (1990). Radial spreading of viscous gravity currents with solidifying crust. J. Fluid Mech. 221, 485–509. doi: 10.1017/S0022112090003640
Fink, J. H., and Griffiths, R. W. (1998). Morphology, eruption rates, and rheology of lava domes: insights from laboratory models. J. Geophys. Res. 103, 527–545. doi: 10.1029/97JB02838
Fink, J. H., Malin, M. C., and Anderson, S. W. (1990). Intrusive and extrusive growth of the Mount St Helens lava dome. Nature 348, 435–437. doi: 10.1038/348435a0
Fink, J. H., and Pollard, D. D. (1983). Structural evidence for dikes beneath silicic domes, Medicine Lake Highland Volcano, California. Geology 11, 458–461. doi: 10.1130/0091-7613(1983)11<458:SEFDBS>2.0.CO;2
Fink, J.H., and Anderson, S.W. (2000). “Lava domes and coulees,” in The Encyclopedia of Volcanoes, 1st Edn, ed. H. Sigurdsson (Amsterdam: Academic Press), 307–319.
General Bathymetric Chart of the Oceans (2014). GEBCO 2014 Grid. Available at: https://www.gebco.net/ [accessed July 28, 2015].
Global Volcanism Program (2012). Report on Havre Seamount (New Zealand), in Bulletin of the Global Volcanism Network, Vol. 37, ed. R Wunderman (Washington, D.C: Smithsonian Institution)
Harris, A. J., Rose, W. I., and Flynn, L. P. (2003). Temporal trends in lava dome extrusion at Santiaguito 1922–2000. Bull. Volcanol. 65, 77–89. doi: 10.1007/s00445-002-0243-0
Harris, A. J. L., and Rowland, S. K. (2015). “Lava flows and rheology,” in The Encyclopedia of Volcanoes, 2nd Edn, ed. H. Sigurdsson (Amsterdam: Academic Press), 321–362. doi: 10.1016/B978-0-12-385938-9.00018-3
Honsho, C., Ura, T., Kim, K., and Asada, A. (2016). Post-caldera volcanism and hydrothermal activity revealed by autonomous underwater vehicle surveys in Myojin Knoll caldera, Izu–Ogasawara arc. J. Geophys. Res. 121, 4085–4102. doi: 10.1002/2016JB012971.
Horwell, C. J., Williamson, B. J., Llewellin, E. W., Damby, D. E., and Le Blond, J. S. (2013). The nature and formation of cristobalite at the Soufrière Hills volcano, Montserrat: implications for the petrology and stability of silicic lava domes. Bull. Volcanol. 75, 1–19. doi: 10.1007/s00445-013-0696-3
Jutzeler, M., Marsh, R., Carey, R. J., White, J. DL., Talling, P. J., and Karlstrom, L. (2014). On the fate of pumice rafts formed during the 2012 Havre submarine eruption. Nat. Commun. 5:3660. doi: 10.1038/ncomms4660
Kano, K., Takeuchi, K., Yamamoto, T., and Hoshizumi, H. (1991). Subaqueous rhyolite block lavas in the Miocene Ushikiri Formation, Shimane Peninsula, SW Japan. J. Volcanol. Geotherm. Res. 46, 241–253. doi: 10.1016/0377-0273(91)90086-F.
Kilburn, C. (1993). “Lava crusts, aa flow lengthening and the pahoehoe-aa transition,” in Active Lavas: Monitoring And Modelling, eds C. R. Kilburn and G. Luongo (London: UCL Press), 263–280.
Kilburn, C. (2000). “Lava flows and flow fields”, in The Encyclopedia of Volcanoes, 1st Edn, ed. H. Sigurdsson (Amsterdam: Academic Press), 291–305.
Lara, L. E., Naranjo, J. A., and Moreno, H. (2004). Rhyodacitic fissure eruption in Southern Andes (Cordón Caulle; 40.5°S) after the 1960 (Mw:9.5) Chilean earthquake: a structural interpretation. J. Volcanol. Geotherm. Res. 138, 127–138. doi: 10.1016/j.jvolgeores.2004.06.009
Leonard, G. S., Cole, J. W., Nairn, I. A., and Self, S. (2002). Basalt triggering of the c. AD 1305 Kaharoa rhyolite eruption, Tarawera Volcanic Complex, New Zealand. J. Volcanol. Geotherm. Res. 115, 461–486. doi: 10.1016/S0377-0273(01)00326-2
MacLeod, N. S., Sherrod, D. R., Chitwood, L. A., and Jensen, R. A. (1995). Geologic map of Newberry Volcano, Deschutes, Klamath, and Lake Counties, Oregon. Available at: https://pubs.usgs.gov/imap/2455/ [accessed June 1, 2017].
Mastin, L. G., and Pollard, D. D. (1988). Surface deformation and shallow dike intrusion processes at Inyo Craters, Long Valley, California. J. Geophys. Res. 93, 13221–13235. doi: 10.1029/JB093iB11p13221
Miller, C. D. (1985). Holocene eruptions at the Inyo volcanic chain, California: implications for possible eruptions in Long Valley caldera. Geology 13, 14–17. doi: 10.1130/0091-7613(1985)13<14:HEATIV>2.0.CO;2
Murase, T., and McBirney, A. R. (1973). Properties of some common igneous rocks and their melts at high temperatures. Geol. Soc. Am. Bull., 84, 3563–3592. doi: 10.1130/0016-7606(1973)84<3563:POSCIR>2.0.CO;2
Nakada, S., and Fujii, T. (1993). Preliminary report on the activity at Unzen Volcano (Japan), November 1990-November 1991: dacite lava domes and pyroclastic flows. J. Volcanol. Geotherm. Res. 54, 319–333. doi: 10.1016/0377-0273(93)90070-8.
Pallister, J. S., Diefenbach, A. K., Burton, W. C., Muñoz, J., Griswold, J. P., Lara, L. E., et al. (2013). The Chaitén rhyolite lava dome: eruption sequence, lava dome volumes, rapid effusion rates and source of the rhyolite magma. Andean Geol. 40, 277–294. doi: 10.5027/andgeoV40n2-a06
Paulick, H., Vanko, D. A., and Yeats, C. J. (2004). Drill core-based facies reconstruction of a deep-marine felsic volcano hosting an active hydrothermal system (Pual Ridge, Papua New Guinea, ODP Leg 193). J. Volcanol. Geotherm. Res. 130, 31–50. doi: 10.1016/S0377-0273(03)00275-0
Reches, Z., and Fink, J. (1988). The mechanism of intrusion of the Inyo Dike, Long Valley Caldera, California. J. Geophys. Res. 93, 4321–4334. doi: 10.1029/JB093iB05p04321
Sampson, D. E. (1987). Textural heterogeneities and vent area structures in the 600-year-old lavas of the Inyo volcanic chain, eastern California. Geol. Soc. Am. Special Paper 212, 89–102. doi: 10.1130/SPE212-p89
Schipper, C. I., Castro, J. M., Tuffen, H., Wadsworth, F. B., Chappell, D., Pantoja, A. E., et al. (2015). Cristobalite in the 2011–2012 Cordón Caulle eruption (Chile). Bull. Volcanol. 77:193. doi: 10.1007/s00445-015-0925-z
Scott, W. E. (1987). Holocene rhyodacite eruptions on the flanks of South Sister volcano, Oregon. Geol. Soc. Am. Special Paper 212, 35–54. doi: 10.1130/SPE212-p35
Swanson, D. A., Dzurisin, D., Holcomb, R. T., Iwatsubo, E. Y., Chadwick, W., Casadevall, T. J., et al. (1987). Growth of the lava dome at Mount St. Helens, Washington, (USA), 1981-1983. Geol. Soc. Am. Special Paper 212, 1–16. doi: 10.1130/SPE212-p1
Thal, J., Tivey, M., Yoerger, D., Jöns, N., and Bach, W. (2014). Geologic setting of PACManus hydrothermal area — High resolution mapping and in situ observations. Mar. Geol. 355, 98–114. doi: 10.1016/j.margeo.2014.05.011
Tuffen, H., James, M. R., Castro, J. M., and Schipper, I. C. (2013). Exceptional mobility of an advancing rhyolitic obsidian flow at Cordón Caulle volcano in Chile. Nat. Commun. 4:2709. doi: 10.1038/ncomms3709
Walker, G. P. L. (1973). Lengths of Lava Flows [and Discussion]. Philos. Trans. R. Soc. Lond. A 274, 107–118. doi: 10.1098/rsta.1973.0030
Wright, I. C., Worthington, T. J., and Gamble, J. A. (2006). New multibeam mapping and geochemistry of the 30°–35° S sector, and overview, of southern Kermadec arc volcanism. J. Volcanol. Geotherm. Res. 149, 263–296. doi: 10.1016/j.jvolgeores.2005.03.021
Keywords: lava, dome, submarine effusive eruption, rhyolite, Havre
Citation: Ikegami F, McPhie J, Carey R, Mundana R, Soule A and Jutzeler M (2018) The Eruption of Submarine Rhyolite Lavas and Domes in the Deep Ocean – Havre 2012, Kermadec Arc. Front. Earth Sci. 6:147. doi: 10.3389/feart.2018.00147
Received: 29 June 2018; Accepted: 14 September 2018;
Published: 17 October 2018.
Edited by:
Carles Soriano, Instituto de Ciencias de la Tierra Jaume Almera (ICTJA), SpainReviewed by:
Jonathan Fink, Portland State University, United StatesCopyright © 2018 Ikegami, McPhie, Carey, Mundana, Soule and Jutzeler. This is an open-access article distributed under the terms of the Creative Commons Attribution License (CC BY). The use, distribution or reproduction in other forums is permitted, provided the original author(s) and the copyright owner(s) are credited and that the original publication in this journal is cited, in accordance with accepted academic practice. No use, distribution or reproduction is permitted which does not comply with these terms.
*Correspondence: Jocelyn McPhie, ai5tY3BoaWVAdXRhcy5lZHUuYXU=
Disclaimer: All claims expressed in this article are solely those of the authors and do not necessarily represent those of their affiliated organizations, or those of the publisher, the editors and the reviewers. Any product that may be evaluated in this article or claim that may be made by its manufacturer is not guaranteed or endorsed by the publisher.
Research integrity at Frontiers

Learn more about the work of our research integrity team to safeguard the quality of each article we publish.