- Department of Terrestrial Magnetism, Carnegie Institution for Science, Washington, DC, United States
The paleomagnetic record is central to our understanding of the history of the Earth. The orientation and intensity of magnetic minerals preserved in ancient rocks indicate the geodynamo has been alive since at least the Archean and possibly the Hadean. A paleomagnetic signature of the initial solidification of the inner core, arguably the singular most important event in core history, however, has remained elusive. In pursuit of this signature we investigate the assumption that the field is a geocentric axial dipole (GAD) over long time scales. We study a suite of numerical dynamo simulations from a paleomagnetic perspective to explore how long the field should be time-averaged to obtain stable paleomagnetic pole directions and intensities. We find that running averages over 20 − 40 kyr are needed to obtain stable paleomagnetic poles with α95 < 10°, and over 40 − 120 kyr for α95 < 5°, depending on the variability of the field. We find that models with higher heat flux and more frequent polarity reversals require longer time averages, and that obtaining stable intensities requires longer time averaging than obtaining stable directions. Running averages of local field intensity and inclination produce reliable estimates of the underlying dipole moment when reversal frequency is low. However, when heat flux and reversal frequency are increased we find that local observations tend to underestimate virtual dipole moment (VDM) by up to 50% and overestimate virtual axial dipole moment (VADM) by up to 150%. A latitudinal dependence is found where VDM underestimates the true dipole moment more at low latitudes, while VADM overestimates the true axial dipole moment more at high latitudes. The cause for these observed intensity biases appears to be a contamination of the time averaged field by non-GAD terms, which grows with reversal frequency. We derive a scaling law connecting reversal frequency and site paleolatitude to paleointensity bias (ratio of observed to the true value). Finally we apply this adjustment to the PINT paleointensity record. These biases produce little change to the overall trend of a relatively flat but scattered intensity over the last 3.5 Ga. A more careful intensity adjustment applied during periods when the reversal frequency is known could reveal previously obscured features in the paleointensity record.
1. Introduction
Our knowledge of the history of Earth's magnetic field derives from paleomagnetic signals preserved in rocks. Many applications of paleomagnetism rely on an assumption that only the geocentric axial dipole (GAD) component remains after averaging the complex time-variable magnetic field over a sufficient amount of time, typically assumed to be around 10–20 kyr (Merrill and McFadden, 2003). This GAD field assumption has been extremely rewarding, for example in obtaining paleointensities (e.g., Biggin et al., 2009; Tauxe and Yamazaki, 2015), paleodirections and tectonic reconstructions (e.g., Torsvik et al., 2012; Raub et al., 2015), and even paleoclimate studies that rely on paleomagnetically derived paleolatitudes (Evans et al., 2000; Williams and Schmidt, 2004). Tests of the GAD field assumption have generally found support for its validity (e.g., Johnson et al., 1995; Acton et al., 1996; Meert et al., 2003; McElhinny, 2004; Evans, 2006; Swanson-Hysell et al., 2009; Panzik and Evans, 2014; Veikkolainen et al., 2014, 2017; Johnson and McFadden, 2015), although some have proposed long-term deviations from GAD in the Precambrian (Kent and Smethurst, 1998; Abrajevitch and Van der Voo, 2010).
Theoretically a GAD field is predicted over long time averaging because the equations governing dynamo action are symmetric about the transformation , symmetric about the equator, and symmetric in rotation about the polar axis (Gubbins and Zhang, 1993). These symmetries imply that if random samples are time averaged long enough only the axial dipole term should retain a non-zero amplitude. However, the length of time required to average out all non-GAD terms is typically assumed rather than measured, and could itself vary significantly, especially during periods when the field is highly variable or frequently reversing (Merrill and McFadden, 2003).
The remarkable progress in reconstructing the motions of the continents has been fueled in large part by the success of the GAD assumption. However, some anomalous data are not explained by a simple GAD field. In particular, a growing number of anomalous directions in the Neoproterozoic (e.g., Maloof et al., 2006; Abrajevitch and Van der Voo, 2010; McCausland et al., 2011; Swanson-Hysell et al., 2012; Halls et al., 2015; Klein et al., 2015; Levashova et al., 2015; Bazhenov et al., 2016) have been variously interpreted as caused by extremely rapid plate motions, significant true polar wander, long-term non-GAD magnetic field components, or some mixture of these.
An additional puzzle that has garnered recent attention is the surprising lack of an obvious paleomagnetic signature of inner core nucleation (ICN) in the paleointensity record. Biggin et al. (2015) found a paleointensity peak between 1.0 and 1.5 Ga that could be a signature of ICN. Recently the primary signature of some of the underlying data has been questioned and revised (e.g., Smirnov et al., 2016; Sprain et al., 2018). Simultaneously, recent upward revisions of the thermal conductivity of iron have decreased estimates of the age of the inner core to Neoproterozoic time (e.g., Driscoll and Bercovici, 2014; Davies, 2015; Nimmo, 2015), although significant uncertainty remains.
There are at least three possible reasons for the lack of a clear paleomagnetic signature of ICN: (1) the paleomagnetic signature of ICN is too small or old to be preserved, (2) the paleointensity record is too sparse, or (3) the signature is obscured by non-GAD fields. Regarding the latter possibility, it has recently been proposed that prior to inner core nucleation around 600 Ma a non-GAD field may have been persistent in the Neoproterozoic as a consequence of the geodynamo being powered only by weak thermal convection at the time (Driscoll, 2016; Landeau et al., 2017). Unfortunately the paleointensity record around this time is sparse, possibly due to a lack of wide spread magmatism, a lack of preservation, inability to recover primary remanence, or low quality criteria. In any case, there is an impetus to investigate how paleomagnetic recordings are affected by a range of dynamo regimes and field morphologies from both empirical and theoretical grounds. Obtaining new high quality data, developing new analysis techniques of old data, and investigating synthetic data from numerical dynamo models all provide a way forward. In this paper we focus on the latter approach.
Several previous studies have generated synthetic observations from numerical dynamos for different purposes. Wicht (2005) found the that the observed length of reversal durations can change by an order of magnitude as a function of observed site latitude. A statistical analysis of several numerical dynamos by McMillan et al. (2001) found significant variation in field components when averaged over 100 kyr, and that a minimum of 10 dipole decays times were required to obtain stable estimates of the dipole field. Similarly Davies and Constable (2014) found that averaging over several hundred thousand years was required to obtain stable dipole field estimates, and longer averaging is needed for more turbulent (higher Rm) dynamo models. Lhuillier and Gilder (2013) found that roughly one million years was required to achieve stationary intensities and directions, and that these quantities correlate with stable chron duration.
In this paper we systematically explore how long a time average is required to obtain a GAD field from a range of dynamo regimes that span stable dipolar to reversing non-dipolar. We generate local synthetic (or “virtual”) geomagnetic observations from these models to investigate possible intrinsic biases generated by the core magnetic field itself; i.e., not caused by rock magnetic affects, alterations, or external forcings. In particular we aim to identify whether the dynamics of the core can produce predictable biases in the time averaged paleomagnetic field, in terms of both paleomagnetic directions and paleointensities, and whether such biases can be identified and removed from paleomagnetic data to reveal previously obscured features.
The paper is organized into two parts. The first part is an analysis of numerical dynamo models by synthetic observations. In section 2 we introduce the numerical dynamos and synthetic analysis methods, followed by results in section 3. The second part is an application to the paleointensity record. In section 4 we review the paleointensity record, accounting for several recently identified issues with certain paleointensity estimates, and adjust the record according to the results of the dynamo models. Finally, implications and conclusions are in section 5.
2. Numerical Dynamos and Analysis Methods
We produce a suite of numerical dynamo models spanning a range of behavior from stable dipolar to reversing non-dipolar. We analyze these models using synthetic “observations” analogous to paleomagnetic data (i.e., from locations on Earth's surface). Possible biases and correlations between “known” and “observed” quantities will be quantified as a function of the length of time averaging, reversal rate, and site co-latitude.
2.1. Dynamo Model Setup
The dynamo models are computed using the Rayleigh dynamo code (Featherstone and Hindman, 2016; Matsui et al., 2016). All models share the following control parameters: E = 10−3, Ra = 106, Pr = 1, Pm = 10, insulating magnetic boundary conditions, no-slip velocity conditions, inner-outer core radius ratio of 0.35, and fixed temperature gradient at both boundaries (see Table 1). These relatively high Ekman number simulations produce Earth-like large scale magnetic features (see below) and polarity reversals that resemble geomagnetic observations, and are numerically cheap so they can be run extremely long times to produce low frequency statistics. The inner boundary temperature gradient (i.e., basal heat flux) dT/dri, fixed in time in each model, spans a range of 0.8 − 12 (in non-dimensional units). In the dynamo code the Rayleigh number is defined in terms of the temperature drop across the shell ΔT for isothermal boundary conditions. For fixed flux Ra is defined by the specified lower boundary temperature gradient by , where D = 1 is the dimensionless shell thickness. These basal heat fluxes produce a range of behavior from stable dipolar dynamos on the lower end to unstable, reversing non-dipolar dynamos at the high end (Table 1). The temperature gradient at the outer boundary is set to balance the heat flow at the base so that energy is conserved and there is no internal sink or source.
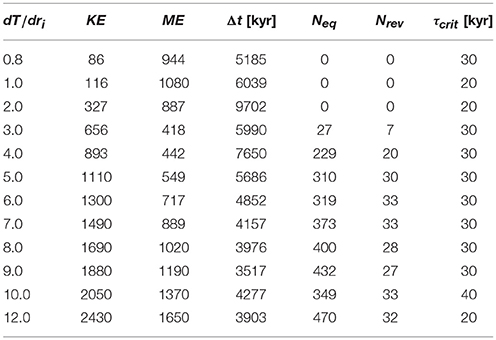
Table 1. Dynamo model properties: basal heat flux dT/dri, time averaged volumetric kinetic energy (KE) and magnetic energy (ME), length of run Δt in kyr, number of dipole equator crossings Neq, number of polarity reversals Nrev, and critical running average length τcrit when .
Time is scaled from thermal diffusion times (implemented in the code) to years by multiplying by a factor , where ro = 1.5384 is dimensionless outer core radius, and τdip = 50 kyr is the assumed magnetic dipole decay time of the core. We adopt the same definition of a polarity reversal proposed by Driscoll and Olson (2009): that the dipole co-latitude θdip spend at least 20 kyr in a stable polarity before and after a reversal. We note that the time scaling is not unique and adopting an advective scaling could shift the time scale by a factor of ~10 (Lhuillier and Gilder, 2013).
2.2. Analysis Method
From each model we compute Gauss coefficients gl, m(t) and hl, m(t) over time, t, at Earth's surface from magnetic field spectra at the CMB (e.g., Merrill et al., 1996). Although the dynamo model spectra are resolved out to harmonic degree l ≤ lmax = 64 we only compute Gauss coefficients out to lmax = 8 because larger harmonics contribute very little to the surface magnetic field.
From the Gauss coefficients we compute the geocentric axial dipole (GAD) intensity,
the full dipole intensity,
the RMS non-axial dipole (NAD) intensity,
and the total RMS Gauss field intensity,
We also compute local magnetic field quantities on Earth's surface that are interpreted as synthetic observations. From the Gauss coefficients we compute the surface vector magnetic field components Bx, By, and Bz from the magnetic potential Ψ(r, θ, ϕ) at a point on the surface at radius r = a,
where
and a = 2.8157 is the dimensionless radius of Earth in these models, θ is co-latitude, ϕ is longitude, and are Schmidt normalized Legendre polynomials (Merrill et al., 1996). From the local field components we compute the local magnetic field intensity F as
Synthetic paleomagnetic observations are generated at ϕ = 0 and 6 co-latitudes in 15° increments: θ = 15°, 30°, 45°, 60°, 75°, and 90°.
Synthetic observations of magnetic direction are also generated at these locations. These include local magnetic declination D
inclination I,
angular pole distribution α95 with 95% probability,
where N is the number of observations, and Fisher's precision parameter k
where the resultant is
and the directional cosines are li = cos Di cos Ii, mi = sin Di cos Ii, and ni = sin Ii (Merrill et al., 1996).
The “true” or “known” (dimensionless) dipole moment pDM is
where gD is from (2). The “true” geocentric axial dipole moment pADM is
where gAD is from (1). These “true” dipole moments pDM and pADM are obtained directly from the dynamo model and will be compared to synthetic or “virtual” observations that attempt to infer these quantities at the surface. The “virtual” dipole moment (VDM) is the amplitude of a geocentric dipole that gives rise to an observed magnetic field vector at the surface (Tauxe and Yamazaki, 2015) and is computed from the local magnetic intensity F and inclination I by (Merrill et al., 1996)
The virtual axial dipole moment pV ADM is the amplitude of a geocentric axial dipole that gives rise to an observed magnetic intensity at a known co-latitude θk
For a GAD, the co-latitude and magnetic inclination are related by
Even with constant control parameters and boundary conditions the dynamo models produce a highly time variable magnetic field so that there is no single “true” moment for a single model, but rather a stationary time average with some characteristic fluctuations about that average. Therefore, it is important to consider the role of time averaging in producing a paleomagnetic direction or intensity. The length of the time average τ applied to the dynamo model time series could be interpreted as the time over which a series of paleomagnetic observations are averaged to get a single data point in time (e.g., segment of a sedimentary sequence), or the time over which the magnetic carrier obtains a remnant signal of the ambient field (e.g., cooling of a magmatic unit below its Curie temperature). We average each quantity of interest over a number of smoothing times τ from 5 to 500 kyr. For each τ the dynamo model time series is split into N = Δt/τ sub series, where Δt is the total length of the model in kyr. Within each sub-series a running mean is computed following the method of Davies and Constable (2014):
where xi is some output from the dynamo model at the ith sampling index within each sub-series. The final running average value is computed over a time window of length τ for each sub series and corresponds to the value in (18) at the final index in each sub series. Finally an average and standard deviation of these N running averages is computed. Both the “true” and “observed” quantities will be time averaged the same way. Dynamo model output quantities have an output sampling frequency of about once every 1 kyr for all models.
3. Results
We apply the analysis methods described above to the suite of dynamo simulations summaried in Table 1. In this section we investigate how long a time base-line of observations must be averaged to obtain a pure geocentric axial dipole (GAD) field, and how this time baseline depends on the dynamics of the model. Finally we investigate how local virtual observations of inclination, intensity, and inferred dipole moment compare to the true dipole values for the suite of dynamos.
3.1. An Earth-Like Dynamo Model
To demonstrate that these models are in a relevant region of parameter space, we first focus the details of an “Earth-like” model with dT/dri = 4, which we will refer to as “model 4.” Figure 1 shows the time series of dipole co-latitude and the axial dipole Gauss coefficient gl = 1, m = 0 for model 4. This model reverses 20 times over 7.6 Myr (2.61 reversals per Myr) and the dipole spends about equal time in each hemisphere. It is nominally “Earth-like" according to the definition of Christensen et al. (2010) with an axial to non-axial dipole ratio “AD/NAD” of 0.29, an odd to even ratio “O/E” of 0.87, zonal to non-zonal ratio “Z/NZ” of 0.05, and flux concentration of 2.37, all within one standard deviation of the Earth-like values of 1.4, 1.0, 0.15, 1.5 respectively. Using the standard deviations expected by Christensen et al. (2010), these values produce a summary rating of χ2 = 6.88, which is considered “marginally” Earth-like. Note that these statistics are time variable so that the model can be more or less Earth-like over time, and that we are reporting the time averaged statistics over the entire length of the run (7.6 Myr). These magnetic field statistics give us some confidence that our models produce magnetic fields that are “Earth-like” at the largest scales even though they are many orders of magnitude from the Earth in several non-dimensional parameters. A recent comparison of “Earth-like” dynamos that span a huge range in control parameters demonstrates that the large scale features and low frequency variability can be captured even when the small scale dynamics are not resolved (Aubert et al., 2017). Nevertheless, our results should be compared to higher resolution simulations in the future.
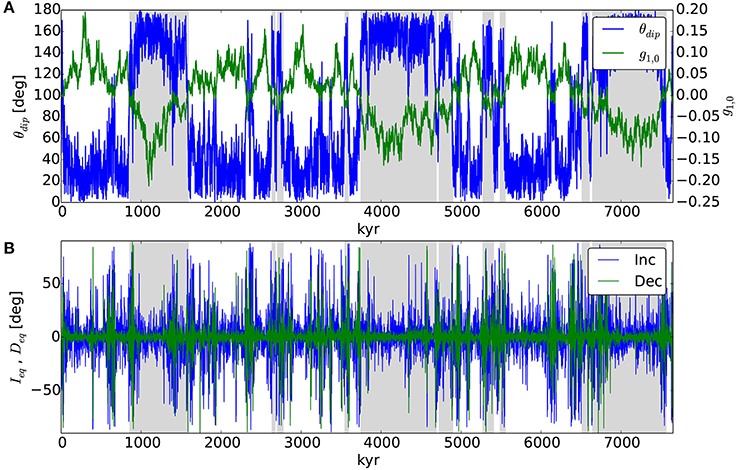
Figure 1. Time series of model 4 (dT/dri = 4): (A) dipole co-latitude θdip (left axis) and axial dipole Gauss coefficient g1,0 (right axis). Background shading gray (white) denotes normal (reversed) polarity chrons. (B) Magnetic inclination Ieq and declination Deq of synthetic observations at equator (θ = 90°, ϕ = 0).
Also shown in Figure 1 are time series of magnetic inclination and declination as observed at an arbitrary point on Earth's surface: at the equator θ = 90° and ϕ = 0, referred to as Ieq and Deq. Synthetic observations generated in this way will be analyzed from a paleomagnetic perspective and compared to the true solutions. Next we will test the ability to retrieve the true dipole directions and intensities from a time series of synthetic paleomagnetic observations.
3.2. Effects of Time Averaging
Figure 2 shows an example of the time series smoothing analysis in (18) applied to g1,0 from model 4 for four smoothing lengths τ. Clearly in this occasionally reversing model g1,0 has long-term variability on Myr time scales that is not captured even by smoothing over 500 kyr (Figure 2D). However, RMS quantities may converge to stationary values faster.
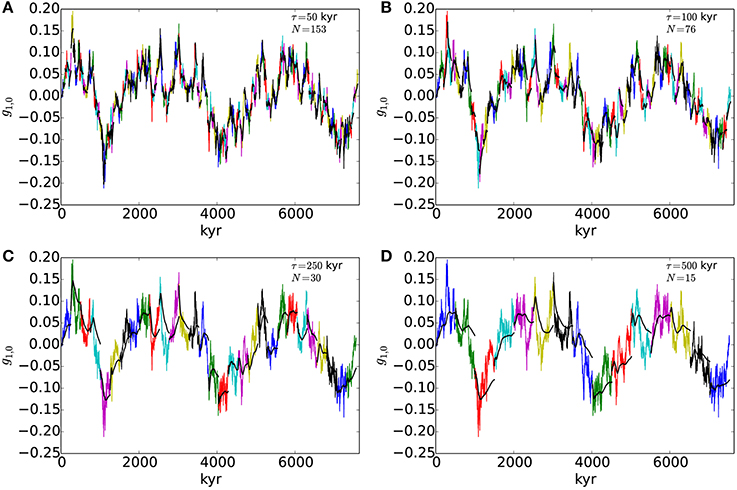
Figure 2. Running average (black) of subsets (colors) of g1,0 time series from model 4. Running average length of τ = 50 kyr (A), τ = 100 kyr (B), τ = 250 kyr (C), and τ = 500 kyr (D).
Figure 3 shows the mean and standard deviation of the running mean of four output quantities (i.e., ) from model 4 for a range of τ. Figure 3A shows that the average of (i.e., the average of the running averages of g1,0 from all sub series) converges to zero for all choices of τ, as expected for this reversing model that spends roughly equal time in normal (g1,0 < 0) and reversed (g1,0 > 0) polarity states (Figure 1). The relatively large standard deviation of reflects the long-term variability that is not averaged out within each sub series. This is expected if τ is less than the longest time scale of intrinsic variability of the model. Figure 3B shows that the average from (3) is also near zero for all τ, implying that all other field harmonics (everything other than g1,0) individually balance to zero. The standard deviation of also approaches zero at large τ, implying that non-axial dipole fields more consistently balance out over longer time averaging than g1,0. Figure 3C shows that the running mean of RMS axial dipole from (1) and RMS dipole from (2) are stationary and non-zero over all τ. Figure 3D shows that the local magnetic amplitude at the equator is similarly stationary and non-zero over all τ and similar in amplitude to . A more comprehensive comparison between observed and true intensities as a function of co-latitude is below.
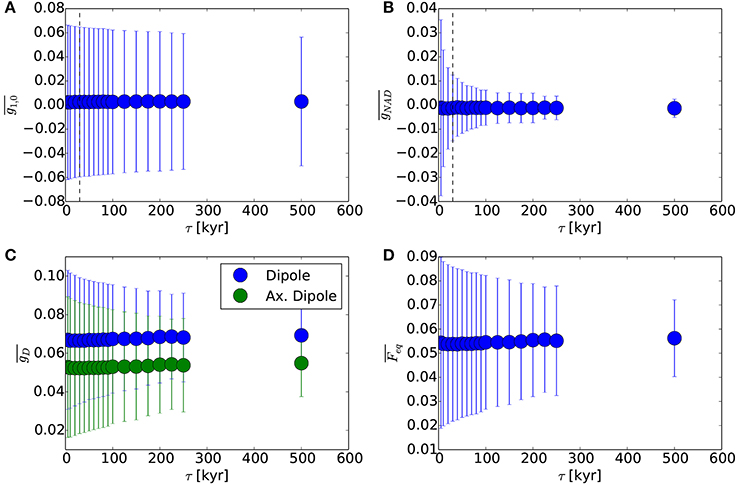
Figure 3. From model 4, mean and standard deviation (error bars) of running means of dynamo statistics for a range of running average lengths τ. (A) . (B) Gauss coefficients of non-axial dipole from (3). (C) Dipole from (2). (D) Magnetic amplitude at a point on the equator from (7).
Figure 4 shows the average of running averages of four equatorial (θ = 90°, ϕ = 0) observations of magnetic pole-related quantities from model 4: declination from (8), inclination from (9), α95 from (10), and Fisher's precision parameter k from (11). The average of and hover around zero, which is the expected orientation of a geocentric axial dipole observed at the equator. The standard deviation of and decrease steadily with τ as the non-axial magnetic terms balance out, similar to the trend in in Figure 3B. The angular spread α95 in the paleomagnetic pole decreases rapidly with τ while the precision parameter k plateaus around 15. A vertical dashed line is drawn at the largest τ where , which is a typical threshold value for computing a paleomagnetic pole (e.g., Van der Voo, 1990). For model 4 this occurs at τ = 30 kyr, implying that to obtain a stable magnetic pole orientation for this Earth-like model the local field must be averaged over about 30 kyr.
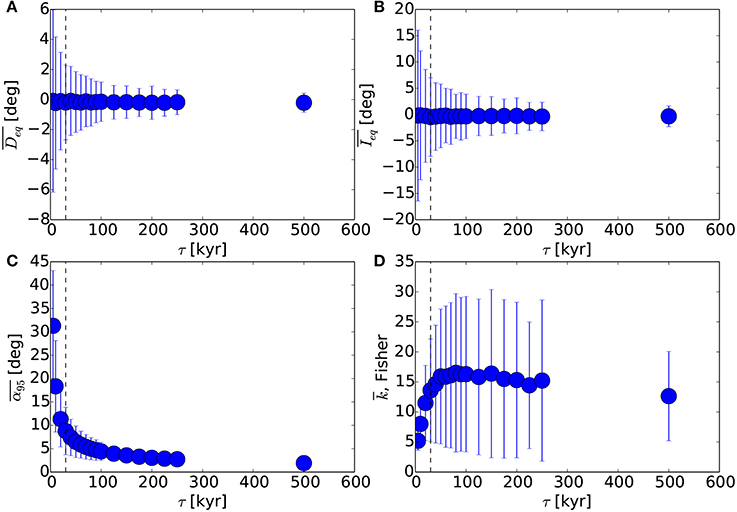
Figure 4. From model 4, mean and standard deviation (error bars) of running means of synthetic observations at the equator for a range of running average lengths τ. (A) Magnetic declination from (8). (B) Magnetic inclination from (9). (C) Angular spread of magnetic pole location at 95% confidence level, α95 from (10). (D) Fisher's precision parameter k from (11).
So far we have investigated synthetic observations at the equator of a single Earth-like dynamo model with a basal heat flux of dT/dri = 4. Next we examine how synthetic observations of the time averaged field depend on the basal heat flux and site co-latitude θ.
3.3. Dynamo Regimes
How does the dynamical regime of the core dynamo influence synthetic observations at the surface? How do they differ (if at all) from the known solutions? These questions can addressed by investigating the suite of dynamos that span dynamical regimes from stable non-reversing at low basal heat flux (dT/dri = 0.8) to reversing non-dipolar at high basal heat flux (dT/dri = 12). The major dynamo transition from dipolar non-reversing models to non-dipolar reversing models occurs around dT/dri = 3. This transition is apparent in Figure 5A where the time average of the volume averaged magnetic energy (ME) drops into a minimum due to a weakening of the axial dipole, Figure 5B where time-averaged gAD drops by a factor of ~4, Figure 5C where reversals begin, and Figure 5D where the time-averaged axial dipolarity (i.e., time average of g1,0(t)/gRMS(t)) drops below ~ 0.5.
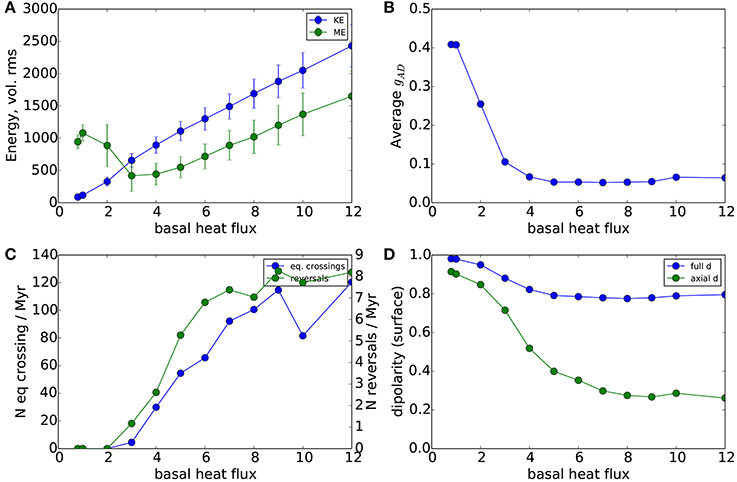
Figure 5. Comparison of time average dynamo statistics. (A) Time averaged volumetric RMS kinetic (KE) and magnetic energies (ME). (B) Time averaged RMS axial Gauss coefficient g1,0. (C) Number of dipole axis equator crossings (left scale) and number of reversals (right scale) per Myr. (D) Time averaged dipolarity of Gauss coefficients for the full dipole gD/gRMS and the axial dipole g1,0/gRMS.
Interestingly, Figure 5A shows that volume averaged ME drops to a minimum at the onset of reversals (dT/dri = 3) and then increases with heat flux nearly in parallel with kinetic energy (KE) as heat flux increases. Because of the preference for low harmonic degree fields at the surface, the decrease in the dipole dominates the total surface magnetic field, leading to a sudden drop in gAD at the reversing onset and a floor of gAD = 0.05 for more energetic models (Figure 5B). The gAD floor may indicate saturation of the dipole field where generation of a stronger dipole by faster convective velocities is balanced by turbulent disruption of the large scale field. Dipole reversal frequency increases with basal heat flux (Figure 5C), implying that dT/dri is a proxy for reversal frequency and dipole stability in these models. The plateau in reversal frequency around 8/Myr is an artifact of our requirement that a reversal be bracketed by stable periods longer than 20 kyr, which become less common as the heat flux increases.
3.4. Obtaining Stable Poles and Intensities From Synthetic Observations
Next we apply the local paleomagnetic analysis methods from section 2.2 to all models with the goal of quantifying how the time required to obtain a stable paleomagnetic pole and intensity depends on the dynamical state of the core. We define the critical smoothing time τcrit as the running mean length where α95 falls below a threshold value of either 5° or 10°. This is the length of time averaging needed to obtain a stable virtual paleomagnetic pole from continuous observations at a single location.
Figure 6A shows that the critical smoothing time τcrit increases for more energetic dynamos driven by larger basal heat fluxes. A threshold of requires τcrit of 20–40 kyr, while a threshold of requires τcrit of 40 − 150 kyr. Figures 6B–D show the average running mean of several other dynamo statistics computed at τcrit. Surprisingly Figure 6D shows that does not converge to zero for stable dipolar models (dT/dri < 4), which implies that directional scatter around the paleomagnetic pole converges faster than the intensity of the non-dipolar magnetic field. More generally, this implies that longer running averages are needed to converge to stationary intensities than directions.
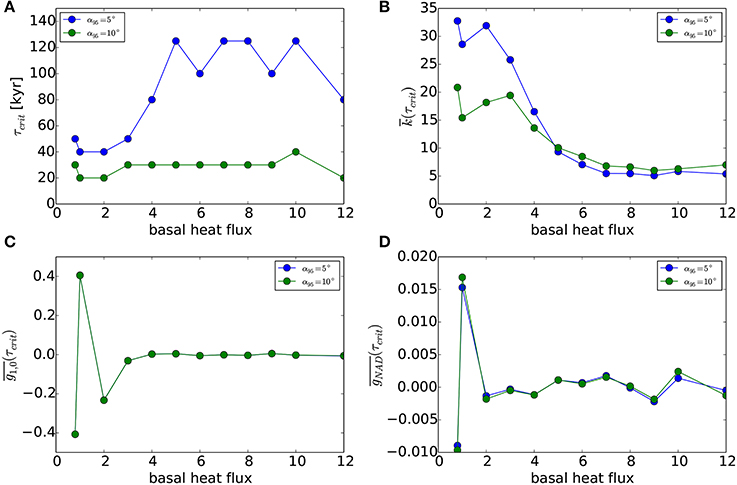
Figure 6. (A) Comparison of critical running average length τcrit where or 10° for all models. (B) Same for Fisher's k(τcrit) parameter, (C) , and (D) , where τcrit at each basal heat flux is from (A).
3.5. Synthetic Intensities and Inclinations
Next we analyze synthetic dipole moment observations at 6 points on the surface (ϕ = 0 and θ = 15°, 30°, 45°, 60°, 75°, 90°). Running averages of the observed magnetic inclination from (9) and magnetic intensity from (7) are compared to their “true” values in Figure 7 for a chosen averaging time of τ = 500 kyr. Each point in Figure 7 is an average of the running average for each quantity. We take absolute value of the inclination so that the time average converges to a non-zero number for reversing models and limits the range of possible inclinations observed in the northern hemisphere to [0°, 90°].
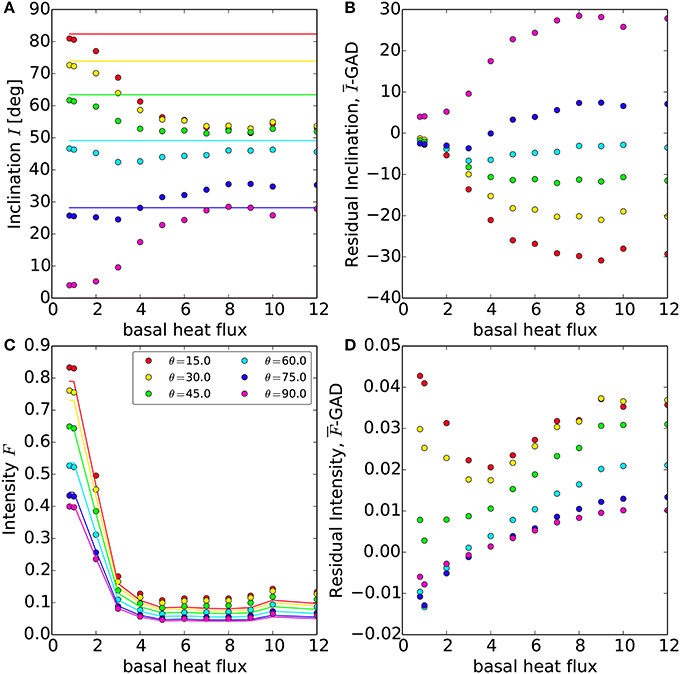
Figure 7. Comparison of synthetic observations with τ = 500 kyr. (A) Observed running average inclination (circles) from (9), colors correspond to site co-latitude θk (see legend), solid lines are the GAD inclination, computed from (17) with θk. (B) Residual between observed and GAD inclination. (C) Observed running average magnetic intensity (circles) from (7), colors correspond to site co-latitude θk (see legend), and solid lines are the GAD intensities. (D) Residual between observed and GAD intensity.
At low basal heat flux the dipole is dominant and stable, producing time-averaged synthetic observations of and close to their true values (Figure 7). As heat flux increases non-dipolar field components increasingly contribute to the time averaged local magnetic vector (Figure 7C). Contamination by these non-GAD components may be equivalent to adding a randomly oriented vector to the GAD field, which skews toward 45°, the average inclination of a randomly oriented vector in one quadrant. This contamination causes the inclination to be severely underestimated at low co-latitudes (θ = 15°) and overestimated at high co-latitudes (θ = 90°), with residuals that increase with heat flux (Figures 7A,B).
For all basal heat fluxes, synthetic observations of magnetic intensity tend to systematically over-estimate the intensity of a pure GAD (Figure 7C). This over-estimate increases with heat flux as non-GAD components contribute more to the time averaged field. This overestimate is larger at low co-latitude (θ = 15°) and weaker near the equator (θ = 90°) (Figures 7C,D). Note that the residual time-averaged inclinations (Figure 7B) and intensities (Figure 7D) are both non-zero even for non-reversing dynamos (dT/dri < 3) where the presence of non-dipolar field components contaminate the time-averaged field.
Another way to test adherence to a GAD field is by plotting the average observed inclinations vs. the known co-latitude θk (Figure 8), where the pure GAD relationship is known from (17). Similar to Figure 7 this comparison also shows that the low heat flux models adhere closely to a pure GAD field but that as heat flux (and reversal frequency) increase they stray away from the GAD curve (Figure 8). Also as seen in Figure 7A, tends to underestimate GAD at low θ and overestimate at high θ (Figure 8). Mixtures of GAD with the axial quadrupole G2 = g2,0/g1,0 and axial octopole G3 = g3,0/g1,0 describe the high heat flux models slightly better than pure GAD, but only at high θk.
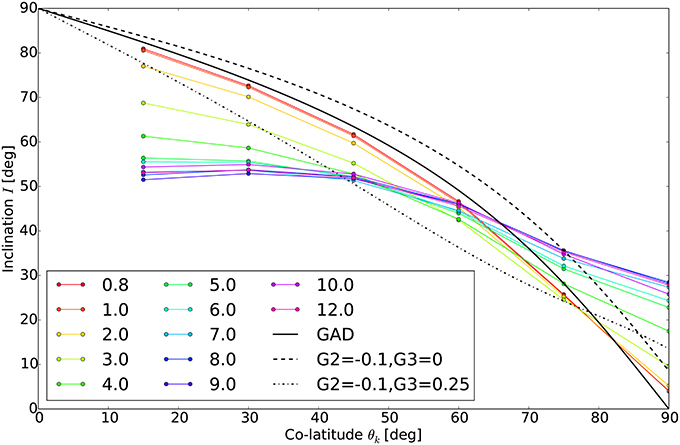
Figure 8. Known site co-latitude θk vs. observed inclination from Figure 7A. Colors correspond to basal heat flux in legend. Also shown is GAD (solid black), GAD plus G2 = −0.1 (dashed black), and GAD plus G2 = −0.1 and G3 = +0.25 (dash-dot black). The relative amplitudes of the quadrupole G2 = g2,0/g1,0 and G3 = g3,0/g1,0 shown are from Kent and Smethurst (1998).
3.6. Synthetic Dipole Moments
Next we compute the virtual full (pV DM) and axial (pV ADM) dipole moments inferred from the time-averaged synthetic observations of and using (15,16), respectively (Figure 9). pV ADM only depends on one observed quantity, intensity , and subsequently the inferred values of pV ADM (Figures 9C,D) follow (Figures 9C,D). On the other hand, pV DM depends on both observed quantities, and , and the resulting residual from the known pDM has a more complicated dependence on both intensity and inclination (Figure 9B).
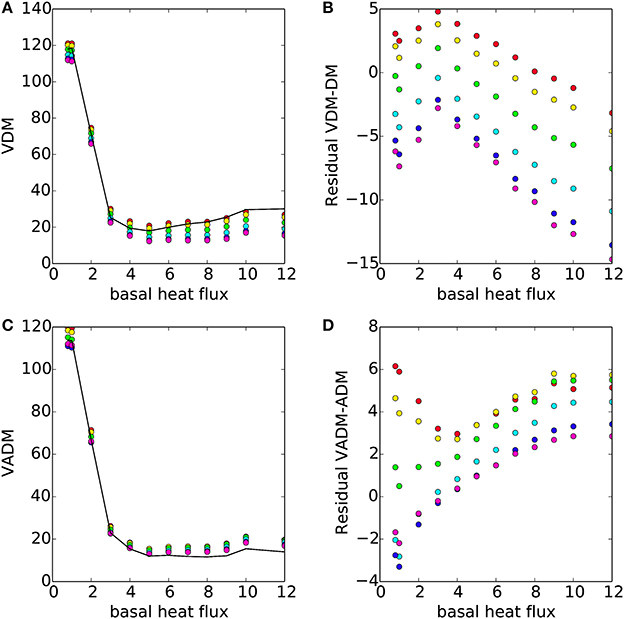
Figure 9. (A) Synthetic observations of PV DM (filled circles) from (15) compared to the true PDM (black line) from (13). Colors refer to the same site co-latitudes as in Figure 7. (B) Residual between observed PV DM and true PDM. (C,D) are the same as (A,B) for PV ADM from (16) and PADM from (14).
The ratio of virtual dipole moment pV DM in (15) to true dipole moment pDM in (13), or dipole moment bias, is
and similarly for the ratio of virtual axial dipole moment pV ADM in (16) to true axial dipole moment pADM,
Figure 10 shows that bDM tends to scatter around the true value (i.e., bDM = 1) for non-reversing dipolar models, but then trends down to as low as ~0.6 for reversing models. The scatter in bDM about this trend increases systematically with reversal frequency Rf. The decrease of bDM with Rf in Figure 10 is caused mainly by a drop in in (19) because tends toward a constant (~ 45°) as Rf increases (Figure 7A). The decrease in , in turn, is caused by the local intensity becoming more and more contaminated by non-dipole field components with arbitrary sign that occasionally balance out as heat flux increases, so that on average . We have found these ratios are roughly the same for τ = 50, 100, and 500 kyr, indicating that this bias does not depend sensitively on the length of time averaging.
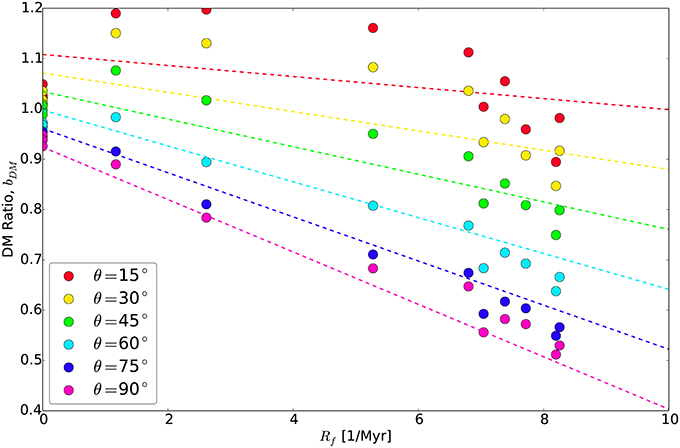
Figure 10. Dipole moment bias bDM from (19). Colors refer to site co-latitude (see legend). Dashed lines are from bilinear fit in (23).
On the other hand, the axial dipole moment ratio bADM increases with reversal frequency from bADM ~ 1 at Rf = 0 up to bADM ~ 1.4 at Rf = 8 Myr−1 (Figure 11). In contrast to bDM, the increasing trend of bADM with Rf is caused by decreasing faster than in (20) as a function of Rf. This bias can be attributed to the GAD assumption that the field is purely axial when it is not and non-axial dipolar field components contributing to increase local intensity, so that on average .
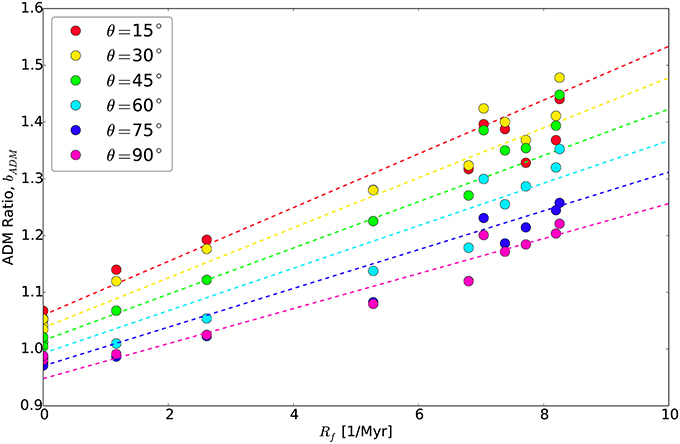
Figure 11. Dipole moment bias bADM from (20). Colors refer to site co-latitude (see legend). Dashed lines are from bilinear fit in (24).
Combining these two constraints, pV DM < pDM from Figure 10 and pV ADM > pADM from Figure 11, gives
where we have converted the observed to using the GAD assumption in (17). At mid-latitudes where the observed paleo-co-latitude is similar to the true co-latitude (Figure 7A), (21) reduces to
The inequality in (22) implies that local fields of arbitrary sign combine to decrease slightly less than the full dipole field (l = 1, m = 0, ±1) but to increase it slightly more than the axial dipole (l = 1, m = 0) alone. In this sense, the time averaged intensity at mid-latitudes is bracketed by the GAD and full dipole field intensity.
Lastly, in an attempt to extract a scaling law that describes these effects we assume a bi-linear form for the dipole moment bias b as a function of observed (or assumed) reversal frequency Rf, and observed (or inferred) paleo-co-latitude θ,
where the fit coefficients extracted from the synthetic observations in Figures 10, 11 are shown in Table 2. This scaling law could potentially be used to adjust estimates of the dipole moment from local measurements of intensity and inclination. Next we will apply this bias scaling law to published paleointensity data.
4. PINT Paleointensity Database
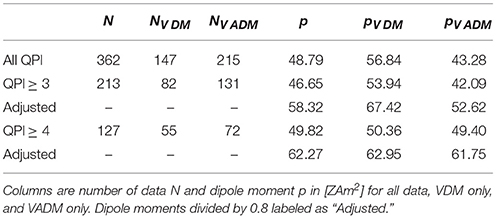
The PaleoINTensity (PINT) database of Biggin et al. (2009) is a compilation of absolute paleointensity measurements using Thellier-type experiments with each site mean produced from at least 3 individual measurements and a standard deviation that is not more than 25% of the mean. The database (downloaded from http://earth.liv.ac.uk/pint/) was last updated in 2015 to include quality QPI factors (Biggin and Paterson, 2014), contains a total of 362 dated paleointensity measurements, 147 of which are virtual dipole moments (VDM) and 215 virtual axial dipole moments (VADM) (Table 3). The data span 522–3458 Ma. The difference between the PINT VDM and VADM data are the time over which the paleomagnetic inclination is averaged: VDM's use site mean inclinations while VADM's use study mean inclinations over much a longer time range. Since both quantities involve a paleomagnetic inclination we will adjust both as if they were VDM's, as in (15).
Figure 12 shows VDM and VADM from the PINTQPI paleointensity database for all QPI values. We apply an inverse distance squared smoothing (Algeo, 1996; Driscoll and Evans, 2016) to the dataset to produce a running mean μ(t) V(A)DM profile (black line), standard deviation σ(t) (dark gray), and standard error e(t) (light gray) with smoothing time scale of 30 Myr. We see no obvious trend in Figure 12 and the paleointensity appears more or less flat over this time span with significant variability.
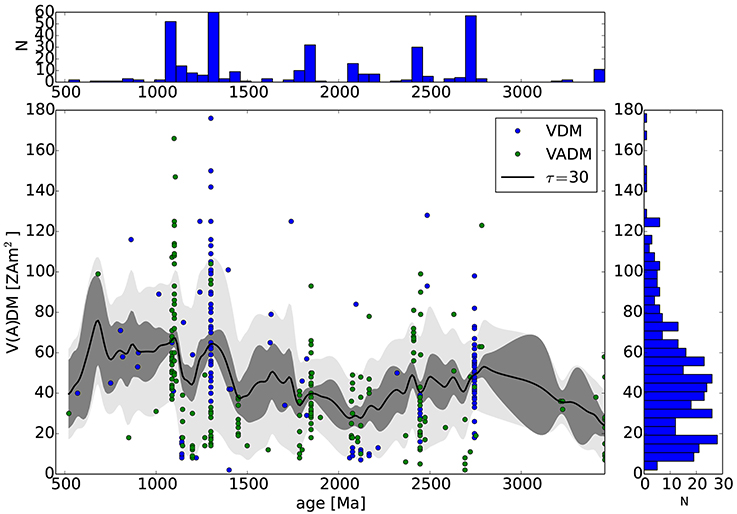
Figure 12. Paleointensity (VDM and VADM) from the PINT database with inverse-distance squared smoothing length scale of τIDS = 30 Myr (solid black line) including standard deviation (dark gray) and standard error (light gray). (Right) histogram of VDM and VADM. (Top) histogram of ages.
Some of these data, however, may be misleading. In an attempt to avoid moments derived from non-ideal analyses we consider a subset of the data with QPI ≥ 3 in Figure 13 (similar to Biggin et al., 2015), and with QPI ≥ 4 in Figure 14. Also in Figures 13, 14 we have applied the dipole moment adjustments found in Figure 10 by dividing all VDM's and VADM's by 0.8, which are rough estimates of the moment bias we found from synthetic observations of numerical dynamos. The adjusted values are marked by filled circles with a vertical line connecting them to their original (pre-adjusted) values. The same inverse distance squared smoothing is then applied to the adjusted values.
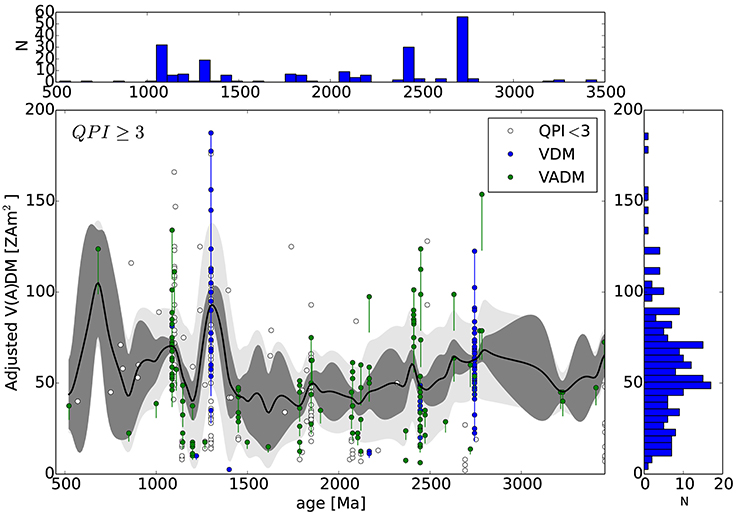
Figure 13. Adjusted paleointensity (VDM and VADM) from the PINT database with inverse-distance squared smoothing with τIDS = 30 Myr (solid line) applied to adjusted data with QPI ≥ 3 (filled circles). Open circles have QPI < 3. VDM's are divided by 0.8, an estimate of the bias found in Figure 10. VADM's are divided by the same factor because they are also derived from magnetic paleoinclinations. Vertical lines connect adjusted to original values. (Right) histogram of VDM and VADM. (Top) histogram of ages.
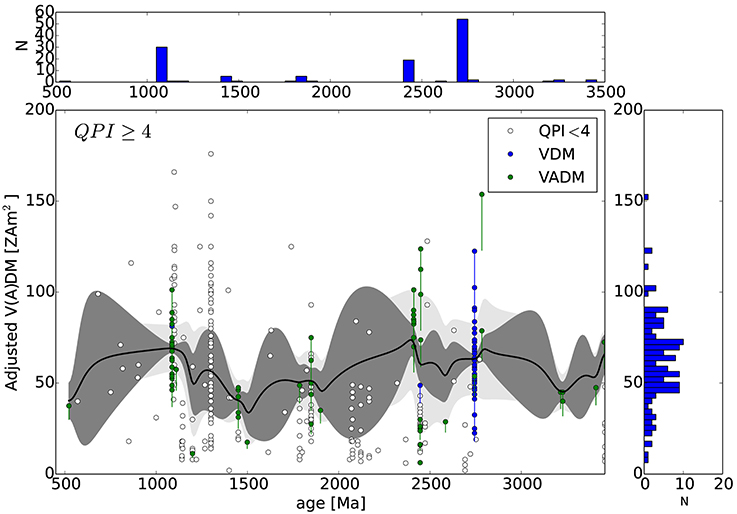
Figure 14. Adjusted paleointensity (VDM and VADM) from the PINT database with inverse-distance squared smoothing with τIDS = 30 Myr (solid line) applied to adjusted data with QPI ≥ 4 (filled circles). Open circles have QPI < 4. VDM's and VADM's are both divided by 0.8 as in Figure 13. Vertical lines connect adjusted to original values. (Right) histogram of VDM and VADM. (Top) histogram of ages.
For QPI ≥ 3 a jump in V(A)DM occurs around 1.3 Ga (Figure 13), which was interpreted as a signature of inner core nucleation (ICN) by Biggin et al. (2015). The smoothed average then drops back down to normal, pre-jump intensities, which is not predicted from dynamo models of ICN (Aubert et al., 2009; Driscoll, 2016; Landeau et al., 2017). Using an even more stringent criteria of QPI ≥ 4, which includes even less data, does not show a peak around 1.3 Ga (Figure 14). By increasing the QPI cutoff from 3 to 4 a pivotal set of intensities by Thomas (1993) are removed at 1.3 Ga, which results in a relatively flat or possibly slowly decreasing moment over Precambrian time. The time averaged Precambrian dipole moment (combined VDM and VADM) is in the range 58 − 62 ZAm2 in Table 3, slightly higher than the estimate by Sprain et al. (2018). The other striking observation from Figures 12–14 is the number and length of time gaps in the data. In particular there are 4 paleointensities in the Neoproterozoic with QPI ≥ 3 and none with QPI ≥ 4.
Excluding so much data may seem overly harsh but there is reason to be careful. It is well known that multidomain components can produce concave-up demagnetization curves (Arai plots) (e.g., Shcherbakova et al., 2000; Chauvin et al., 2005; Biggin et al., 2007; Tauxe and Yamazaki, 2015; Smirnov et al., 2016; Sprain et al., 2018), which could result in an over estimate of the primary intensity if not heated sufficiently. As discussed by Smirnov et al. (2016) and Sprain et al. (2018), examples of this effect may include the Keweenawan rocks dated at 1.1 Ga, which exhibit anomalously high paleointensities and puzzling asymmetries between the normal and reversed polarity sections (Pesonen and Halls, 1983). These asymmetries could be created by rapid changes in paleolatitude or paleo-secular variation (e.g., Swanson-Hysell et al., 2009; Sprain et al., 2018). The Keweenawan intensities of Pesonen and Halls (1983) are also 2–3 times higher than the Tudor Gabbros (Yu and Dunlop, 2001), Abitibi dykes (Macouin et al., 2003), and central Arizona diabase sheets (Donadini et al., 2011), all of which were emplaced within about 50 Myr of the Keweenawan. The period of high paleointensity found by Pesonen and Halls (1983) may be a real transient, which would be consistent with modern levels of intrinsic geodynamo variability, or in fact may be an artifact (Yu and Dunlop, 2001; Valet, 2003). Similarly, a series of high paleointensity measurements from the Gardar Basalts in southern Greenland (Thomas, 1993; Thomas and Piper, 1995) may have misinterpreted several low temperature multidomain magnetizations as a primary single domain paleointensity. In light of these possible issues we find QPI ≥ 4 is sufficient to filter out the contentious data. We note that the paleointensity data are heterogeneous in the various experimental methods and types of rocks used, which complicates their interpretation, and that these issues with paleointensity measurements are an additional complicating factor to consider along with the observed bias found in the synthetic observations above.
Several limitations of our attempt to adjust or unbias the PINT data by the results of our synthetic analysis above should be mentioned. In adjusting the PINT V(A)DM values we divided the VDM and VADM values by a constant 0.8, whereas a more precise adjustment would use the fit in (19,20) with an estimate of the reversal frequency Rf and site paleolatitude θ. Although this approach will be difficult for Precambrian data where the paleolatitude is often not independently known and the reversal frequency record is discontinuous (e.g., Pavlov and Gallet, 2010; Biggin et al., 2011; Gallet et al., 2012). Correlating polarity ratio, which is easier to obtain, with polarity reversal frequency may be a way to extend the record (e.g., Driscoll and Evans, 2016). More readily our predicted biases could be applied to the better constrained paleointensity record over the last 200 Myr, where the reversal frequency and paleolatitude are better known, in order to reexamine the prediction of an inverse relationship between reversal frequency and paleointensity (e.g., Driscoll and Olson, 2011; Sprain et al., 2016).
5. Conclusions
We have generated synthetic magnetic observations from numerical dynamos that span a range of dynamical regimes and reversal frequencies to investigate time averaged magnetic field orientations and intensities. The range of dynamo regimes found, from stable non-reversing dipolar regimes to reversing non-dipolar regimes, are driven by models that span a factor of 10 increase in bottom boundary heat flux. We find that running averages over 20 − 40 kyr are needed to obtain stable paleomagnetic poles with , and over 40 − 150 kyr for . To obtain stable paleomagnetic poles we find that models with higher heat flux and more frequent polarity reversals require longer time averages, similar to previous studies (McMillan et al., 2001; Davies and Constable, 2014). However, we also find that obtaining stable intensities requires longer time averaging than directions.
Surprisingly we find that 500 kyr running averages of local field intensity and inclination produce underestimates of VDM by as much as 50% and overestimates of VADM by as much as 150% with increasing basal heat flux and reversal frequency. These biases are caused by the running averaged local field intensity F having an intermediate intensity between the RMS axial dipole and full dipole intensities. Similar to Lhuillier and Gilder (2013) we find significant dependence on site latitude with high (low) latitudes producing high (low) moment estimates compared to mid-latitudes. These biases remain even for averages of running time averages over 500 kyr. We derive a scaling law for paleointensity bias as a function of reversal frequency and site latitude that could be applied in the future to records where both are known.
Our method for computing time-averaged synthetic observations is not unique and the details of this time averaging likely influence the conclusions. When the underlying field itself is changing on 103 − 106 yr time scales the length of time over which the field is averaged will change the estimates. Also, for non-linear quantities like inclination the order of operations might be important. We chose to compute a running average of the inclination over time, but computing inclination from a running average of the underlying field vectors may produce different results. The length of the running time average might also be important. Our choice here to compute running averages over 500 kyr is well suited to addressing the GAD assumption that is used to infer slow (Myr) tectonic motions, but shorter time scales may be more applicable for investigating secular variation, reversal rates, and variability of the intensity. Ultimately the averaging scheme should be specific to the question being asked. The same non-uniqueness of the synthetic observations also applies to the site latitudes chosen. We sampled the dynamos at 6 regularly spaced latitudes and a single longitude. Do observations spread out randomly over Earth's surface do a better job of sampling the underlying stationary field? This should be explored in future studies. In particular, the influence of site latitude and reversal frequency (or dipolarity) on the inferred paleo-latitude is important during so-called “snowball Earth” events where glacial deposits are interpreted to have occurred at equatorial latitudes (e.g., Evans and Raub, 2011). In the future, synthetic observations from numerical dynamos could explore in greater detail how the method of time averaging and site location affects their ability to recover the underlying global magnetic field.
Finally, applying the paleointensity adjustments found by the dynamo models to the PINT paleointensity record produces little change to the overall trend of a relatively flat intensity over the last 3.4 Ga. Filtering data with quality factors ≥ 3 produces a tentative jump in paleo-dipole moment around 1.3 Ga, but disappears for quality factors ≥ 4, where a possible secular decrease in intensity in seen from 2.7 to 1 Ga. A more careful analysis could be applied during periods when the reversal frequency, or some proxy for reversal frequency (such as secular variation or polarity ratio), and site latitude is known. Correcting for intensity and inclination bias may be important for identifying trends and events (like inner core nucleation) in the paleointensity record. Future analysis could be extended to synthetic observations at more locations on the surface, quantifying secular variation, and identifying higher order magnetic components. Models at lower Ekman number and with a range of boundary conditions should also be analyzed to investigate if these results are sensitive to this region of parameter space.
Author Contributions
PD conceived the project, produced simulations and data analysis, and wrote the paper. CW assisted with software setup, data analysis, and writing.
Funding
The authors thank The Carnegie Institution for Science for funding.
Conflict of Interest Statement
The authors declare that the research was conducted in the absence of any commercial or financial relationships that could be construed as a potential conflict of interest.
Acknowledgments
We thank Andrew Biggin (University of Liverpool) for maintaining the PINT database used here and for a thorough review that significantly improved this paper. This article benefited from discussions with Chris Davies, Richard Bono, and Florian Lhuillier. Rayleigh (https://github.com/geodynamics/Rayleigh), the dynamo code used here, has been developed by Nicholas Featherstone (University of Colorado) with support by the National Science Foundation through the Computational Infrastructure for Geodynamics (CIG), and was supported by NSF grants NSF-0949446 and NSF-1550901. Carnegie's Memex high performance computational cluster was used to generate all numerical dynamos. The data can be made available upon request.
References
Abrajevitch, A., and Van der Voo, R. (2010). Incompatible Ediacaran paleomagnetic directions suggest an equatorial geomagnetic dipole hypothesis. Earth Planet. Sci. Lett. 293, 164–170. doi: 10.1016/j.epsl.2010.02.038
Acton, G. D., Petronotis, K. E., Cape, C. D., Ilg, S. R., Gordon, R. G., and Bryan, P. C. (1996). A test of the geocentric axial dipole hypothesis from an analysis of the skewness of the central marine magnetic anomaly. Earth Planet. Sci. Lett. 144, 337–346. doi: 10.1016/S0012-821X(96)00168-9
Algeo, T. J. (1996). Geomagnetic polarity bias patterns through the Phanerozoic. J. Geophys. Res. 101, 2785–2814. doi: 10.1029/95JB02814
Aubert, J., Gastine, T., and Fournier, A. (2017). Spherical convective dynamos in the rapidly rotating asymptotic regime. J. Fluid Mech. 813, 558–593. doi: 10.1017/jfm.2016.789
Aubert, J., Labrosse, S., and Poitou, C. (2009). Modeling the paleo-evolution of the geodynamo. Geophys. J. Int. 179, 1414–1428. doi: 10.1111/j.1365–246X.2009.04361.x
Bazhenov, M. L., Levashova, N. M., Meert, J. G., Golovanova, I. V., Danukalov, K. N., and Fedorova, N. M. (2016). Late ediacaran magnetostratigraphy of Baltica: evidence for magnetic field hyperactivity? Earth Planet. Sci. Lett. 435, 124–135. doi: 10.1016/j.epsl.2015.12.015
Biggin, A. J., Piispa, E. J., Pesonen, L. J., Holme, R., Paterson, G., Veikkolainen, T., et al. (2015). Palaeomagnetic field intensity variations suggest Mesoproterozoic inner-core nucleation. Nature 526, 245–248. doi: 10.1038/nature15523
Biggin, A., Strik, G., and Langereis, C. (2009). The intensity of the geomagnetic field in the late-Archaean: new measurements and an analysis of the updated IAGA palaeointensity database. Earth Planets Space 61, 9–22. doi: 10.1186/BF03352881
Biggin, A. J., de Wit, M. J., Langereis, C. G., Zegers, T. E., Voûte, S., Dekkers, M. J., et al. (2011). Palaeomagnetism of Archaean rocks of the Onverwacht Group, Barberton Greenstone Belt (southern Africa): evidence for a stable and potentially reversing geomagnetic field at ca. 3.5 Ga. Earth Planet. Sci. Lett. 302, 314–328. doi: 10.1016/j.epsl.2010.12.024
Biggin, A. J., and Paterson, G. A. (2014). A new set of qualitative reliability criteria to aid inferences on palaeomagnetic dipole moment variations through geological time. Front. Earth Sci. 2:24. doi: 10.3389/feart.2014.00024
Biggin, A. J., Perrin, M., and Dekkers, M. J. (2007). A reliable absolute palaeointensity determination obtained from a non-ideal recorder. Earth Planet. Sci. Lett. 257, 545–563. doi: 10.1016/j.epsl.2007.03.017
Chauvin, A., Roperch, P., and Levi, S. (2005). Reliability of geomagnetic paleointensity data: the effects of the NRM fraction and concave-up behavior on paleointensity determinations by the Thellier method. Phys. Earth Planet. Interiors 150, 265–286. doi: 10.1016/j.pepi.2004.11.008
Christensen, U., Aubert, J., and Hulot, G. (2010). Conditions for Earth-like geodynamo models. Earth Planet. Sci. Lett. 296, 487–496. doi: 10.1016/j.epsl.2010.06.009
Davies, C. J. (2015). Cooling history of Earths core with high thermal conductivity. Phys. Earth Planet. Interiors 247, 65–79. doi: 10.1016/j.pepi.2015.03.007
Davies, C. J., and Constable, C. G. (2014). Insights from geodynamo simulations into long-term geomagnetic field behaviour. Earth Planet. Sci. Lett. 404, 238–249. doi: 10.1016/j.epsl.2014.07.042
Donadini, F., Pesonen, L. J., Korhonen, K., Deutsch, A., and Harlan, S. S. (2011). Paleomagnetism and paleointensity of the 1.1 Ga old diabase sheets from central Arizona. Geophysica 47, 3–30.
Driscoll, P., and Bercovici, D. (2014). On the thermal and magnetic histories of Earth and Venus: influences of melting, radioactivity, and conductivity. Phys. Earth Planet. Interiors 236, 36–51. doi: 10.1016/j.pepi.2014.08.004
Driscoll, P., and Olson, P. (2009). Effects of buoyancy and rotation on the polarity reversal frequency of gravitationally driven numerical dynamos. Geophys. J. Int. 178, 1337–1350. doi: 10.1111/j.1365–246X.2009.04234.x
Driscoll, P., and Olson, P. (2011). Superchron cycles driven by variable core heat flow. Geophys. Res. Lett. 38:L09304. doi: 10.1029/2011GL046808
Driscoll, P. E. (2016). Simulating 2 Ga of geodynamo history. Geophys. Res. Lett. 43, 5680–5687. doi: 10.1002/2016GL068858
Driscoll, P. E., and Evans, D. A. (2016). Frequency of Proterozoic geomagnetic superchrons. Earth Planet. Sci. Lett. 437, 9–14. doi: 10.1016/j.epsl.2015.12.035
Evans, D., and Raub, T. (2011). Chapter 7 Neoproterozoic glacial palaeolatitudes: a global update. Geol. Soc. Lond. Memoirs 36, 93–112. doi: 10.1144/M36.7
Evans, D. A., Li, Z., Kirschvink, J. L., and Wingate, M. T. (2000). A high-quality mid-Neoproterozoic paleomagnetic pole from South China, with implications for ice ages and the breakup configuration of Rodinia. Precambrian Res. 100, 313–334. doi: 10.1016/S0301-9268(99)00079-0
Evans, D. A. D. (2006). Proterozoic low orbital obliquity and axial-dipolar geomagnetic field from evaporite palaeolatitudes. Nature 444, 51–55. doi: 10.1038/nature05203
Featherstone, N. A., and Hindman, B. W. (2016). The spectral amplitude of stellar convection and its scaling in the high-Rayleigh-number regime. Astrophys. J. 818:32. doi: 10.3847/0004-637X/818/1/32
Gallet, Y., Pavlov, V., Halverson, G., and Hulot, G. (2012). Toward constraining the long-term reversing behavior of the geodynamo: a new Maya superchron 1 billion years ago from the magnetostratigraphy of the Kartochka Formation (southwestern Siberia). Earth Planet. Sci. Lett. 339, 117–126. doi: 10.1016/j.epsl.2012.04.049
Gubbins, D., and Zhang, K. (1993). Symmetry properties of the dynamo equations for paleomagnetism and geomagnetism. Phys. Earth Planet. Interiors 75, 225–241. doi: 10.1016/0031-9201(93)90003-R
Halls, H. C., Lovette, A., Hamilton, M., and Söderlund, U. (2015). A paleomagnetic and U–Pb geochronology study of the western end of the Grenville dyke swarm: rapid changes in paleomagnetic field direction at ca. 585 Ma related to polarity reversals? Precambrian Res. 257, 137–166. doi: 10.1016/j.precamres.2014.11.029
Johnson, C., and McFadden, P. (2015). “5.11 - The time-averaged field and paleosecular variation,” in Treatise on Geophysics (Second Edition), ed G. Schubert (Oxford: Elsevier), 385–417.
Johnson, H. P., Van Patten, D., Tivey, M., and Sager, W. W. (1995). Geomagnetic polarity reversal rate for the Phanerozoic. Geophys. Res. Lett. 22 (3), 231–234.
Kent, D. V., and Smethurst, M. A. (1998). Shallow bias of paleomagnetic inclinations in the Paleozoic and Precambrian. Earth Planet. Sci. Lett. 160, 391–402.
Klein, R., Salminen, J., and Mertanen, S. (2015). Baltica during the Ediacaran and Cambrian: paleomagnetic study of Hailuoto sediments in Finland. Precambrian Res. 267, 94–105. doi: 10.1016/j.precamres.2015.06.005
Landeau, M., Aubert, J., and Olson, P. (2017). The signature of inner-core nucleation on the geodynamo. Earth Planet. Sci. Lett. 465, 193–204. doi: 10.1016/j.epsl.2017.02.004
Levashova, N. M., Bazhenov, M. L., Meert, J. G., Danukalov, K. N., Golovanova, I. V., Kuznetsov, N. B., et al. (2015). Paleomagnetism of upper Ediacaran clastics from the South Urals: implications to paleogeography of Baltica and the opening of the Iapetus Ocean. Gondwana Res. 28, 191–208. doi: 10.1016/j.gr.2014.04.012
Lhuillier, F., and Gilder, S. A. (2013). Quantifying paleosecular variation: insights from numerical dynamo simulations. Earth Planet. Sci. Lett. 382, 87–97. doi: 10.1016/j.epsl.2013.08.048
Macouin, M., Valet, J., Besse, J., Buchan, K., Ernst, R., LeGoff, M., et al. (2003). Low paleointensities recorded in 1 to 2.4 Ga Proterozoic dykes, Superior Province, Canada. Earth Planet. Sci. Lett. 213, 79–95. doi: 10.1016/S0012-821X(03)00243-7
Maloof, A. C., Halverson, G. P., Kirschvink, J. L., Schrag, D. P., Weiss, B. P., and Hoffman, P. F. (2006). Combined paleomagnetic, isotopic, and stratigraphic evidence for true polar wander from the Neoproterozoic Akademikerbreen Group, Svalbard, Norway. Geol. Soc. Am Bull. 118, 1099–1124. doi: 10.1130/B25892.1
Matsui, H., Heien, E., Aubert, J., Aurnou, J. M., Avery, M., Brown, B., et al. (2016). Performance benchmarks for a next generation numerical dynamo model. Geochem. Geophys. Geosyst. 17, 1586–1607. doi: 10.1002/2015GC006159
McCausland, P. J., Hankard, F., der Voo, R. V., and Hall, C. M. (2011). Ediacaran paleogeography of Laurentia: Paleomagnetism and 40Ar–39Ar geochronology of the 583Ma Baie des Moutons syenite, Quebec. Precambrian Res. 187, 58–78. doi: 10.1016/j.precamres.2011.02.004
McElhinny, M. (2004). Geocentric Axial Dipole Hypothesis: A Least Squares Perspective. Vol. Timescales of the Paleomagnetic Field of Geophysical Monograph Series. Washington, DC: American Geophysical Union, 1–12.
McMillan, D., Constable, C., Parker, R., and Glatzmaier, G. (2001). A statistical analysis of magnetic fields from some geodynamo simulations. Geochem. Geophys. Geosyst. 2, 1–28. doi: 10.1029/2000GC000130
Meert, J. G., Tamrat, E., and Spearman, J. (2003). Non-dipole fields and inclination bias: insights from a random walk analysis. Earth Planet. Sci. Lett. 214, 395–408. doi: 10.1016/S0012-821X(03)00417-5
Merrill, R., McElhinny, M., and McFadden, P. (1996). The Magnetic field of the Earth: Paleomagnetism, the Core, and the Deep Mantle. New York, NY: Academic Press.
Merrill, R. T., and McFadden, P. L. (2003). The geomagnetic axial dipole field assumption. Phys. Earth Planet. Interiors 139, 171–185. doi: 10.1016/j.pepi.2003.07.016
Nimmo, F. (2015). “8.02 - Energetics of the core,” in Treatise on Geophysics (Second Edition), eds G. Schubert (Oxford: Elsevier), 27–55.
Panzik, J., and Evans, D. (2014). Assessing the GAD hypothesis with paleomagnetic data from large Proterozoic dike swarms. Earth Planet. Sci. Lett. 406, 134–141. doi: 10.1016/j.epsl.2014.09.007
Pavlov, V., and Gallet, Y. (2010). Variations in geomagnetic reversal frequency during the Earth's middle age. Geochem. Geophys. Geosyst. 11, 1–28. doi: 10.1029/2009GC002583
Pesonen, L. J., and Halls, H. C. (1983). Geomagnetic field intensity and reversal asymmetry in late Precambrian Keweenawan rocks. Geophys. J. Int. 73, 241–270.
Raub, T., Kirschvink, J., and Evans, D. (2015). “5.14 - True polar wander: linking deep and shallow geodynamics to hydro- and biospheric hypotheses,” in Treatise on Geophysics (Second Edition), ed G. Schubert (Oxford: Elsevier), 511–530.
Shcherbakova, V., Shcherbakov, V., and Heider, F. (2000). Properties of partial thermoremanent magnetization in pseudosingle domain and multidomain magnetite grains. J. Geophys. Res. Solid Earth 105, 767–781. doi: 10.1029/1999JB900235
Smirnov, A. V., Tarduno, J. A., Kulakov, E. V., McEnroe, S. A., and Bono, R. K. (2016). Paleointensity, core thermal conductivity and the unknown age of the inner core. 205, 1190–1195. Geophys. J. Int. doi: 10.1093/gji/ggw080
Sprain, C. J., Feinberg, J. M., Geissman, J. W., Strauss, B., and Brown, M. C. (2016). Paleointensity during periods of rapid reversal: a case study from the Middle Jurassic Shamrock batholith, western Nevada. Bulletin 128, 223–238. doi: 10.1130/B31283.1
Sprain, C. J., Swanson-Hysell, N. L., Fairchild, L. M., and Gaastra, K. (2018). A field like today's? The strength of the geomagnetic field 1.1 billion years ago. Geophys. J. Int. 213, 1969–1983. doi: 10.1093/gji/ggy074
Swanson-Hysell, N. L., Maloof, A. C., Kirschvink, J. L., Evans, D. A., Halverson, G. P., and Hurtgen, M. T. (2012). Constraints on Neoproterozoic paleogeography and Paleozoic orogenesis from paleomagnetic records of the Bitter Springs Formation, Amadeus Basin, central Australia. Am. J. Sci. 312, 817–884. doi: 10.2475/08.2012.01
Swanson-Hysell, N. L., Maloof, A. C., Weiss, B. P., and Evans, D. A. (2009). No asymmetry in geomagnetic reversals recorded by 1.1-billion-year-old Keweenawan basalts. Nat. Geosci. 2:713. doi: 10.1038/ngeo622
Tauxe, L., and Yamazaki, T. (2015). “5.13 - Paleointensities,” in Treatise on Geophysics (Second Edition), ed G. Schubert (Oxford: Elsevier), 461–509.
Thomas, D. N., and Piper, J. D. A. (1995). Evidence for the existence of a transitional geomagnetic field recorded in a Proterozoic lava succession. Geophys. J. Int. 122, 266–282.
Thomas, N. (1993). An integrated rock magnetic approach to the selection or rejection of ancient basalt samples for palaeointensity experiments. Phys. Earth Planet. Interiors 75, 329–342.
Torsvik, T. H., Van der Voo, R., Preeden, U., Mac Niocaill, C., Steinberger, B., Doubrovine, P. V., et al. (2012). Phanerozoic polar wander, palaeogeography and dynamics. Earth Sci. Rev. 114, 325–368. doi: 10.1016/j.earscirev.2012.06.007
Valet, J. (2003). Time variations in geomagnetic intensity. Rev. Geophys. 41:1004. doi: 10.1029/2001RG000104
Veikkolainen, T., Heimpel, M., Evans, M. E., Pesonen, L. J., and Korhonen, K. (2017). A paleointensity test of the geocentric axial dipole (GAD) hypothesis. Phys. Earth Planet. Interiors 265, 54–61. doi: 10.1016/j.pepi.2017.02.008
Veikkolainen, T., Pesonen, L., and Korhonen, K. (2014). An analysis of geomagnetic field reversals supports the validity of the Geocentric Axial Dipole (GAD) hypothesis in the Precambrian. Precambrian Res. 244, 33–41. doi: 10.1016/j.precamres.2013.10.009
Wicht, J. (2005). Palaeomagnetic interpretation of dynamo simulations. Geophys. J. Int. 162, 371–380. doi: 10.1111/j.1365-246X.2005.02665.x
Williams, G. E., and Schmidt, P. W. (2004). Neoproterozoic glaciation: reconciling low paleolatitudes and the geologic record. Extreme Proteroz. Geol. Geochem. Clim. 146, 145–159. doi: 10.1029/146GM12
Keywords: geodynamo, paleointensity, earth evolution, paleomagnetism, core dynamics
Citation: Driscoll PE and Wilson C (2018) Paleomagnetic Biases Inferred From Numerical Dynamos and the Search for Geodynamo Evolution. Front. Earth Sci. 6:113. doi: 10.3389/feart.2018.00113
Received: 12 March 2018; Accepted: 25 July 2018;
Published: 21 August 2018.
Edited by:
Christopher Davies, University of Leeds, United KingdomReviewed by:
Andrew John Biggin, University of Liverpool, United KingdomFlorian Lhuillier, Ludwig-Maximilians-Universität München, Germany
Copyright © 2018 Driscoll and Wilson. This is an open-access article distributed under the terms of the Creative Commons Attribution License (CC BY). The use, distribution or reproduction in other forums is permitted, provided the original author(s) and the copyright owner(s) are credited and that the original publication in this journal is cited, in accordance with accepted academic practice. No use, distribution or reproduction is permitted which does not comply with these terms.
*Correspondence: Peter E. Driscoll, cGRyaXNjb2xsQGNpdy5lZHU=
 Peter E. Driscoll
 Cian Wilson
