Corrigendum: Alaska Volcano Observatory Alert and Forecasting Timeliness: 1989–2017
 Cheryl E. Cameron1*
 Stephanie G. Prejean2
 Michelle L. Coombs3
 Kristi L. Wallace3
 John A. Power3
 Diana C. Roman4
- 1Alaska Volcano Observatory, Alaska Division of Geological and Geophysical Surveys, Fairbanks, AK, United States
- 2Volcano Disaster Assistance Program, Alaska Volcano Observatory, U.S. Geological Survey, Anchorage, AK, United States
- 3Alaska Volcano Observatory, Volcano Science Center, U.S. Geological Survey, Anchorage, AK, United States
- 4Department of Terrestrial Magnetism, Carnegie Institution for Science, Washington, DC, United States
The Alaska Volcano Observatory (AVO) monitors volcanoes in Alaska and issues notifications and warnings of volcanic unrest and eruption. We evaluate the timeliness and accuracy of eruption forecasts for 53 eruptions at 20 volcanoes, beginning with Mount Redoubt's 1989–1990 eruption. Successful forecasts are defined as those where AVO issued a formal warning before eruption onset. These warning notifications are now part of AVO's Aviation Color Code and Volcanic Alert Level. This analysis considers only the start of an eruption, although many eruptions have multiple phases of activity. For the 21 eruptions at volcanoes with functioning local seismic networks, AVO has high forecasting success at volcanoes with: >15 years repose intervals and magmatic eruptions (4 out of 4, 100%); or larger eruptions (Volcanic Explosivity Index (VEI) 3 or greater; 6 out of 10, 60%). Therefore, AVO successfully forecast all four monitored, longer-repose period, VEI 3+ eruptions: Redoubt 1989–1990 and 2009, Spurr 1992, and Augustine 2005–2006. For volcanoes with functioning seismic monitoring networks, success rates are lower for: volcanoes with shorter repose periods (3 out of 16, 19%); more mafic compositions (3 out of 18, 17%); or smaller eruption size (VEI 2 or less, 1 out of 11, 9%). These eruptions (Okmok, Pavlof, Veniaminof, and Shishaldin) often lack detectable precursory signals. For 32 eruptions at volcanoes without functioning local seismic networks, the forecasting success rate is much lower (2, 6%; Kasatochi 2008 and Shishaldin 2014). For remote volcanoes where the main hazard is to aviation, rapid detection is a goal in the absence of in situ monitoring. Eruption detection has improved in recent years, shown by a decrease in the time between eruption onset and notification. Even limited seismic monitoring can detect precursory activity at volcanoes with certain characteristics (intermediate composition, longer repose times, larger eruptions), but difficulty persists in detecting subtle precursory activity at frequently active volcanoes with more mafic compositions. This suggests that volcano-specific characteristics should be considered when designing monitoring programs and evaluating forecasting success. More proximally-located sensors and data types are likely needed to forecast eruptive activity at frequently-active, more mafic volcanoes that generally produce smaller eruptions.
Introduction
Since its inception in 1988, the Alaska Volcano Observatory (AVO; a joint program of the U.S. Geological Survey, the Geophysical Institute of the University of Alaska Fairbanks, and the State of Alaska Division of Geological and Geophysical Surveys) has been responsible for providing timely and accurate information on volcanic hazards, and warnings of impending volcanic activity, to local, state, and federal officials and the public. In December, 1989, a passenger jet inadvertently flew through a cloud of volcanic ash from Mount Redoubt, causing the loss of power to all four engines, and forcing an emergency landing in Anchorage. The jet landed successfully with no loss of life, but the aircraft sustained $80 million in damages (Casadevall, 1994). This incident dramatically demonstrated the vulnerability of jet aircraft to volcanic ash and prompted the ongoing effort to instrument Alaska's volcanoes, which present a constant threat to trans-Pacific aviation in addition to hazards posed to communities in the State. Alaska has 54 volcanoes considered historically active (since 1760) and about 100 volcanoes active in the past 11,000 years (Cameron and Nye, 2014; Cameron and Schaefer, 2016). Since 1989, there have been at least 53 eruptions at 20 volcanoes in Alaska (Figure 1). AVO has also provided formal notification on 23 episodes of unrest that did not lead to eruption. AVO employs several monitoring approaches—including seismic stations at 32 volcanoes, continuous Global Positioning System (GPS) stations at 8 volcanoes, regional and local infrasound sensors, and web cameras. In addition to ground-based monitoring, AVO relies on satellite remote sensing data, lightning detection, annual gas measurements (only for Cook Inlet volcanoes), local observers, and pilot reports (Dixon et al., 2017).
FIGURE 1
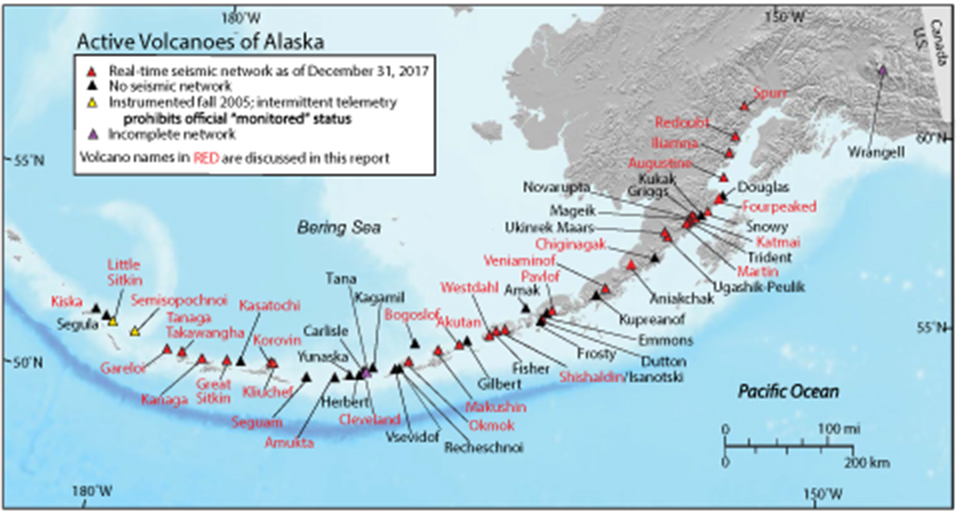
Figure 1. Map showing location of active volcanoes in Alaska; volcanoes discussed in this report are labeled with red text. Map modified from Dixon et al. (2017).
In reviewing AVO's public warnings, we use the term “forecast” to describe statements issued prior to expected eruptive activity. AVO's forecasts are typically relatively imprecise statements about the timing and nature of expected activity and are based on a synthesis of available monitoring data that may include eruptive history as well as seismic, geodetic, infrasound and satellite remote sensing data, gas measurements, and visual observations (Power et al., 1995). Ideally, Observatory notifications extend beyond forecast and into predictions (Swanson et al., 1985) and encompass many additional pieces of information: what is the probability of volcanic eruption? If there is an eruption, when, where, and how long will it last; how big will the eruption likely be; and what hazardous effects will it have? For the numerous and variable eruptions in Alaska over the last 30 years, it is impossible to fully evaluate how well AVO provided all of these pieces of information to the public and other agencies, as we do not have long-standing repeat surveys with stakeholders. AVO forecasts typically do not prompt evacuations because most eruptions are remote and the main hazard is the impact of ash on aviation (Guffanti et al., 2010). The task of forecast evaluation is especially hampered by the fact that many eruptions were unmonitored by ground-based instruments, at remote volcanoes, and it is sometimes difficult to determine when or even if an eruption occurred. In order to look broadly across an entire arc's worth of eruptions, we focus on one important aspect of volcano monitoring: was a formal notice of warning issued prior to the onset of the eruption? Complementing this paper, a detailed analysis of the time lag between individual explosions and AVO calldowns is found in Power and Cameron (2018), and an analysis of seismic rate anomalies preceding Alaska eruptions is in Pesicek et al. (2018).
In this paper, we report on the advance warnings issued by AVO, and investigate how timeliness varies with parameters such as monitoring capabilities, erupted magma composition, most recent repose interval (a broad proxy for whether a system is “closed” or “open”), and Volcanic Explosivity Index (VEI). We show that for larger eruptions of andesitic magmas at seismically monitored volcanoes, AVO consistently provides timely advance warnings (forecasts). For smaller eruptions of more mafic magma at frequently active volcanoes (“open systems”) forecasting is less successful, and for volcanoes without any ground-based monitoring, not surprisingly, forecasting is extremely difficult. These results can help guide future monitoring strategies in Alaska, where only ~32 of over 100 potentially active volcanoes have any ground based monitoring, as well as in other volcanically active regions.
Methods
Monitoring Data
AVO, like other volcano observatories, monitors volcanoes to “detect and correctly interpret the geophysical phenomena that result from rising magma in the earth's crust, in order to provide early and accurate warnings of impending eruptions” (Moran et al., 2008). AVO's forecasting efforts have principally relied on change detection in one or more monitoring data streams. Of those, seismic data has been most relied upon to provide real-time knowledge of a volcanic system. Some volcanoes erupt with no or minimal detected pre-eruptive seismicity (e.g., Okmok, Johnson et al., 2010; Fee et al., 2017; Pavlof, Waythomas et al., 2017). However, in general, by tracking increases in the rate, magnitude, and frequency content of earthquakes located near the volcano along with other changes in the character of the seismicity, it is often possible to forecast volcanic eruptions (Minakami, 1961; Shimozuru, 1971; Chouet et al., 1994; Ewert, 2007; McNutt and Nishimura, 2008; White and McCausland, 2016; McCausland et al., 2017). This is accomplished with a network of seismic instruments around a volcano, and AVO has required a minimum of four operating instruments with stable telemetry at a volcano to consider it “seismically monitored” (McGimsey et al., 2008). In 1989, AVO only monitored Augustine, Redoubt and Spurr volcanoes with real-time seismic networks of four or more stations (Power et al., 1993). In 1995, AVO began a major expansion of its seismic monitoring program, eventually operating seismic networks on as many as 34 volcanoes (Dixon et al., 2012).
Seismic data are analyzed in concert with other data types when and where available. These data types include satellite imagery that detects geomorphic change and provides information about surface temperatures and volcanic clouds (Wessels et al., 2013; Ramsey et al., 2015); continuous GPS or interferometric synthetic-aperture radar data that reveals surface deformation (Cervelli et al., 2010; Lu and Dzurisin, 2014); gas measurements (Werner et al., 2012, 2017; Lopez et al., 2013); and on-site visual and thermal imaging that reveal changes to the edifice such as ice melt, heating, or increased fumarolic activity (Bleick et al., 2013; Wessels et al., 2013). Increasingly over the past several years, infrasound arrays have been used to detect atmospheric disturbances that result from volcanic activity (De Angelis et al., 2012; Fee and Matoza, 2013). For our current analysis, however, we evaluate AVO's effectiveness depending on the presence or absence of seismic monitoring, since this is the most likely real-time data stream in place at an Alaska volcano for the longest period of time, and has often proved reliable for forecasting imminent eruptive activity (e.g., Power et al., 1994, 1995; Power and Lalla, 2010; Ruppert et al., 2011; Buurman et al., 2013; McCausland et al., 2017).
Forecasting Approach
AVO conducts routine checks of all incoming data: seismic, satellite remote sensing, webcam, and community observations, and posts daily (or more frequently, as needed) reports to a common digital log system. In addition, automated alarms are in use for several data streams, including seismic, infrasound, lightning, ash clouds detected by satellite imagery, and emails sent to the website. AVO duty staffing consistently includes a (1) remote sensing scientist—who reviews and reports on satellite and webcam data and alarms, (2) seismologist—who reviews and reports on seismic and infrasound data, and (3) staff scientist who incorporates all such data together and issues formal notifications and makes and receives calls from interagency partners and the public. Staff who receive specific alarms assess their validity and report directly to duty staff. AVO may contact (or receive observations from) citizens, pilots, mariners, and others at remote sites for additional information as needed. In recent years, the USGS National Earthquake Information Center conducts scheduled checks of seismic data afterhours. Volcanoes at elevated color code levels or with unusual activity are monitored more closely—the frequency of checks on these volcanoes depends on the intensity of the activity, and the effectiveness of various alarms for that particular volcano, and extends up to 24/7 in-office staffing during larger eruptions with more major impacts. AVO collaboratively makes decisions about issuing color code/alert-level changes and forecasts through group discussion, and the ultimate responsibility rests with the Scientist-in-Charge (SIC). During times of imminent or ongoing eruption, responsibility is delegated to duty staff members who have authority to issue warnings without compromising timeliness. Although AVO has crafted event trees (Newhall and Hoblitt, 2002) for some unrest episodes, AVO more commonly solicits staff opinions and data during meetings and conference calls, if time allows. These meetings and calls sometimes involve non-AVO (usually USGS) scientists. Within the formal definitions of the color codes/alert levels (Gardner and Guffanti, 2006), assignment of color codes/alert levels are crafted for each volcano based on AVO's level of knowledge and past experience with eruptions at that volcano. AVO maintains close telephone contact with critical agency partners such as the National Weather Service (NWS), the Federal Aviation Administration (FAA), and the State of Alaska Department of Homeland Security and Emergency Management (DHSEM) so that each agency may provide updates on critical information. After making a color code/alert-level decision, AVO begins a formal calldown process to agency partners with urgent notification needs, such as the FAA, followed by issuing a written notification. This paper deals only with the timing of written notifications, but detailed information on interagency communication is given in Neal et al. (2010) and details of the calldown process are available in Power and Cameron (2018).
Notification Schemes—Color Code and Volcano Alert Levels Through Time
AVO's notification history can be broadly grouped into three time periods.
• 1989–1992: AVO developed the “color code” scheme during the 1989–1990 eruption of Redoubt. This is a simple, color-coded ranking focused primarily on ash emissions (Brantley, 1990; Miller et al., 2000; Guffanti and Miller, 2013). During this time, AVO did not issue color codes for volcanoes without seismic monitoring. In this scheme, Yellow included the possibility of gas-and-steam plumes containing minor ash, and Orange explicitly meant that ash did not rise greater than 25,000 ft above sea level.
• 1992–2007: AVO's color code scheme underwent a number of small adjustments. In 1997, the definition of Yellow was broadened to include a forecast time period of “eruption possible in the next few weeks” and AVO began gradually issuing color-code changes for unmonitored volcanoes in the late 1990s and early 2000s (Guffanti and Miller, 2013).
• 2007–present: AVO formally adopted the International Civil Aviation Organization (ICAO) Aviation Color Code (with slight deviations) and the USGS Volcano Alert Level notification system (Gardner and Guffanti, 2006). This system does not include time parameters for color codes, or ash-cloud heights (Guffanti and Miller, 2013).
Since 1989, AVO has issued ~300 color code changes, in addition to many written notifications of unrest or eruption that were not associated with a color code change.
Event Classification and Evaluation of Forecasting Effectiveness
We examined all Alaska eruptions and AVO notifications since the onset of the 1989–1990 eruption of Redoubt. Prior to this date, records of public statements issued by AVO are incomplete. Notifications are classified on a modified scheme from Winson et al. (2014), and are further examined with respect to individual eruption and volcano characteristics (Supplementary Data Sheet 1). We classify each notification/eruption pair with respect to the definition used by AVO at the time of the alert, so non-color code notifications can qualify as warning and forecast of an eruption, or, more commonly, formal notification of an eruption already in progress.
Descriptions of Notification Classes
• Good: AVO provided notification prior to the eruption, either by raising the color code or issuing a written statement. Because of very long precursory phases in some cases, there is no time limit set for how far in advance AVO raised the color code prior to eruption, as long as the alert was issued within the time period of significant unrest, and activity did not decline to background levels before eruption. As all of AVO's color code definitions for “Yellow” include activity regarded as precursory to an eruption (Guffanti and Miller, 2013) at time of issuance; we do not require successive color code raises from Unassigned or Green to Yellow and then Orange or Red.
• Detect Only: AVO increased the color code or published a text notification of the eruption during (or after) the eruption, but not before. For those volcanoes without ground-based geophysical monitoring, timely Detect Only is a reasonable goal, as satellite data, infrasound, and direct observations are all data streams that generally detect eruptive activity after it has commenced.
• Missed: Eruptions for which AVO did not issue any contemporaneous notification. Missed eruptions are different from Detect Only because for Detect Only, AVO did issue a notification, although after eruption onset. For Missed, no notification was issued proximal to the eruption.
• Uncertain: A small eruption may have occurred. As it is not always possible to know or confirm that an eruption occurred at remote volcanoes, these events are largely removed from the analysis.
• Unrest without Eruption (UwE): AVO increased the color code to a level lower than Red, or issued a written statement for volcanic unrest, but no eruption ensued. These are not failed eruption forecasts, as AVO often raises color codes simply to notify the public of unrest, without an expectation of certain eruption. As this classification depends on AVO issuing a notification, there are many other known instances of unrest in AVO's history that are not recorded in this dataset, although they are described in AVO's annual reports of volcanic activity.
• False Alarm: AVO increased the color code to Red, which means an eruption is expected (definition for early years of the color code) or underway (current color code definition), but no eruption occurred.
Volcano and Eruption Characteristics
There are several characteristics that make this dataset heterogeneous. We tested the following characteristics (summarized in Table 1) to see how specific differences among volcanoes and eruptions affect AVO's forecasting ability.
TABLE 1
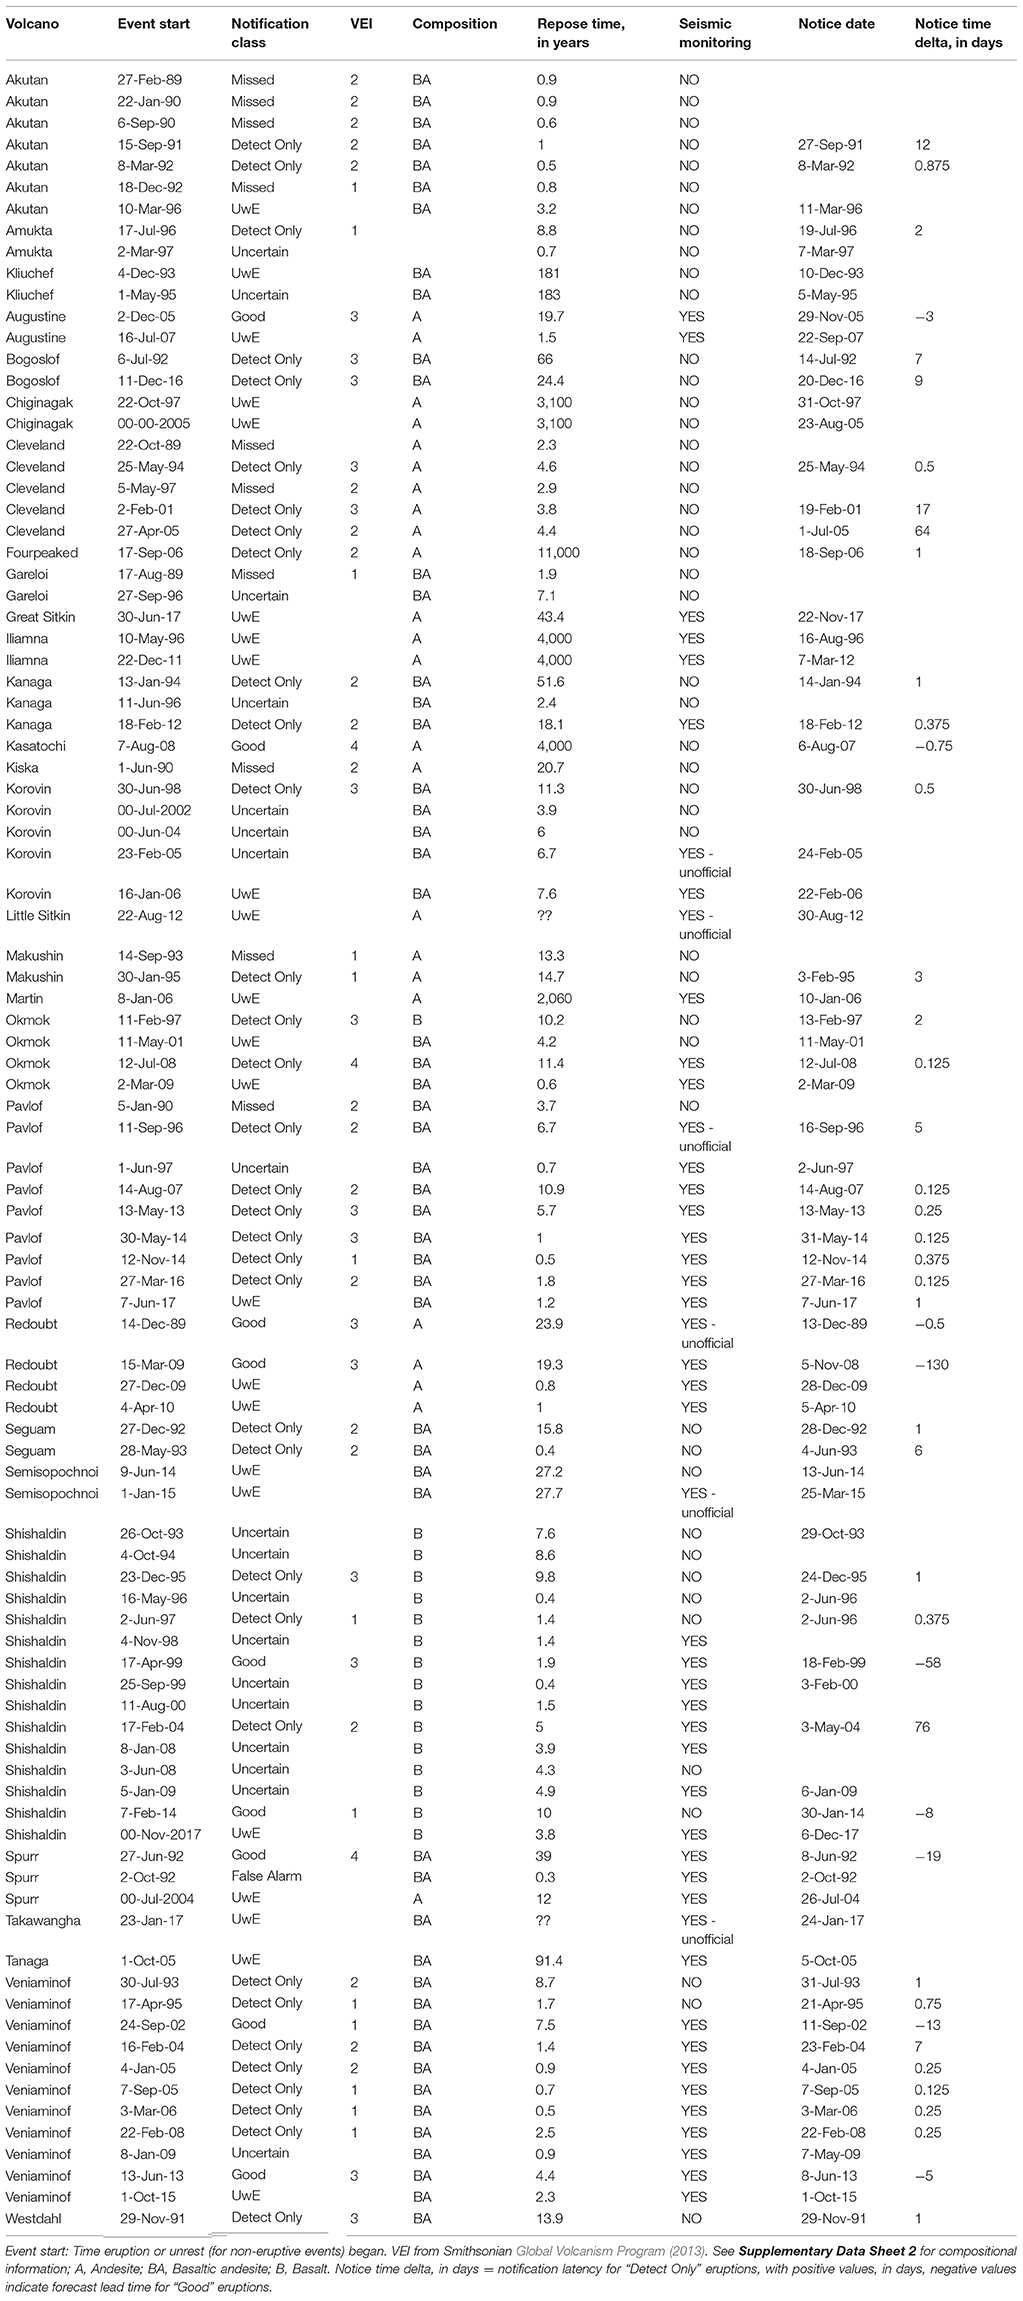
Table 1. Notifications/eruption-unrest classification (modified scheme from Winson et al., 2014).
Seismic Monitoring
AVO currently considers 32 volcanoes to be seismically monitored. This number has increased from three (in 1989), and has fluctuated based on individual network health. For this analysis, events are considered seismically monitored if the volcano has a local seismic network, comprised of four or more seismometers, operating at the time of the event, and operating with sufficient time before the event in order to characterize background seismicity, following Buurman et al. (2014) and Pesicek et al. (2018). Events with a local seismic network and not formally listed as monitored by AVO (often due to insufficient time to categorize background seismicity, e.g., Pavlof, 1996) are marked “YES-unofficial” in Table 1. Unrest events with a local, degraded seismic network (e.g., Veniaminof, 2015) retain a “YES” for seismic monitoring status if AVO did identify elevated seismicity and use it as the basis for an elevated color code. Although many events in our list barely meet this standard, other volcanoes have more dense seismic networks with as many as 17 instruments [Spurr has 17; Okmok and Akutan follow with 13], allowing for better detection of subtle seismic precursors (Dixon et al., 2012). Seismic monitoring status at time of event is based on network health analyses by Pesicek et al. (2018) and Buurman, et al. (2014). For those events with seismic monitoring, we also briefly examine whether or not precursory seismicity was detected by our network, as do Pesicek et al. (2018).
Composition of Erupted Products
Events (unrest and eruptions) are grouped into andesitic (57–63 wt. % SiO2), basaltic andesite (52–57 wt. % SiO2), and basaltic (< 52 wt. % SiO2) categories, following LeMaitre et al. (2002). No recent eruptions or unrest have been associated with more evolved magmas. We give the composition of magma erupted during a particular eruption, if known. For periods of unrest with no eruption, or for eruptions when the erupted composition is unknown, we have compiled the compositions from latest Holocene or historical activity and use that as a proxy for composition of erupted products (Supplementary Data Sheet 2).
Volcanic Explosivity Index (VEI)
The VEI numbers used here are extracted from the Smithsonian Global Volcanism Program website1 (2013, https://volcano.si.edu). In this dataset, those events that AVO classifies as “uncertain” or “unrest without eruption” have no assigned VEI, although the Smithsonian database may record a VEI for those events.
Determining Event Onset
For all instances of unrest or eruption, the “start date” given in the dataset is either the earliest known date of significant unrest (for UwE events), or the known date of first “explosive ejection of fragmental material, the effusion of liquid lava, or both,” following the Smithsonian Global Volcanism Program's definition of eruption (Siebert et al., 2010; Global Volcanism Program, 2013), using eruption information from the Alaska Volcano Observatory online database2 (https://avo.alaska.edu). This definition also requires that eruptive activity within 90 days of previous activity be counted as the same eruption as the previous eruptive activity. Hiatuses of 90 or more days begin a new eruption. While this arbitrary cut-off for breaking activity into discrete eruptions is easy to apply where eruptive dates are confidently known, the 90 day cut-off may not be appropriate for volcanoes like Cleveland and Veniaminof, which tend to have protracted eruptions that may have breaks longer than 90 days, resulting in numerous, near-identical “eruptions” over a period of years. Mount Cleveland is classified as not “seismically monitored” for the purposes of this analysis, and has been in near-continuous eruption since 2005—any apparent lulls greater than 90 days result in the creation of a new “eruption.” As Cleveland is both frequently-erupting and considered not seismically monitored (Cleveland has just two seismometers and an infrasound network, as of 2015), AVO tends to keep Cleveland at an elevated color code—Yellow or Orange—for very long periods (month to years), resulting in Cleveland erupting at elevated color codes, although the color code elevation may have occurred months prior. To correct this problem, although Cleveland has 12 eruptions between 2005 and 2017, we characterize these as a single eruptive period. Thus, because of the nature of Cleveland's activity, and AVO's response to it, these results are presented with only five total eruptions for Cleveland—four eruptions between 1988 and 2004, and the extended eruptive period between 2005 and 2017.
This definition of event onset includes phreatic explosions, although for eruptions where an initial phreatic explosion is not well-verified, a later date of more certain activity is used. At unmonitored volcanoes, a phreatic explosion may be AVO's first notice of activity at the volcano. Unfortunately, for many unmonitored volcanoes, these initial events are poorly reported, creating an inability to discern whether the activity was phreatic or not. These initial events may also constitute the only activity for that event. To explore how these uncertainties in timing of phreatic eruptions impact our results, we examined the dataset twice—both considering initial phreatic explosions as the eruption onset and again, considering the initial phreatic explosion as precursory activity. There is no significant difference in our results whether or not phreatic explosions are used as the onset of “eruption,” except in cases where a single phreatic event composes the entire eruption, as with Kanaga, 2012 and Fourpeaked, 2006, where those eruptions would simply be removed from the dataset. In no case does changing the eruption start date to include only known magmatic activity alter a “Detect Only” result to “Good,” although it can significantly shorten the lag time between eruption onset and AVO notification.
Recurrence Interval (Proxy for Closed vs. Open System)
This value is the difference between the start date of an eruption and the start date of the most recent prior eruption, although some eruptions (notably those at Veniaminof, Cleveland, and Shishaldin) extend for years. Start dates are used rather than end dates because start dates are better characterized across the dataset; not all events have well-known end dates. Values are rounded to the nearest tenth of a year. When the event month or day is not known, the 15th of June is arbitrarily used. These values are listed as “00” in Supplementary Data Sheet 1; this uncertainty occurs for three unrest events and two uncertain events.
Results
Overall classification results are shown in Figure 2. AVO successfully forecast seven of the 21 seismically monitored eruptions (33%; Figure 3), including eruptions at Augustine, Redoubt, Spurr, Veniaminof, and Shishaldin. AVO has successfully forecast all eruptions at Augustine, Redoubt, and Spurr, representing 3 of the 8 seismically monitored volcanoes that have erupted since 1989. The unforecasted eruptions at seismically monitored volcanoes are from five volcanoes: Okmok, Pavlof, Kanaga, Veniaminof, and Shishaldin. At unmonitored volcanoes, AVO successfully forecast 2 out of 32 (6%) eruptions.
FIGURE 2
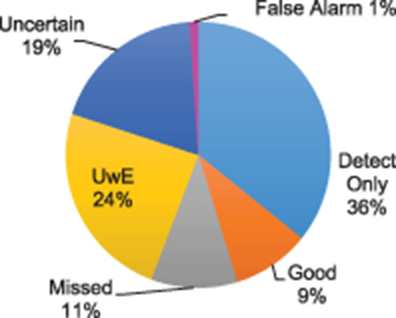
Figure 2. Pie chart of the classification of AVO's event-notification pairs. 36% Detect Only (34 events, medium blue), 9% Good (9 events, orange), 11% Missed (10 events, gray), 24% UwE (23 events, Unrest without Eruption, yellow), 19% Uncertain (18 events, dark blue), and 1% False Alarm (1 event, pink).
FIGURE 3
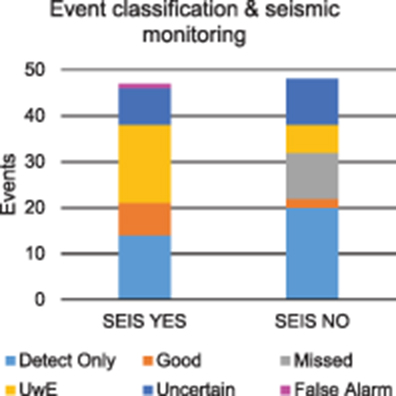
Figure 3. Event classifications with respect to presence of seismic monitoring. “SEIS YES” on left indicates events with seismic monitoring, “SEIS NO” on right for events without seismic monitoring. Detect Only shown in medium blue, Good in orange, Missed in gray, Uwe (Unrest without Eruption) in yellow, Uncertain in dark blue, and False Alarm in pink.
Results by Notification Class
• Good: The dataset contains nine eruptions where AVO elevated the color code prior to eruption. Most (7) of these occurred at seismically monitored volcanoes. Seismically monitored eruptions with “Good” notification include Augustine 2005–2006, Redoubt 1989–1990 and 2009, Shishaldin 1999, Spurr 1992, and Veniaminof 2002 and 2013. Seismically unmonitored eruptions with “Good” notification are Kastaochi 2008 and Shishaldin 2014.
• Detect Only: For those eruptions with seismic monitoring, AVO detected an eruption in progress and issued a notification 14 times (out of 21 seismically monitored eruptions). At unmonitored volcanoes, “Detect Only” comprises 20 of 32 eruptions. Detect Only events occur throughout the entire history of AVO.
• Missed: No seismically monitored eruptions are classed as “Missed.” For 10 eruptions at unmonitored volcanoes (out of 32), AVO did not issue any contemporaneous notification. The most recent known “Missed” event was in 2002. A typical “Missed” event would be a case of an airplane pilot observing a short-lived ash plume at an unmonitored, remote volcano, and then contacting AVO days or weeks later about the eruption. Such events are all small and short-lived, with a maximum VEI of 2. AVO does not have any reports of negative impacts resulting from these eruptions.
• Uncertain: Eight seismically monitored events and 10 unmonitored events are classed as “Uncertain,” for a total of 18 events. These events do not have enough documentation to be certain that they qualify as volcanic eruptions, rather than fumarolic activity. These events span a time range from 1993 to 2009. A typical “Uncertain” event occurs when local observers or pilots report steam clouds with possible ash from a volcano that often has eruptions and fumarolic activity.
• Unrest without Eruption: Seventeen events at seismically monitored volcanoes and an additional six events at unmonitored volcanoes are classified as “Unrest without Eruption.” These are instances when AVO issued notification for above background unrest, but no eruption resulted (e.g., AVO raised the color code and alert level at Iliamna in 2012, due to increased seismicity, but Iliamna did not erupt). There are more instances of volcanic unrest than recorded in this dataset, as this dataset requires AVO to have issued a formal notification about the unrest. Unrest without Eruption events in this dataset span from 1993 to the present.
• False Alarm: On October 2 and November 9, 1992, in the aftermath of the 1992 Spurr eruption, during strong episodes of unrest, AVO raised the volcano color code to Red for Spurr with no ensuing eruption (Eichelberger et al., 1995). This dataset uses a determination of a 90-day gap for breaking activity into multiple eruptive periods, but has no corollary of absence of activity for determining a false alarm. Both of these color code elevations occurred within 90 days of what would be the final Spurr 1992 explosion (September 16–17, 1992), and during a time when color code Red could mean an expected eruption, as well as an eruption underway. However, the actual wording of these notifications was “large eruption likely in 24–48 h” (Eichelberger et al., 1995). These events are recorded in the dataset as a single “False Alarm” and remain the only times not in the middle of an eruptive sequence where AVO raised the color code to Red and there was no subsequent eruption.
Results by Volcano Characteristics
Seismic Monitoring
Forty-seven events (out of 95) were seismically monitored; this includes 21 eruptions (Figure 3). For the 21 eruptions with seismic monitoring, seven (33%) were classed as “Good;” and 14 (67%) were classed as “Detect Only.” No seismically monitored eruptions were “Missed.” Forty-eight events were not seismically monitored, including 32 eruptions. For these 32 unmonitored eruptions, two (6%) were classed as “Good;” 20 (63%) were classed as “Detect Only,” and 10 (31%) were “Missed.” The following characteristics of repose time, composition, and VEI necessarily include results for both monitored and unmonitored volcanoes.
Repose Time
The interval between an eruption (or unrest event) and the start of the previous eruption at a volcano varies from 0.3 years to 11,000 years, with a median repose interval of 3.3 years. Repose time is not given for Takawangha and Little Sitkin, due to very sparse geologic knowledge. Neither of these volcanoes has erupted in historical time. Twenty-five events have a recent repose period greater than 15 years: 12 eruptions and 13 unrest episodes. Of the 12 eruptions, five (42%) were classed as “Good,” six (50%) were classed as “Detect Only,” and one (8%) was classed as “Missed” (Figure 4). Seventy events have recent repose periods less than 15 years, including 41 eruptions, 17 uncertain events, 11 unrest events, and one false alarm. For the 41 eruptions with repose periods less than 15 years, four (10%) were classed as “Good;” 28 (68%) were classed as “Detect Only;” and nine (22%) were classed as “Missed.”
FIGURE 4
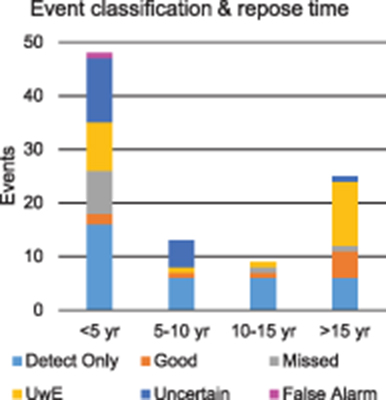
Figure 4. Event classifications with respect to most recent repose time, in intervals of less than 5 years, 5–10 years, 10–15 years, and greater than 15 years. Detect Only (medium blue), Good (orange), Missed (gray), UwE (Unrest without Eruption, yellow), Uncertain (dark blue), and False Alarm (pink).
Erupted Product Composition
Twenty-four events in the dataset are classed as andesitic (A), including four of the nine eruptions classed with “Good” notification (Figure 5). Fifty-three events are basaltic andesite (BA; three “Good”). Sixteen events are basaltic (B; two “Good”) (Supplementary Data Sheet 2). There are no dominantly dacitic or rhyolitic recent eruptions. One volcano, Amukta, has no compositional data. A few volcanoes have recent eruptions with compositional data that span the basaltic andesite—andesite range: notably Cleveland, Kasatochi, and Kiska.
FIGURE 5
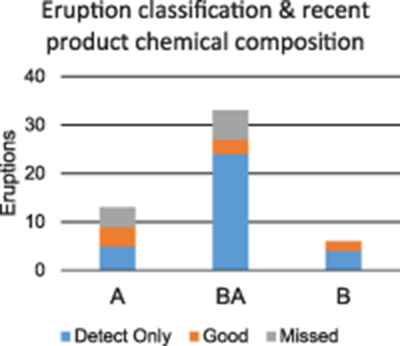
Figure 5. Eruption classification with respect to chemical composition of most recently erupted products. A, Andesite; BA, Basaltic andesite; B, Basalt. Detect Only (blue), Good (orange), and Missed (gray).
Volcanic Explosivity Index
VEI values range from not applicable (for unrest and uncertain events) to 4 (Figure 6). There are three VEI 4 eruptions in the dataset: Kasatochi, 2008; Okmok, 2008; and Spurr, 1992, and two are “Good” with one “Detect Only” (Okmok, 2008). There are 15 VEI 3 events, 21 VEI 2 events, and 13 VEI 1. Seven of 18 (39%) of the VEI 3+ eruptions have “Good” notification; the others are “Detect Only” (61%). For VEI less than 3, two of 35 (6%) are “Good,” 23 (66%) are “Detect Only” and 10 (29%) are “Missed.”
FIGURE 6
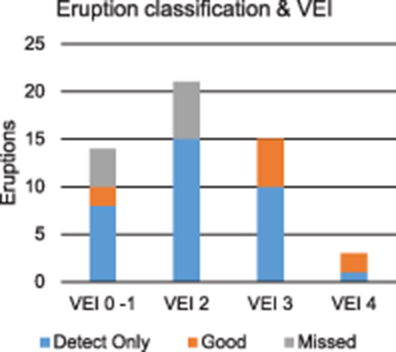
Figure 6. Eruption classifications with respect to VEI values 0–1, 2, 3, and 4. Detect Only (blue), Good (orange), and Missed (gray).
Post-Notification Analysis
We can also examine these results from a post-notification perspective to answer the question: how often does an initial elevation to Yellow result in an eruption? For those volcanoes with formally-declared seismic monitoring and post-dating the development of AVO's color code (1990), AVO initially raised the color code at a volcano from Green to Yellow 31 times; eight (26%) of these elevations represent an eruption already in progress; 17 Green to Yellow elevations (55%) resulted in either no eruption or an uncertain eruption. Only 6 of these initial Green to Yellow elevations (19%) were followed by an eruption (Figure 7).
FIGURE 7
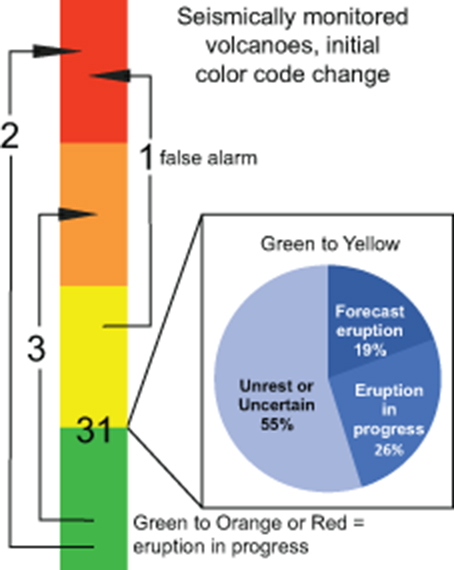
Figure 7. Depiction of initial AVO color code elevations at seismically monitored volcanoes. Elevations from Green to Orange or Red occurred at volcanoes where an eruption was already in progress. The elevation from Yellow to Red is the false alarm event at Spurr in October and November, 1992. For the 31 initial elevations from Green to Yellow, the pie chart shows the eventual outcome of eruption, eruption already in progress, and unrest or uncertain eruption.
Although all of the eruptions classed as “Good” have an initial color code change from Unassigned or Green to Yellow, eruptions with seismic monitoring classed as “Detect Only” include three jumps from Green to Orange (Pavlof, 2013; May 2014, and November 2014) and two elevations straight from Green to Red (Okmok, 2008 and Pavlof, 2016). The “False Alarm” (two elevations, 1 month apart) jump from Yellow to Red.
Discussion
We can compare our notification class results to those of Winson et al. (2014) and their global volcano alert classification results, although they use different definitions and include only 20 Alaska events. For Winson and others' global dataset, 14% of those volcanoes with Level 0 or Level 1 monitoring (comparable to this analysis' “seismically unmonitored”) had “Timely” or “Almost” notifications (comparable to this analysis' “Good.”) For volcanoes they describe as having Level 2 or higher monitoring, 21% of those eruptions had “Timely” or “Almost” notifications. Our study finds a bigger improvement in notification/forecasts between unmonitored and monitored, with only 6% success rates for unmonitored and 33% for monitored. The outcomes between these two studies are different for several reasons: the studies analyze different sets of events; they have different criteria for “monitored” status (including differentiating monitored status at the time of each event); and this study of an individual observatory is able to assess notification/forecasting success based on specific observatory alert levels, rationale, and procedures for use. For example, the USGS Volcano Alert Level System used by AVO and other U.S. Observatories states that Yellow indicates unrest behavior, while Orange is appropriate for either increased unrest OR low-level eruption (Guffanti and Miller, 2013). Historically, AVO has also included low-level ash emission at Yellow, and still has a tendency to call very low-level eruptive activity “Yellow” (Brantley, 1990). Therefore our evaluation of notification success only requires that a volcano be elevated to Yellow (or a non-color code notification, for non-monitored volcanoes prior to 2007) to be included as appropriate color code elevation during unrest or prior to eruption. Another instance of assessing success within an institution's specific needs is the case of long unrest periods at remote volcanoes. Alaska may be more willing than other, more populated areas to use elevated color codes for long periods of unrest, as these remote volcanoes do not often need disruptive mitigation measures. It is important to analyze alert level use within the context of the agency using it and the local users, in order to ensure “apples to apples” comparisons.
We can more accurately resolve the characteristics that influence successful forecasting by grouping characteristics (eruption size, repose interval, erupted product composition, and presence/absence of seismic monitoring; Figures 8, 9), as individual volcano and eruption characteristics do not fully explain the variation in forecasting success rates. Many of these factors are not independent of each other, and are instead highly correlative (e.g., Passarelli and Brodsky, 2012). However, analyzing the success rates in overlapping regions of two or more characteristics (Figure 8) shows additional insight into groups of factors that correlate with eruption forecasting success or failure, and, more importantly, guidance that could improve AVO's forecasting abilities.
FIGURE 8
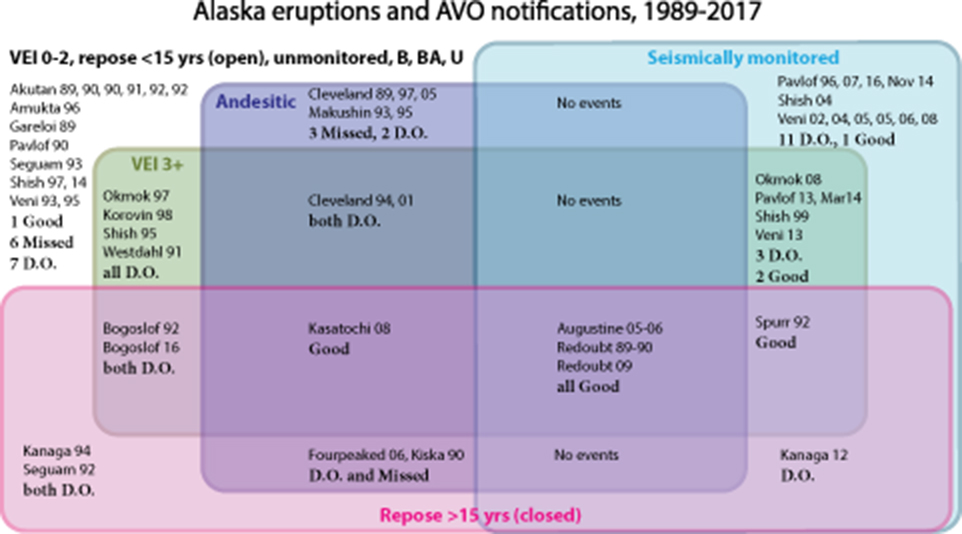
Figure 8. Four-part Venn diagram of volcano, eruption, and notification classes examined in this paper. Abbreviations as follows: Shish, Shishaldin; Veni, Veniaminof; D.O., Detect Only. For volcanoes with more than one eruption in a single year, the month of the eruption start is also given.
FIGURE 9
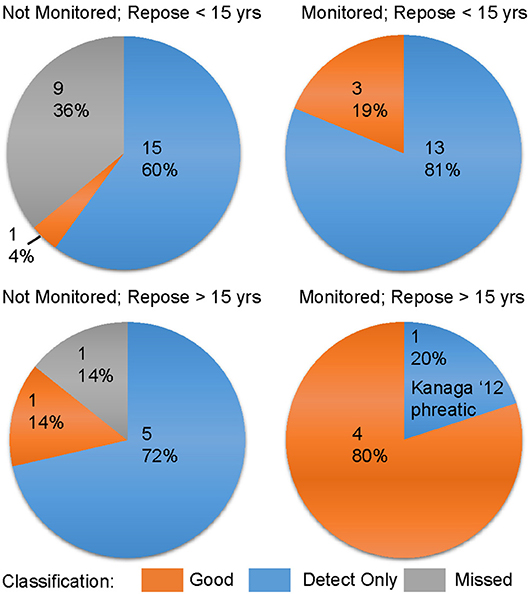
Figure 9. Four pie charts, showing event-notification classes for eruptions, based on seismically monitored/unmonitored status and repose less than or greater than 15 years. Number of eruptions and percentage of the pie are shown in each slice. For the lower right pie chart, showing those eruptions with both seismic monitoring and repose times longer than 15 years, Kanaga 2012 (the single not-forecast event) is the only phreatic eruption of this group.
Efficacy of Seismic Monitoring
AVO has much better forecasting success at seismically monitored volcanoes (33%) compared to non-monitored volcanoes (6%). Clearly, in situ seismic monitoring, preferably in concert with other geophysical instrumentation, is essential to improving abilities to successfully forecast a volcanic eruption (Sparks, 2003, and many others; Ewert, 2007; McNutt, 2008; Tilling, 2008). The Moran et al. (2008) report suggests that part of the instrumentation for a well monitored volcano includes at least one seismometer within 5 km of the vent (also see White and McCausland, 2016). It is interesting to note that the forecasting successes at Augustine (closest seismic station AUP = 0.6 km), Redoubt (RSO = 2.5 km), and Spurr (CP2 = 0.3 km) have seismometers within 2 km of the vent, but the closest seismometers at volcanoes without steady forecasting success (Pavlof, PV6 = 4.4 km; Veniaminof, VNSS = 7.8 km; Shishaldin, SSLS = 5.4 km) have seismometers more than 4 km from the vent.
Seismic instrumentation at Alaska volcanoes does yield a decrease in the lag time between eruption onset and AVO notification of the eruption for those eruptions that were not successfully forecast. The average notification delay for non-seismically monitored “Detect Only” eruptions for eruptions older than 10 years ago is 6 days (delay periods grouped into 3-h bins for delays of less than 1 day; days counted as integers for delays greater than 1 day), but over the same time period, the average notification delay for seismically-monitored “Detect Only” eruptions is 2 days (excluding a 76-day delay outlier from the 2004 eruption of Shishaldin). Looking at the most recent 10 years, there is only one non-seismically monitored eruption (notification delay of 9 days; Bogoslof 2016–2017), and the average delay for seismically monitored eruptions drops to day. Seismic monitoring decreases notification delay, and this notification lag is also decreasing with time. Faster eruption notification is likely due to the concurrent use of infrasound, lighting detection, alarm algorithms, improved satellite data, and increased intra- and extra-agency communication.
Closed System Successes
AVO has successfully forecast all four seismically-monitored VEI 3+ eruptions for volcanoes with repose periods longer than 15 years, as well as the closed-system but unmonitored VEI 4 eruption of Kasatochi in 2008 (lower right quadrant of Figures 8, 9). AVO provided 130 days advance warning of the 2009 eruption of Redoubt, 19 days for Spurr 1992, 3 days for Augustine 2005–2006 (3 days prior to the December 2 first phreatic explosion; the initial magmatic explosion occurred on January 11, 2006), and about 18 h for the Redoubt 1989–1990 eruption. These eruptions had precursory seismicity, recorded on monitoring networks (Pesicek et al., 2018), allowing for substantial forecast lead times; the precursory seismicity and AVO response is detailed in Power and Cameron (2018). The single longer-repose period and monitored event which was not successfully forecast is Kanaga, 2012. This event is an outlier in many ways: it is smaller than the others (VEI 2 instead of 3 or 4), phreatic (Herrick et al., 2014) rather than magmatic, located outside of Cook Inlet (Alaska's most populous region), and had a recent repose time of just 18.1 years.
A final closed system forecasting success occurred for the VEI 4 eruption of Kasatochi in 2008. Kasatochi has no local seismic stations. This eruption had precursory seismicity of M >2, large enough to be recorded on seismic stations operated by AVO on Great Sitkin, Korovin, and Kanaga, beginning about 1 month before the eruption. The largest earthquake was a magnitude 5.8. Felt earthquakes were noted by U.S. Fish and Wildlife Service employees stationed on Kasatochi for about a week before eruption onset (Neal et al., 2011; Ruppert et al., 2011; Nye et al., 2017). This substantial precursory seismicity, attributed in part to rapid magma ascent (Neill et al., 2015), enabled eruption forecasting despite the absence of a local seismic monitoring network (Waythomas et al., 2010).
Open System Challenges
Nearly all volcanoes in this dataset that erupt more frequently and could be considered “open system” produce basalt or basaltic andesite eruptive products. Cleveland and Makushin are both classed andesite and are thus exceptions to this generality.
All of the seismically monitored volcanoes with repose times < 15 years are basaltic or basaltic andesite in composition (upper right corner of Figure 8). These open system, low-viscosity, variably-sized eruptions with seismic monitoring are generally not forecast (three out of 16) due to their notable lack of detected precursory seismicity (Pesicek et al., 2018). Most (13 of 16; 81%) of these eruptions are from two persistently active volcanoes (Pavlof and Veniaminof, neither of which has a seismometer within 4 km of the vent) and most (11 of 16; 69%) are small eruptions of VEI 1–2. AVO failed to forecast VEI 3 eruptions for Okmok, 2008, and Pavlof 2013 and 2014, despite the presence of seismic monitoring at both and geodetic monitoring in the case of Okmok. Okmok 2008, for example, had less than 2 h of clear precursory seismicity despite a dense proximal seismic network (Larsen et al., 2009), and a subtle precursory change in long-term inflation was only clear in geodetic data in retrospect (Freymueller and Kaufman, 2010; Lu and Dzurisin, 2010). Pavlof is one of the most frequently active volcanoes in Alaska, and has erupted seven times since the founding of AVO. And, although some intra-eruptive explosions have been successfully forecast (Power et al., 2018), AVO has not successfully forecast eruptive onset at Pavlof. This likely reflects the fact that Pavlof's persistently hot, open conduit allows magma slugs, which ascend rapidly with little contamination from crustal rocks (Mangan et al., 2009), to freely degas without pressurizing the surrounding crust, possibly coupled with the lack of a proximal seismic station. The three successful eruption forecasts for this group (monitored, shorter repose period) were Shishaldin 1999 and Veniaminof 2002 and 2013. Shishaldin 1999's precursory seismicity and AVO response is covered in Power and Cameron (2018).
For the frequently-erupting, basaltic and basaltic andesite, seismically unmonitored volcanoes (upper left quadrant of Figure 8), just one event was forecast, out of 18; Shishaldin 2014. AVO maintains a seismic network on Unimak Island that monitors Shishaldin, but prior to and during this eruption, the network was substantially impaired due to equipment failures. AVO raised the color code to Yellow on January 30, on the basis of increased surface temperatures seen in satellite data and increased steam emissions observed in webcam images (Cameron et al., 2017). Eruptions in the short-repose period and unmonitored group that AVO failed to forecast include eruptions of Akutan, Amukta, Gareloi, Pavlof, Seguam, Shishaldin, Veniaminof, Okmok, Korovin, Westdahl, Cleveland, and Makushin. Notably, almost all of the “Missed” events occur in this quadrant of Figure 8, but there have been no “Missed” events in the past 10 years, suggesting that technologies like infrasound and increased communications, including interpersonal, interagency, and satellite coverage have improved volcano notification even in the absence of ground-based instrumentation.
Unrest Without Eruption (UwE)—How Often, and Why?
This dataset contains 23 UwE events. Unrest which has prompted formal notification by AVO falls into three broad categories. The first is characterized by dominant volcano-tectonic seismicity that may or may not be accompanied by other seismicity such as low-frequency events or tremor, as well as increased degassing, heating of the edifice or increased measured gas flux. Some of these events have been described as “failed eruptions,” meaning magma intruded into but stalled within the shallow crust (Moran et al., 2011). Some examples include Akutan 1996 (Lu et al., 2000), Iliamna 1996 (Roman et al., 2004), Iliamna 2012 (Prejean et al., 2012), Martin 2006 (O'Brien et al., 2012), Little Sitkin 2012 (Haney et al., 2014), Semisopochnoi 2014 (Cameron et al., 2017), Tanaga 2005 (Lu and Dzurisin, 2014), and Spurr 2004–2006 (Coombs et al., 2006). Other UwE events have similar characteristics but the processes that led to the unrest are more equivocal. In general, we describe this category of event as “possible intrusion and/or activation of the hydrothermal system.” The second category of UwE includes 4 incidents that occurred at mafic, open-system volcanoes and were characterized by increased low-frequency seismicity, infrasound signals, and/or thermal output. We characterize these as “intense” degassing episodes, although they may reflect intrusion and “failed eruption” as well. As a final category, four additional UwE events have occurred within 1 year of significant (VEI 3+) eruptions, such as the unrest at Augustine 2007 and Okmok 2009. These may result from additional time periods of intrusion not immediately associated with eruption, or they may reflect adjustment of the crust after evacuation of magma.
An obvious question that arises is: for monitored volcanoes, how often does unrest lead to eruption? To answer this question, we look at events at monitored volcanoes that are classified as either UwE, or Good. A Good classification implies that there was enough precursory activity to warrant issuing an alert. We ignore eruptions that did not exhibit detected precursors. When looking at the 24 events that fit these criteria (i.e., UwE or Good, and seismically monitored with eruption precursors), seven (29%) resulted in eruption, and 17 (71%) did not. Looking only at andesitic volcanoes, one in four unrest sequences resulted in eruption. These are useful numbers to keep in mind during future episodes of unrest, and assigning probabilities such as during an event tree development.
Advancements in Monitoring and Implications for Next Generation of Volcano Monitoring Systems
AVO's recent advancements in multi-disciplinary volcano monitoring yield improved eruption forecasting capabilities, even considering that many Alaska volcanoes have frequent, small eruptions without much, if any, precursory seismicity. “Missed” events—highly undesirable for a volcano observatory—are not known to occur in AVO's record since 2002, largely due to improved monitoring and observations, including: seismic; geodetic; satellite; infrasound; local observers communicating with AVO via the Internet and telephone; and AVO's interagency coordination with the FAA to receive pilot reports. The last ten years (2008–present) have seen four successful forecasts, while the previous two decades held only five, suggesting that the slow and continual expansion from three monitored volcanoes (1989) to 32 (2017) has substantially increased AVO's ability to forecast eruptions.
When the USGS first introduced the concept of a National Volcano Early Warning System, or NVEWS, a threat assessment (Ewert, 2007) ranked all U.S. volcanoes into four threat categories: very high, high, moderate, and low, based on objective hazards and exposure to population and infrastructure. At the same time, Moran et al. (2008) made instrumentation recommendations at four levels that were directly linked to the volcanic-threat rankings of Ewert et al. (2005) and Ewert (2007). Thus, low-threat volcanoes should have basic monitoring capabilities, and higher threat volcanoes should have subsequently denser and more sophisticated monitoring networks.
We suggest that in addition to considering volcanic-threat levels, instrumentation strategies also take into account more granular details about volcanic systems in question. In particular, “open-system” volcanoes require either denser seismic data, including near-vent or borehole stations, to be forecast; or additional data, including near-summit tilt, gas, and reliable web camera data. Recent advances in gas monitoring are particularly exciting for open systems (e.g., de Moor et al., 2016). Denser multi-disciplinary networks are highly desirable for frequently-active, low-viscosity systems, and may enable improved forecasts and understanding of the underlying volcanic processes that drive eruptions. In contrast, “closed-system” volcanoes can often, but not always, be successfully forecast with more traditional monitoring networks dominated by seismic instrumentation. Alaska has ~100 volcanoes active in the Holocene, although only 30 of them have erupted in historical time, and AVO currently seismically monitors a slightly different set of 32. This leaves about 70 unmonitored volcanoes that, if they were to erupt, would likely have substantial precursory seismicity. The best chance to forecast these potentially large eruptions would be to instrument these long-repose time volcanoes. This is similar to the recommendation of the National Academy's recent consensus study report recommending working toward “sparse ground-based monitoring of all potentially active volcanoes… and that monitoring strategies need to be tailored to the type of volcano in question” (ERUPT Report, National Academies of Sciences Engineering Medicine, 2017). In a region such as Alaska, with a large number of volcanoes over a vast swath of remote wilderness, added insights into the nature of the volcanoes, derived from dense multi-parametric monitoring networks and geologic study, can further assist in prioritization of instrumentation.
Conclusions
Our analysis demonstrates that it is important that measures of success or failure at eruption forecasting take into account an observatory's rationale and procedure for use of alert levels and alert notifications, as well as monitoring and individual volcano and eruption characteristics. AVO has had the greatest success forecasting larger eruptions (VEI 3+) at seismically monitored volcanoes with longer repose times and relatively more silicic magma compositions. Because these larger eruptions have the greatest impact on aviation, they are also the most critical for successful monitoring and forecasting. Eruptions at volcanoes with short repose times, typically with basaltic or basaltic andesite composition, are generally poorly forecast, due to a lack of detectable precursory seismic activity. Seismic monitoring at these volcanoes significantly shortens the eruption detection time, however. Denser multi-parametric networks for these fluid and frequently-erupting volcanoes could improve AVO's ability to forecast an eruption. Successful forecasting could also be aided by the continued development of volcano-specific alarm algorithms to detect very subtle changes in seismicity and infrasound. Fortunately, AVO is well-calibrated at interpreting co-eruptive seismicity at these volcanoes (Haney et al., 2009), so we can detect and make accurate assessments of eruptions relatively quickly. Non-seismically monitored volcanoes pose significant forecasting challenges, but improved communication, satellite coverage, lightning data, and infrasound have reduced eruption detection time and eliminated “Missed” eruptions. Greater multi-disciplinary instrumentation of all volcanoes in Alaska would reduce the chance of unforecast volcanic eruptions.
Data Availability
All datasets analyzed for this study are included in the manuscript, supplementary files, and https://www.avo.alaska.edu/activity/avoreport.php.
Author Contributions
CC, SP, MC, and DR designed and performed the study, and compiled data for the analysis. JP and KW contributed to the analysis of the results. All authors provided critical feedback and helped write the manuscript.
Funding
Funding for this study is from the USGS Volcano Hazards Program. This project was partially funded through State of Alaska Division of Geological and Geophysical Surveys cooperative agreements with the USGS Volcano Hazards Program, grant numbers G16AC00054 and G16AC00165.
Conflict of Interest Statement
The authors declare that the research was conducted in the absence of any commercial or financial relationships that could be construed as a potential conflict of interest.
Acknowledgments
This work began as abstracts presented at Cities on Volcanoes 9 by Prejean et al. (2016) and Cameron et al. CC expresses gratitude for conversations with Tina Neal and Marianne Guffanti, who helped encourage this work, to Jeremy Pesicek for assistance in determining network health and to Sarah Ogburn for her eagle eye in checking eruption chronologies. Many thanks also to John Pallister and Janet Schaefer, whose thorough reviews strengthened this manuscript, and to the two reviewers assigned by Frontiers, who each helped us present these thoughts with improved clarity.
Supplementary Material
The Supplementary Material for this article can be found online at: http://journal.frontiersin.org/article/10.3389/feart.2018.00086/full#supplementary-material
Supplementary Data Sheet 1. Table of events and notifications issued by the Alaska Volcano Observatory, 1989–October 2017. All dates are local date/time. Column descriptions are as follows: Volcano: volcano where the event took place. Event Start: time the eruption or unrest began. 00 is used for unknown days, or months. All events have known years. Notification Class: classes of AVO's notification about the event, see text for full descriptions. Composition: composition of erupted material, or, in the case of eruptions without analyzed products or unrest events, the composition of the most recently erupted products. Further information on compositions is provided in Supplementary Material B. Repose Time: the length of time since the start of the most recent eruption, rounded to a tenth of a year. In cases where the date or the month is not known, the 15th of the month and June are used. Seismic Monitoring: was there a local, seismic network, functioning at the time of the event, functioning for sufficient time before the event to characterize background seismicity? Detect Only, notification lag: for those events that were “Detect Only,” what was the time lag between event onset and AVO's formal, written notification? Time given in days, rounded to 3 h for lags of less than a day, and given in integers for lags >1 day. Notice Date: date of AVO's official notification, where applicable. Forecast Lead Time: for eruptions where AVO's classification was “Good”, what was the amount of time between forecast and eruption? Time given in days, rounded to 3 h for differences of less than 1 day, and integers for time differences >1 day. First color code change, monitored volcanoes only: for those volcanoes monitored by AVO at the time of the event, this column shows the initial color code change for the event, with U, Unassigned; G, Green; Y, Yellow; and R, Red. Event Description: short description of the event. Main Citation: primary reference for more information on the event.
Supplementary Data Sheet 2. Listing of volcanoes and compositional data, including data source information.
References
Bleick, H. A., Coombs, M. L., Cervelli, P. F., Bull, K. F., and Wessels, R. L. (2013). Volcano-ice interactions precursory to the 2009 eruption of Redoubt Volcano, Alaska. J. Volcanol. Geother. Res. 259, 373–388. doi: 10.1016/j.volgeores.2012.10.008
Buurman, H., Nye, C., West, M., and Cameron, C. (2014). Regional controls on volcano seismicity along the Aleutian arc. Geochem. Geophys. Geosyst. 15, 1147–1163. doi: 10.1002/2013GC005101
Buurman, H., West, M. E., and Thompson, G. (2013). The seismicity of the 2009 Redoubt eruption. J. Volcanol. Geother. Res. 259, 16–30. doi: 10.1016/j.jvolgeores.2012.04.024
Brantley, S. R. (1990). The Eruption of Redoubt Volcano. Alaska: U.S. Geological Survey Circular 1061.
Cameron, C. E., Dixon, J. P., Neal, C. A., Waythomas, C. F., Schaefer, J. R., and McGimsey, R. G. (2017). 2014 Volcanic Activity in Alaska – Summary of Events and Response of the Alaska Volcano Observatory. U.S. Geological Survey Scientific Investigations Report 2017-5077, 81.
Cameron, C. E., and Nye, C. J. (2014). Preliminary Database of Quaternary Vents in Alaska. Fairbanks, AK: Alaska Division of Geological & Geophysical Surveys Miscellaneous Publication 153.
Cameron, C. E., and Schaefer, J. R. (2016). Historically active volcanoes of Alaska. Fairbanks, AK: Alaska Division of Geological & Geophysical Surveys Miscellaneous Publication 133 v.2. doi: 10.14509/20181
Casadevall, T. J. (1994). The 1989–1990 eruption of Redoubt Volcano, Alaska: impacts on aircraft operations. J. Volcanol. Geother. Res. 62, 301–316. doi: 10.1016/0377-0273(94)90038-8
Cervelli, P. F., Fournier, T. J., Freymueller, J. T., Power, J. A., Lisowski, M., and Pauk, B. A. (2010). “Geodetic constraints on magma movement and withdrawal during the 2006 eruption of Augustine Volcano,” in The 2006 eruption of Augustine Volcano, Alaska, ed. J. A. Power, M. L. Coombs, and J. T. Freymueller (Reston, VA: U.S. Geological Survey Professional Paper 1769), 427–452.
Chouet, B. A., Page, R. A., Stephens, C. D., Lahr, J. C., and Power, J. A. (1994). Precursory swarms of long-period events at Redoubt Volcano (1989–1990), Alaska: their origin and use as a forecasting tool. J. Volcanol. Geother. Res. 62, 95–135. doi: 10.1016/0377-0273(94)90030-2
Coombs, M. L., Neal, C. A., Wessels, R. L., and McGimsey, R. G. (2006). Geothermal Disruption of Summit Glaciers at Mount Spurr Volcano, 2004–6: An Unusual Manifestation of Volcanic Unrest. U.S. Geological Survey Professional Paper 1732-B, 33.
De Angelis, S., Fee, D., Haney, M., and Schneider, D. (2012). Detecting hidden volcanic explosions from Mt. Cleveland Volcano, Alaska with infrasound and ground-coupled airwaves. Geophys. Res. Lett. 39:L21312. doi: 10.1029/2012GL053635
de Moor, J. M., Aiuppa, A., Pacheco, J., Avard, G., Kern, C., Liuzzo, M., et al. (2016). Short-period volcanic gas precursors to phreatic eruptions; insights from Poas Volcano, Costa Rica. Earth Planet. Sci. Lett. 442, 218–227. doi: 10.1016/j.epsl.2016.02.056
Dixon, J. P., Cameron, C. E., Iezzi, A. M., and Wallace, K. (2017). 2015 Volcanic Activity in Alaska—Summary of Events and Response of the Alaska Volcano Observatory. U.S. Geological Survey Scientific Investigations Report 2017-5104.
Dixon, J. P., Stihler, S. D., Power, J. A., and Searcy, C. K. (2012). Catalog of Earthquake Hypocenters at Alaskan Volcanoes: January 1 Through December 31, 2011. U.S. Geological Survey Data Series 730, 82.
Eichelberger, J. E., Keith, T. E. C., Miller, T. P., and Nye, C. J. (1995). The 1992 Eruptions of Crater Peak vent, Alaska: Chronology and Summary. U.S. Geological Survey Bulletin 2139, 1–18.
Ewert, J. W. (2007). System for ranking relative threats of U.S. volcanoes. Nat. Hazards Rev. 8, 112–124. doi: 10.1061/(ASCE)1527-6988(2007)8:4(112)
Ewert, J. W., Guffanti, M., and Murray, T. L. (2005). An Assessment of Volcanic Threat and Monitoring Capabilities in the United States: Framework for a National Volcano Early Warning System Nvews. U.S. Geological Survey Open-File Report 2005-1164, 62.
Fee, David, Haney, M. H., Matoza, R. S., Van Eaton, A. R., Cervelli, P., Schneider, D. J., et al. (2017). Volcanic tremor and plume height hysteresis from Pavlof Volcano, Alaska. Science 355, 45–48. doi: 10.1126/science.aah6108
Fee, D., and Matoza, R. S. (2013). An overview of volcano infrasound: from hawaiian to plinian, local to global. J. Volcanol. Geother. Res. 249, 123–139. doi: 10.1016/j.jvolgeores.2012.09.002
Freymueller, J. T., and Kaufman, A. M. (2010). Changes in the magma system during the 2008 eruption of Okmok volcano, Alaska, based on GPS measurements. J. Geophys. Res. 115:B12415. doi: 10.1029/2010JB007716
Gardner, C. A., and Guffanti, M. C. (2006). U.S. Geological Survey's Alert Notification System for Volcanic Activity. U.S. Geological Survey Fact Sheet 2006–3139. Available online at: http://pubs.usgs.gov/fs/2006/3139
Global Volcanism Program (2013). “Volcanoes of the World, v. 4.6.6,” in Smithsonian Institution, ed E. Venzke. doi: 10.5479/si.GVP.VOTW4-2013
Guffanti, M., Casadevall, T. J., and Budding, K. (2010). Encounters of Aircraft With Volcanic Ash Clouds: A Compilation of Known Incidents, 1953-2009. U.S. Geological Data Series 545, ver. 1.0, 12. plus 4 appendixes including the compliation database. Available online at: http://pubs.usgs.gov/ds/545
Guffanti, M., and Miller, T. (2013). A volcanic activity alert-level system for aviation: review of its development and application in Alaska. Nat. Hazards 69, 1519–1533. doi: 10.1007/s11069-013-0761-4
Haney, M. M., Buurman, H., Feifei, Q., and Lu, Z. (2014). Deep Seismicity Linked to Shallow unrest at Little Sitkin Volcano, Alaska. Seismological Society of America Annual Meeting, Abstracts with Programs, Anchorage, Alaska.
Haney, M. M., van Wijk, K., Preston, L. A., and Aldridge, D. F. (2009). Observation and modeling of source effects in coda wave interferometry at Pavlof Volcano. Lead. Edge 28, 554–560. doi: 10.1190/1.3124930
Herrick, J. A., Neal, C. A., Cameron, C. E., Dixon, J. P., and McGimsey, R. G. (2014). 2012 Volcanic Activity in Alaska: Summary of Events and Response of the Alaska Volcano Observatory. U.S. Geological Survey Investigations Report 2014-5160, 82
Johnson, J. H., Prejean, S., Savage, M. K., and Townend, J. (2010). Anisotropy, repeating earthquakes, and seismicity associated with the 2008 eruption of Okmok volcano, Alaska. J. Geophys. Res. 115:B00B04. doi: 10.1029/2009/JB006991
Larsen, J., Neal, C., Webley, P., Freymueller, J., Haney, M., McNutt, S., et al. (2009). Eruption of Alaska volcano breaks historic pattern. Eos Trans. AGU 90, 173–175. doi: 10.1029/2009EO200001
LeMaitre, R. W., Streckheisen, A., Zanettin, B., Le Bas, M. J., Bonin, B., and Bateman, P. (2002). Igneous Rocks: A Classification and Glossary of Terms. Cambridge: Cambridge University Press.
Lopez, T., Carn, S., Werner, C., Fee, D., Kelly, P., Doukas, M., et al. (2013). Evaluation of redoubt volcano's sulfur dioxide emissions by the ozone monitoring instrument. J. Volcanol. Geotherm. Res. 259, 290–307, doi: 10.1016/j.jvolgeores.2012.03.002
Lu, Z., and Dzurisin, D. (2010). Ground surface deformation patterns, magma supply, and magma storage at Okmok volcano, Alaska, from InSAR analysis: 2. coeruptive deflation, July–August 2008. J. Geophys. Res. 115:B00B03. doi: 10.1029/2009JB006970
Lu, Z., Wicks, C., Power, J. A., and Dzurisin, D. (2000). Ground deformation associated with the March 1996 earthquake swarm at Akutan volcano, Alaska, revealed by satellite radar interferometry. J. Geophys. Res. 105, 21483–21496. doi: 10.1029/2000JB900200
Mangan, M. T., Miller, T. P., Waythomas, C. F., Trusdell, F. A., Calvert, A. T., and Layer, P. W. (2009). Diverse lavas from closely spaced volcanoes drawing from a common parent: Emmons Lake Volcanic Center, Eastern Aleutian Arc. Earth Planet. Sci. Lett. 287, 363–372. doi: 10.1016/j.epsl.2009.08.018
McCausland, W., White, R., Indrastuti, N., Gunawan, H., Patria, C., Suparman, Y., et al. (2017). Using a process-based model of pre-eruptive seismic patterns to forecast evolving eruptive styles at Sinabung Volcano, Indonesia. J. Volcanol. Geotherm. Res. doi: 10.1016/j.jvolgeores.2017.04.004. [Epub ahead of print].
McGimsey, R. G., Neal, C. A., Dixon, J. P., and Ushakov, S. (2008). 2005 Volcanic Activity in Alaska, Kamchatka, and the Kurile Islands: Summary of Events and Response of the Alaska Volcano Observatory. U.S. Geological Survey Scientific Investigations Report 2007-5269.
McNutt, S. R., and Nishimura, T. (2008). Volcanic tremor during eruptions: temporal characteristics, scaling and constraints on conduit size and processes. J. Volcanol. Geotherm. Res. 178, 10–18. doi: 10.1016/j.jvolgeores.2008.03.010
Miller, T. P., Casadevall, T. J., and Ballard, R. D. (2000). “Volcanic ash hazards to aviation,” in Encyclopedia of Volcanoes, eds. H. Sigurdsson, B. Houghton, S. R. McNutt, H. Rymer, and J. Stix (San Diego, CA: Academic Press), 915–930.
Minakami, T. (1961). Fundamental research for predicting volcanic eruptions (part 1) : earthquakes and crustal deformations originating from volcanic activities. Bull. Earthquake Res. Instit. 38, 497–544.
Moran, S. C., Freymueller, J. T., LaHusen, R. G., McGee, K. A., Poland, M. P., Power, J. A., et al. (2008). Instrumentation Recommendations for Volcano Monitoring at U.S. Volcanoes Under the National Volcano Early Warning System. U.S. Geological Survey Scientific Investigations Report 2008-5114
Moran, S., Newhall, C., and Roman, D. (2011). Failed magmatic eruptions: late-stage cessation of magma ascent. Bull.Volcanol. 73, 115–122. doi: 10.1007/s00445-010-0444-x
National Academies of Sciences Engineering and Medicine (2017). Volcanic Eruptions and Their Repose, Unrest, Precursors, and Timing. Washington, DC: The National Academies Press.
Neal, C. A., McGimsey, R. G., Dixon, J. P., Cameron, C. E., Nuzhaev, A. A., and Chibisova, M. (2011). 2008 Volcanic Activity in Alaska, Kamchatka, and the Kurile Islands: Summary of Events and Response of the Alaska Volcano Observatory. U. S. Geological Survey Scientific Investigations Report 2010–5243, 94.
Neal, C. A., Murray, T. L., Power, J. A., Adleman, J. N., Whitmore, P. M., and Osiensky, J. M. (2010). “Chapter 28: Hazard information management, interagency coordination, and impacts of the 2005–2006 eruption of Augustine Volcano,” in The 2006 Eruption of Augustine Volcano, Alaska, U. S. Geological Survey Professional Paper 1769, eds J. A. Power, M. L. Coombs, and J. T. Freymueller. 645–667. Available online at: http://pubs.usgs.gov/pp/1769/chapters/p1769_chapter28.pdf
Neill, O. K., Larsen, J. F., Izbekov, P. E., and Nye, C. J. (2015). Pre-eruptive magma mixing and crystal transfer revealed by phenocryst and microlite compositions in basaltic andesite from the 2008 eruption of Kasatochi Island volcano. Am. Mineral. 100, 722–737. doi: 10.2138/am-2015-4967
Newhall, C. G., and Hoblitt, R. P. (2002). Constructing event trees for volcanic crises. Bull. Volcanol. 64, 3–20. doi: 10.1007/s004450100173
Nye, C. J., Scott, W. E., Neill, O. K., Waythomas, C. F., Cameron, C. E., and Calvert, A. T. (2017). Geology of Kasatochi volcano, Aleutian Islands, Alaska. Alaska Division of Geological & Geophysical Surveys Professional Report 123.
O'Brien, J. F., Roman, D. C., Dixon, J. P., Power, J. A., and Arnold, R. (2012). Multiple causes for non-eruptive swarms at Mt. Martin, Katmai volcanic cluster, Alaska (2004–2008). J. Volcanol. Geotherm. Res. 229–230, 13–22. doi: 10.1016/j.jvolgeores.2012.03.011
Passarelli, L., and Brodsky, E. (2012). The correlation between run-up and repose times of volcanic eruptions. Geophys. J. Int. 188, 1025–1045. doi: 10.1111/j.1365-246X.2011.05298.x
Pesicek, J. D., Wellik, J. J., Prejean, S. G., and Ogburn, S. E. (2018). Prevalence of seismic rate anomalies preceding volcanic eruptions in Alaska. This volume.
Power, J. A., and Cameron, C. E. (2018). Analysis of the Alaska volcano observatory's response time to volcanic explosions-1989 to 2016. Front. Earth Sci. doi: 10.3389/feart.2018.00086
Power, J. A., Jolly, A. D., Page, R. A., and McNutt, S. (1995). Seismicity and forecasting of the 1992 eruptions of crater peak Vent, Mt. Spurr, Alaska: an overview. U.S. Geol. Survey Bull. 149–159.
Power, J. A., Lahr, J. C., Page, R. A., Chouet, B. A., Stephens, C. D., Harlow, D. H., et al. (1994). Seismic evolution of the 1989–1990 eruption sequence of Redoubt Volcano, Alaska. J. Volcanol. Geotherm. Res. 62, 69–94, doi: 10.1016/0377-0273(94)90029-9
Power, J. A., and Lalla, D. J. (2010). Seismic observations of Augustine Volcano, 1970–2007. U.S. Geological Survey Professional Paper 1769. 3–40.
Power, J. A., March, G. D., Lahr, J. C., Jolly, A. D., and Cruse, G. R. (1993). Catalog of earthquake hypocenters at Redoubt Volcano and Mt. Spurr, Alaska: October 12, 1989–December 31, 1990. U.S. Geological Survey Open-File Report 93-685A, 57.
Prejean, S., Ewert, J., and Cameron, C. (2016). Volcanoes with a short fuse: managing eruptions with limited precursors. Cities on Volcanoes 9 Plenary.
Prejean, S. G., Werner, C. A., Buurman, H., Doukas, M. P., Kelly, P. J., Kern, C., et al. (2012). Seismic and gas analyses imply magmatic intrusion at Iliamna Volcano, Alaska in 2012. Eos Trans., AGU Fall Meeting Supp., V53B-2826.
Ramsey, M. S., Byrnes, J. M., Wessels, R. L., and Izbekov, P. I. (2015). “Applications of high-resolution satellite remote sensing for northern Pacific volcanic arcs,” in Monitoring Volcanoes in the North Pacific—Observations From Space, eds K. G. Dean and J. Dehn (Berlin: Springer), 79–99.
Roman, D. C., Power, J. A., Moran, S. C., Cashman, K. V., Doukas, M. P., Neal, C. A., et al. (2004). Evidence for dike emplacement beneath Iliamna Volcano, Alaska in 1996. J. Volcanol.Geotherm. Res. 130, 265–284. doi: 10.1016/S0377-0273(03)00302-0
Ruppert, N. A., Prejean, S., and Hansen, R. A. (2011). Seismic swarm associated with the 2008 eruption of Kasatochi Volcano, Alaska: earthquake locations and source parameters. J. Geophys. Res. 116:B00B07. doi: 10.1029/2010JB007435
Shimozuru, D. (1971). “A seismological approach to the prediction of volcanic eruptions,” in The Surveillance and Prediction of Volcanic Activity. UNESCO Earth Sci. Monograph. No 8, Paris, 19–45. Available online at: http://unesdoc.unesco.org/images/0000/000025/002585eo.pdf
Siebert, L., Simkin, T., and Kimberly, P. (2010). Volcanoes of the World 3rd edn. Berkley, CA: University of California Press.
Sparks, R. S. J. (2003). Forecasting volcanic eruptions. Earth Planet. Sci. Lett. 210, 1–15. doi: 10.1016/S0012-821X(03)00124-9
Swanson, D. A., Casadevall, T. J., Holcomb, R. T., Newhall, C. G., Malone, S. D., and Weaver, C. S. (1985). Forecasts and predictions of eruptive activity at Mount Saint Helens, USA: 1975–1984. J. Geodyn. 3, 397–423. doi: 10.1016/0264-3707(85)90044-4
Tilling, R. I. (2008). The critical role of volcano monitoring in risk reduction. Adv. Geosci. 14, 3–11. doi: 10.5194/adgeo-14-3-2008
Waythomas, C. F., Haney, M. M., Wallace, K. L., Cameron, C. E., and Schneider, D.J. (2017). The 2014 eruptions of Pavlof Volcano. Alaska: U.S. Geological Survey Scientific Investigations Report 2017–5129.
Waythomas, C. F., Scott, W. E., Prejean, S. G., Schneider, D. J., Izbekov, Pavel, et al. (2010). The 7–8 August 2008 eruption of Kasatochi Volcano, central Aleutian Islands, Alaska. J. Geophys. Res. 115:B00B06. doi: 10.1029/2010JB007437
Werner, C., Evans, W. C., Kelly, P. J., McGimsey, R., Pfeffer, M., Doukas, M., et al. (2012). Deep magmatic degassing versus scrubbing: elevated CO2 emissions and C/S in the lead-up to the 2009 eruption of Redoubt Volcano, Alaska. Geochem. Geophys. Geosyst. 13:18. doi: 10.1029/2011GC003794
Werner, C., Kern, C., Coppola, D., Lyons, J. J., Kelly, P. J., Wallace, K. L., et al. (2017). Magmatic degassing, lava dome extrusion, and explosions from Mount Cleveland volcano, Alaska, 2011-2015: insights into the continuous nature of volcanic activity over multi-year timescales. J. Volcanol. Geotherm. Res. 337, 98–110. doi: 10.1016/j.jvolgeores.2017.03.001
Wessels, R. L., Vaughan, R. G., Patrick, M. R., and Coombs, M. L. (2013). High-resolution satellite and airborne thermal infrared imaging of precursory unrest and 2009 eruption at Redoubt Volcano, Alaska. J. Volcanol. Geotherm. Res. 259, 248–269. doi: 10.1016/j.jvolgeores.2012.04.014
White, R., and McCausland, W. (2016). Volcano-tectonic earthquakes: a new tool for estimating intrusive volumes and forecasting eruptions. J. Volcanol. Geotherm. Res. 309, 139–155. doi: 10.1016/j.jvolgeores.2015.10.020
Keywords: eruption, volcano, forecasting, Alaska, volcano monitoring, volcanic alerts
Citation: Cameron CE, Prejean SG, Coombs ML, Wallace KL, Power JA and Roman DC (2018) Alaska Volcano Observatory Alert and Forecasting Timeliness: 1989–2017. Front. Earth Sci. 6:86. doi: 10.3389/feart.2018.00086
Received: 01 March 2018; Accepted: 04 June 2018;
Published: 03 July 2018.
Edited by:
Nicolas Fournier, GNS Science, New ZealandReviewed by:
Luis E. Lara, Sernageomin, ChileAlessandro Bonforte, Istituto Nazionale di Geofisica e Vulcanologia, Italy
Copyright © 2018 Cameron, Prejean, Coombs, Wallace, Power and Roman. This is an open-access article distributed under the terms of the Creative Commons Attribution License (CC BY). The use, distribution or reproduction in other forums is permitted, provided the original author(s) and the copyright owner(s) are credited and that the original publication in this journal is cited, in accordance with accepted academic practice. No use, distribution or reproduction is permitted which does not comply with these terms.
*Correspondence: Cheryl E. Cameron, cheryl.cameron@alaska.gov