 Madeleine T. L. Berg1
 Geoffrey D. Bromiley1*Yann Le Godec2Julien Philippe2Mohammed Mezouar3Jean-Philippe Perrillat4
 Nicola J. Potts1
- 1School of GeoSciences, University of Edinburgh, Edinburgh, United Kingdom
- 2Institut de Minéralogie et de Physique des Milieux Condensés, Université Pierre et Marie Curie and Centre national de la Recherche Scientifique, Paris, France
- 3European Synchrotron Radiation Facility, Grenoble, France
- 4Laboratoire de Géologie de Lyon, Université Claude Bernard Lyon 1, Lyon, France
Core formation has left a lasting geochemical signature on the Earth. In order to constrain the composition of the Earth we must fully understand the processes by which newly formed Earth, and the bodies which accreted to it, differentiated. Percolation of iron-rich melt through solid silicate has been invoked as a mechanism for differentiation and core formation in terrestrial bodies in the early solar system. However, to date the contribution of percolation to core formation cannot be assessed due to the absence of data on Fe-rich melt migration velocities. Here we use a novel experimental design to investigate textural changes in an analog system, Au melt in polycrystalline h-BN, at 3 GPa, relevant to core formation in the early solar system. Using a combination of high resolution, in-situ X-ray tomography and fast 2-D radiographic imaging, we obtain the first direct data on melt migration velocities at high PT. Melt migration is highly variable and episodic, driven by variations in differential pressure during melt migration and matrix compaction. Smaller scale melt processes, representing migration of melt along pre-existing melt networks, give comparatively fast velocities of 0.6–60 μms−1. Ex-situ experiments are used to compare melt networks in analog systems to Fe-rich melt in silicates. Two competing processes for melt migration are percolation of melt along grain boundaries, and hydraulic fracturing induced by melt injection. Typically, both processes are noted in experimental and natural systems, although the relative importance of each mechanism is variable. Using a simple model for melt flow through a porous media, migration velocities determined here account for full differentiation of Earth-sized bodies within 101–103 Myr, for submicron diameter melt bands, or within a few Myr or micron-sized melt bands. This is consistent with rapid timescales inferred from geochemistry for core formation in planetesimals, implying that percolation may have had an important contribution to core differentiation in the Earth.
Introduction
Core formation represents one of the most significant events in the formation and evolution of terrestrial bodies, including Earth. These bodies have a characteristic layered structure, consisting of metallic, Fe-rich, cores surrounded by thick shells of silicate. This implies that there must have been a mechanism or mechanisms to efficiently separate iron alloy from silicate in the accreted material which ultimately formed Earth, Venus, Mars, Mercury, and other bodies (Stevenson, 1990). Differentiation would have partitioned elements, either fully or partially, between metallic and silicate components, resulting in a lasting geochemical reservoir (Wood, 2008). As such, determining the exact processes of differentiation and core formation, the range of pressure-temperature and fO2 conditions under which they operated, and the timescales for these processes, is a critical step in modeling planetary evolution and in constraining the geochemistry of the rocky planets.
During, or shortly after accretion, undifferentiated material in planetesimals and proto-planets underwent reorganization on timescales of millions to tens of millions of years, separating dense Fe-Ni-S core-forming liquids from less dense silicates (Chambers, 2004; Kruijer et al., 2014). In smaller planetesimals (up to 80 km diameter), the heat source for differentiation was likely decay of short-lived isotopes 26Al and 60Fe, which will have primarily resulted in melting Fe-S components, then, at higher temperatures, of silicate material (Hevey and Sanders, 2006; Gupta and Sahijpal, 2010). However, transport of heat-producing 26Al to the surface of smaller bodies in the first silicate melts, coupled with thermal buffering due to Fe-S melting, may have minimized the extent of silicate melting during differentiation (Wilson and Keil, 2012; Mare et al., 2014; Neumann et al., 2014). In larger bodies, prolonged accretion of large impactors resulted in additional heating and more extensive melting, supporting the existence of silicate magma oceans (Nakajima and Stevenson, 2015). Formation of deep magma oceans is typically used to explain the efficiency of core formation in the early solar system (Stevenson, 1990). However, although the existence of long-lived magma oceans can be hypothesized for the Earth, there is growing realization that the magma ocean model cannot alone explain many aspects of core-formation in the early solar system. High-resolution Fe isotopic studies reveal no evidence for terrestrial extreme pressure/temperature fractionation that would be expected in the deep magma ocean model (Craddock et al., 2013; Halliday, 2013). Parent bodies for many meteorites, considered as representatives of bodies which accreted to the proto-planets, show geochemical evidence for low-temperature differentiation in the absence of silicate melting (Mare et al., 2014; Barrat et al., 2015). Furthermore, Rudge et al. (2010) have demonstrated that the observed geochemistry of the Earth can be modeled without the assumption of full metal-silicate chemical equilibration, indicating that core formation in the early solar system may well have been a protracted, multi-stage process, involving both percolation-aided segregation and later silicate melting. Assessing the limiting conditions under which percolation is a viable mechanism for segregation of Fe-rich melts could help place constraints on the nature and timing of core formation in the inner solar system.
Whilst segregation of Fe-rich liquids from a silicate magma ocean would be a highly efficient mechanism for segregation, the effectiveness of percolation as a mechanism for core formation remains uncertain. Fe-S liquids typically have high dihedral angles in silicate matrices, implying that percolation is only possible above a critical melt fraction (Von Bargen and Waff, 1986; Ballhaus and Ellis, 1996; Shannon and Agee, 1996; Terasaki et al., 2005, 2007). In-situ electrical conductivity studies indicate a connectivity threshold of around 5 vol% (Yoshino et al., 2003, 2004), although other studies reveal that this value might be substantially higher (Walte et al., 2007; Bagdassarov et al., 2009a). A high connectivity threshold for core-forming melts suggests that undifferentiated planetesimals would need a large volume fraction of melt to begin differentiating. However, recent modeling work (Ghanbarzadeh et al., 2017) suggests that in complex natural systems, once interconnected metallic melt networks form, percolation can drain areas of melt to melt fractions of below 2%.
Experimental studies have demonstrated that percolation can act as a mechanism for core formation under certain deep planetary conditions. Numerous studies have highlighted the key role of shear deformation in mobilizing Fe-S rich melts that would otherwise be trapped within solid silicate matrices (Bruhn et al., 2000; Rushmer et al., 2005; Groebner and Kohstedt, 2006; Hustoft and Kohlstedt, 2006; Rushmer and Petford, 2011). Although Walte et al. (2011) argued that this mechanism of deformation-aided melt segregation does not operate at lower strain rates, the recent study of Berg et al. (2017) demonstrated the efficiency of this mechanism over a wide-range of experimental strain rates under high PT. Shi et al. (2013) demonstrated that extreme pressure also plays a fundamental role in modifying textures in equilibrated Fe-S liquid-silicate systems, implying that percolative flow would have occurred in the lower mantles of the early Earth and Venus. Terasaki et al. (2008) have also shown that full interconnectivity of Fe-S liquids can occur under more oxidizing conditions regardless of deformation, which might explain low-temperature differentiation in planetesimals. Therefore, percolative core formation can be initiated in systems with high metallic fractions, and in systems with low metallic fractions under oxidizing conditions, under extreme pressures or during deformation. Once initiated, percolation can effectively drain core forming melts from a system. In fact, the fraction of trapped Fe-rich melt left within the silicate matrix is small enough to satisfy observed highly siderophile element concentrations in the bulk silicate Earth (Ghanbarzadeh et al., 2017).
Geochemical constraints imply timescales for planetary core formation of, at most, tens of millions of years (Kleine et al., 2009), and as little as 3 Myr after formation of Ca-Al-rich inclusions in planetesimals (Kleine and Wadhwa, 2017). Therefore, it remains uncertain whether Fe-rich liquid segregation is rapid enough for percolation to have played a significant role. Most studies of core-forming melt percolation rely on textures to indirectly infer migration velocities, and are typically based on gravity driven percolation through a stable melt network (e.g., Hustoft and Kohlstedt, 2006; Roberts et al., 2007; Bagdassarov et al., 2009b; Kohlstedt and Holtzman, 2009). As such, melt migration velocities are, at best, guestimates. Recent studies (Bagdassarov et al., 2009b; Cerantola et al., 2015) have also shown that partial melting of silicate matrices can actually inhibit segregation of Fe-rich melts, implying that if percolation is a viable mechanism for core formation, it must be efficient enough to result in Fe-melt segregation before the onset of silicate melting. Bagdassarov et al. (2009b) provide one of the only direct experimental assessments of Fe-melt segregation velocities in silicate, based on a high-pressure/temperature centrifugal study. Using textural analysis of quenched samples they modeled segregation of FeS melt within a compacting silicate matrix, and derived segregation velocities of 10−4 to 10−5 mm/h, scaled to 1 g gravity. These rates would be too slow to efficiently form planetary cores, which would require minimum segregation velocities of 10−3 mm/h for Earth, or 10−2 mm/h for Vesta. However, Bagdassarov et al. (2009b) derived melt segregation velocities indirectly from 2-D textural analysis of run products, which provide limited understanding of progressive textural development in dynamically evolving samples. Recently, Todd et al. (2016) provided the first assessment of Fe-melt migration velocities based on in-situ measurements in analog core-segregation experiments. They obtained high resolution 3-D X-ray tomographic images of a sample of 4.5 vol% FeS melt in polycrystalline olivine during progressive annealing at high PT and during torsional deformation. However, the method which they used provided a limited voxel size of 2 μm; previous experimental studies have demonstrated that melt networks in deforming olivine-FeS systems typically develop at the micron scale or smaller (Berg et al., 2017), and only scale to larger features at very high strain rates when extensive melt channeling develops. Todd et al. (2016) determined melt migration velocities indirectly using Lattice-Boltzmann simulations, which were then used to simulate flow through meshes created from their 3-D textural datasets. However, importantly, the image thresholding technique used by Todd et al. (2016) was based partly on expected melt contents of radiographic images; as such, at the resolution available, finer melt networks were not resolved, and permeability may have been significantly underestimated. Furthermore, they did not observed melt textures previously described in olivine-FeS high pressure deformation experiments (Walte et al., 2011; Berg et al., 2017), suggesting that deformation-aided melt segregation was not simulated in the experiments.
Recently, Philippe et al. (2016) described a modified Paris-Edinburgh type apparatus (RoToPEC) for performing in-situ tomographic studies at extreme conditions (high pressure/temperature/stress), similar to the previously described Paris-Edinburgh type deformation apparatus of Bromiley et al. (2009) used in the core-formation experimental study of Berg et al. (2017). Philippe et al. (2016) additionally provided initial in-situ synchrotron X-ray tomography data on evolution of Fe-S melt rich regions in polycrystalline olivine, under various high pressure/temperature conditions during torsional deformation. As with the study of Todd et al. (2016), voxel resolution was limited to around 2 μm, and Philippe et al. (2016) were also unable to resolve fine core-forming melt channels, or assess any melt migration in their in-situ tomographic data set. In this study, we develop an alternative approach to determine melt migration velocities under extreme conditions. This approach is based on initial in-situ studies described above, but in a simplified analog system, and with a modified experimental setup aimed to produce melt channels of a sufficient size to be resolved within the current limitations of high-pressure and/or tomographic synchrotron beamline facilities.
Methods
In-Situ Tomography
The RoToPEc apparatus was installed on the ID27 extreme conditions beamline at the European Synchrotron Radiation Facility (ESRF), Grenoble, France, using a custom-built stage capable of moving in X, Y, and Z orthogonal directions to align the sample within the X-ray beam. A motorized Soller slit system was used to collected in-situ diffraction data, coupled with PerkinElmer image plate (Mezouar et al., 2002). Radiographic images were obtained using a MARCCD 165 camera, with the automated system allowing rapid toggling between diffraction and imaging modes. X-ray camera control was coupled to the motors driving rotation of the RoToPEc anvils, allowing projections to be taken at increments of 0.02° during 180° sample rotation. Exposure time and beam energy were varied based on attenuation of the sample volume and surrounding gasket during trial experiments, with optimized values of 0.37 Å beam wavelength, equivalent to ≈33 keV, and an 100 ms exposure time.
Figure 1 shows the sample assembly. A boron-epoxy gasket was used with an internal graphite resistance furnace, molybdenum rings to ensure good electrical contact with the upper and lower anvil faces, and alumina spacers. A split-capsule design was used to promote melt migration through the central portion of the assembly visible during in-situ radiography. This consisted of upper and lower hexagonal boron nitride (h-BN) polycrystalline capsules with a central, drilled volume housing the melt-rich assemblage. The intention of this design was to promote considerable melt migration and channelization along the central join between the 2 sides of the capsule. An outer single piece h-BN sleeve was used to enhance stability of the sample volume. h-BN was used in this study as the matrix material, after a series of unsuccessful trial experiments, for a number of reasons: (1) the availability of high quality, fine-grained polycrystalline material with a minimal variation in grain size, (2) the ease with which the material could be machined accurately, and (3) its higher thermal conductivity, which was observed to minimize blowouts during sample melting, presumably due to lower thermal gradients during the initial stages of experiments. Although h-BN differs in key characteristics from mantle silicates, as we discuss later, gold melt in h-BN provides useful insight in metallic melt mobility under mantle conditions. Gold was used as the melt phase as it is a commonly used analog material for investigating textural development in silicate/core-forming melt studies (e.g., Bruhn et al., 2000; Walte et al., 2011). Although the melting point of gold is several hundred degrees lower than Fe-S, at high-pressures, this facilitates long duration experiments. Central regions of the sample were loaded with a mix of 20 vol% fine-grained (0.5–0.8 μm) spec-pure gold powder mixed with powdered h-BN (<1 μm), homogenized in a agate pestle and mortar by grinding in air for 30 min. Pressure and temperature were determined using existing calibrations for hydraulic load (oil pressure) and power (Bromiley et al., 2009; Philippe et al., 2016; Berg et al., 2017), and from diffraction data using known equations of state for both gold and h-BN (Le Godec et al., 2000; Shim et al., 2002). Diffraction patterns were also used to determine onset of gold melting, from the rapid disappearance of gold reflections in diffraction patterns. Figure 2 shows a schematic of how data was collected during the experiment once run pressure had been obtained.
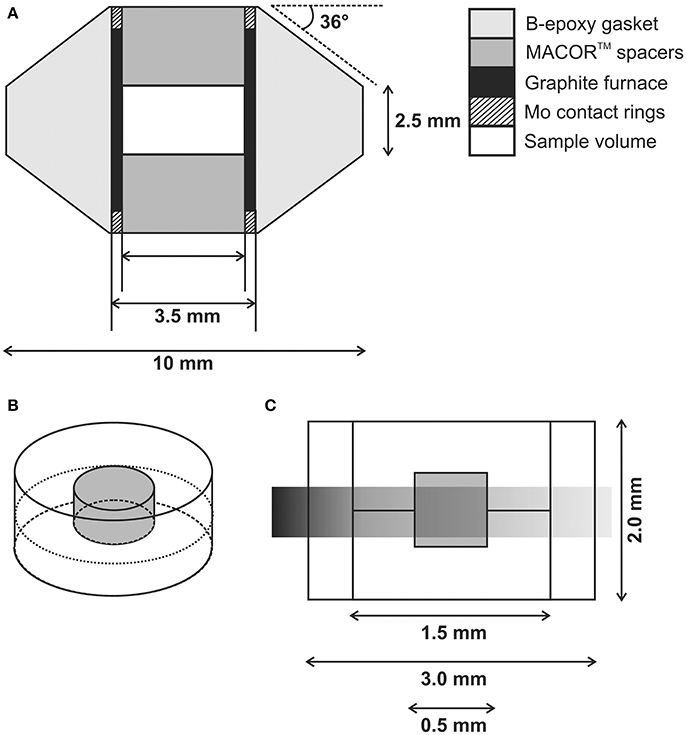
Figure 1. RoToPEc sample assembly. (A) Schematic showing sample assembly, consisting of a shaped boron-epoxy gasket containing integral graphite resistance furnace. (B) 3-D depiction of central sample volume used in melt migration study, consisting of a 2-piece polycrystalline h-BN capsule containing drilled central volume (gray) housing 2-phase mixture of polycrystalline gold and powdered h-BN. (C) 2-D schematic of sample volume shown in (B) with additional outer boron nitride sleeve to aid sample stability at high PT. Gray transparent region represents portions of the sample assembly visible to the X-ray beam, which is otherwise absorbed by the upper and lower carbide anvils.
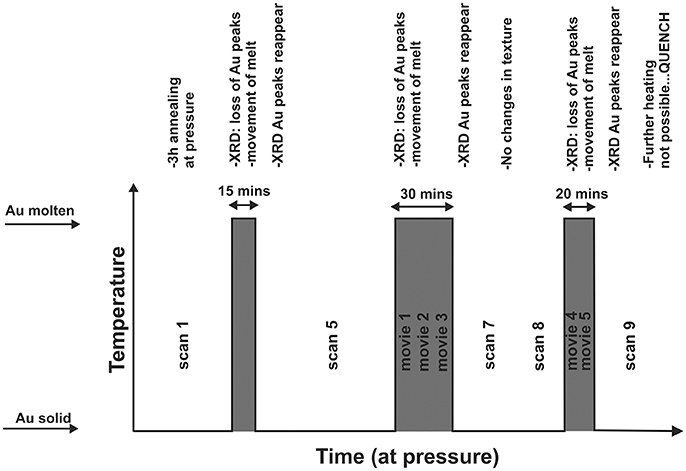
Figure 2. Schematic showing details of the in-situ experiment once run pressure (3 GPa) had been attained. Vertical axis indicates temperature, which was cycled above and below the melting point of Au and the horizontal axis indicates time. “Scan” indicates relative timing of full 3-D tomographic scans obtained after heating cycles (lower temperature, when Au was solid), and “movie,” timing of 2-D radiographic movies obtained during heating cycles (higher temperature, while Au was molten). Text gives additional experimental details.
Ex-Situ Experiments
Additional experiments were conducted at the University of Edinburgh to investigate processes for Au melt migration in h-BN and MgO, and their relevance to Fe-S melt migration in polycrystalline silicate. A series of end-loaded piston-cylinder experiments were performed with using the same capsule design, for capsules made of polycrystalline h-BN and MgO. Run conditions, heating and cooling cycles replicated those of the RoToPEC experiment, with additional comparison experiments performed using a single heating/pressurization stage, such that the sample was fully pressurized, heated to above the Au melting point, and then quenched after a period of 24 h. Full details of the piston cylinder apparatus, sample assembly and calibration are given in Bromiley et al. (2010). All recovered samples were analyzed using a Carl Zeiss SIGMA HD VP Field Emission Scanning Electron Microscope (SEM). Samples proved to be challenging to polish due to the extreme contrast in hardness between fine Au melt networks and h-BN /MgO. However, recovered samples typically fractured longitudinally to the compression axis of compression of the experiments, meaning that sample surfaces were typically quite flat, and could be easily characterized by secondary electron imaging, and in some cases, by backscattered electron imagining.
In-Situ Experimental Details and Data Processing
After pressurization to 3 GPa over 1 h, a tomography scan at room temperature was taken, and the sample was then heated to 1,000°C at a rate of 50°C/min. Temperature was maintained for an additional 2 h before heating at 10°C/min until melting of Au was observed. Temperature was then dropped to below the melting point of Au and a series of images taken. Over the next 20 h, pressure was continually monitored and maintained whilst temperature was cycled through the melting point of Au. Changes in Au melt distribution were too fast to be tracked by tomographic scans, which took 45–60 min to acquire. Therefore, a combination of high-spatial resolution 3D tomographic scans and high temporal resolution 2-D radiographic movies were used to monitor and characterize textural changes. A further 3 melting events were monitored during which (1) 3-D tomographic scans were obtained while the sample was held just below the melting point of Au; (2) 2-D radiography movies obtained while the sample was held above the melting point of Au for a few tens of minutes; (3) a 3-D tomographic scan obtained after the temperature had been rapidly lowered to solidify the Au melt. Voxel size in tomography scans was 2.8 μm, although the actual resolution was slightly lower than this. Reconstruction of 2D slices from the tomographic dataset was performed using the University of Ghent's Octopus 8.7 reconstruction software (Dierick et al., 2004) using a filtered background projection algorithm to create sonograms and 2D slices from projections. Flat field and dark current images were obtained before and after each tomographic scan by driving the sample out of the beam path, and then closing the experimental shutter. Octopus software was used to remove ring artifacts during the creation of sinograms, minimize the effects of beam hardening and apply a simple noise filter during reconstruction. 2D projections had an exposure time of 100 ms, a time interval of 20 s between projections, and a spatial resolution of 2.5 μm. Projections for each movie were normalized using flat field and dark current images to improve sample contrast and enhance signal-noise ratios. To highlight changes between projections as a function of time, an initial reference frame, p0, was subtracted from each subsequent frame, px, to create a “difference” image, px-p0, using the ImageJ Image Calculator function (Abramoff et al., 2004). Grayscale in resulting images represents change in sample attenuation between the reference and new projection.
Results From In-Situ Tomography and Radiography
Figure 3 shows volume renderings from tomographic datasets. Scan 1, obtained before heating, shows that some misalignment between the 2 halves of the capsule occurred during loading/pressurization. This misalignment is obvious in all subsequent scans, although there does not appear to be any significant slip between the capsule halves during the experiment (i.e., subsequent to initial pressurization and annealing). In fact, high resolution scans (for example Figures 8, 9) show that there is a single, coherent melt-rich region in the central sample volume. Furthermore, we note no evidence for an influence of this misalignment on melt network development, with some melt sheets cutting across the original join between the capsule halves. As discussed below, however, it is likely that melt distribution in the sample influences textural development.
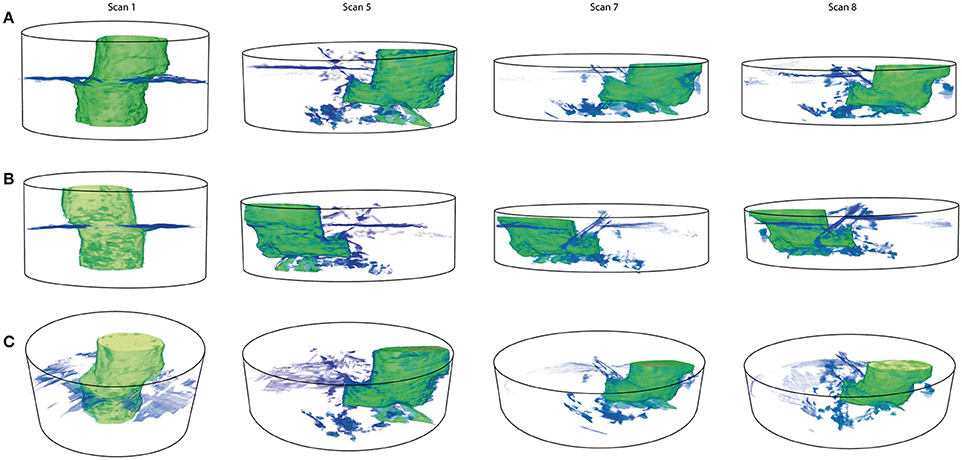
Figure 3. Volume rendering of tomographic scans at three orientations (A–C). A masking technique is applied to segment volumes of interest but preserve grayscale values within segmented areas, and therefore, attenuation value of volumes of interest. Blue, lowest attenuation; green to yellow, highest attenuation. Only attenuation from Au melt is shown.
In addition to misalignment, there is also increased beam attenuation at the join between the 2 halves of the capsule prior to melting, mostly likely representing Au grains dropped onto the h-BN capsule during loading of the central melt-rich volume, and/or minor amounts of extrusion of the softer Au along the capsule join during pressurization. From subsequent volume renderings it is clear that (1) considerable Au melt migration throughout the h-BN outer capsule occurred during the heating cycles, (2) that no observable melt extrusion occurred along the capsule join, and instead that (3) a complex pattern of melt channels/sheets developed in the sample, with both vertical and horizontal movement of Au melt through the h-BN. It is also evident that (4) a fraction of the Au melt escaped the h-BN capsule during the experiment, typically through vertical to near vertical melt channels. During each heating cycle there was further shortening of the sample volume (the height of rendered volumes shown in Figure 3 is constrained by the spacing between carbide anvils). As is typical in Paris-Edinburgh cell experiments, progressive annealing of samples at elevated P-T results in sample shortening, and the effect here was markedly increased during melt migration.
The melt network which forms within the sample consists predominantly of extensive, thin melt sheets (Figure 3; see also higher magnification images in Figures 8, 9). These are sub-planar to undulate, typically on the order of 10 μm thick, 10–100 μm wide, and extending 100–1,000 s μm in length. Less extensive more arcuate melt sheets are also noted. Melt sheets are generally anastomosing, frequently bifurcate and interconnect. Once formed, melt networks typically persist throughout numerous heating cycles, although some features, especially those adjacent to the edges of the sample volume, disappear during progressive heating, implying melt drainage from regions of the sample. There is evidence for extensive horizontal and vertical movement of melt, with other sheets forming at oblique angles to the axis of compression. Locally, at terminations of sheets there is also evidence for melt ponding. Toward the bottom of the sample volume the dominant features are thinner melt bands, typically vertical to near vertical (Figure 4). Limitations in resolution (at best several microns) mean that larger melt channels are easier to detect in in-situ data, and there could be additional, extensive melt migration through much smaller melt features which would not be detected in this dataset. Changes in texture between later heating cycles are much less obvious, and consistent with the slow drainage of melt from the sample, accumulation of melt at the bottom and edges of the sample volume, and loss of melt to other parts of the sample assembly, largely through pre-existing melt channels/sheets.
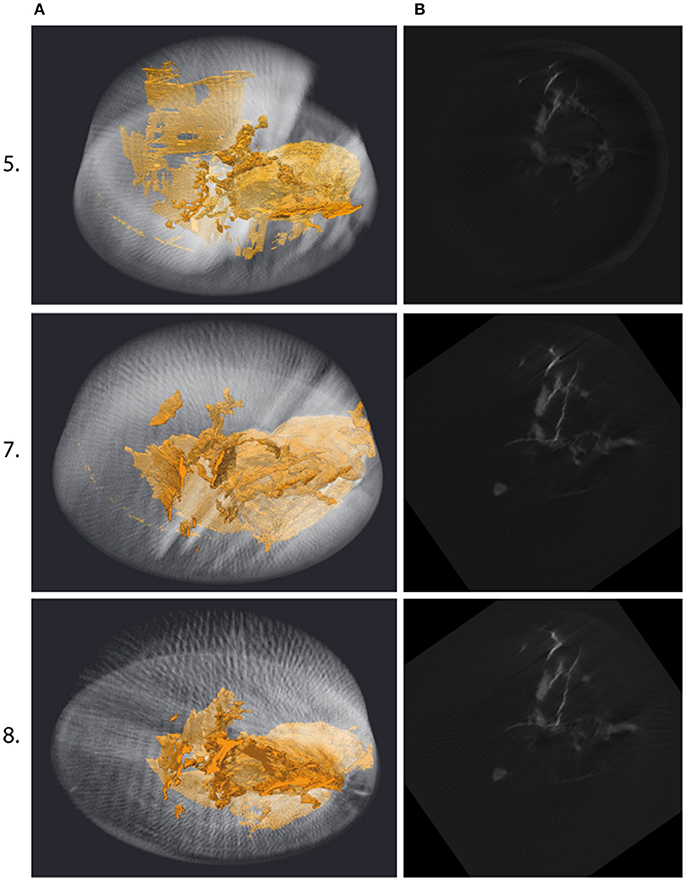
Figure 4. (A) Whole volume renderings for scans 5, 7, and 8 (shown in Figure 3) oriented to show a basal perspective of the sample volume. Au melt shown in gold, and h-BN capsule in transparent white for reference. mm-wide, 101 μm thick melt sheets with a vertical to near vertical orientation are evident. (B) Corresponding 2D reconstructions from close to the base of the sample volume, showing both permeating melt sheets (fuzzy white) and linear fracture-like sheets. Numbers on vertical axis refer to scan numbers. There is a significant change between scans 5 and 7 due to extensive melt accumulation at the base of the capsule, and some melt loss out of the sample volume. Several melt features evident in 5 are absent in 7, presumably as melt has drained away. In contrast, there is minimal evidence for additional fracturing between scans 7 and 8, as discussed in the main text.
Radiographic movies demonstrate both larger scale, faster horizontal and vertical melt migration events early in heating cycles (Figure 5), and smaller scale movements later in heating cycles (Figure 6). Figure 5 shows a series of stills collected over the first 160 s of the final heating stage of the experiment. px-p0 images show clear evidence for considerable lateral movement of melt through an undulating melt network, resulting in rapid accumulation of a large volume of melt toward the outer edge of the h-BN capsule. After this period of rapid melt migration, changes in melt distribution are considerably reduced, as shown in Figure 6. Variations between px-p0 images are much reduced, allowing smaller, active melt channels, especially those resulting in localized variation in attenuation, to be readily identified. Two such discrete movements, M2 and M3, are labeled in Figure 6, on images where melt migration was first observed. Melt migration velocities can be determined by tracking melt movement along fractures between projections at fixed time intervals, as shown in Figure 7. Melt velocities are not constant, and even accounting for scatter, show changes in velocity. This mirrors more obvious changes in melt migration velocities observed during larger scale melt migration processes. Figures 8, 9 show examples of how melt migration events can be matched in radiographic projections and tomographic reconstructions to constrain melt migration velocities. Correlation of 2D radiographs and 3D tomographic reconstructions works best for these smaller scale movements due to complexities in melt networks. The absence of changes in fracture geometry between scans obtained before and after this heating cycle also implies that these movements utilized pre-existing melt flow channels, or planes of weakness. As such, extracted velocities constrain inherent timescales of melt migration and percolation, as opposed to timescales of melt sheet developed through, for example, some hydraulic fracturing process.
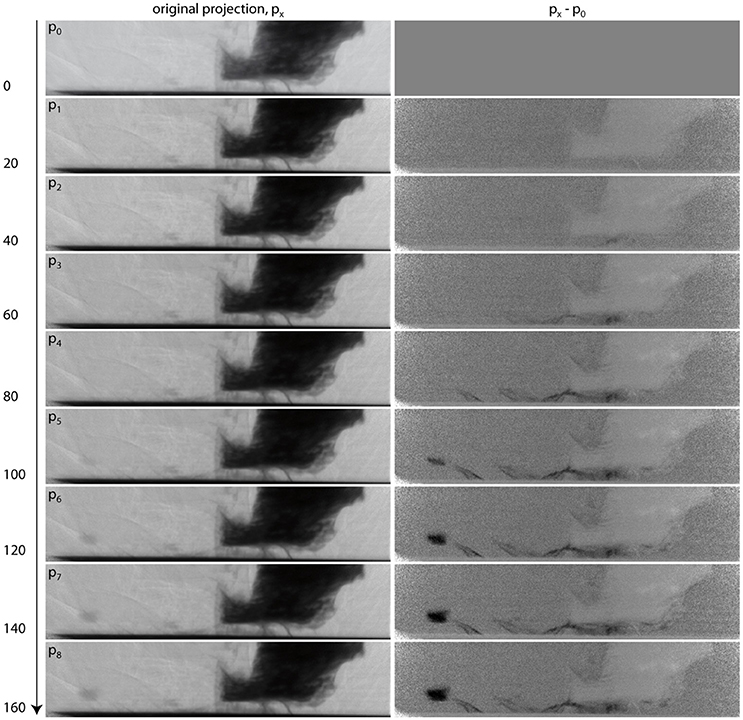
Figure 5. Radiographic projections highlighting Au melt movement during the final heating stage of the experiment. Vertical axis shows total time in s. Left: original projects, Right: projection minus initial projection to highlight changes in the sample volume. Black regions represent increases in attenuation due to accumulation of Au melt, most noticeable in the meandering horizontal melt channel and melt “pocket” toward the bottom the sample volume. There is a corresponding decrease in attenuation in the central melt area due to outward migration of Au melt. After 160 s (to final image) no further significant changes were noted in the sample for a further 5 min.
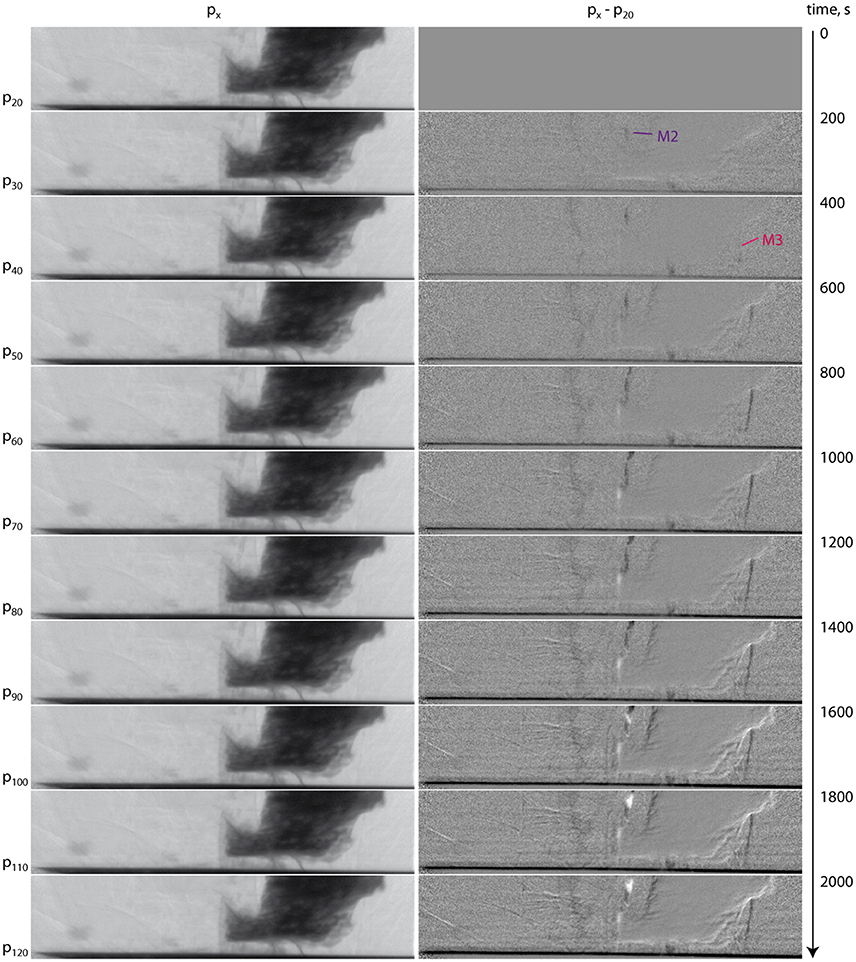
Figure 6. Series of radiographic projections capturing melt migration during the same heating cycle as shown in Figure 5. The initial reference frame for px-p0 images (right hand side) is p20 to highlight changes later in the heating cycle. Only every 10th frame in the movie is shown here to highlight slower changes in melt geometry. Discrete melt movements M2 and M3 are labeled on projections where a change is first observed. Further melt movement occurs to the left of M2 through a sub-vertical melt channel/vein, although the orientation of this relative to the 2D plane makes it harder to track motion effectively. Changes across the whole sample in px-p0 projections, including clearer definition of central melt volume, are due to slight compression of the sample during prolonged heating.
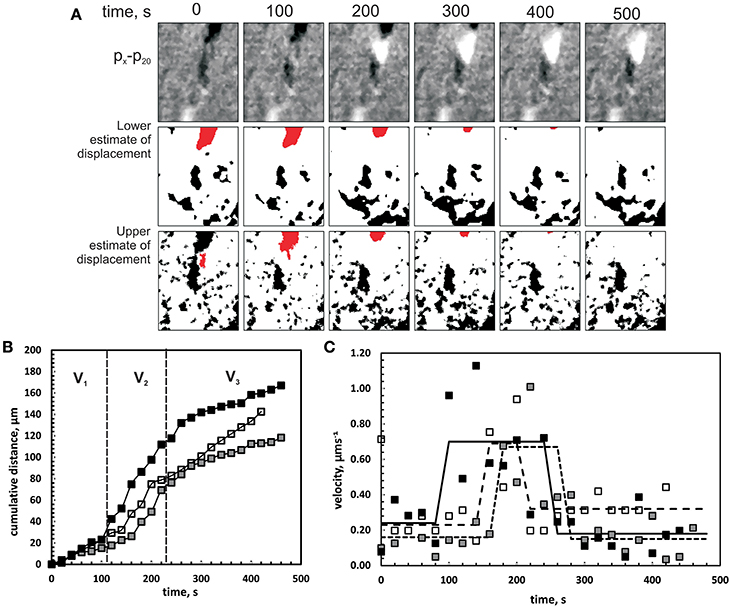
Figure 7. Example of melt motion tracking of event M2 by image analysis of 2D radiographic projections. (A) Series of stills showing motion of interest over a time interval of 500 s. Top: grayscale px-p20 images highlighting melt movement. Image filtered using ImageJ “remove outliers” function to reduce noise. Middle: Same image thresholded at minimum grayscale estimate, and Bottom: at maximum estimate, with melt volume of interest highlighted. (B) Time-displacement graph of tracked lower left pixel from the melt volumes in (A) for three threshold values (Black squares: 130, Open squares: 125, Gray squares: 119). Although the overall displacement varies for each valued used, the overall trend of the data is similar, revealing marked changes in apparent velocity, shown here as three fields, V1 to V3. (C). Determined velocities based on (B) for the threshold values used. Averaged velocity for each is also shown (Solid: 130, Dashed: 125, Dotted: 119). Although there is scatter in the dataset, averaged velocities are relatively consistent for different thresholds, with minor differences only in the timing of changes in melt velocity.
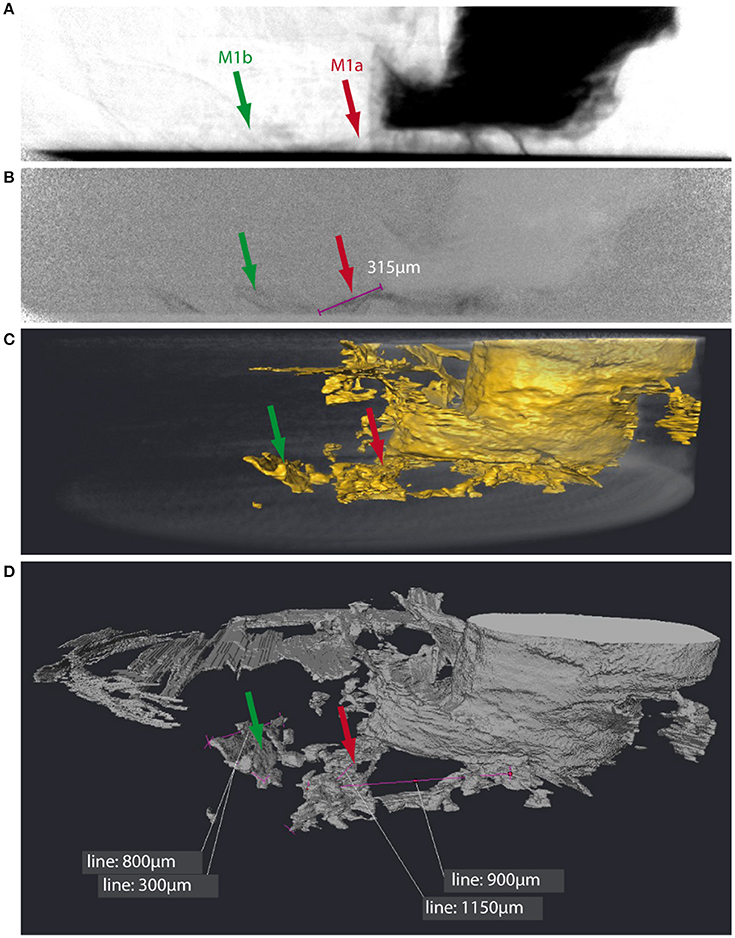
Figure 8. Matching melt migration observed in 2D radiograms to 3D tomographic reconstructions of the existing fracture network. Panels (A,B) are radiographic projections (px) and difference projections (px-p0), respectively, from the time series shown in Figure 5, with areas of interest marked, representing an episode of melt movement, and estimated distance for the minimum path length the melt has taken based on 2D images, shown in purple. This movement occurred between two projections (i.e., <20 s). (C) 3D reconstruction of the sample after heating, with arrows indicating end points for melt movement. (D) Measurements made using Avizo Fire™ “3D Measure” tool showing estimated displacement of paths taken along the 3D fractures (voxel size ~2.8 μm). Due to partial volume effects and image artifacts, which reduce the certainty of segmentation, distances are measured to the nearest 50 μm (i.e., ±10 voxels). Width of offset cylindrical melt region is 0.5 mm, for scale.
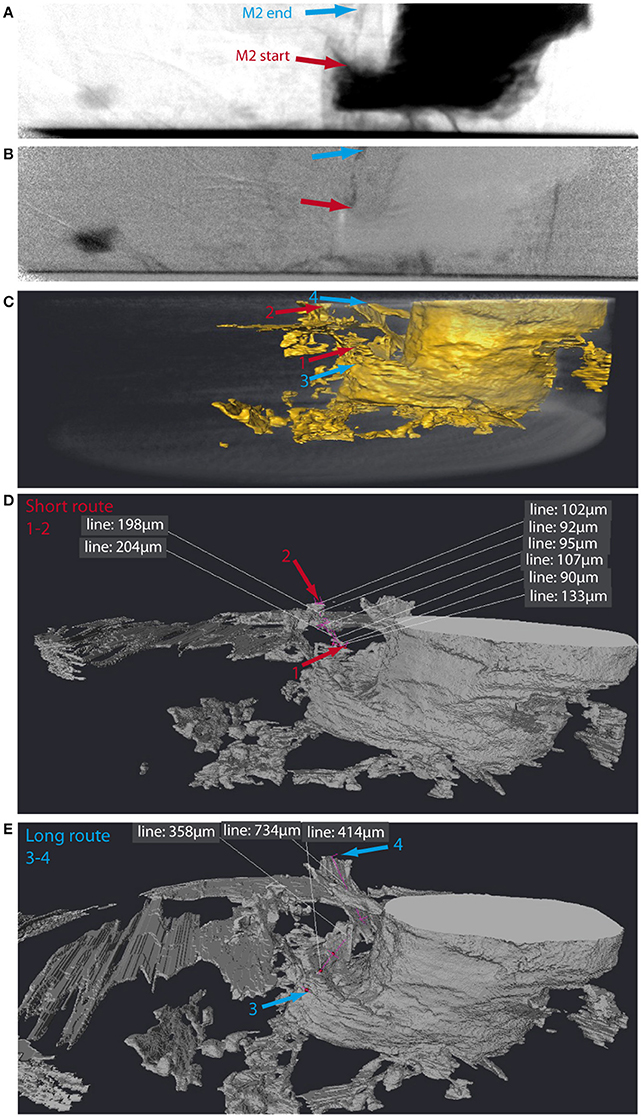
Figure 9. Matching melt migration event M2 in 2D radiographs to 3D tomographic reconstructions. (A) An example of an original radiographic projection (p70), with approximate start and end positions for the observed melt movement labeled (from Figure 6). (B) Image p70-p0 highlighting melt movement in the projection. (C) 3D tomographic reconstruction. In this instance it is more difficult to identify the exact melt channel as there are multiple possibilities, i.e., start and end positions. Estimates of the shortest and longest routes are shown. In this case, 2D radiography shows good evidence for melt movement along a pre-existing fracture network. (D) Measurements of the shorter route between start and end locations, with an intermediate, slightly more convoluted route (mid-estimate). (E) Measurements of the longest estimated route from the sample middle (3) to the edge of the field of view.
For melt migration events, complexities in the melt structure meant that a number of possible flow paths could be identified which might represent the true melt path observed in 2D radiographic images. In each case, maximum, minimum, and most likely melt displacements were determined. These estimates are shown in Table 1. Velocities determined in 3 well-constrained, distinct events, 0.6–60 μm.s−1 (or 0.1–5 m.hr−1) are comparable to those in other small scale melt events throughout the sample which are more difficult to accurately constrain. Estimated velocities from events such as the protracted, large scale horizontal redistribution of melt shown in Figure 5 are at least one order of magnitude faster. Therefore, velocities vary by 2–3 orders of magnitude.
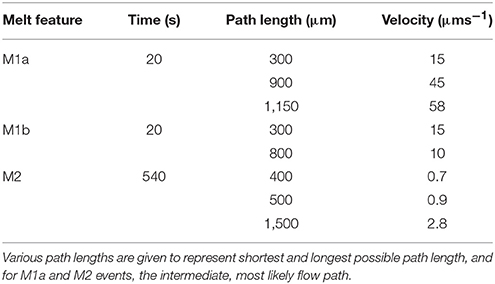
Table 1. Melt velocity estimates for Au melt in identified fracture planes.
Metallic Melt Migration Processes in Various Systems
As h-BN contrasts markedly from silicate materials which constitute the interiors of rocky planets such as Earth, it is important to demonstrate that data obtained here is of use in constraining core-forming processes in the inner solar system. Optical and SEM images of run products (Figure 10) can be used to compare melt networks in Au melt-h-BN and Au melt-MgO systems to Fe-rich melt in silicate. The in-situ and h-BN piston-cylinder experiments showed comparable textures (Figures 10A,B). h-BN used in these experiments was very fine-grained (≈1 μm diameter equant grains). Au melt characteristically formed extensive, undulating, but approximately planar melt sheets around 10 μm thick, but up to 100 s μm wide. Melt sheets were horizontal to sub-vertical, and allowed melt to readily migrate to the edge of the capsule and pool against graphite furnaces. In melt-rich regions of samples there was additional formation of melt networks resulting from extensive wetting of h-BN grain boundaries. Successive heating cycles resulted in more extensive melt migration away from the capsule center (original melt-rich region), although planar melt networks were well-developed in all samples.
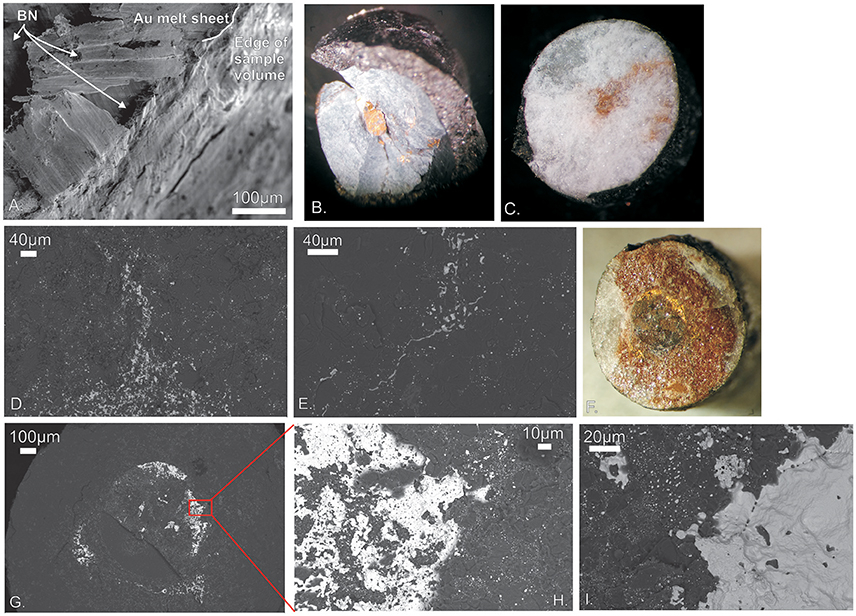
Figure 10. (A). Secondary electron image showing extensive Au melt sheet(s) in h-BN outer capsule. These sheets (100 s μm wide and long, but a few μm thick) acted as conduits for Au melt to leave the capsule center (melt-rich region) and pool at the interface between the h-BN and furnace. (B) Magnified view of same sample, showing that most Au is retained in the capsule center, but that there are meandering melt sheets through the outer h-BN capsule and accumulation of melt adjacent to the graphite furnace (black). (C) Section across center of MgO capsule. Texture is different to experiments with h-BN, with Au melt forming extensive melt networks permeating through the coarser-grained MgO capsule, and far fewer broad melt channels. (D). Back-scatter electron image (BSE) showing Au melt (light gray) in MgO matrix (dark gray) in same sample, showing interconnected Au in the center of the sample (bottom) and an interconnecting melt channel extending upwards. Trapped melt is also present in the surrounding MgO. Au melt loss from the capsule, and accumulation adjacent to the furnace, was also noted. (E) BSE image of part of same sample, showing thin Au melt channel wetting MgO grain boundaries. Grain size in MgO is ~10 μm (compared to <1 μm in h-BN). Pockets of Au melt show typically high dihedral angles in MgO. Submicron blobs of Au melt along grain boundaries represent trapped (residual) melt. (F) Magnified image of Au in MgO experiment with a higher fraction of Au melt in the capsule center (75%). Extensive staining of the surrounding MgO capsule is evident, along with some Au melt sheets. Au melt migrated horizontally and vertically, including into the alumina spacers above and below the capsule. (G) BSE image of same sample showing Au melt (white) in MgO, forming extensive sheets at the boundary between the inner and outer capsule. Higher magnification image (H) shows that brown coloration in (F) is due to submicron blobs of residual Au trapped at grain boundaries. These represent trapped residual melt in dried up melt networks, which mainly transported melt vertically through the sample volume. (I) Similar texture showing extensive Au melt sheet with high dihedral angle in polycrystalline Al2O3 in BSE image of the bottom spacer adjacent to the MgO capsule; once again, fine blobs of Au are interpreted to be residual melt.
Experiments performed using MgO capsules produced different textures. Optical examination revealed that Au melt had permeated extensive volumes of the MgO capsules, and even Al2O3 spacers placed adjacent to the capsule, resulting in an obvious gold/brown discoloration (Figures 10C,F). SEM images demonstrate that this is due to: (1) extensive grain boundary wetting and formation of meandering melt networks, and (2) Au melt trapped in grain boundary regions representing melt-drained regions of the sample, i.e., residual Au melt (Figures 10D,E). Au melt moved horizontally into the surrounding MgO, but also vertically. Melt sheets were noted in regions of very high melt fraction (Figures 10H,I), with sheets tending to be sub-horizontal. Additional experiments were performed varying Au melt fraction in the capsule center from 1:3 to 3:1. At high melt fractions, melt sheets were more likely to develop, comparable to sheets seen in h-BN.
In both MgO and Al2O3 there is a clear influence of matrix grain size on texture (Figure 11). Au melt pockets size scales with matrix grain size, implying that grain boundary wetting is the main process for melt migration. In addition, the fraction of trapped melt in fine grained regions is higher due to the higher volume fraction of grain boundaries. Melt trapped in finer grained regions is typically present as nm-sized spherical “blobs” in contrast to the well-defined melt pockets present in coarser grained regions (Figure 11). This might indicate that Au melt more readily migrated through finer-grained material, an interpretation supported by visual examination of recovered run products. The low volume fraction of Au in melt drained regions of samples is consistent with Ghanbarzadeh et al. (2017); as hypothesized, percolative flow can effectively drain melt from the solid matrix, leaving a much lower melt fraction than would be estimated from a critical melt threshold based on dihedral angles.
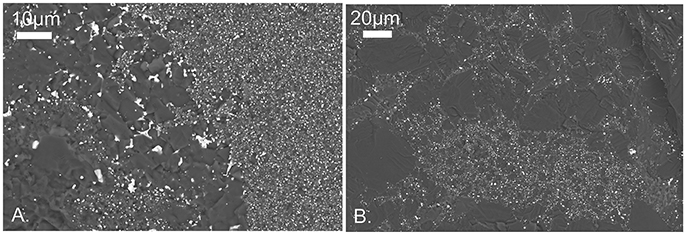
Figure 11. The effect of grain size on melt fraction and distribution. BSE images showing distribution of Au melt in Al2O3 (A) and MgO (B). In both materials, melt is confined to grain boundary regions, and has largely drained away to leave disconnected melt. In coarser matrices, melt blobs are larger and better defined. In adjacent regions of the same sample, melt is sometimes at high enough fractions to form interconnected channels. In fine-grained (submicron) regions, melt fraction appears higher, presumably due to higher volume fraction of grain boundaries, although trapped melt is only present as submicron, spherical blobs, and no melt channels remain.
Melt migration by extensive grain boundary wetting, and brittle-type fracturing resulting in planar-type melt sheets, have both been observed in analog experiments performed in the system FeS melt +polycrystalline olivine (Berg et al., 2017). In that study, torsional deformation was used to constrain the influence of strain on grain boundary wetting at very low melt fractions. This contrasts with the present study where high melt fractions promoted development of melt networks. Berg et al. (2017) noted that fracturing occurred readily at higher strain rates in the FeS-olivine system, although fractures are limited in extent compared to the Au + h-BN experiments, and extend only a few 10 s of μm across a small number of olivine grains. In most of the experiments of Berg et al. (2017), performed at lower strain rates, grain boundary migration dominated. Although there is a clear influence of grain size, it is apparent that brittle fracturing and melt sheet formation is more prevalent in the analog h-BN experiments, and grain boundary wetting more prevalent in other analog materials (Au melt in MgO and Al2O3, FeS melt in olivine). Figure 12 highlights the differing nature of these two processes. For grain boundary migration, channels connect melt pockets trapped at grain junctions. For all analog core-forming experiments described here, wetting angles of the melt are characteristically high, which means that melt interconnectivity can only proceed at melt fractions above the critical melt threshold (here) or during deformation (Berg et al., 2017). As such, grain boundary regions have a dominant influence on melt migration and textural development. In contrast, hydraulic fracturing results in formation of planar melt sheets which indiscriminately cut across grain boundaries and grain centers.
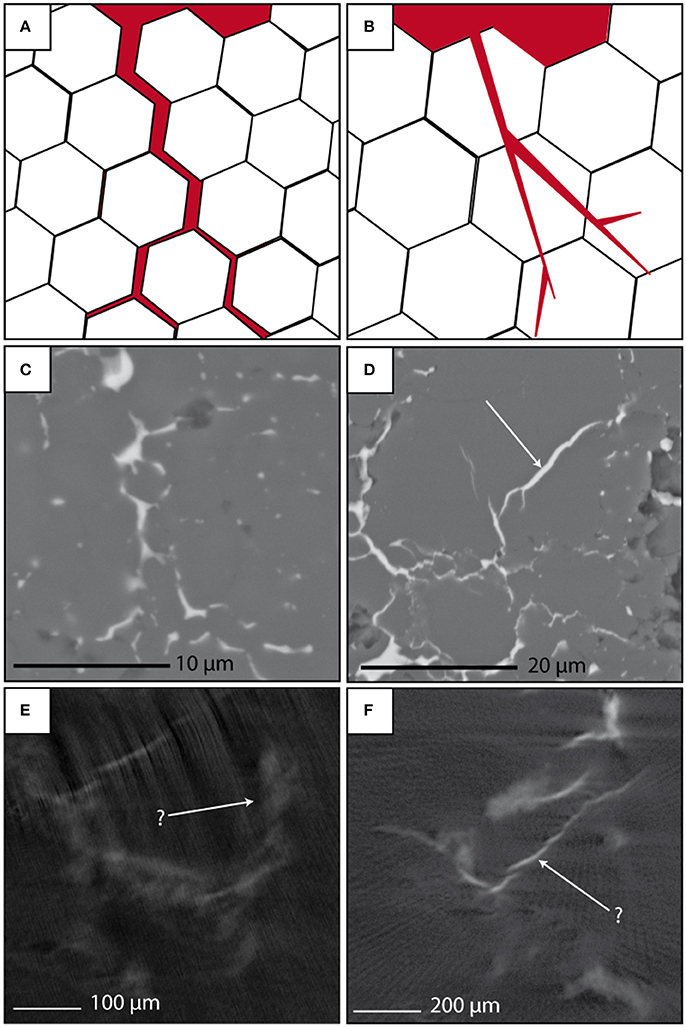
Figure 12. End-member mechanisms for migration of metallic melt in polycrystalline material under extreme P-T conditions. (A) Formation of melt channels (red) by grain boundary wetting (grains pried apart; dominant influence of grain boundaries). (B) Melt migration by fracture propagation (grains fractured, with little influence of grain boundaries). Panels (C,D) show formation of melt channels/sheets by both processes in the system FeS melt-olivine (Berg et al., 2017) in deformation experiments at extreme P-T. In these experiments, fracturing becomes dominant at higher strain rates, while grain boundary migration dominates at low strain rates, although fractures in the olivine matrix are typically a few 10 s of μm in length at most and cut across a small number of olivine grains, as opposed to the (typically) extensive sheets noted in au + h-BN experiments. Panels (E,F) show comparable features in the present tomographic data set (Au melt in h-BN) observed in tomographic scans. More diffuse, poorly defined, regions of increased attenuation are interpreted as extensive wetting of grain boundaries, while hydraulic fracturing produces well-defined, planar features.
Experiments demonstrate that: (1) Au melt moves relatively quickly through polycrystalline h-BN even at extreme PT conditions, despite the high interfacial tension and inferred low mobility of Au melt; (2) The dominant process for rapid Au melt migration appears to be hydraulic fracturing and the development of melt sheets, rather than grain boundary migration, especially during the first heating stage on the in-situ (h-BN) experiment, or early stages of later heating cycles; (3) however, later in heating cycles, it is possible to extract data on melt migration rates in pre-existing melt networks; melt migration rates determined here are nevertheless relatively fast, of the order of microns to tens of microns per second; and (4) it is clear that melt migration is episodic, with periods of rapid melt mobility interspersed with longer periods of quiescence, during heating cycles.
Driving Forces for Melt Migration
Melt in the in-situ experiment is observed to move through pre-existing fractures at rates of ~10−6 to 10−5 ms−1. Gold melt is expected to have low mobility due to its high surface tension and high dihedral angle of 145° in cubic h-BN (Ricci and Novakovic, 2001). Melt movement observed can be modeled using a simple Darcy's flow calculation for sheet flow along a single planar fracture (i.e., cubic law) of the form:
where q = advective velocity, ρl = density of melt, w = fracture aperture, μ = melt viscosity and δh/ δL is the hydraulic gradient. h is the hydraulic head, which can be expressed as a combination of the elevation head (z) and the pressure head (P/ δg), defined as h = z+P/δg. At high T but ambient P, μ for Au melt is estimated at 0.04 Pa.s (Ofte, 1967), and ρl at 17,310 kgm−3. L can be taken as ≈0.001 m, and z ≈ 1 mm. If flow of Au melt is produced simply as a result of change in elevation (i.e., P/δg = 0), q is calculated to be of the order of 10−12 ms−1, at least 6 orders of magnitude lower than observed. This calculation ignores factors such as fracture roughness, and fracture tortuosity, which may both reduce flow rates; regardless, it is clear that an additional driving force is required, especially as this mechanism would also not explain horizontal melt movement.
By varying values of δP, the hypothetical fluid overpressure required to produce melt migration on the order observed can be estimated over a range of feasible aperture values, giving a range of solutions of 0.001–5 MPa. A factor which could act as a driver for melt migration is fluid over-pressurization as a result of a phase change, i.e., melting of the Au during the initial stages of each heating cycle. Assuming that the h-BN matrix is relatively incompressible, the overpressure will be equivalent to the pressure difference, dP, between the pressure required to compress the liquid from its theoretical density at atmospheric P, ρl, to the density of the solid state ρls, and the background confining pressure, Pc:
where KT is the bulk modulus and Δρ the difference in density between solid and liquid states. Assuming ρs for Au is 1.93 × 10⁵ kgm−3, ρl is 17310 kgm−3 and the bulk modulus of liquid gold is 63 GPa at 1,600 K (Steeb and Bek, 1976; Blairs and Joasoo, 1980), and taking into account a 3 GPa pre-existing confining pressure, the overpressure associated with Au melting is ~3 GPa. This drops to 2 GPa when considering that gold in the central volume of the capsule is mixed with h-BN in a ratio of 1:3 (density 2,100 kgm−3), but is still several orders of magnitude higher than that required to cause flow at the velocities observed, for apertures of 1–20 μm.
If overpressure due to melting was the sole cause of melt migration, melt movement in all directions through the outer capsule might be expected. Melt channels in varying orientations are observed, although there appears to be a preference for melt to move sub-vertically at the bottom of the sample volume. This could indicate an additional gradient encouraging melt flow in certain directions. The density difference between h-BN and Au is large (≈15,000 kgm−3), which will create a subtle melt gradient, although the driving force is much lower than that of fluid overpressure. More likely, a thermal gradient may be present within the sample volume, undetermined but probably of the order of tens of K or more; thermal gradients have previously been inferred to result in significant melt movement in other partial melt, high PT experiments (Lesher and Walker, 1988).
Large fluid overpressure in the Au melt-h-BN system explains why brittle fracturing was observed during heating cycles, especially immediately after melting. Conversely, prior to each heating stage, compression of the sample volume is consistent with plastic deformation, as is gradual shortening of the sample throughout the experiment as melt migrates away from the inner capsule. Brittle processes occurring at high PT conditions have been observed in other experimental studies, both from observed microstructures (Dellangelo and Tullis, 1988) and from in-situ acoustic measurements (Dobson et al., 2002). Observations in real rock exposures show ductile fabrics, implying high PT conditions, overprinted with evidence of contemporaneous brittle fracturing by melt. These can be explained by the process of “melt-enhanced embrittlement” (Davidson et al., 1994), again linked to overpressure created by melting. Brittle processes are thought to occur when fluid/melt overpressure is higher than can be relieved by percolative flow along grain boundaries. As such, the process is more common in low permeability systems, and would be expected to occur here where the melt is a large volume of high surface-tension liquid, where flow along grain boundaries is limited, and where significant overpressures can build up. Differences between textures in h-BN (grain size ≈ 1 μm or smaller) and MgO/Al2O3 (grain size ≈ 10 μm) suggest an influence of grain size on textural development. Within MgO and Al2O3 there is a significant control of grain size on melt textures, with increased melt trapping (i.e., less drainage of melt) and significantly reduced thickness of melt channels/sheets in fine-grained regions. Thinner melt bands in finer grained h-BN could inhibit percolative flow, and enhance hydraulic fracturing.
In-situ radiographic projections provide evidence for rapid movement of melt early in heating cycles, predominantly due to hydraulic fracturing, but also smaller scale, slower melt migration later in cycles due to melt movement along pre-existing fractures. It is also clear that later melt migration processes are episodic, implying that the mechanism driving these processes allows melt migration to cease along fractures, for overpressure to build up, and for renewed phases of melt migration to occur in a cyclic pattern. For a simple melt overpressure model, as melt flows through the h-BN matrix, overpressure is released and the driving force for melt migration reduced, eventually resulting in a cessation in flow. Episodic flow would only be possible if there was a mechanism for repeated freezing and re-melting of Au. This type of process is observed in nature, for example during dyke emplacement, as observed by correspondingly highly episodic seismic tremors [White et al. (2012) and references therein]. The majority of laboratory and field studies conducted suggest that refreezing of dyke tips is the cause of such episodicity, due to the dyke propagating along a fracture, freezing against cold rock, slow build-up of overpressure, then a renewed episode of fracturing (Ozerov et al., 2003; White et al., 2012). In experiments here, the matrix and melt will remain in thermal equilibrium, and melt freezing is not applicable. Pressure changes could, in theory, result in solidification of melt. However, at 3 GPa, 1,400°C, an increase of 3 GPa would be required to induce solidification, which appears unlikely.
However, episodicity of melt migration can be explained without invoking localized solidification. The following calculation expresses the overpressure required to keep a fluid-filled crack expanding and flowing (Lister and Kerr, 1991):
where μ = shear modulus, v = Poisson's ratio of the material, w = aperture thickness, and l = the shorter of the other two fracture dimensions. For a fracture in polycrystalline h-BN, μ ≈ 300 GPa, v ≈ 0.17 (Green et al., 1976), the overpressures required are of the order of several GPa. As the overpressure on melting will be released once fluid flow is initiated, fractures will not remain dilated beyond initial melt movement, and are likely to seal. High interfacial tension of remnant melt in narrow fracture entrances may also act to seal existing flow paths, without solidification of melt. A mechanism is then required to recharge fluid overpressure and create renewed flow. As seen by the physical movement of the anvils, the sample assembly was constantly shortening during heating cycles. As melt and solid compress at different rates, continued compression will lead to re-pressurization of the melt-rich central capsule volume. The cycle of episodicity could be produced by fracturing due to volume changes on melting, a fall in fluid pressure halting flow and resealing of fractures, followed by later, more restricted, episodic fluid flow due to renewed build up resulting from uneven compression of the sample assembly, to levels required to force melt back through pre-existing fractures. This model implies that overpressure of secondary melt migration events may be significantly lower than the original hydraulic fracturing event, leading to lower fluid flow velocities, consistent with observations made during several heating cycles. This implies that the slower movement seen during in-situ experiments provides a meaningful assessment of melt migration velocities. As such, data on Au melt migration velocities in h-BN determined here are independent of the original mechanism for promoting development of melt networks, fast melt injection of melt associated with over-pressurization during melting. The key point here is that we constrain migration velocities through pre-existing melt networks, independent of the mechanism for initial melt network development and channelization.
Melt Migration Velocities in Experimental and Natural Systems
In contrast to experiments performed here, Philippe et al. (2016) failed to note any evidence for Fe-S melt migration in polycrystalline olivine. In that study, a significantly lower melt fraction was used, which could explain the lack of a driving force, such as overpressure, for melt migration. Furthermore, although volume expansion of Fe-S on melting is higher than Au, the higher compressibility of Fe-S, as a volatile-bearing melt, means that potential overpressures during the phase change are lower. Using Equation (2), assuming a central melt-rich zone of 20% FeS + 80% olivine, and using data for FeS from Urakawa et al. (2001), the pressure difference upon FeS melting at around 2 GPa is approximately −1 GPa. Even if the center of the sample was 100% melt, the FeS melt overpressure would only be 0.1 GPa, an order of magnitude lower than in Au melt experiments. As such, the only driving force for melt migration outwards in the experiments of Philippe et al. (2016) is non-hydrostatic stress and a small thermal gradient. Rushmer et al. (2005) estimated that shear deformation in partially molten systems, at strain rates of 10−5 to 10−6 s−1, will produce differential stresses within individual melt pockets on the order of 0.1–100 MPa, several orders of magnitude lower than overpressures produced here by melting of Au. As such, differential stresses are unlikely to cause fracturing observed in Au melt experiments. However, melt overpressures arising from deformation may still act to cause fluid flow into grain boundaries. Assuming differential stress is the only driving force for melt migration, velocities calculated using (1) for flow along planar sheets into grain boundaries of around 0.1 μm (consistent with observations in Berg et al., 2017), are on the order of 10−11 to 10−9 ms−1. This corresponds to melt migration distances of the order of 0.1–10 μm for an hour long heating cycle. Whilst this is consistent with observations from Berg et al. (2017), who described melt channels of 10s−100s μm in length for heating/deformation experiments lasting several days, time constraints for in-situ experiments, and resolutions in tomographic scans of the order of μm mean that comparable experiments designed to determine migration velocities of Fe-S melt may be challenging to perform. Furthermore, unless experiments were designed with a large pressure/temperature/stress gradient, there is no clear driving force to encourage significant melt migration.
An additional factor affecting melt migration, and textural development in partially molten, core differentiation analog experiments, is the physical dimensions of melt channels. Melt channels/sheets formed by hydraulic fracture during the in-situ experiments are typically a 1–10 μm in diameter. Flow rate, according to (1), is proportional to the cube of aperture size, which allows us to assess the effect of melt textures on measured flow rates. Melt channels/sheets/networks which develop in other analogs systems, such as in polycrystalline MgO and Al2O3, or during deformation of Fe-S + olivine, are typically an order of magnitude smaller. This implies flow rates through these finer melt networks around 3 orders of magnitude slower than in Au melt- h-BN experiments, or 6 × 10⁻⁴ to 6 × 10⁻² μms−1. For a 1 h heating cycle, this would imply melt movement of distances between ~2 and 200 μm. This comparison assumes that melt migration velocities for Au melt and Fe-S, within different matrices, are comparable. However, melt migration distances of 2–200 μm are consistent with visual observations of longer duration ex-situ experiments performed here, in which Au melt migrated outside of the entire sample volume, and observations of Fe-S migration in longer annealing/deformation studies (Berg et al., 2017), where submicron melt bands permeate 100s of μm after annealing times of several days. This latter observation is important, as it demonstrates that melt migration velocities obtained here, for Au melt in h-BN, are comparable with studies in more realistic analog core-formation systems, such as Fe-S in olivine, validating the analog system used in this study. It also demonstrates that scaling given in (1) is sufficient to extrapolate data to different systems, where mechanisms for melt network development differ. Scaling the range of melt migration velocities (2–200 μm.h−1) observed for FeS melt in olivine in submicron to micron-wide melt sheets to planetary scales implies that core-forming melts can migrate the radius of the Earth over timescales of 40 Myr to 4 Gyr. This lower end estimate is within the 10s Myr constraint for core formation within the Earth. However, core-forming melt segregation from solid silicate through micron-sized melt networks is likely only the initial stage of differentiation through percolation. Progressive percolation will result in increased channelization of melts, and formation of melt-rich bands (e.g., Hustoft and Kohlstedt, 2006). These 1–10 μm melt bands would permit crust to core melt migration in 4 Myr, even given the lowest measured melt migration velocity determined here. Alternatively, Fe-S melt migration velocities calculated above from (1), assuming differential stress as a driver for melt movement through an olivine matrix, can be used to independently estimate timescales for core segregation. For submicron melt channels, this method predicts core formation via percolation of the order of 2 Gyr timescales. However, this reduces to 2 Myr for micron sized melt channels, consistent with timescales estimated from Au melt analog experiments. As such, metallic melt migration velocities determined here are consistent with a significant role for percolation, prior to silicate melting, in early core-formation and planetary segregation in rocky planets and smaller bodies.
Similar textures to those noted in Au and Fe melt percolation experiments have been observed in achondrite meteorites, and used to infer melt flow in the interiors of planetesimals. McCoy et al. (2006) noted both Fe infilled fractures (presumably developed due to over-pressuring or internal deformation) and pervasive Fe wetting of silicate grain boundaries in melt-poor regions of the meteorite GRA 95209. Chen et al. (2002) noted extensive Fe-S melt injection into shock fractures in the Sixiangkou meteorite, but also presented textural evidence for melt filled fractures and wetting of silicate grain boundaries in regions adjacent to shock veins. As such, both textural and geochemical (Mare et al., 2014; Barrat et al., 2015) evidence from meteorites suggests that percolation contributes to redistribution of Fe-rich melts in parent bodies (large asteroids or planetesimals). Experimental studies demonstrate that percolation is a viable mechanism for Fe-melt segregation, and therefore, core segregation, under various conditions (Bruhn et al., 2000; Terasaki et al., 2008; Shi et al., 2013; Berg et al., 2017). Modeling work further demonstrates that once initiated, percolation can efficiently drain Fe-melt from solid silicate to low melt fractions. Results here now suggest that percolation can result in rapid Fe-melt segregation, consistent with the timescales for core formation in the early solar system. Work is required to determine exact mechanisms for Fe-S melt percolation in silicates, how these vary as a function of composition, pressure, temperature and stress, and corresponding melt migration velocities. However, it is clear that the contribution of percolation to core formation in Earth and other terrestrial bodies needs to be considered. The assumption of one-stage, full core-mantle chemical equilibration at the base of a terrestrial magma ocean is overly simplistic; more likely, core formation was a multi-stage, protracted process which will have left a more complex geochemical signature on terrestrial reservoirs.
Author Contributions
MB conducted most of the data analysis presented as part of her Ph.D. project. GB supervised the project, devised the experimental programme with MB, and conducted ex-situ experiments. YL assisted with in-situ experiments and helped design and machine the sample assemblies. MM, J-PP and JP both assisted with the in-situ experiment and initial interpretation of results during the experiment, and MM led modifications of the ID27 beamline to allow installation of the RoToPEc press and integration with beamline software. NP conducted SEM analysis of recovered run products. GB and MB wrote this manuscript, and other authors contributed to preparation of the final draft.
Funding
The Ph.D. studentship of MB was supported by the University of Edinburgh (Principal's Career Development studentship) and the National Environment Research Council NE/I016333/1. GB acknowledges additional funding support from the School of GeoSciences, University of Edinburgh. We acknowledge the European Synchrotron Radiation Facility for provision of synchrotron radiation facilities.
Conflict of Interest Statement
The authors declare that the research was conducted in the absence of any commercial or financial relationships that could be construed as a potential conflict of interest.
Acknowledgments
We are grateful to Frederic Bergame, Stany Bauchau, and other staff at the ESRF for providing assistance, and for comments and suggestions of the two reviewers, which improved this manuscript considerably.
References
Abramoff, M. D., Magelhaes, P. J., and Ram, S. J. (2004). Image processing with imagej. Biophotonics Int. 11, 36–42. Available online at: https://imagescience.org/meijering/publications/download/bio2004.pdf
Bagdassarov, N., Golabek, G. J., Solferino, G., and Schmidt, M. W. (2009a). Constraints on the Fe-S melt connectivity in mantle silicates from electrical impedance measurements. Phys. Earth Planet. Interiors 177, 139–146. doi: 10.1016/j.pepi.2009.08.003
Bagdassarov, N., Solferino, G., Golabek, G. J., and Schmidt, M. W. (2009b). Centrifuge assisted percolation of Fe-S melts in partially molten peridotite: Time constraints for planetary core formation. Earth Planet. Sci. Lett. 288, 84–95. doi: 10.1016/j.epsl.2009.09.010
Ballhaus, C., and Ellis, D. J. (1996). Mobility of core melts during Earth's accretion. Earth Planet. Sci. Lett. 143, 137–145. doi: 10.1016/0012-821X(96)00135-5
Barrat, J. A., Rouxel, O., Wang, K., Moynier, F., Yamaguchi, A., Bischoff, A., et al. (2015). Early stages of core segregation recorded by Fe isotopes in an asteroidal mantle. Earth Planet. Sci. Lett. 419, 93–100. doi: 10.1016/j.epsl.2015.03.026
Berg, M. T. L., Bromiley, G. D., Butler, I. B., Frost, M., Bradley, R., Carr, J., et al. (2017). Deformation-aided segregation of Fe -S liquid from olivine under deep Earth conditions: implications for core formation in the early solar system. Phys. Earth Planet. Interiors 263, 38–54. doi: 10.1016/j.pepi.2017.01.004
Blairs, S., and Joasoo, U. (1980). Sound-velocity and compressibility in liquid-metals. J. Inorg. Nuclear Chem. 42, 1555–1558. doi: 10.1016/0022-1902(80)80318-6
Bromiley, G. D., Nestola, F., Redfern, S. A. T., and Zhang, M. (2010). Water incorporation in synthetic and natural MgAl2O4 spinel. Geochim. Cosmochim. Acta 74, 705–718. doi: 10.1016/j.gca.2009.10.015
Bromiley, G. D., Redfern, S. A. T., Le Godec, Y., Hamel, G., and Klotz, S. (2009). A portable high-pressure stress cell based on the V7 Paris-Edinburgh apparatus. High Press. Res. 29, 306–316. doi: 10.1080/08957950902747411
Bruhn, D., Groebner, N., and Kohlstedt, D. L. (2000). An interconnected network of core-forming melts produced by shear deformation. Nature 403, 883–886. doi: 10.1038/35002558
Cerantola, V., Walte, N. P., and Rubie, D. C. (2015). Deformation of a crystalline olivine aggregate containing two immiscible liquids: implications for early core-mantle differentiation. Earth Planet. Sci. Lett. 417, 67–77. doi: 10.1016/j.epsl.2015.02.014
Chambers, J. E. (2004). Planetary accretion in the inner Solar System. Earth Planet. Sci. Lett. 223, 241–252. doi: 10.1016/j.epsl.2004.04.031
Chen, M., Xie, X. D., Wang, D. Q., and Wang, S. C. (2002). Metal-troilite-magnetite assemblage in shock veins of Sixiangkou meteorite. Geochim. Cosmochim. Acta 66, 3143–3149. doi: 10.1016/S0016-7037(02)00903-1
Craddock, P. R., Warren, J. M., and Dauphas, N. (2013). Abyssal peridotites reveal the near-chondritic Fe isotopic composition of the Earth. Earth Planet. Sci. Lett. 365, 63–76. doi: 10.1016/j.epsl.2013.01.011
Davidson, C., Schmid, S. M., and Hollister, L. S. (1994). Role of melt during deformation in the deep crust. Terra Nova 6, 133–142. doi: 10.1111/j.1365-3121.1994.tb00646.x
Dellangelo, L. N., and Tullis, J. (1988). Experimental deformation of partially melted granitic aggregates. J. Metamorphic Geol. 6, 495–515. doi: 10.1111/j.1525-1314.1988.tb00436.x
Dierick, M., Masschaele, B., and Van Hoorebeke, L. (2004). Octopus, a fast and user-friendly tomographic reconstruction package developed in LabView (R). Meas. Sci. Technol. 15, 1366–1370. doi: 10.1088/0957-0233/15/7/020
Dobson, D. P., Meredith, P. G., and Boon, S. A. (2002). Simulation of subduction zone seismicity by dehydration of serpentine. Science 298, 1407–1410. doi: 10.1126/science.1075390
Ghanbarzadeh, S., Hesse, M. A., and Prodanovic, M. (2017). Percolative core formation in planetesimals enabled by hysteresis in metal connectivity. Proc. Natl. Acad. Sci. U.S.A. 114, 13406–13411. doi: 10.1073/pnas.1707580114
Green, J. F., Bolland, T. K., and Bolland, J. W. (1976). Theoretical elastic behavior for hexagonal boron-nitride. J. Chem. Phys. 64, 656–662. doi: 10.1063/1.432257
Groebner, N., and Kohstedt, D. L. (2006). Deformation-induced metal melt networks in silicates: implications for core-mantle interactions in planetary bodies. Earth Planet. Sci. Lett. 245, 571–580. doi: 10.1016/j.epsl.2006.03.029
Gupta, G., and Sahijpal, S. (2010). Differentiation of Vesta and the parent bodies of other achondrites. J. Geophys. Res. Planets 115:E08001. doi: 10.1029/2009JE003525
Halliday, A. N. (2013). Earth science: small differences in sameness. Nature 497, 43–45. doi: 10.1038/497043a
Hevey, P. J., and Sanders, I. S. (2006). A model for planetesimal meltdown by Al-26 and its implications for meteorite parent bodies. Meteor. Planet. Sci. 41, 95–106. doi: 10.1111/j.1945-5100.2006.tb00195.x
Hustoft, J. W., and Kohlstedt, D. L. (2006). Metal-silicate segregation in deforming dunitic rocks. Geochem. Geophys. Geosyst. 7:11. doi: 10.1029/2005GC001048
Kleine, T., Touboul, M., Bourdon, B., Nimmo, F., Mezger, K., Palme, H., et al. (2009). Hf-W chronology of the accretion and early evolution of asteroids and terrestrial planets. Geochim. Cosmochim. Acta 73, 5150–5188. doi: 10.1016/j.gca.2008.11.047
Kleine, T., and Wadhwa, M. (2017). “Chronology of planetessimal differentiation,” in: Planetesimals: Early Differentiation and Consequences for Planets, eds L. T. Elkins-Tanton and B. P. Weiss (Cambridge, UK: Cambridge University Press), 224–225.
Kohlstedt, D. L., and Holtzman, B. K. (2009). Shearing melt out of the earth: an experimentalist's perspective on the influence of deformation on melt extraction. Annu. Rev. Earth Planet. Sci. 37, 561–593. doi: 10.1146/annurev.earth.031208.100104
Kruijer, T. S., Touboul, M., Fischer-Godde, M., Bermingham, K. R., Walker, R. J., and Kleine, T. (2014). Protracted core formation and rapid accretion of protoplanets. Science 344, 1150–1154. doi: 10.1126/science.1251766
Le Godec, Y., Martinez-Garcia, D., Mezouar, M., Syfosse, G., Itié, J.-P., and Besson, J.-M. (2000). Thermoelastic behaviour of hexagonal graphite-like boron nitride. High Press. Res. 17, 35–46. doi: 10.1080/08957950008200304
Lesher, C. E., and Walker, D. (1988). Cumulate maturation and melt migration in a temperature-gradient. J. Geophys. Res. Solid Earth Planets 93, 10295–10311. doi: 10.1029/JB093iB09p10295
Lister, J. R., and Kerr, R. C. (1991). Fluid-mechanical models of crack-propagation and their application to magma transport in dykes. J. Geophys. Res. Solid Earth Planets 96, 10049–10077. doi: 10.1029/91JB00600
Mare, E. R., Tomkins, A. G., and Godel, B. M. (2014). Restriction of parent body heating by metal-troilite melting: thermal models for the ordinary chondrites. Meteorit. Planet. Sci. 49, 636–651. doi: 10.1111/maps.12280
McCoy, T. J., Carlson, W. D., Nittler, L. R., Stroud, R. M., Bogard, D. D., and Garrison, D. H. (2006). Graves nunataks 95209: a snapshot of metal segregation and core formation. Geochim. Cosmochim. Acta 70, 516–531. doi: 10.1016/j.gca.2005.09.019
Mezouar, M., Faure, P., Crichton, W., Rambert, N., Sitaud, B., Bauchau, S., et al. (2002). Multichannel collimator for structural investigation of liquids and amorphous materials at high pressures and temperatures. Rev. Sci. Instrum. 73, 3570–3574. doi: 10.1063/1.1505104
Nakajima, M., and Stevenson, D. J. (2015). Melting and mixing states of the Earth's mantle after the Moon-forming impact. Earth Planet. Sci. Lett. 427, 286–295. doi: 10.1016/j.epsl.2015.06.023
Neumann, W., Breuer, D., and Spohn, T. (2014). Differentiation of Vesta: implications for a shallow magma ocean. Earth Planet. Sci. Lett. 395, 267–280. doi: 10.1016/j.epsl.2014.03.033
Ofte, D. (1967). Viscosities of liquid uranium gold and lead. J. Nucl. Mater. 22, 28–32. doi: 10.1016/0022-3115(67)90105-5
Ozerov, A., Ispolatov, I., and Lees, J. (2003). Modeling strombolian eruptions of karymsky volcano, Kamchatka, Russia. J. Volcanol. Geothermal Res. 122, 265–280. doi: 10.1016/S0377-0273(02)00506-1
Philippe, J., Le Godec, Y., Mezouar, M., Berg, M., Bromiley, G., Bergame, F., et al. (2016). Rotating tomography Paris-Edinburgh cell: a novel portable press for micro-tomographic 4-D imaging at extreme pressure/temperature/stress conditions. High Press. Res. 36, 512–532. doi: 10.1080/08957959.2016.1221951
Ricci, E., and Novakovic, R. (2001). Wetting and surface tension measurements on gold alloys. Gold Bull. 34, 41–49. doi: 10.1007/BF03214811
Roberts, J., Kinney, J., Siebert, J., and Ryerson, F. (2007). Fe-Ni-S melt permeability in olivine: implications for planetary core formation. Geophys. Res. Lett. 34:L14306. doi: 10.1029/2007GL030497
Rudge, J. F., Kleine, T., and Bourdon, B. (2010). Broad bounds on Earth's accretion and core formation constrained by geochemical models. Nat. Geosci. 3, 439–443. doi: 10.1038/ngeo872
Rushmer, T., and Petford, N. (2011). Microsegregation rates of liquid Fe-Ni-S metal in natural silicate-metal systems: a combined experimental and numerical study. Geochem. Geophys. Geosyst. 12:Q03014. doi: 10.1029/2010GC003413
Rushmer, T., Petford, N., Humayun, M., and Campbell, A. J. (2005). Fe-liquid segregation in deforming planetesimals: coupling core-forming compositions with transport phenomena. Earth Planet. Sci. Lett. 239, 185–202. doi: 10.1016/j.epsl.2005.08.006
Shannon, M. C., and Agee, C. B. (1996). High pressure constraints on percolative core formation. Geophys. Res. Lett. 23, 2717–2720. doi: 10.1029/96GL02817
Shi, C. Y., Zhang, L., Yang, W. G., Liu, Y. J., Wang, J. Y., Meng, Y., et al. (2013). Formation of an interconnected network of iron melt at Earth's lower mantle conditions. Nat. Geosci. 6, 971–975. doi: 10.1038/ngeo1956
Shim, S. –H., Duffy, T. S., and Kenichi, T. (2002). Equation of state of gold and its applications to the phase boundaries near 660 km depth in Earth's mantle. Earth Planet. Sci. Lett. 203, 729–739. doi: 10.1016/S0012-821X(02)00917-2
Steeb, S., and Bek, R. (1976). Structure and compressibility of au-co melts. Z. Naturforschung Sect. A J. Phys. Sci. 31, 1348–1353. doi: 10.1515/zna-1976-1114
Stevenson, D. (1990). “Fluid dynamics of core formation,” in Origin of the Earth, eds H. Newsom and J. Jones (New York, NY: Oxford University Press), 29–43.
Terasaki, H., Frost, D. J., Rubie, D. C., and Langenhorst, F. (2005). The effect of oxygen and sulphur on the dihedral angle between Fe-O-S melt and silicate minerals at high pressure: implications for Martian core formation. Earth Planet. Sci. Lett. 232, 379–392. doi: 10.1016/j.epsl.2005.01.030
Terasaki, H., Frost, D. J., Rubie, D. C., and Langenhorst, F. (2007). Interconnectivity of Fe-O-S liquid in polycrystalline silicate perovskite at lower mantle conditions. Phys. Earth Planet. Interiors 161, 170–176. doi: 10.1016/j.pepi.2007.01.011
Terasaki, H., Frost, D. J., Rubie, D. C., and Langenhorst, F. (2008). Percolative core formation in planetesimals. Earth Planet. Sci. Lett. 273, 132–137. doi: 10.1016/j.epsl.2008.06.019
Todd, K. A., Watson, H. C., Yu, T., and Wang, Y. B. (2016). The effects of shear deformation on planetesimal core segregation: results from in-situ X-ray micro-tomography. Am. Mineral. 101, 1996–2004. doi: 10.2138/am-2016-5474
Urakawa, S., Terasaki, H., Funakoshi, K., Kato, T., and Suzuki, A. (2001). Radiographic study on the viscosity of the Fe-FeS melts at the pressure of 5 to 7 GPa. Am. Mineral. 86, 578–582. doi: 10.2138/am-2001-0420
Von Bargen, N., and Waff, H. (1986). Permeabilities, interfacial areas and curvatures of partially molten systems -results of numerical computation of equilibrium microstructures. J. Geophys. Res. Solid Earth Planets 236, 78–95. doi: 10.1029/JB091iB09p09261
Walte, N. P., Becker, J. K., Bons, P. D., Ruble, D. C., and Frost, D. J. (2007). Liquid-distribution and attainment of textural equilibrium in a partially-molten crystalline system with a high-dihedral-angle liquid phase. Earth Planet. Sci. Lett. 262, 517–532. doi: 10.1016/j.epsl.2007.08.003
Walte, N. P., Rubie, D. C., Bons, P. D., and Frost, D. J. (2011). Deformation of a crystalline aggregate with a small percentage of high-dihedral-angle liquid: implications for core-mantle differentiation during planetary formation. Earth Planet. Sci. Lett. 305, 124–134. doi: 10.1016/j.epsl.2011.02.049
White, R. S., Redfern, S. A. T., and Chien, S. Y. (2012). Episodicity of seismicity accompanying melt intrusion into the crust. Geophys. Res. Lett. 39:L08306. doi: 10.1029/2012GL051392
Wilson, L., and Keil, K. (2012). Volcanic activity on differentiated asteroids: a review and analysis. Chem. Der Erde-Geochem. 72, 289–321. doi: 10.1016/j.chemer.2012.09.002
Wood, B. J. (2008). Accretion and core formation: constraints from metal-silicate partitioning. Philos. Trans. R. Soc. Math. Phys. Eng. Sci. 366, 4339–4355. doi: 10.1098/rsta.2008.0115
Yoshino, T., Walter, M. J., and Katsura, T. (2003). Core formation in planetesimals triggered by permeable flow. Nature 422, 154–157. doi: 10.1038/nature01459
Keywords: core formation, differentiation, planetesimal, tomography, melt migration, percolation, pressure, terrestrial
Citation: Berg MTL, Bromiley GD, Le Godec Y, Philippe J, Mezouar M, Perrillat J-P and Potts NJ (2018) Rapid Core Formation in Terrestrial Planets by Percolative Flow: In-Situ Imaging of Metallic Melt Migration Under High Pressure/Temperature Conditions. Front. Earth Sci. 6:77. doi: 10.3389/feart.2018.00077
Received: 15 February 2018; Accepted: 25 May 2018;
Published: 12 June 2018.
Edited by:
Sung Keun Lee, Seoul National University, South KoreaReviewed by:
Yoshio Kono, Carnegie Institution of Washington, United StatesBin Chen, University of Hawaii at Manoa, United States
Copyright © 2018 Berg, Bromiley, Le Godec, Philippe, Mezouar, Perrillat and Potts. This is an open-access article distributed under the terms of the Creative Commons Attribution License (CC BY). The use, distribution or reproduction in other forums is permitted, provided the original author(s) and the copyright owner are credited and that the original publication in this journal is cited, in accordance with accepted academic practice. No use, distribution or reproduction is permitted which does not comply with these terms.
*Correspondence: Geoffrey D. Bromiley, geoffrey.bromiley@ed.ac.uk