 Jan M. Lindsay
 Richard E. A. Robertson
- 1School of Environment, The University of Auckland, Auckland, New Zealand
- 2The UWI Seismic Research Centre, Saint Augustine, Trinidad and Tobago
We report on the process of generating the first suite of integrated volcanic hazard zonation maps for the islands of Dominica, Grenada (including Kick ‘em Jenny and Ronde/Caille), Nevis, Saba, St. Eustatius, St. Kitts, Saint Lucia, and St Vincent in the Lesser Antilles. We developed a systematic approach that accommodated the range in prior knowledge of the volcanoes in the region. A first-order hazard assessment for each island was used to develop one or more scenario(s) of likely future activity, for which scenario-based hazard maps were generated. For the most-likely scenario on each island we also produced a poster-sized integrated volcanic hazard zonation map, which combined the individual hazardous phenomena depicted in the scenario-based hazard maps into integrated hazard zones. We document the philosophy behind the generation of this suite of maps, and the method by which hazard information was combined to create integrated hazard zonation maps, and illustrate our approach through a case study of St. Vincent. We also outline some of the challenges we faced using this approach, and the lessons we have learned by observing how stakeholders have interacted with the maps over the past ~10 years. Based on our experience, we recommend that future map makers involve stakeholders in the entire map generation process, especially when making design choices such as type of base map, use of colour and gradational boundaries, and indeed what to depict on the map. We also recommend careful consideration of how to evaluate and depict offshore hazard of island volcanoes, and recommend computer-assisted modelling of all phenomena to generate more realistic hazard footprints. Finally, although our systematic approach to integrating individual hazard data into zones generally worked well, we suggest that a better approach might be to treat the integration of hazards on a case-by-case basis to ensure the final product meets map users' needs. We hope that the documentation of our experience might be useful for other map makers to take into account when creating new or updating existing maps.
Introduction
Volcanoes are complex geologic systems that can produce a wide variety of hazardous phenomena both during and after actual eruptions. These include pyroclastic density currents, lava flows, lahars, debris avalanches, ballistic ejecta, ash plumes and ash fall, as well as ground shaking from volcanic earthquakes, inundation via tsunami, landslides, gas emissions, flooding, and fires. Communicating this complex array of hazard information to those at risk is challenging, especially when large uncertainties are involved. Volcanic hazard maps are commonly developed to meet this challenge. They are visual, spatial depictions of the areas that could be potentially impacted by volcanic phenomena, and include information about expected magnitudes and/or likelihoods of events occurring. Developed, communicated and used appropriately for a given volcanic setting and cultural and political context, hazard maps represent a common reference point that can play a major role in mitigating risk to vulnerable communities. They contribute to disaster risk reduction by putting all parties quite literally “on the same page” regarding hazard information (Lindsay et al., 2017).
Developing a volcanic hazard map is challenging, as it requires consideration and integration of a vast array of information into a single graphical image, including past eruptive activity, topography, weather patterns, any available modelling data, time frames for volcanic hazard analyses, quality of data, and associated uncertainties, as well audience-specific map elements and design features (e.g., Thompson et al., 2017). The different strands of information available for the development of any given volcanic hazard map are thus diverse in terms of origin and type of data, methodologies involved in their generation and the associated uncertainties. This challenge is compounded when the systematic development of a suite of hazard maps across an entire region is called for, given that there is typically a wide range in quantity and quality of information available for each volcano, meaning that “one size is unlikely to fit all.” There are few existing guidelines available for how to integrate the array of possible volcanic hazard data into a volcanic hazard map (e.g., Crandell et al., 1984), although an effort to fill this gap is underway by the International Association of Volcanology and Chemistry of the Earth's Interior (IAVCEI) Hazard Mapping Working Group to develop an open-access source book: Considerations for the Development of Volcanic Hazard Maps (Lindsay et al., 2017).
Here we report on the process of generating the first suite of integrated volcanic hazard zonation maps for the Lesser Antilles, in which we developed a systematic approach that accommodated the range in prior knowledge of the volcanoes in the region. The maps are included in the Volcanic Hazards Atlas of the Lesser Antilles, a book published by the (then) Seismic Research Unit of the University of West Indies (Lindsay et al., 2005a). The Atlas was developed in response to a request from Disaster Management officials throughout the Eastern Caribbean for accessible data and information on volcanic hazard in the region. It describes the volcanic history of each island, systematically summarising past activity, including historical eruptions, along with notable seismic swarms and the location and characteristics of geothermal areas. It presents a first-order hazard assessment for each island, which is then used to develop one or more scenario(s) of likely future activity, for which scenario-based hazard maps are generated. Each of these maps is included in their associated island-specific chapter. For each island, we also produced integrated hazard maps, which combined the individual hazardous phenomena depicted in the scenario-based hazard maps into integrated hazard zones. The integrated volcanic hazard zonation map for the most-likely scenario for each island is also reproduced as an annotated stand-alone poster version in the accompanying map pocket of the Atlas.
In this paper we present a detailed account of how we generated the volcanic hazard maps for the islands that were monitored by the Seismic Research Centre, with the exception of Montserrat as it was erupting at the time of map generation and thus represents a special case that has been addressed elsewhere (e.g., Druitt and Kokelaar, 2002; Wadge et al., 2014a). The islands covered here are thus Dominica, Grenada (including Kick ‘em Jenny and Ronde/Caille), Nevis, Saba, St. Eustatius, St. Kitts, Saint Lucia, and St Vincent.
We document the philosophy behind the generation of this suite of maps, and the method by which hazard information was combined to create integrated hazard zonation maps, and illustrate our approach through a case study. We also outline some of the challenges we faced using this approach, and the lessons we have learned by observing how stakeholders have interacted with the maps over the past ~10 years. We conclude with a series of recommendations that we hope might be useful for other map makers, both in the Caribbean and beyond, to take into account when creating new or updating existing maps to be used by stakeholders, such as emergency managers and land-use planners.
Volcanism in the Lesser Antilles
The Lesser Antilles represent an island arc along the eastern margin of the Caribbean Sea that stretches ~850 km from Grenada in the south to Saba in the north, and which marks the zone of westward subduction of the Atlantic oceanic crust beneath the Caribbean plate (Figure 1). North of Dominica the island arc splits into two, and only the western arc of islands, known as the “Volcanic Caribbees,” is active (Wadge and Shepherd, 1984). The Lesser Antilles include 21 potentially active volcanoes spread across 11 volcanically active islands (Figure 1) with volcanic eruptions being one of the main hazards that threaten the Eastern Caribbean region. During the past 200 years over 30,000 people have been killed by volcanic activity in this region, and currently about one million people are threatened by the direct effects of volcanic eruptions and about two and a half million more by related phenomena (Lindsay et al., 2005a). Most of the islands of the Lesser Antilles (e.g., Saba, St. Eustatius, Nevis, Montserrat, Guadeloupe, St. Vincent) have a single volcano that has been identified as likely to erupt in the future (Figure 1). The other islands are more complicated, of which Dominica is the most extreme, with no less than nine potentially active centres (Lindsay et al., 2003, 2005c).
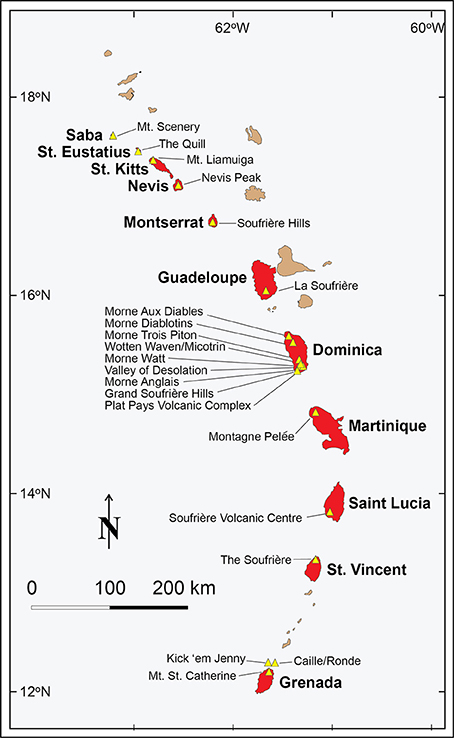
Figure 1. Map of the Lesser Antilles island arc showing islands in the active arc in red and the inactive arc in brown. Potentially active volcanoes are indicated by yellow triangles.
There have been at least 36 historical eruptions of volcanoes in the Lesser Antilles. Twenty-three of these have occurred since 1900; nine on land from volcanoes on Guadeloupe, Martinique, St. Vincent, Montserrat and Dominica, and 14 from the submarine volcano Kick-‘em-Jenny, ~9 km north of Grenada (Figure 1; Lindsay et al., 2005a). The 23 most recent eruptions have shown a wide variety in both eruptive style and impact on the local population. Several have been phreatic in nature, one a minor phreatic eruption in Dominica in 1997 that went largely unnoticed and two much more serious phreatic eruptions in Guadeloupe in 1956 and 1976-1977; the latter resulted in the 3.5-month evacuation of over 70,000 people (Fiske, 1984). The 1902 eruption from the Soufrière in St. Vincent was an explosive magmatic eruption that resulted in the deaths of at least 1,500 people (Pyle et al., 2018); in contrast, the 1971-1972 eruption at this volcano was wholly effusive, and resulted in the formation of a lava dome confined within the summit crater (Robertson, 1992). The 1979 eruption of the Soufrière was explosive followed by dome growth, and although there was some property damage and significant economic losses, no lives were lost (Robertson, 1995). The 1902-1907 eruption of Montagne Pelée on Martinique is ranked among the world's most devastating in terms of destruction of lives and property. This eruption was characterised by both effusive dome formation and explosive dome collapse (Lacroix, 1904; Tanguy, 2004) and led to the total destruction of the town of St. Pierre and the deaths of approximately 30,000 people from high-velocity, highly turbulent pyroclastic surges (Boudon and Lajoie, 1989). A similar eruption occurred from Montagne Pelée several years later, between 1929 and 1932, this time with no reported casualties (Perret, 1937). The 14 submarine eruptions from Kick ‘em Jenny have been dominantly explosive, although in at least one case a lava dome was extruded (Lindsay and Shepherd, 2005; Lindsay et al., 2005b). The Soufrière Hills volcano on Montserrat has been erupting since 1995, resulting in significant impact on all aspects of the island. The eruption is characterised by periods of dome-growth interspersed with dome collapse and minor explosions (Druitt and Kokelaar, 2002; Wadge et al., 2014a; Figure 2). The Soufrière Hills volcano is the only volcano currently erupting in the eastern Caribbean. In addition to these volcanic eruptions, historic volcanic earthquake swarms have been observed in almost all of the eastern Caribbean islands with live volcanic centres (Shepherd, 1989; Lindsay et al., 2005a).
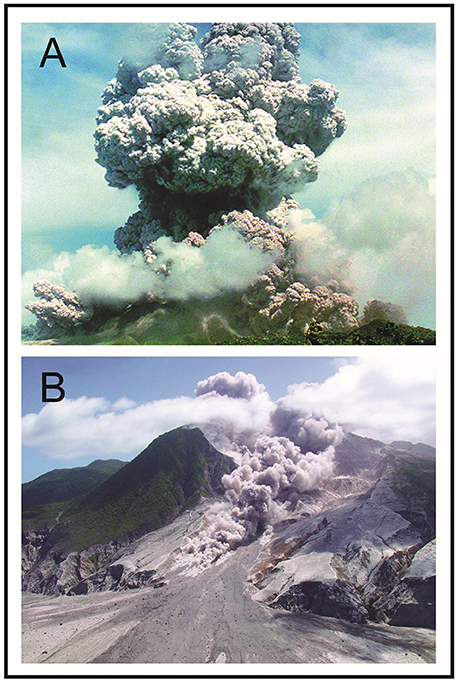
Figure 2. Photographs of the Soufrière Hills eruption on Montserrat illustrating the two main types of eruptive activity expected in the region. (A) Explosive magmatic eruptions generating column-collapse pyroclastic flows (height of plume ~3 km above sea level; photograph taken in 1997), and (B) Dome forming eruptions generating dome-collapse pyroclastic flows and surges (height of vegetated Roche's Mt. on left-hand side of scarp is ~900 m; photograph taken in 2005). Photographs: Montserrat Volcano Observatory.
In the north and central parts of the arc, the islands from Saba to Saint Lucia have dominantly erupted andesite and dacite magma, and in the past have produced both large explosive eruptions generating pumiceous pyroclastic flow deposits and lava domes and their associated block and ash flow deposits (e.g., Macdonald et al., 2000; Lindsay et al., 2013; Smith et al., 2013; Bezard et al., 2014; Howe et al., 2015a). Most of the volcanoes in this part of the Lesser Antilles arc are stratovolcanoes, and many of these are made up of a series of coalescing lava domes. In contrast, the southern group of islands from St. Vincent to Grenada is dominated by basalts and basaltic andesites and contains only rare andesites (e.g., Arculus, 1976; Brown et al., 1977; Thirlwall and Graham, 1984; Robertson, 2003). In addition to stratovolcanoes, these islands also contain a number of small explosion craters and mafic lava flows. Large dome-forming eruptions are less common.
Although the dominant type of past volcanic activity in the Lesser Antilles has taken the form of effusive andesitic dome growth and associated pyroclastic activity associated with moderate-sized explosive eruptions, between about 20,000 to 40,000 years ago the islands of Dominica and Saint Lucia were the sites of several violent Plinian eruptions that resulted in the deposition of thick pumiceous pyroclastic flow deposits (e.g., the eruptions that make up the Roseau Tuff in Dominica; Howe et al., 2014, and the Belfond unit in Saint Lucia; Lindsay et al., 2013). Should such large explosive eruptions occur today, they would not only affect the island in question but would probably have an impact on the entire region.
Despite over a century of investigations into the geology of the Lesser Antilles region, prior to the publication of the Volcanic Hazard Atlas no detailed study into the region's volcanic hazard had ever been conducted. Most of the geological work in the region had been aimed at identifying and interpreting the geophysical, petrological, and geochemical characteristics of the arc. Varying degrees of hazard assessment had been done at some volcanic centres on some islands in the region, namely St. Vincent (Rowley, 1978; Robertson, 1992), St. Eustatius and Saba (Roobol et al., 1981; Smith et al., 1985), Montserrat (Roobol et al., 1981; Baker, 1985; Smith et al., 1985; Wadge and Isaacs, 1988); Dominica (Wadge, 1984, 1985), and Kick ‘em Jenny submarine volcano in the Southern Grenadines (Smith and Shepherd, 1993). All these studies used different approaches to hazard assessment. Robson and Tomblin's (1966) contribution on the West Indies to the “Catalogue of the active volcanoes of the World including Solfatara Fields” represented the only overview of the volcanic hazard in this region prior to the publication of the Volcanic Hazard Atlas in 2005.
Volcanic Hazard Assessment
Three main sources of data were consulted in assessing volcanic hazard for the islands of the Lesser Antilles as presented in Lindsay et al. (2005a):
(1) Published and unpublished geological investigations of past activity including all historical activity at each volcano. This provided an indication of size, style, and frequency of past activity.
(2) Records from the monitoring network (seismic swarms; geothermal and ground deformation observations), which provided an indication of the state of each volcano, combined with observations of current topography, including presence or absence of a crater lake. Data on wind profiles associated with potentially active volcanic centres along with annual precipitation patterns were also collected. This data provided an indication of when and where future activity may occur, and insights into the likely style of activity and possible areas affected.
(3) Published and unpublished descriptions of activity (past/present) at analogous volcanic systems within the region and elsewhere. This provided an indication of possible activity that may have been either unprecedented or not preserved in the geologic record at the volcano in question. In the case of some islands (e.g., Saint Lucia) very few data exist for the island's recent past (i.e., past 20,000 years), making it difficult to determine frequency of past eruptions and likely style of future activity. In cases like this, it was very helpful to draw comparisons with similar volcanic islands in the region where more is known, such as Montserrat and Martinique.
Regardless of the level of pre-existing knowledge of the past eruptive activity on each island, our philosophy was to use the available information outlined above to (a) identify all centres that could potentially erupt in the future, (b) identify what style of eruption would most likely occur at that centre in the future, and (c) generate a realistic scenario for that eruption. We took the view that these were long-term forecasts based on the current scientific understanding of the volcano in question. Where possible an attempt was made to determine recurrence rates and thus provide some indication of how likely a particular scenario was. This was possible in the case of Dominica and St. Vincent; however, more often than not likelihood was not ascribed to the scenario, rather the maps showed hazard conditional on an eruption occurring.
Past volcanic activity in the Lesser Antilles has been dominated by two styles of activity (Figure 2): effusive andesitic dome growth and associated pyroclastic activity, and moderate-sized basaltic-andesite explosive magmatic eruptions. As a result these are the two most common scenarios depicted in the hazard maps. The main volcanic hazards expected at volcanoes in the Lesser Antilles were considered to be pyroclastic flows, surges and falls, lava domes and dome collapses, debris avalanches, directed blasts, and lahars, with the particular combination of hazards that could be experienced in any given scenario depending on the type of eruption expected. For the submarine volcanoes Kick ‘em Jenny and Caille we also considered the secondary hazards of volcanogenic landslides and tsunami.
We made it clear in accompanying text that the maps would need to be updated as new data were obtained (e.g., new dates for past eruptions), or if a volcano began an actual eruption, necessitating a revision of hazard zone boundaries based on exact vent location, eruption style, and weather conditions. Furthermore, we also stated clearly that eruptive style may vary throughout the course of an eruption, such that an eruption may switch from being dominantly effusive to dominantly explosive or vice versa, or the two eruptions styles may occur simultaneously.
Method of Generating the Volcanic Hazard Maps
After identifying all centres that could potentially erupt in the future and developing realistic scenarios for possible future activity for each volcano through the hazard assessment, we took a systematic approach to generating the volcanic hazard maps, i.e., we applied the same methods in the same order for each volcano where possible. This was considered appropriate given funding and time limitations. For example, we had to base our hazard assessments on our and others' previous studies of the volcanoes, i.e., existing data, rather than carrying out significant new fieldwork and data collection for the purposes of the project. Furthermore, we did not have access to or capability in computer-aided hazard modelling, so no computational or numerical hazard models were used.
The hazard maps for the Lesser Antilles were developed in two stages. The first stage involved creating a phenomena-based hazard map for the most likely general scenario for future volcanic activity for all potentially active volcanoes based on the long-term hazard assessment for the island in question. Typically this resulted in maps depicting either an effusive dome-forming (pelean-style) scenario (Figure 3A) or an explosive magmatic (St. Vincent style) scenario (Figure 3C). Typically, each island had one well-recognised potentially active volcano with enough information from past activity to determine the likely style of future activity. However, there were a few exceptions. Some volcanoes, such as the Soufrière Volcanic Centre on Saint Lucia and Mt. St. Catherine on Grenada, had a complex history such that more than one scenario was deemed possible; in those cases more than one scenario-based hazard map for the volcano in question was produced (e.g., Figures 3A,C). Dominica provided an additional challenge in that it hosts more than one potentially active volcano (indeed, it has nine). In this case, scenario-based hazard maps were produced for the five most likely scenarios for magmatic eruptions on the island.
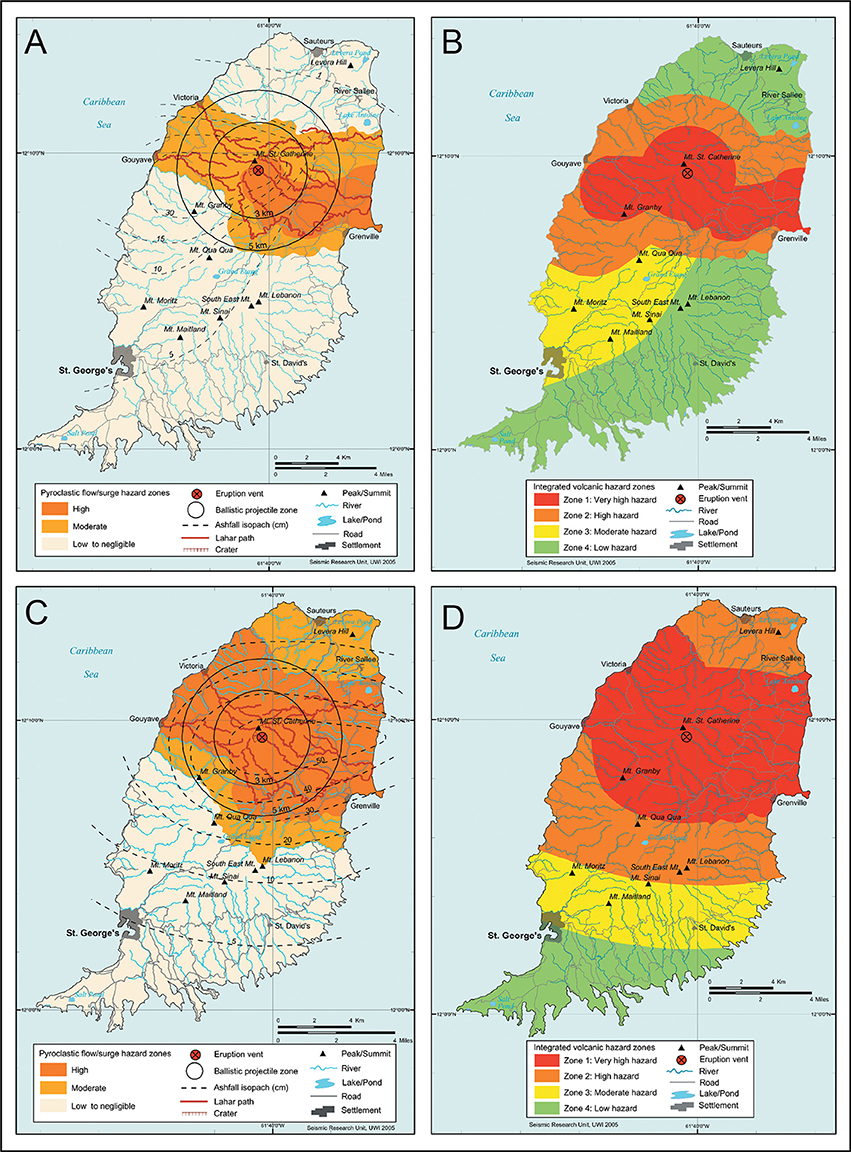
Figure 3. Examples of dome-forming (A) and explosive magmatic (C) eruption scenario-based hazard maps and associated integrated hazard maps (B,D, respectively) for Mt. St. Catherine, Grenada. Note the configuration of the yellow zone in (B) resulting from the data integration method. See text for details. Maps reproduced from Lindsay et al. (2005a) with permission from The UWI Seismic Research Centre.
The second stage involved generating georeferenced volcanic hazard zonation maps, in which the information from each scenario-based hazard map was integrated into a user-friendly colour-coded map showing the overall areas of very high, high, moderate, and low hazard (red, orange, yellow and green, respectively; Figures 3B,D). In a final step, the integrated volcanic hazard map for the most likely scenario from each volcano was reproduced on a shaded relief base map with accompanying map text in a large format poster (17 × 22 inches, i.e., American standard paper size C; roughly A2) that was included as a map sheet in the pocket at the back of the atlas. In the case of Dominica, where more than one potentially active volcano is present, this final overall hazard zone map was generated using a weighted combination of the integrated hazard zones from the six most-likely scenarios on the island (five magmatic and one phreatic eruption scenario).
Overall we developed a total of 19 eruption scenarios for the volcanoes in these eight islands: nine dome-forming eruption scenarios, six explosive magmatic eruption scenarios, one scenario that combined dome-forming and explosive magmatic behaviour (see St Vincent case study below), and three phreatomagmatic eruption scenarios. From these, nine large-format maps were generated depicting the most-likely scenario in each island. More detail on the steps taken to produce the maps is presented below.
Stage 1: Development of a Suite of Scenarios and Associated Maps
Dome-Forming Eruption Scenarios
Nine dome-forming eruption scenarios were developed: four for Dominica, and one each for Saba, Grenada, Saint Lucia, Saint Kitts, and Nevis. Scenarios for dome-forming eruptions involved dome growth and periodic collapse interspersed with small explosions, as typified by the 1995-present eruption on Montserrat. The likely duration of an eruption of this sort was thought to be between 1 and 10 years. The dome-forming scenarios generally included the following progression of activity:
• A precursory phase, including earthquake swarms, ground deformation, and phreatic explosions.
• An initial phase, involving either non-explosive, passive eruption of lava to form a dome, or a period of vigorous “vent-clearing” explosive magmatic activity followed by passive extrusion of lava to form a dome.
• Establishment and growth of the lava dome, which may become over-steepened and unstable, causing it to periodically collapse and generate block and ash flows. Lahars were considered possible following heavy rains or when pyroclastic flows entered rivers.
• Periodic explosive activity during dome-formation, possibly triggering explosive dome collapse events as well as abundant ash and ballistic projectiles.
The greatest hazard of a dome-forming eruption was considered to be lava dome collapse (either gravitational or explosive) producing pyroclastic flows and surges with accompanying ash fall. We used the highest-resolution DEMs available for each island to manually determine which valleys would likely be affected and overtopped by such flows and surges. We assumed that flows would likely follow paths of least resistance down river valleys that radiate from the proposed dome-collapse region. We assumed flows and surges would initially fill valleys in sectors that lacked near-vent topographic barriers; these areas were coloured dark orange on the map, and labelled “high pyroclastic flow/surge hazard zone” (Figure 3A). Given the proximity of most volcanoes to the coast, we assumed that, in almost all cases, such flows and surges would reach the coast, where they would then spread out, and/or pour up side valleys for distances of a few hundred meters (Fisher and Heiken, 1982). We also identified more distal regions that could be affected by more mobile pyroclastic flows and surges, due to surmounting of topographic barriers, infrequent explosions or lateral blasts; these were coloured light orange and labelled “moderate pyroclastic flow/surge hazard zone” (“moderate” because, although such flows were more energetic, they were considered less likely) (Figure 3A).
Our estimate of dome-collapse pyroclastic flow and surge hazard footprint was heavily influenced by our experience witnessing such activity on Montserrat. On the hazard map we showed all areas that could be affected by such activity over the course of a 1 to 10 year eruption (i.e., the accumulated footprint), rather than the areas likely to be affected in the initial stages, or by single events. We were of course mindful of the fact that topography is likely to change considerably as an eruption progresses; however we still felt this approach was most likely to capture all probable flow paths over the course of an eruption and thus be most useful for map users.
In mapping the distribution of ash fall hazard we considered the height of the ash cloud together with the dominant wind direction. We assumed ash clouds above pyroclastic flows would be restricted to lower elevations (less than about 5 km), whereas those generated by explosive eruptions would reach much higher elevations. In the case of most of the islands the dominant wind direction is from the east (easterlies) at lower elevations (<about 4–12 km, depending on time of year), and from the west (westerlies) at higher elevations (up to 17–18 km, above which are the stratospheric easterlies). In order to define the probable ash fall pattern for dome-forming scenarios we used the pattern of accumulated ash fall thickness and distribution exhibited between 1995 and 2001 by the ongoing eruption of the Soufrière Hills volcano in Montserrat (Norton et al., 2001). These were represented as 5, 10, 15, 20, and 30 cm ash fall isopachs (e.g., Figure 3A).
We considered that ballistic projectiles could be generated during small explosions or the explosive collapse of a volcanic dome, and that these would mainly affect an area within 3 km of the vent, with some reaching greater distances (up to 5 km). These distances were based on observations during eruptions both in the Caribbean and elsewhere (e.g., Blong, 1984). We represented these as inner and outer circles around the vent representing ballistic projectile zones. We assumed that lighter fragments (such as pumice) would likely be kept buoyant in the eruption plume for much greater distances before falling back to Earth; such fragments were not mapped separately—rather considered to be included in the ash fall zones.
Lahars were assumed to be possible in any of the valleys whose headwaters were near the proposed vent; thus the entire path of all such valleys was indicated on the hazard map (thick brown lines; e.g., Figure 3A). We did not show lahar hazard beyond valleys, despite recognising that lahar hazard footprint would likely be wider in low-lying areas.
Explosive Magmatic Eruption Scenarios
Six explosive-magmatic eruption scenarios were developed, one each for Saint Eustatius, Saint Lucia, Grenada and Saint Kitts, and two for Dominica.
Scenarios for explosive magmatic eruptions involved explosions generating pyroclastic flows and surges by eruption-column collapse, as well as ash fall and lahars, as typified by the 1902 eruption of the Soufrière in St. Vincent (Robertson, 1992). The likely duration of an eruption of this sort was thought to be much shorter than a dome-forming eruption, on the order of days to weeks with potential extension to several months. The explosive magmatic eruption scenarios generally included the following progression of activity:
• A precursory phase including earthquake swarms and ground deformation (or even dome growth).
• An explosive phase generating ballistics and an eruption column followed by pyroclastic flows, surges, and fall.
• Lahar generation following periods of heavy rain or when pyroclastic flows entered rivers.
Pyroclastic flows and surges produced by column collapse were considered to be much less confined by topography than those produced by dome collapse. We thus assumed that they would have an equal chance of entering any of the many valleys that drain the summit of the volcano. As above, we used the highest-resolution DEMs available to manually determine which valleys would likely be affected and/or overtopped by pyroclastic flows and surges. As above, these areas were coloured dark orange on the map, and labelled “high pyroclastic flow/surge hazard zone” (Figure 3C). Again, we assumed that in almost all cases such flows and surges would reach the coast, where they would then spread out, and/or pour up side valleys for distances of a few hundred meters (Fisher and Heiken, 1982). We also identified more distal regions that could be affected by more mobile pyroclastic flows and surges generated due to infrequent explosions or lateral blasts (light orange “moderate pyroclastic flow/surge hazard zone,” Figure 3C).
In mapping the distribution of ash fall hazard for explosive magmatic eruptions, we used the pattern of ash fall thickness and distribution exhibited during the 1902 eruption of the Soufrière in St. Vincent (Robertson, 1992). These were represented as 5, 10, 20, 30, 40, and 50 cm ash fall isopachs (Figure 3C). The area of maximum ballistic impact was not expected to extend beyond 5 km from the volcano. We chose to represent ballistic projectiles as two concentric zones, 3 and 5 km from the proposed vent (Figure 3C). As with dome-forming scenarios, lahars were assumed to be possible in any of the valleys whose headwaters were near the proposed vent, thus the entire path of all such valleys was indicated on the hazard map (thick brown lines; Figure 3C).
Stage 2: Development of Integrated Hazard Maps for Each Scenario
After producing the scenario-based hazard maps for each island we decided that it might be more useful for hazard management purposes to simplify the content by integrating the individual hazardous phenomena displayed on the map into very high, high, medium, and low volcanic hazard zones. This was done in a systematic manner by weighting the individual hazards and then combining them in zones as follows:
Zone 1 (red) was defined as the area of very high hazard, i.e., the area most likely to be affected by the dome itself and dome-collapse pyroclastic flows and surges (for dome-forming eruption scenarios) and by column-collapse pyroclastic flows and surges (for explosive magmatic scenarios), as well as heavy ash fall, lahars, and ballistic ejecta. It was determined by combining the following from the hazard map of the relevant scenario: the area with a high pyroclastic flow hazard, the 3 km radius ballistic projectile zone and the area likely to receive >30 cm of ash fall (Figures 3B,D). In the accompanying text to the maps it was noted that total destruction of buildings and property in zone 1 is probable, and that this zone would need to be evacuated before the eruption begins.
Zone 2 (orange) was defined as the area of high hazard, i.e., the area likely to be affected by energetic (but less likely) pyroclastic flows and surges, and ballistic ejecta, lahars, and high to moderate ash fall. It was determined by combining the following from the relevant scenario: the area with a moderate pyroclastic flow hazard, the 5 km radius ballistic projectile zone and the area likely to receive 10–30 cm of ash fall (Figures 3B,D).
Zone 3 (yellow) was defined as the area of moderate hazard, i.e., the area that may be affected by ash fall but should be free from the effects of pyroclastic flows, surges, lahars, and ballistic ejecta. It outlines the area likely to receive 5–10 cm of ash (Figures 3B,D).
Zone 4 (green) was defined as the area of low hazard in which little to no direct effect of the volcano would be felt with the exception of some minor (<5 cm) ash fall (Figures 3B,D).
For each island, the integrated hazard zone map representing the most-likely scenario was annotated and reproduced in poster size for the map pocket.
Note that for the largely submarine volcanically active regions off the northern coast of Grenada we developed three phreatomagmatic eruption scenarios (two for Kick ‘em Jenny and one for the nearby islands of Caille and Ronde); these were depicted on the maps solely as integrated volcanic hazard zones. In these cases, the zones were expressed as concentric rings around the vent to qualitatively represent areas of high and moderate hazard for some or all of the following hazards (depending on the scenario): ballistic ejecta; lowered water density; water disturbances; explosions; volcanic ash; volcanic edifice collapse and submarine plumes. We included one map covering two scenarios for these submarine centres in the map pocket.
Case Study: Saint Vincent
Past Volcanic Activity
St. Vincent is located between latitude 13° and 13°30' N and longitude 61° and 61°30' S, north of Grenada within the southern part of the Lesser Antilles island arc (Figure 1). The island is roughly oval and is approximately 29 km long and 17.5 km wide with an area of 344 km2. St. Vincent was chosen here as a case study as it has experienced numerous historical eruptions and its likely eruptive behaviour is thought to be reasonably well constrained.
The youngest volcanic centre on St. Vincent is the Soufrière Volcano, which occupies the northernmost third of the island. The Soufrière Volcano is the only live volcano on St. Vincent and is the most likely location for future eruptive activity on this island (Robertson, 2005). The volcanic edifice consists of an older stratocone or Somma (2.5 km diameter), which forms a steep arcuate ridge to the north, and a younger pyroclastic cone, which has been the source of historical (post 1700) eruptions, nestled within this crater. The older stratovolcano is thought to have been active during the late Pleistocene (~700 ka) (Robson and Tomblin, 1966; Rowley, 1978; Robertson, 1992).
During the past 4000 years the volcano has had an average of one explosive eruption every 100 years. Since 1700 the Soufrière Volcano has experienced 13 eruptions that have exhibited a cyclical pattern of alternating styles of activity (Aspinall et al., 1972, 1973), consisting of an explosive style (type 1) and a quiet effusive style (type 2). Activity during the pre-historic period was similar, with the exception of one major period of cataclysmic Plinian style activity (Rowley, 1974, 1978).
Explosive (Type 1) eruptions are the typical “St. Vincent style” eruptions (Robertson, 2005). They are highly explosive eruptions usually preceded by frequent, strong earthquakes. Rapid rates of magma production result in the ejection of large volumes of new material. This type of activity is exemplified by the 1902-03 and the somewhat smaller 1979 eruptions. Non-explosive (Type 2) eruptions are effusive and may be unaccompanied by earthquakes during open conduit eruption phases (Shepherd et al., 1979; Robertson, 2005). They involves the extrusion of a viscous lava dome and result in the production of smaller volumes of new material than type 1 eruptions. This type of eruption is exemplified by the 1971-72 eruption (Aspinall et al., 1972, 1973).
Short-Term or Most-Likely Scenario
In the short-term (i.e., <100 years), the volcanic hazard is expected to be quite similar to that experienced in the historical past (i.e., the past 250 years), namely activity could be explosive, effusive or a combination of both types of activity. Explosive and effusive activity may be separated in time, but can be regarded as part of a two-phase pattern of eruption. This is considered the most likely scenario for a future eruption at Soufrière Volcano. The scale of the explosive phase is expected to range from that of a 1979-type event to that of a larger 1902-type event. The effusive phase is expected to be quite similar to the 1971-72 eruption. A brief description of these phases and likely associated hazards is given below; for more detail see (Robertson 2005).
Effusive or Dome Forming Phase
This phase involves the relatively quiet emission of viscous basaltic andesite magma from the central vent. The event may be aseismic with premonitory activity limited to changes in water temperature (if a lake is present), increased fumarolic activity or changes in ground deformation. Based on activity experienced during the historical past, the extrusion rate may vary between 105 and 106 m3 per day. The eruption may last from a few hours to several months. Given the configuration of the crater (300–600 m deep, 1.6 km diameter) and the viscosity of the magma, effusive eruptions would result in the formation of a lava dome on the crater floor. This type of activity is exemplified by the 1971-72 eruption as well as the latter phase of the 1979 event. The hazard associated with the effusive phase will be largely confined to the crater and its immediate surroundings.
Explosive Phase
This type of activity is exemplified by the 1902 eruption as well as by all of the historical explosive eruptions of the Soufrière volcano. Activity is expected to involve discrete vulcanian to phreatomagmatic discharges from the volcanic centre. Explosive activity will usually follow an effusive dome building phase which causes the central vent to become plugged, allowing for the build-up of pressure in a shallow magma chamber. Following this, fragmentation and explosive eruption of material onto the surface may result due to the combined effects of volatile exsolution and the interaction of hot rising magma with groundwater and/or lake water. The magmatic composition is likely to be similar to material erupted in the past (i.e., 50–57% wt.% SiO2) with similar mass discharge rates (i.e., 4–6 × 10⁷ kg/s). The eruption may last from a few days to several months, with initial explosions possibly lasting 2 to 3 h, generating plumes to 18 km and higher.
Expected Hazards and Hazard Map Development
The explosive phase is expected to be much more disruptive than the effusive phase, with the generation of pyroclastic flows and surges, lahars, ash falls and ballistic projectiles, as well as volcanic tremors, lightning flashes, volcanic gases, and secondary landslides. This phase therefore dominates the content of the hazard map.
Pyroclastic flows will be generated either by partial or complete collapse of eruption columns or by the boiling over of dense gas-charged ejecta from the crater rim. Evidence from past eruptions at similar volcanoes (e.g., Montagne Pelée, 1902), suggests the possibility also exists for pyroclastic flows to develop from the collapse of any domes that rise above the crater rim. However, fluidised overspill of hot, fragmented ejecta from the crater rim is likely to be the dominant method of pyroclastic flow formation during the early stages of an explosive sequence when large eruption plumes have not yet developed. Such flows occurred during the 1979 eruption (Shepherd et al., 1979) and will most likely follow paths of least resistance down river valleys that extend from minor depressions in the otherwise continuous crater rim. Flows will initially go down valleys in the east-west-south sector of the volcano due to the topographic barrier presented by the Somma ridge to the north. These areas were thus defined as high pyroclastic flow/surge hazard zones in the hazard map (Figure 4A). With increasing magnitude, collapse of large dense columns (>>20 km) may lead to flows that surmount the Somma Ridge and follow the valleys rivers to the north and northeast coast (moderate pyroclastic flow/surge hazard zones in Figure 4A). Pyroclastic surges will tend to affect areas in all azimuths from the crater since they are less constrained by topography; eruptions of 1979 magnitude may generate surge deposits ≥0.5 m thick within 2 km of the crater rim in all directions (Brazier et al., 1982). With larger eruptions the area affected may increase to a possible maximum of 5 km (Anderson and Flett, 1903). Surge hazard is captured in the pyroclastic flow/surge hazard zones in Figure 4A.
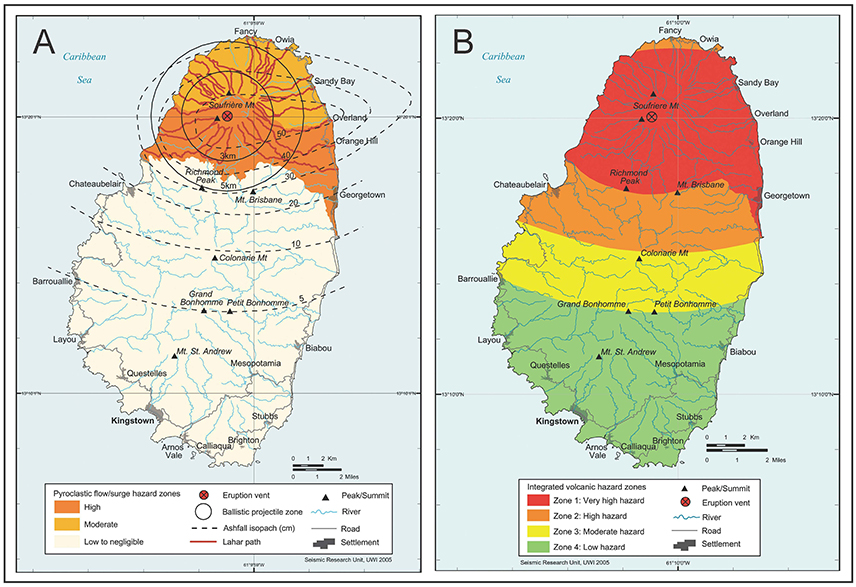
Figure 4. Volcanic hazard map (A) and integrated volcanic hazard zones (B) for the most-likely scenario for a future eruption at the Soufrière Volcano, St. Vincent involving both effusive dome-forming and explosive activity. Maps reproduced from Lindsay et al. (2005a) with permission from The UWI Seismic Research Centre.
Lahars can be generated at any time during or after the eruption, at any point on the volcano's flanks since the radial drainage pattern provides ample depressions to guide mobilised tephra; lahar hazard is indicated by thick brown lines tracing river valleys in Figure 4A; these represent lahar paths, but not depths. The likelihood of flows developing early in an eruption sequence is greatly increased if there is a crater lake to be discharged (Robertson, 2005). Abundant tropical rainfall provides adequate moisture for the development of mudflows later in the eruption, and they may continue to present a hazard for some time after an eruption has ceased (Robertson, 2005). During the 1902 eruption, secondary mudflows overturned several small houses at Georgetown, approximately 7 km east of the volcano summit (Anderson and Flett, 1903) (Figure 4A).
The impact of ash fall, volcanic gases and lightning strikes will depend largely on atmospheric conditions in the area at the time of the eruption. The dominant surface winds are easterly and will affect plumes located below 5 km. Above 5 to 8 km height, these easterly trade winds are replaced by the westerlies which are in turn replaced by the easterlies at the tropopause which can vary between 16 and 18 km (Sigurdsson and Carey, 1981). Locally a continuous ash blanket may extend up to 9 km in all directions. Within 2.5 km of the vent, in eruptions of the scale of 1979, up to 45 cm may accumulate (Brazier et al., 1982). This may decrease to 45 mm up to 4 km from the crater rim. Eruptions with greater magnitude will cause the ash deposited from an entire eruption to reach up to 6 mm in Kingstown (Anderson and Flett, 1903), 21 km from the volcanic centre (Figure 4A). The pattern of ash fall produced during the 1979 eruption was combined with the ash thicknesses of the 1902 eruption to obtain isopachs for this eruption scenario (Figure 4A). Although not shown on the hazard map, the text in the accompanying St. Vincent chapter in the Hazard Atlas (Robertson, 2005) describes the likely wider distribution of ash, noting that ash plumes from the 1902 eruption were carried over 1200 km east into the Atlantic (Sigurdsson and Carey, 1981).
The range and effect of projectiles will be limited by the velocity of their emission from the crater. Although 21 kg bombs reached up to 6 km from the summit during the 1902 eruption (Blong, 1984), most ejecta fell within 5 km. The area of maximum impact of projectiles is thus expected to be within 5 km of the volcano. Two ballistic projectile zones are shown on the map (Figure 4A).
Integrated Hazard Zones
The hazard information from this most-likely scenario as depicted in the hazard map in Figure 4A was integrated into volcanic hazard zones (Figure 4B) following the standardised method described in section Stage 2: Development of Integrated Hazard Maps for Each Scenario. The zones are primarily based on the projected effect of explosive activity from the most-likely scenario. Given that the effects of effusive eruptions are limited to the summit area, these had little impact on the determination of hazard zones. As noted earlier the integrated volcanic hazard map for the most likely scenario from the Soufrière Volcano was reproduced on a shaded relief base map with accompanying map text in a large format poster that was included as a map sheet in the pocket at the back of the atlas (Figure 5).
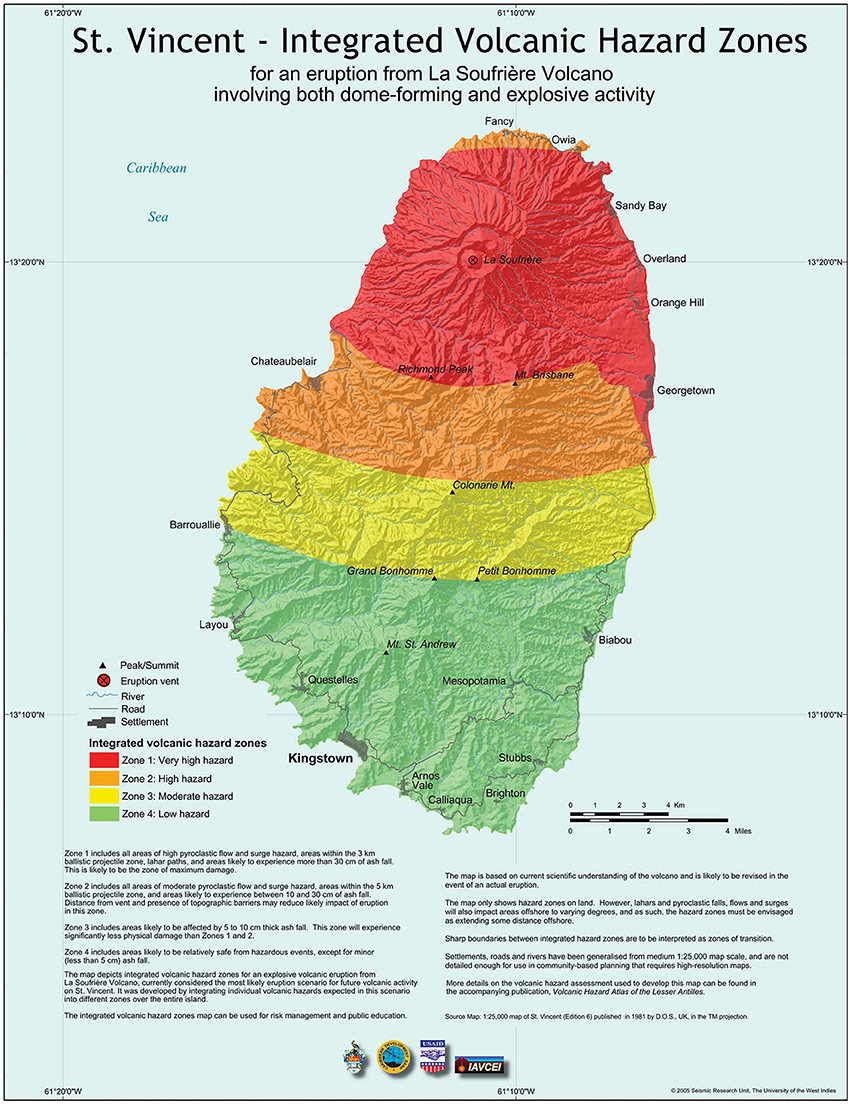
Figure 5. Large format (17 × 22 inches; ~A2) map of integrated volcanic hazard zones for the most-likely eruption from the Soufrière Volcano involving both effusive dome-forming and explosive activity. This map, which is an annotated, more detailed version of the map in Figure 4B, was included in the map pocket of the Atlas. Map reproduced from Lindsay et al. (2005a) with permission from The UWI Seismic Research Centre.
Likelihood of Eruption
During the historical period, the Soufrière Volcano has erupted at least twice per century in the two-phase manner described (Robertson, 2005). Although this is an insufficient time span for an accurate estimate of eruption probability, it still gives some basis upon which to assess the likelihood of future activity. The available record thus suggests that in the short-term the volcano may be expected to erupt in the manner described at least once every 100 years. In the longer term, allowances must be made for the possibility of large scale explosive eruption generating sustained ash plumes and thick airfall deposits. Although there are no historical records of such activity, the presence of thick late Pleistocene ash fall deposits throughout St. Vincent as well as thick scoriaceous ash fall on the lower flanks of the volcano demonstrates that the Soufrière has the capacity for events of this kind (Robertson, 2005). Such a scenario was also described in the hazard assessment for the Soufrière Volcano but a hazard map was not developed for it. Current records of the volcano's history suggest that such catastrophic events may be expected to occur once every 4000 years (Robertson, 2005).
Dissemination and Use of the Maps
One thousand copies of the Atlas were printed; ca. 400 were distributed free of charge and ca. 400 have been sold to date. Free copies were given to all territories covered by the Atlas as well as to a wide variety of stakeholders across the Caribbean including public libraries, educational institutions, civil society groups, government departments, and the private sector. Copies of the Atlas have been sold widely throughout the Caribbean region with uptake elsewhere being mainly from Europe and North America. GIS shape files are available free of charge on request from The UWI Seismic Research Centre.
The disaster management community in the Eastern Caribbean at both the local/island level and at the regional level have fully adopted the maps in the Atlas in plans for future volcanic emergencies. In contrast, there has been little uptake of the maps nor available GIS shape files of defined hazard zones by other key stakeholders such as government physical and economic planning agencies.
The maps most commonly used by the disaster management community are the integrated volcanic hazard maps, which in some islands have been used as the basis for spatial demarcation of areas to be evacuated in the event of future volcanic eruptions (for example, the St. Vincent maps are used in the 2014 National Disaster Plan). They have been fully integrated into alert procedures used in managing volcanic emergencies with various levels of alert referencing specific zones on these maps for specific actions to be taken.
Engagement with regional disaster management stakeholders was critical in ensuring that the information produced in the Volcanic Hazard Atlas was taken up and used. Such engagement between The UWI Seismic Research Centre staff and regional stakeholders has been ongoing and continuous and has involved widespread distribution of the Atlas, integration of the information contained within the Atlas in all aspects of ongoing education and outreach activities, and provision of advice and guidance as needed to disaster management officials in use and application of the information. Such engagement has enabled valuable feedback to be obtained to guide similar productions in the future, and in some cases mutually agreed modifications of the maps to enable more effective use as a key tool in evacuation exercises (discussed in more detail below). The maps have also been used for training purposes as the basis for scenario-based planning exercises that enable disaster management officials to exercise and test emergency plans.
Discussion
Cartographic and Design Elements
Our small-scale hazard maps were all produced on very simple outline maps of each island that only included rivers, roads, and towns and did not include topographic contours (e.g., Figures 3, 4). In contrast, the base map for each large-scale integrated hazard zone map was a Digital Elevation Model with hillshade, that included rivers, roads, and towns (e.g., Figure 5). We selected colours that we thought would be easy to understand, and deliberately used a different colour scheme for the phenomena-based hazard maps (orange-brown) and integrated hazard zone maps (red-orange-yellow-green) to avoid confusion between the two different map types. We did not specifically consult potential map-readers when selecting the base map or choosing what to show on our maps; we did however make the assumption that hazard zone maps might be easier to understand and more useful for planning than phenomena-based scenario maps.
Shortly after the publication of our hazard maps, Haynes et al. (2007) published a study that investigated maps as a communication tool on Montserrat. A survey of map reading preferences on the island revealed that participants on Montserrat had better success in location and orientation tasks when presented with perspective photographs than when presented with contour maps and 3D projections. In a similar study on Stromboli a few years later, experts were found to prefer contour maps to aerial photographs (Nave et al., 2010). Other studies have shown how design elements such as colour, symbology, data classification (e.g., stretched vs. binned), map content (including borders, landmarks etc.), and use of gradational shading can significantly affect the way in which users interpret information on a map (e.g., Monmonier, 1996; Olson and Brewer, 1997; Severtson and Vatovec, 2012; Thompson et al., 2015, 2017; Cheong et al., 2016). Our personal experience has also shown this to be the case. During the early stages of our map generation we considered presenting hazard with gradational boundaries, but struggled with how to depict this cartographically. In our own experience subsequently socialising the maps in public education campaigns and in discussions with stakeholders we have found it necessary to explain repeatedly that boundaries are not sharp lines, and that they should instead be considered as gradational; it has thus become clear to us through experience that sharp boundaries can be easily misinterpreted.
Reflection on these (and similar) studies and our own experience has highlighted to us the importance of consulting with potential map users throughout the entire map making process to ensure that outputs are evidence-backed and user-optimised. We would certainly recommend this approach in any future volcanic hazard mapping project in the region. Indeed, Thompson et al. (2015) stress that there is no one-size-fits-all map presentation; one map cannot comprehensively meet the precise needs of a diverse audience of stakeholders and in some cases more than one map may be needed that depicts the same information in different ways.
Challenges and Limitations of Our Hazard Assessment Approach
Use of Scenarios
At the time of hazard map development we did not believe that sufficient data were available for probabilistic assessment of hazard; instead our assessments were based on a deterministic approach in which we developed scenarios conditional on an eruption occurring. Only in two cases (Dominica and St. Vincent) did we feel we had enough information to assign a statement of likelihood. Based on the location and pattern of seismicity in recent decades, the most-likely magmatic eruption scenario in Dominica (a dome-forming eruption) was considered more likely than not to occur within the next 100 years. In the case of St. Vincent, the available historical record was used to suggest that in the short-term the volcano may be expected to erupt in the manner described in the most-likely scenario at least once every 100 years.
The choice of whether to depict a maximum credible or most-likely scenario was a difficult one. Typically this choice should be at least in part driven by the needs of the target group for whom the maps are being created (for example, an emergency manager planning an exercise might be interested in a most-likely scenario, whereas a land-use planner may prefer a worst-case scenario). However, given that potential map users were not consulted prior to map development we made the decision to depict the most-likely magmatic eruption scenario. In some cases the most likely eruption scenario was in fact a phreatic eruption; in those cases maps were not generated (although such scenarios were always described).
We also took the view that there is a strong argument for use of both a most-likely and worst-case scenario, since this caters for the two most critical limits in terms of plans to mitigate future impacts. One has to plan for at least the most-likely scenario, and being aware of the worst-case allows for provisions to be made within even these plans for an upscaling of response should activity go beyond most-likely. Because of this, for those islands where large explosive magmatic eruptions were deemed possible (although unlikely) based on past activity (e.g., Dominica, St Lucia), a worst-case scenario and integrated hazard map pair was also generated and included as part of the hazard assessment. For consistency, however, the final large-scale integrated hazard maps in the map pocket (e.g., Figure 5) all depicted the most-likely scenario (with the exception of Dominica, as discussed above).
Another difficult decision was what portion of the eruption scenario to depict on the hazard map. Ideally, this decision would be made in consultation with map users, who may express a preference depending on their specific need. For example, if planning for evacuation it might be useful to have a map depicting the initial stages of an eruption; if siting critical infrastructure the cumulative hazard footprint of the entire eruption might be more useful. In the absence of stakeholder consultation, we made the conservative decision to depict the cumulative hazard footprint of each scenario.
Implications of Integration of Hazard Zones
The same parameters were used to define the coloured integrated hazard zones for each onshore scenario. For example, regardless of whether the scenario depicted a dome-forming or an explosive Plinian eruption, the area of moderate hazard (yellow) was defined as the area likely to receive 5–10 cm of ash. We made the decision to use strict criteria for the derivation of the integrated hazard zones to ensure uniformity and simplicity throughout, and to ensure that the same standard was applied in defining a product that would be used by emergency managers across the region for decision-making and planning during future crises. However, applying this strict definition created some problems with some of the maps.
For example, in cases where the yellow area as defined above fell within the 5 km ballistic projectile zone (one of the parameters used to define the zone of high hazard, i.e., orange), then that map did not show a yellow zone. Indeed, in many of the dome-forming eruption scenarios, the yellow zone of moderate hazard is limited or even missing because of this delineation (e.g., Figure 3B). In the accompanying hazard assessment chapters in the Atlas we stressed that this did not mean that there will be a sharp transition from high to low hazard in these cases, rather that all zone boundaries on these maps should be interpreted as zones of gradual transition. Although not applied in this case, another option would have been to introduce a buffer zone of the missing colour.
A similar effect of our strict systematic integration of hazard information is that some zones were either strangely shaped or unrealistically thin. Although we did not modify these in the published maps as we wished to retain our systematic approach, these “rogue” zones were in some cases tweaked in the years after publication for the purposes of exercises or volcano contingency planning. An example of this is the thin zone along the northern coast of St Vincent (Figure 4). Because of the way the individual hazardous phenomena are integrated into the hazard zonation map, this thin strip falls in the “high” hazard rather than “very high” hazard, despite the fact that it is completely surrounded by a high-hazard zone. Given that zone boundaries must be conceptualised as gradational, we agreed with stakeholder suggestions to incorporate this northern strip into the very high hazard zone to make the map more useful as an operational tool to guide simulation exercises and the drafting of emergency plans for future eruptions.
In a contrasting problem, our hazard integration approach led to at least one island (Saba) falling entirely within the red, very high hazard zone (Figure 6). Whilst this may indeed accurately reflect the level of hazard based on our hazard assessment method, it is not a terribly useful tool for civil authorities. In this particular case, the phenomena-based map depicting the actual hazards (Figure 6A) might be more useful. In future studies, should integrated hazard maps be developed, a better approach might be to treat the integration of hazards on a case-by-case basis to ensure the final product meets the needs of the map user.
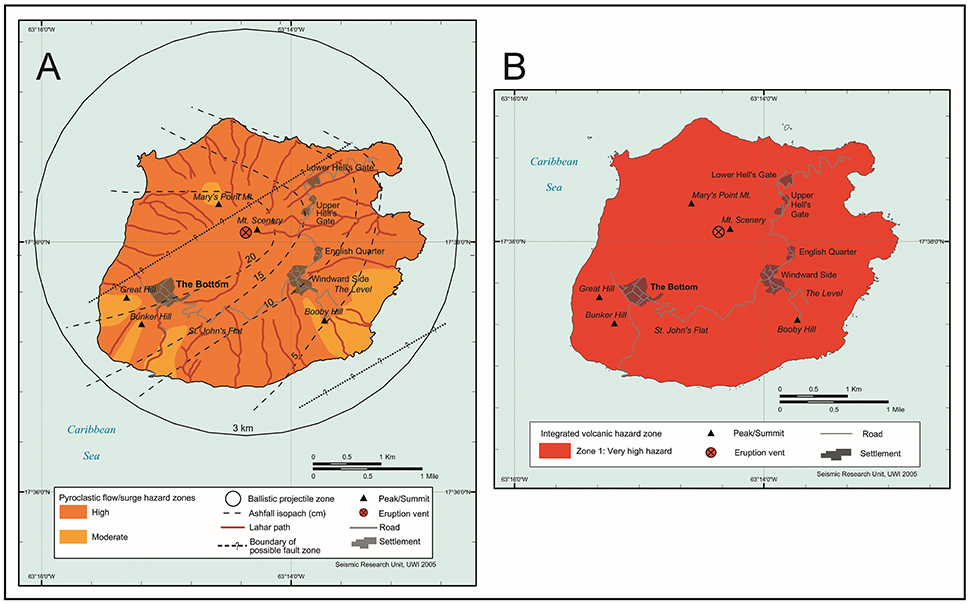
Figure 6. Dome-forming eruption scenario-based hazard map (A) and associated integrated hazard map (B) for Mt Scenery, Saba. Maps reproduced from Lindsay et al. (2005a) with permission from The UWI Seismic Research Centre.
Offshore Hazard
An important point to note is that, with the exception of the Kick ‘em Jenny and Caille scenarios, the hazard maps presented in the Atlas (Lindsay et al., 2005a) only show hazard zones on land. In the accompanying hazard assessments and on the large format map faces it is stated that an onshore eruption will generate hazardous phenomena that may affect the marine environment to varying degrees: “Pyroclastic flows and surges can travel over water and thus are a potential hazard to ocean vessels. Airfall can also be expected to be significant at sea, particularly on the downwind side of the islands. Due to the proximity of the islands of the Lesser Antilles to each other, it is also likely that the effects of a volcanic eruption (especially ash fall) on one island will be felt on neighbouring islands. The hazard zones on the maps presented in this Atlas must therefore be envisaged as extending some distance offshore” (Lindsay et al., 2005a).
Although we experimented with different cartographic options for extending hazard zones offshore we could not come up with a satisfying solution and thus decided to only depict onshore hazard. Although this is also common practice elsewhere (e.g., for island states in the Southwest Pacific; Taylor, 2016) we suggest it is less than ideal, particularly in small islands which are often surrounded by abundant shipping, fishing and pleasure craft; indeed dealing with maritime hazards and exclusion zones is often one of the more difficult aspects of crisis management in these cases (e.g., Neal et al., 2010; Poland and Orr, 2014; US Coast Guard, 2017).
A challenge in this regard is estimating how far offshore hazard zones should extend, and how they should be depicted. Although difficult, this is a challenge that we should strive to meet, in order to avoid generating a skewed land-based impression of the hazard. When discussing our maps with the public and other stakeholders we have found it necessary to constantly explain the extension of the hazard zones offshore; clearly this would have been less of an issue had the maps accurately indicated that hazards can extend into the maritime zone. We note that the administrative volcanic crisis management maps used in Montserrat have routinely contained offshore exclusion zones (see http://www.mvo.ms and Wadge et al., 2014b). The Monserrat experience shows that once an eruption is underway defining offshore hazard zones becomes easier.
We only included volcanogenic tsunami in our hazard assessments for Kick ‘em Jenny and Caille, however we note that tsunamis may be generated by eruptions or landslides at any volcanic centre near the coast. We suggest this secondary hazard should be considered in more detail in future hazard assessments.
Learning From Analogue Eruptions
Where possible, the parameters of the eruption scenario used to derive the hazard maps were driven by evidence obtained from past eruptions, i.e., the geologic record of past activity at the volcano. We also looked to past historical activity in the region to get a sense of the scale and duration of phenomena that were otherwise only preserved in the geological record at neighbouring volcanoes. In developing our scenarios we were thus heavily influenced by the ongoing dome-forming eruption of Soufrière Hills on Montserrat, as well as the historical activity from the Soufrière on St Vincent. We do however acknowledge that analogues are most relevant when evidence exists that they are indeed suitable; in this regard, the ubiquitous presence of block and ash flow deposits (reflecting dome-collapse) throughout many islands of the Lesser Antilles lends weight to our use of the eruption of the Soufrière Hills on Montserrat as an analogue. However, in choosing an analogue we must always remember that our perspective of both the analogue and of the volcano we are using it for may be limited. Such limitations may encompass things that we are aware of, as well those we are not aware of, given that our understanding and knowledge of volcanism is itself limited. Indeed, one could take this one step further and suggest that our conceptual “mental” model for a specific volcano, influenced as it is by the evidence from the volcano as well as our own training and experience of volcanism, is itself an analogue for how that volcano may behave.
Stakeholder Engagement and Uptake
The maps produced for the Atlas were developed entirely by staff at The UWI Seismic Research Centre and did not include input from stakeholders such as emergency management officials. Despite this lack of involvement in the development of the maps, after production the maps were fully endorsed and used by the emergency management and disaster risk reduction community in the region. In contrast, there has been little uptake of the maps or available GIS shape files of defined hazard zones by other key stakeholders such as government physical and economic planning agencies. Indeed, development of infrastructure and services in red (very high hazard) zones on integrated hazard maps suggests that there is little use being made of the hazard information to guide long-term planning in most islands.
The use of the maps by the disaster management community (which is focused mainly on response and recovery) vs. the lack of use by other government agencies responsible for longer term planning is interesting. In particular, the integrated maps essentially show potential long-term hazard, which could be argued to be more relevant to long-term land-use planning than short-term crisis management. Whilst we acknowledge and appreciate the maps may be useful to the emergency management community in drafting response plans, we are disappointed they have not been deemed more useful to the agencies dealing with longer-term development. The reasons for this variance in uptake are not completely clear, although we do notice anecdotally that uptake is somewhat better in countries that have experienced past volcanic activity such as St. Vincent and Montserrat. The general lack of uptake may reflect either (a) a lack of adequate attention given regionally to long-term planning for disaster risk management (and when it does happen, volcanic hazard must compete with higher frequency hazards), or (b) deficiencies in the maps and their dissemination due to lack of engagement with potential users during map generation, or a combination of the two. There may also be a lack of understanding amongst planning authorities of how the maps can be best applied. In hindsight, we recognise we should have encouraged stakeholder involvement during the map-making process to ensure the final products provided information that was of use to all possible map users.
Conclusions and Recommendations
The Volcanic Hazard Atlas of the Lesser Antilles was developed in direct response to the demands of vulnerable island communities for data and information to help guide their present and future plans for potential activity at volcanoes in the region. The Atlas project brought together a large cross-section of scientists working on islands in both the English and French-speaking Caribbean to create a reference text that could be used for volcanic emergency management. The Atlas now stands as a valuable benchmark of the knowledge existing at the time on all aspects of volcanism in the Lesser Antilles. The associated maps have been used widely by island authorities to guide their contingency plans for volcanic emergencies and for public education and outreach. Importantly for this contribution, the project represented the first attempt to produce a simple map for each island showing different volcanic hazard zones generated by integrating data from all hazardous phenomena associated with the most likely future eruption scenario at that centre. These maps have proven to be a useful tool in the arsenal of national disaster management organisations as they attempt to cope with the challenges of navigating a safe space within the multi-hazard environment of the Lesser Antilles.
We have learned many lessons in the process of both map creation and the subsequent engagement with stakeholders in the region. We have attempted to summarise some of these lessons here, and are planning a revision of the Lesser Antilles volcanic hazard maps that will integrate knowledge and experience gained since the publication of the Atlas. We hope that some of these lessons might be useful for other maps makers, both in the Caribbean and beyond, to take into account when creating new or updating existing maps to be used by stakeholders, such as emergency managers and land-use planners. In particular, we conclude the following:
• We did not consult with potential map users when generating the hazard maps. We subsequently recognise that it is important to consider these needs when making design choices such as type of base map, use of colour and gradational boundaries, and indeed what to depict on the map, in order to ensure the maps are understood by the target audience in the way they were intended.
• Stakeholder uptake of our maps has been variable. In the future it would be worth investigating how to ensure more widespread use of hazard maps by civil authorities for long-term planning and development of communities exposed to volcanic hazard. This can perhaps be done through a co-creation map process whereby stakeholders are involved in map generation from the beginning to create a product that is relevant to their needs and also to ensure that the product is actually integrated into their own planning process.
• We did not include offshore hazards on our maps and suggest that future map makers should pay strong attention to how to depict hazard as it extends beyond the shoreline. Some effort should be put into modelling how block and ash flows and lahars might behave as they reach the sea, and to determine the tsunamigenic potential of subaerial volcanic eruptions and landslides in the region.
• The mapping of hazards within our scenarios was extremely simplistic. For future iterations of the maps we recommend computer-assisted modelling of both lahars and pyroclastic flows to generate more realistic hazard footprints, to capture among other things the lateral dispersal of lahars and pyroclastic flow hazard as these reach the flatter coastal areas. We did not map regional ash hazard, however it is clear that an eruption on one island will affect other islands in the region. This is something that could also be addressed by modelling. Models for both mass flow processes and tephra dispersal can be tested in and calibrated for the region by retrospectively recreating volcanic phenomena from past eruptions. The possibility of multiple eruptions or periods of elevated activity at several islands occurring at the same time should also be considered.
• We did not include a probabilistic element in our hazard assessment. Numerous recent studies carried out on the various volcanoes of the Lesser Antilles, especially those in Dominica and Saint Lucia (e.g., Lindsay et al., 2013; Howe et al., 2014, 2015a,b; Boudon et al., 2017), together with recent monitoring data and recent developments in methods for probabilistic volcanic hazard assessment (e.g., Connor et al., 2015; Bear-Crozier et al., 2016 and references therein), means that this is an approach that can be trialled in future studies.
• Our systematic approach to integrating individual hazard data into hazard zones generally worked well as it enabled a consistent suite of comparable products. However, it did lead to some issues such as missing or strangely shaped zones, providing arguably too much detail in some cases (e.g., St Vincent) and not enough in others (e.g., Saba). We suggest that rather than applying strict criteria, a better approach might be to treat the integration of hazards on a case-by-case basis to ensure the final product meets map users' needs.
Author Contributions
JL: Managed the original hazard map project (the Hazard Atlas) upon which this manuscript is based, and led the manuscript writing process. RR: Wrote several chapters in the Atlas and contributed to the manuscript by editing drafts and assisting with figures, as well as providing information on stakeholder engagement.
Conflict of Interest Statement
The authors declare that the research was conducted in the absence of any commercial or financial relationships that could be construed as a potential conflict of interest.
Acknowledgments
Funding for the Atlas was obtained from the Caribbean Development Bank (CDB) through its Disaster Mitigation Facility for the Caribbean (a partnership between CDB and USAID Office of Foreign Disaster Assistance). We would like to thank the staff of the (then) UWI Seismic Research Unit who contributed to the development of the Atlas. We thank two reviewers whose comments led to improvements in the manuscript, and we are grateful to Luis Lara for prompt editorial handling.
References
Anderson, T., and Flett, J. S. (1903). Report on the eruption of the Soufrière of St. Vincent in 1902 and on a visit to Montagne Pelée in Martinique. Part, I. Philos. Trans. R. Soc. Lond. A 200, 353–553. doi: 10.1098/rsta.1903.0010
Arculus, R. J. (1976). Geology and geochemistry of the alkali basalt-andesite association of grenada, Lesser Antilles Island. Arct. Geol. Soc. Am. Bull. 87, 612–624. doi: 10.1130/0016-7606(1976)87<612:GAGOTA>2.0.CO;2
Aspinall, W. P., Sigurdsson, H., and Shepherd, J. B. (1973). Eruption of the Soufrière Volcano on St. Vincent Island, 1971-1972. Science 181, 117–124. doi: 10.1126/science.181.4095.117
Aspinall, W. P., Sigurdsson, H., Shepherd, J. B., Almorales, H., and Baker, P. E. (1972). Eruption of the Soufrière Volcano on St. Vincent Island, 1971-72. Cambridge, MA: Smithsonian Institute for Short-Lived Phenomena.
Baker, P. E. (1985). Volcanic hazards on St. Kitts and Montserrat, West Indies. J. Geol. Soc. 142, 279–295. doi: 10.1144/gsjgs.142.2.0279
Bear-Crozier, A. N., Miller, V., Newey, V., Horspool, N., and Weber, R. (2016). Probabilistic Volcanic Ash Hazard Analysis (PVAHA) I: development of the VAPAH tool for emulating multi-scale volcanic ash fall analysis. J. Appl. Volcanol. 5:3. doi: 10.1186/s13617-016-0043-4
Bezard, R., Davidson, J. P., Turner, S., Macpherson, C. G., Lindsay, J. M., and Boyce, A. J. (2014). Assimilation of sediments embedded in the oceanic arc crust: myth or reality? Earth Planet. Sci. Lett. 395, 51–60. doi: 10.1016/j.epsl.2014.03.038
Blong, R. J. (1984). Volcanic Hazards - A Sourcebook on the Effects of Eruptions. North Ryde, NSW: Academic Press Australia.
Boudon, G., Balcone-Boissard, H., Solaro, C., and Martel, C. (2017). Revised chronostratigraphy of recurrent ignimbritic eruptions in Dominica (Lesser Antilles Arc): implications on the behavior of the magma plumbing system. J. Volcanol. Geother. Res. 343, 135–154. doi: 10.1016/j.jvolgeores.2017.06.022
Boudon, G., and Lajoie, J. (1989). The 1902 péléean deposits in the Fort Cemetery of St. Pierre, Martinique: a model for the accumulation of turbulent nuées ardentes. J. Volcanol. Geother. Res. 38, 113–129. doi: 10.1016/0377-0273(89)90033-4
Brazier, S., Davis, A. N., Sigurdsson, H., and Sparks, R. S. J. (1982). Fallout and deposition of volcanic ash during the 1979 Explosive eruption of the soufrière of St. Vincent. . J. Volcanol. Geotherm. Res. 14, 335–359. doi: 10.1016/0377-0273(82)90069-5
Brown, G. M., Holland, J. G., Sigurdsson, H., Tomblin, J. F., and Arculus, R. J. (1977). Geochemistry of the lesser antilles volcanic island arc. Geochim. Cosmochim. Acta 41, 785–801. doi: 10.1016/0016-7037(77)90049-7
Cheong, L., Bleisch, S., Kealy, A., Tolhurst, K., Wilkening, T., and Duckham, M. (2016). Evaluating the impact of visualization of wildfire hazard upon decision-making under uncertainty. Int. J. Geogr. Inf. Sci. 30, 1377–1404. doi: 10.1080/13658816.2015.1131829
Connor, C., Bebbington, M., and Marzocchi, W. (2015). “Chapter 51 – Probabilistic volcanic hazard assessment,” in The Encyclopedia of Volcanoes, 2nd Edn, eds H. Sigurdsson, B. Houghton, S. McNutt, H. Rymer, and J. Stix (Amsterdam: Academic Press).897–910.
Crandell, D. R., Booth, B., Kasumadinata, K., Shimozuru, D., Walker, G. P. L., and Westercamp, D. (1984). Source-Book for Volcanic-Hazards Zonation. Paris: Unesco.
Druitt, T. H., and Kokelaar, B. P. (eds.). (2002). The Eruption of Soufrière Hills Volcano, Montserrat, from 1995 to 1999. London: Geological Society; Memoir.
Fisher, R. V., and Heiken, G. (1982). Mt. Pele, martinique: may 8 and 20, 1902 pyroclastic flows and surges. J. Volcanol. Geotherm. Res. 13, 339–371. doi: 10.1016/0377-0273(82)90056-7
Fiske, R. S. (1984). “Volcanologists, journalists, and the concerned local public: a tale of two crises in the Eastern Caribbean,”in: National Research Council, Geophysics study committee, Studies in Geophysics, Explosive volcanism: Inception, evolution, and hazards (Washington, DC: National Academy Press), 170–176.
Haynes, K., Barclay, J., and Pidgeon, N. (2007). Volcanic hazard communication using maps: an evaluation of their effectiveness. Bull. Volcanol. 70, 123–138. doi: 10.1007/s00445-007-0124-7
Howe, T. M., Lindsay, J. M., and Shane, P. (2015a). Evolution of young andesitic–dacitic magmatic systems beneath Dominica, Lesser Antilles. J. Volcanol. Geother. Res. 297, 69–88. doi: 10.1016/j.jvolgeores.2015.02.009
Howe, T. M., Lindsay, J. M., Shane, P., Schmitt, A. K., and Stockli, D. F. (2014). Re-evaluation of the Roseau Tuff eruptive sequence and other ignimbrites in Dominica, Lesser Antilles. J. Quatern. Sci. 29, 531–546. doi: 10.1002/jqs.2723
Howe, T. M., Schmitt, A. K., Lindsay, J. M., Shane, P., and Stockli, D. F. (2015b). Time scales of intra-oceanic arc magmatism from combined U-Th and (U-Th)/He zircon geochronology of Dominica, Lesser Antilles. Geochem. Geophys. Geosyst. 16, 347–365. doi: 10.1002/2014GC005636
Lindsay, J. M., Calder, E., Thompson, M. A., Ewert, J. W., and Leonard, G. S. (2017). State of the Volcanic Hazard Map: Development and Preliminary Results of a World-Wide Survey of Official Volcanic Hazard Maps. Portland, OR: IAVCEI Scientific Assembly.
Lindsay, J. M., Robertson, R. E. A., Shepherd, J. B., and Ali, S. (eds.) (2005a). Volcanic Hazard Atlas of the Lesser Antilles. St. Augustine: Seismic Research Center.
Lindsay, J. M., and Shepherd, J. B. (2005). “Kick ém Jenny and Ile de Caille,” in Volcanic Hazard Atlas of the Lesser Antilles, eds J. M. Lindsay, R. E. A. Robertson, J. B. Shepherd, and S. Ali (St. Augustine: Seismic Research Center), 279.
Lindsay, J. M., Shepherd, J. B., and Wilson, D. (2005b). Volcanic and scientific activity at Kick ‘em Jenny submarine volcano 2001-2002: implications for volcanic hazard in the southern Grenadines, Lesser Antilles. Nat. Hazards 34, 1–24. doi: 10.1007/s11069-004-1566-2
Lindsay, J. M., Stasiuk, M., and Shepherd, J. (2003). Geological history and potential hazards of the late-Pleistocene to recent plat pays volcanic complex, Dominica, Lesser Antilles Bull. Volcanol. 65, 201–220. doi: 10.1007/s00445-002-0253-y
Lindsay, J. M., Trumbull, R. B., Schmitt, A. K., Stockli, D. F., Shane, P. A., and Howe, T. M. (2013). Volcanic stratigraphy and geochemistry of the Soufrière Volcanic Centre,(2018) Saint Lucia with implications for volcanic hazards. J. Volcanol. Geother. Res. 258, 126–142. doi: 10.1016/j.jvolgeores.2013.04.011
Lindsay, J. M., Trumbull, R. B., and Siebel, W. (2005c). Geochemistry and petrogenesis of late Pleistocene to recent volcanism in Southern Dominica, Lesser Antilles. J. Volcanol. Geotherm. Res. 148, 253–294. doi: 10.1016/j.jvolgeores.2005.04.018
Macdonald, R., Hawkesworth, C. J., and Heath, E. (2000). The Lesser Antilles volcanic chain: a study in arc magmatism. Earth Sci. Rev. 49, 1–76. doi: 10.1016/S0012-8252(99)00069-0
Nave, R., Isaia, R., Vilardo, G., and Barclay, J. (2010). Re-assessing volcanic hazard maps for improving volcanic risk communication: application to Stromboli Island, Italy. J. Maps 2010, 260–269. doi: 10.4113/jom.2010.1061
Neal, C. A., Murray, T. L., Power, J. A., Adleman, J. N., Whitmore, P. M., and Osiensky, J. M. (2010). “Hazard information management, interagency coordination, and impacts of the 2005–2006 eruption of Augustine Volcano,” in The 2006 eruption of Augustine Volcano, Vol. 1769. eds J. A. Power, M. L. Coombs, and J. T. Freymueller (Geological Survey Professional Paper), 645–667. Available online at: https://pubs.usgs.gov/pp/1769/chapters/p1769_chapter28.pdf
Norton, G., Harford, C., and Young, S. (2001). Volcanic Geology of Montserrat, West Indies. Field Guide. Montserrat, WI: Montserrat Volcano Observatory.
Olson, J. M., and Brewer, C. A. (1997). An evaluation of color selections to accommodate map users with color-vision impairments. Ann. Assoc. Am. Geogr. 87, 103–134. doi: 10.1111/0004-5608.00043
Poland, M. P., and Orr, T. R. (2014). Identifying hazards associated with lava deltas. Bull. Volcanol. 76:880. doi: 10.1007/s00445-014-0880-0
Pyle, D. M., Barclay, J., and Armijos, M. J. (2018). The 1902–3 eruptions of the Soufrière, St Vincent: Impacts, relief and response. J. Volcanol. Geother. Res. [Epub ahead of print]. doi: 10.1016/j.jvolgeores.2018.03.005.
Robertson, R. E. A. (1992). Volcanic Hazard and Risk Assessment of the Soufrière Volcano, St. Vincent, West Indies. MPhil Thesis (unpublished), University of Leeds.
Robertson, R. E. A. (1995). An Assessment of the Risk from Future Eruptions of the Soufrière Volcano of St. Vincent, West Indies. Nat. Hazards 11, 163–191. doi: 10.1007/BF00634531
Robertson, R. E. A. (2003). The Volcanic Geology of the Pre- Soufrière Rocks of St. Vincent, West Indies. Ph.D. Thesis, University of the West Indies.
Robertson, R. E. A. (2005). “St. Vincent,” in Volcanic Hazard Atlas of the Lesser Antilles, eds J. M. Lindsay, R. E. A. Robertson, J. B. Shepherd, and S. Ali (St. Augustine, Seismic Research Center), 279.
Robson, G. R., and Tomblin, J. F. (1966). Catalogue of the Active Volcanoes of the World Including Solfatara Fields, Part 20, the West Indies. Rome: International Association of Volcanologists, 1–56.
Roobol, M. J., Wright, J. V., and Smith, A. L. (1981). Revision of the pyroclastic stratigraphy of Mt. Misery volcano, St. Kitts, Lesser Antilles 14C Ages and recognition of pyroclastic flow deposits. J. Geol. Soc. Lond. 138, 713–718. doi: 10.1144/gsjgs.138.6.0713
Rowley, K. C. (1974). The Late Pleistocene Pyroclast Fall Deposits of Soufrière, St. Vincent. MSc thesis, University of the West Indies.
Rowley, K. R. (1978). Stratigraphy and Geochemistry of the Soufrière Volcano, St. Vincent, W.I. Ph.D. thesis (unpublished), University of the West Indies, St. Augustine.
Severtson, D. J., and Vatovec, C. (2012). The theory-based influence of map features on risk beliefs: self-reports of what is seen and understood for maps depicting an environmental health hazard. J. Health Commun. 17, 836–856. doi: 10.1080/10810730.2011.650933
Shepherd, J. B. (1989). “Eruptions, eruption precursors and related phenomena in the Lesser Antilles,” in Volcano Hazards: Assessment and Monitoring. IAVCEI Proceedings in Volcanology 1, ed J. Latter (Heidelberg: Springer-Verlag), 292–311.
Shepherd, J. B., Aspinall, W. P., Rowley, K. C., Pereira, J. A., Sigurdsson, H., Fiske, R. S., et al. (1979). The eruption of the Soufrière Volcano, St Vincent, April-June 1979. Nature 282, 24–28. doi: 10.1038/282024a0
Sigurdsson, H., and Carey, S. N. (1981). “Marine tephrochronology and quaternary explosive volcanism in the Lesser Antilles arc,” in Tephra Studies, eds S. Self and R. S. J. Sparks (Dordreht: D Riedel Publ Co), 255–280.
Smith, A. L., Roobol, M. J., Mattioli, G. S., Fryxell, J. E., Daly, G. E., and Fernandez, L. A. (2013). The volcanic geology of the mid-arc island of Dominica, Lesser Antilles: the surface expression of an island-arc batholith. Geol. Soc. Am. Colorado Special Pap.r 496:248. doi: 10.1130/2013.2496
Smith, A. L., Roobol, M. J., and Rowley, K. C. (1985). “Pyroclastic character of the active volcanoes of the northern Lesser Antilles,” in Proc of the 14th Latin Amer. Geol. Congr. (Trinidad), 467–473.
Smith, M. S., and Shepherd, J. B. (1993). Preliminary investigations of the tsunami hazard of Kick ‘em Jenny submarine volcano. Nat. Hazards 7, 257–277.
Tanguy, J.-C. (2004), Rapid dome growth at Montagne Pelée during the early stages of the 1902-1905 eruption: a reconstruction from Lacroix's data. Bull. Volcanol. 66, 615–621. doi: 10.1007/s00445-004-0344-z.
Taylor, P.W. (ed.). (2016). Volcanic Hazards and Emergency Management in the Southwest Pacific. SPC Technical Bulletin SPC00017, Suva.
Thirlwall, M. F., and Graham, A. M. (1984). Evolution of High-Ca, high-Sr C-series basalts from Grenada, Lesser Antilles - the effects of intra-crustal contamination. J. Geol. Soc. Lond. 141, 427–445. doi: 10.1144/gsjgs.141.3.0427
Thompson, M. A., Lindsay, J. M., and Gaillard, J. (2015). The influence of probabilistic volcanic hazard map properties on hazard communication. J. Appl. Volcanol. 4:6. doi: 10.1186/s13617-015-0023-0
Thompson, M. A., Lindsay, J. M., and Leonard, G. S. (2017). “More than meets the eye: Volcanic hazard map design and visual communication,” in Observing the Volcano World: Volcano Crisis Communication, eds C. Fearnley, D. Bird, G. Jolly, K. Haynes, and B. McGuire (Springer), 1–20.
US Coast Guard (2017). Safety Zone; Pacific Ocean, Kilauea, Lava Flow Ocean Entry on Southeast Side of Island of Hawaii. Federal Register 82 (188). Rules and Regulations, 45461.
Wadge, G. (1984). A Preliminary Volcanic Hazards Study of Dominica, West Indies. Special Publication 1984/85, Seismic Research Unit, UWI, St. Augustine.
Wadge, G. (1985). Morne Patates volcano, southern Dominica Lesser Antilles. Geol. Mag. 3, 253–260. doi: 10.1017/S0016756800031460
Wadge, G., and Isaacs, M. C. (1988). Mapping the volcanic hazards from Soufrière Hills Volcano, Montserrat, West Indies using an image processor. J. Geol. Soc. 145, 541–551. doi: 10.1144/gsjgs.145.4.0541
Wadge, G., Robertson, R. E. A., and Voight, B. (eds.) (2014a). The Eruption of Soufrière Hills Volcano, Montserrat from 2000 to 2010. London: Geological Society; Memoir.
Wadge, G., and Shepherd, J. B. (1984). Segmentation of the Lesser Antilles subduction zone. Earth Planet. Sci. Lett. 71, 297–304. doi: 10.1016/0012-821X(84)90094-3
Wadge, G., Voight, B., Sparks, R. S. J., Cole, P. D., Loughlin, S. C., and Robertson, R. E. A. (2014b). “An overview of the eruption of Soufriere Hills Volcano, Montserrat from 2000 to 2010,” in The Eruption of Soufriere Hills Volcano, Montserrat from 2000 to 2010, eds G. Wadge, R. E. A. Robertson, and B. Voight (London, Memoirs, Geological Society No 39), 1–40.
Keywords: volcanic hazard map, Dominica, St. Vincent, stakeholder, scenario
Citation: Lindsay JM and Robertson REA (2018) Integrating Volcanic Hazard Data in a Systematic Approach to Develop Volcanic Hazard Maps in the Lesser Antilles. Front. Earth Sci. 6:42. doi: 10.3389/feart.2018.00042
Received: 22 February 2018; Accepted: 06 April 2018;
Published: 20 April 2018.
Edited by:
Luis E. Lara, Sernageomin, ChileReviewed by:
Sarah Elizabeth Ogburn, United States Geological Survey, United StatesAlessandro Tibaldi, Università degli Studi di Milano Bicocca, Italy
Copyright © 2018 Lindsay and Robertson. This is an open-access article distributed under the terms of the Creative Commons Attribution License (CC BY). The use, distribution or reproduction in other forums is permitted, provided the original author(s) and the copyright owner are credited and that the original publication in this journal is cited, in accordance with accepted academic practice. No use, distribution or reproduction is permitted which does not comply with these terms.
*Correspondence: Jan M. Lindsay, j.lindsay@auckland.ac.nz