
94% of researchers rate our articles as excellent or good
Learn more about the work of our research integrity team to safeguard the quality of each article we publish.
Find out more
ORIGINAL RESEARCH article
Front. Earth Sci., 24 February 2017
Sec. Environmental Informatics and Remote Sensing
Volume 5 - 2017 | https://doi.org/10.3389/feart.2017.00017
Many applied problems arising in agricultural monitoring and food security require reliable crop maps at national or global scale. Large scale crop mapping requires processing and management of large amount of heterogeneous satellite imagery acquired by various sensors that consequently leads to a “Big Data” problem. The main objective of this study is to explore efficiency of using the Google Earth Engine (GEE) platform when classifying multi-temporal satellite imagery with potential to apply the platform for a larger scale (e.g., country level) and multiple sensors (e.g., Landsat-8 and Sentinel-2). In particular, multiple state-of-the-art classifiers available in the GEE platform are compared to produce a high resolution (30 m) crop classification map for a large territory (~28,100 km2 and 1.0 M ha of cropland). Though this study does not involve large volumes of data, it does address efficiency of the GEE platform to effectively execute complex workflows of satellite data processing required with large scale applications such as crop mapping. The study discusses strengths and weaknesses of classifiers, assesses accuracies that can be achieved with different classifiers for the Ukrainian landscape, and compares them to the benchmark classifier using a neural network approach that was developed in our previous studies. The study is carried out for the Joint Experiment of Crop Assessment and Monitoring (JECAM) test site in Ukraine covering the Kyiv region (North of Ukraine) in 2013. We found that GEE provides very good performance in terms of enabling access to the remote sensing products through the cloud platform and providing pre-processing; however, in terms of classification accuracy, the neural network based approach outperformed support vector machine (SVM), decision tree and random forest classifiers available in GEE.
Information on land cover/land use (LCLU) geographical distribution over large areas is extremely important for many environmental and monitoring tasks, including climate change, ecosystem dynamics analysis, food security, and others. Reliable crop maps can be used for more accurate agriculture statistics estimation (Gallego et al., 2010, 2012, 2014), stratification purposes (Boryan and Yang, 2013), better crop yield prediction (Kogan et al., 2013a,b; Kolotii et al., 2015), and drought risk assessment (Kussul et al., 2010, 2011; Skakun et al., 2016b). During the past decades, satellite imagery became the most promising data source for solving such important tasks as LCLU mapping. Yet, at present, there are no globally available satellite-derived crop specific maps at high-spatial resolution. Only coarse-resolution imagery (>250 m spatial resolution) has been utilized to derive global cropland extent (e.g., GlobCover, MODIS; Fritz et al., 2013). At present, a wide range of satellites provide objective, open and free high spatial resolution data on a regular basis. These new opportunities allow one to build high-resolution LCLU maps on a regular basis and to assess LCLU changes for large territories (Roy et al., 2014). With launches of Sentinel-1, Sentinel-2, Proba-V and Landsat-8 remote sensing satellites, there will be generated up to petabyte of raw (unprocessed) images per year. The increasing volume and variety of remote sensing data, dubbed as a “Big Data” problem, creates new challenges in handling datasets that require new approaches to extracting relevant information from remote sensing (RS) data from data science perspective (Kussul et al., 2015; Ma et al., 2015a,b). Generation of high resolution crop maps for large areas (>10,000 sq. km) using Earth observation data from space requires processing of large amount of satellite images acquired by various sensors. Images acquired at different dates during crop growth period are usually required to discriminate certain crop types. The following issues should be addressed while providing classification of multi-temporal satellite images for large areas: (i) non-uniformity of coverage of ground truth data and satellite scenes; (ii) seasonal differentiation of crop groups (e.g., winter and summer crops) and the need for incremental classification (to provide both in season and post season maps); (iii) the need to store, manage and seamlessly process large amount of data (big data issues).
The Google Earth Engine (GEE) provides a cloud platform to access and seamlessly process large amount of freely available satellite imagery, including those acquired by the Landsat-8 remote sensing satellite. The GEE also provides a set of the state-of-the-art classifiers for pixel-based classification that can be used for crop mapping. Though these methods are well-documented in the literature, there were no previous studies to compare all these methods for classification of multi-temporal satellite imagery for large scale crop mapping. Since the GEE platform does not include any neural network based models, we add a neural network based classifier (Skakun et al., 2007; Kussul et al., 2016; Lavreniuk et al., 2016; Skakun et al., 2016a) to the analysis to provide a more complete comparison. Hence, the paper aims to explore efficiency of using the GEE platform when classifying multi-temporal satellite imagery for crop mapping with potential to apply the platform for a larger scale (e.g., country level) and multiple sensors (e.g., Landsat-8 and Sentinel-2). Results are presented for a highly heterogeneous landscape with multiple cropping systems on the Joint Experiment of Crop Assessment and Monitoring (JECAM) test site in Ukraine with the area of more than 28,000 km2.
The proposed study is carried out for the Joint Experiment for Crop Assessment and Monitoring (JECAM) test site in Ukraine. Agriculture is a major part of Ukrainian's economy accounting for 12% of the Ukrainian Gross Domestic Product (GDP). Globally, Ukraine was the largest sunflower producer (11.6 MT) and exporter, and the ninth largest wheat producer (22.2 MT) in the world in 2013, according to the U.S. Department of Agriculture (USDA) Foreign Agricultural Service (FAS) statistics.
The JECAM test site in Ukraine was established in 2011 as part of the collaborative activities within the GEOGLAM Community of Practice. The site covers the administrative region of Kyiv region with the geographic area of 28,100 km2 and almost 1.0 M ha of cropland (Figure 1). Major crop types in the region include: winter wheat, maize, soybeans, vegetables, sunflower, barley, winter rapeseed, and sugar beet. The crop calendar is September-July for winter crops, and April-October for spring and summer crops (Table 1). Fields in Ukraine are quite large with size generally ranging up to 250 ha.
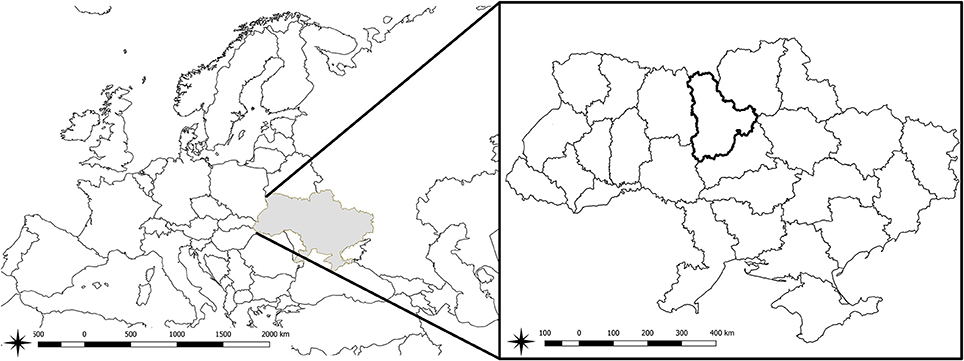
Figure 1. Location of Ukraine and JECAM test site in Ukraine (Kyiv region, marked with bold boundaries).
Ground surveys to collect data on crop types and other land cover classes were conducted in 2013 in Kyiv region (Figure 2). European Land Use and Cover Area frame Survey (LUCAS) nomenclature was used in this study as a basis for land cover/land use types. In total, 386 polygons were collected covering the area of 22,700 ha (Table 2). Data were collected along the roads following the JECAM adopted protocol (Waldner et al., 2016) using mobile devices with built-in GPS. All surveyed fields were randomly split into training set (50%) to train the classifiers and testing set (50%) for testing purposes. Fields were selected in such a way so there is no overlap between training and testing sets. All classification results, in particular overall accuracy (OA), user's (UA), and producer's (PA) accuracies are reported for testing set (Congalton, 1991; Congalton and Green, 2008). The input features were classified into one of the 13 classes.
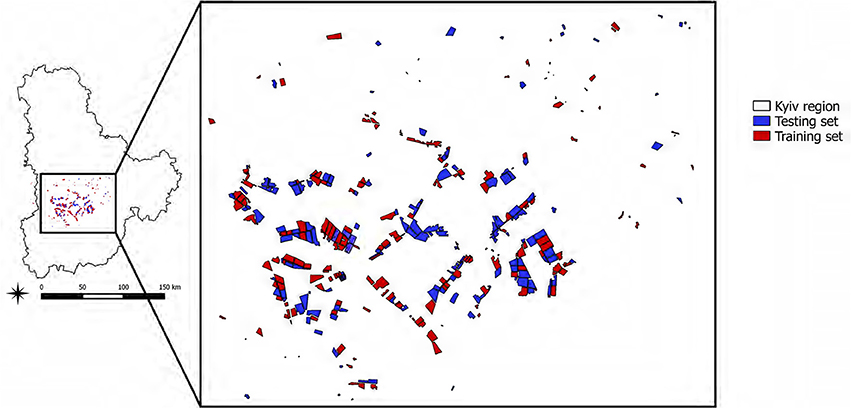
Figure 2. Location of fields surveyed during ground measurements in 2013. These data were used to train and assess performance of classifiers.
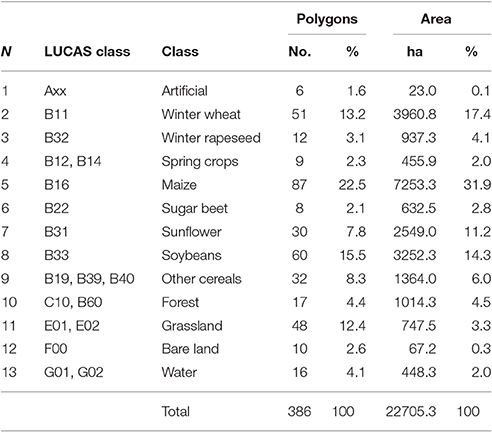
Table 2. Number of polygons and total area of crops and land cover types collected during the ground survey in 2013.
Remote sensing images acquired by the Operational Land Imager (OLI) sensor aboard Landsat-8 satellite were used for crop mapping over the study region. Landsat-8/OLI acquires images in eight spectral bands (bands 1–7, 9) at 30 m spatial resolution and in panchromatic band 8 at 15 m resolution (Roy et al., 2014). Only bands 2 through 7 acquired at different time periods were used for crop classification maps. Bands 1 and 9 were not used due to strong atmospheric absorption. Three scenes with path/row coordinates 181/24, 181/25, and 181/26 covered the test site region. Table 3 summarizes dates of image acquisitions and the fraction of missing values in images due to clouds and shadows.
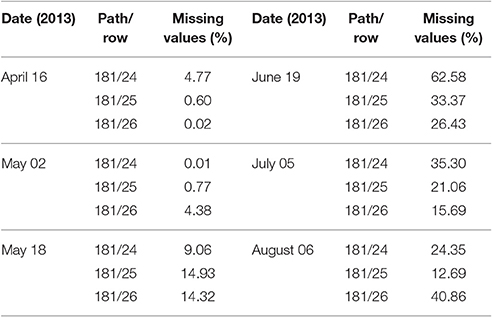
Table 3. List of Landsat-8/OLI image acquisitions and estimate of missing values due to clouds and shadows.
The main issues that need to be addressed while dealing with satellite imagery for large areas (such as Kyiv region) are a non-regular coverage over the region and the presence of missing data due to the clouds and shadows. Therefore, before feeding satellite data to the classifiers, a pre-processing step should be performed to fill in missing values due to clouds and shadows. At present, there is no a standard approach for dealing with these issues. Compositing is a very popular approach, however missing values can still happen in composite products (Yan and Roy, 2014). Another approach is to fill gaps using image processing techniques or ancillary data such as MODIS (Gao et al., 2006; Roy et al., 2008; Hilker et al., 2009). The main issue with this approach is spatial discrepancy between the 250 and 500 m MODIS products and the 30 m Landsat imagery. In this study, two types of approaches were explored: (i) compositing products available in GEE, so to benefit from products already available in GEE; (ii) restored multi-temporal images without involving ancillary data (Skakun and Basarab, 2014).
Different composites derived from Landsat-8 imagery and available in GEE were analyzed in the study. Landsat 8 8-Day Top-of-atmosphere (TOA) Reflectance Composites were used from GEE (Figure 3). As to the time of composition, 8 day composites were selected over 32 day composites to have a better temporal resolution. The reason for that is that 32 composites are composed based on the latest image, and this latest image can be of not the best quality. These Landsat-8 composites are made from Level L1T orthorectified scenes, using the computed TOA reflectance. The composites include all the scenes in each 8-day period beginning from the first day of the year and continuing to the 360th day of the year. The last composite of the year, beginning on day 361, will overlap the first composite of the following year by 3 days. All the images from each 8-day period are included in the composite, with the most recent pixel on top.
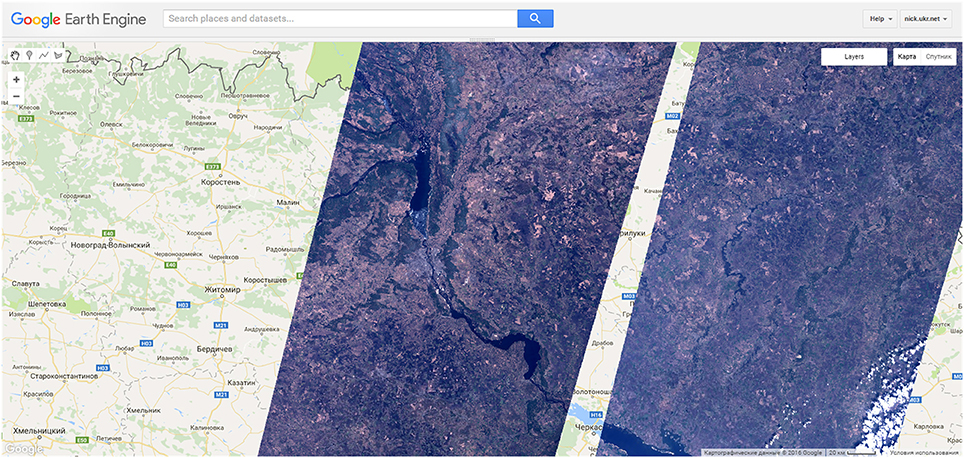
Figure 3. An example of the Landsat-8 8-Day TOA Reflectance Composites products over the study area for 15.04.2013.
The following pre-processing steps were applied for all Landsat-8 images:
1. Conversion of digital numbers (DNs) values to the TOA reflectance values using conversion coefficients in the metadata file (Roy et al., 2014).
2. To decrease an impact of atmosphere to the image quality conversion from the TOA reflectance to the surface reflectance (SR) has been done using the Simplified Model for Atmospheric Correction (SMAC; Rahman and Dedieu, 1994). The source code for the model was acquired from http://www.cesbio.ups-tlse.fr/multitemp/?p=2956. Parameters of the atmosphere to run the model (in particular, aerosol optical depth) were acquired from the Aeronet network's station in Kyiv (geographic coordinates +50.374N and +30.497E). The differences between TOA and SR satellite image is shown in Figure 4.
3. Detection of clouds and shadows were done using Fmask algorithm (Zhu and Woodcock, 2012). For this, a stand alone application was used from https://code.google.com/p/cfmask/.
4. Landsat-8 satellite images were reconstructed from missing pixel values (clouds and shadows) using self-organizing Kohonen maps (SOMs; Skakun and Basarab, 2014).
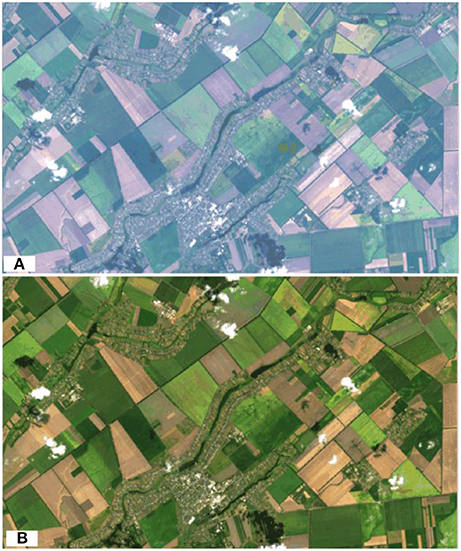
Figure 4. An example of TOA (A) and SR (B) Landsat-8 image acquired on the 8th of August 2013. A true color composition of Landsat-8 bands 4-3-2 is shown.
These pre-processing steps were performed outside GEE platform. After these products were generated they were uploaded in the GEE cloud platform for the further classification using classification algorithms available in GEE.
In the study, classification of multi-temporal satellite imagery was performed at per-pixel basis. Multiple classification techniques were evaluated in the study. At first, all classification algorithms available in GEE were analyzed and used for classifying multi-temporal 8-days Landsat-8 TOA composites from GEE. Then, the best classification algorithms in terms of overall classification accuracy were compared with the neural network classifier that used multi-temporal SR values generated outside GEE. The presented approaches were compared in terms of classification accuracy at pixel level. GEE offers several classification algorithms among which are decision trees, random forests, support vector machine (SVM), and Naïve Bayes classifier.
SVM became popular in a recent decade for solving problems in classification, regression, and novelty detection. An important property of SVMs is that the determination of the model parameters corresponds to a convex optimization problem, and so any local solution is also a global optimum (Bishop, 2006). The SVM approaches classification problem through the concept of the margin, which is defined to be the smallest distance between the decision boundary and any of the samples. The decision boundary is chosen to be the one for which the margin is maximized. The margin is defined as the perpendicular distance between the decision boundary and the closest of the data points. Maximizing the margin leads to a particular choice of decision boundary. The location of this boundary is determined by a subset of the data points, known as support vectors.
A decision tree (DT) classifier is built from a set of training data using the concept of information entropy. At each node of the tree, one attribute of the data that most effectively splits its set of samples into subsets enriched in one class or the other is selected. Its criterion is the normalized information gain that results from choosing an attribute for splitting the data. The attribute with the highest normalized information gain is chosen to make the decision. The algorithm then recurs on the smaller sublists. One disadvantage of the DT classifier is the considerable sensitivity to the training dataset, so that a small change to the training data can result in a very different set of subsets (Bishop, 2006).
Since the major problem of the DT classifier is overfitting, RF overcomes it by constructing an ensemble of DTs (Breiman, 2001). More specifically, RF operates by constructing a multitude of DT at training time and outputting the class that is the mode of the classes (classification) of the individual trees. RFs correct for DT habit of overfitting to their training set.
Other classifiers included in the GEE platform that are less popular in the remote sensing community:
Multinomial logistic regression is generalization of linear regression using the softmax transformation function and the main task is to minimize an error function by taking the negative logarithm of the likelihood, which means cross-entropy. The main difference from other models and algorithms is the outcome score that could be considered as a probability value (Bishop, 2006; Haykin, 2008).
This approach applied implementation of the linear perceptron to multiclass problems. The main idea of the perceptron is that the summing node of the neural model computes a linear combination of the inputs applied to its synapses, as well as incorporates an externally applied bias. The resulting sum, that is, the induced local field, is applied to a hard limiter. Accordingly, the neuron produces an output equal to 1 if the hard limiter input is positive, and -1 if it is negative (Haykin, 2008). Unfortunately, the perceptron is the simplest form of a neural network used for the classification of patterns said to be linearly separable.
Bayes classifier is a simple probabilistic approach which is based on the Bayes theorem and assumption of independence between input features. Within the learning procedure, it minimizes the average risk of classification error. Main advantage of this classifier is that it requires a small number of training data to compute the decision surface. At the same time, its derivation is contingent on the assumption that the underlying distributions be Gaussian, which may limit its area of application (Haykin, 2008).
It is the specialized version of the SVM which represents a histogram intersection kernel SVMs (IKSVMs). The runtime complexity of the classifier is logarithmic in the number of support vectors as opposed to linear for the standard approach. It allows to put IKSVM classifiers in the same order of computational cost for evaluation as linear SVMs (Maji et al., 2008).
The algorithm can be expressed as a linear-threshold algorithm that is similar to MultiClassPerceptron. However, while the perceptron uses an additive weight-update scheme, the Winnow classifier uses a multiplicative scheme. A primary advantage of this algorithm is that the number of mistakes that it makes is relatively little affected by the presence of large numbers of irrelevant attributes in the examples. The number of mistakes grows only logarithmically with the number of irrelevant attributes. Classifier is computationally efficient (both in time and space; Littlestone, 1988).
A variant of SVM with simple and effective sub-GrAdient SOlver algorithm for approximately minimizing the objective function that has a fast rate of convergence results. At each iteration, a single training example is chosen at random and used to estimate a sub-gradient of the objective, and a step with pre-determined step-size is taken in the opposite direction. Solution is found in probability solely due to the randomization steps employed by the algorithm and not due to the data set. Therefore, the runtime does not depend on the number of training examples and thus Pegasos is especially suited for large datasets (Shalev-Shwartz et al., 2011).
It should be noted that neural network (NN) classifiers are not available in GEE. Our proposed neural network approach based on committee of NNs, in particular Multi-Layer Perceptron (MLPs), is utilized to improve performance of individual classifiers. The MLP classifier has a hyperbolic tangent activation function for neurons in the hidden layer and logistic activation function in the output layer. Within training cross-entropy (CE) error function is minimized (Bishop, 2006)
where E(w) is the CE error function that depends on the neurons' weight coefficients w, T is the set of vectors of target outputs in the training set composed of N samples, K is the number of classes, tnk and ynk are the target and MLP outputs, respectively. In the target output for class k, all components of vector tn are set to 0, except for the k-th component which is set to 1. The CE error E(w) is minimized by means of the scaled conjugate gradient algorithm by varying weight coefficients w (Bishop, 2006).
A committee of MLPs was used to increase performance of individual classifiers. The committee was formed using MLPs with different parameters trained on the same training data. Outputs from different MLPs were integrated using the technique of average committee. Under this technique the average class probability over classifiers is calculated, and the class with the highest average posterior probability for the given input sample is selected.
Ensemble based neural network model for crop classification was recently validated in the JECAM experiment within study areas in five different countries and agriculture conditions, and provided the best result compare to SVM, maximum likelihood, decision tree and logit regression (Waldner et al., 2016).
Therefore, this approach is used as a benchmark for assessing classification techniques available in GEE.
The first set of experiments was carried out to select the best input (TOA 8-day composites or restored values) and evaluating different classifiers available in GEE. Table 4 shows the derived OA on polygons from a testing set using TOA 8-day composites as inputs. The best performance was achieved for CART at 75%. Somewhat surprisingly, an ensemble of DTs, i.e., RF, was outperformed by CART and yielded only 68%. Logistic regression (GMO Max Entropy) gave 72% accuracy. Linear classifiers, MultiClassPerceptron and Winnow, provided up to 60% accuracy, while variants of SVM achieve moderate accuracy of 57%. Unfortunately, it was unable to produce stable classification results for SVM classifiers which usually resulted into the Internal Server Error on invocation from Python.
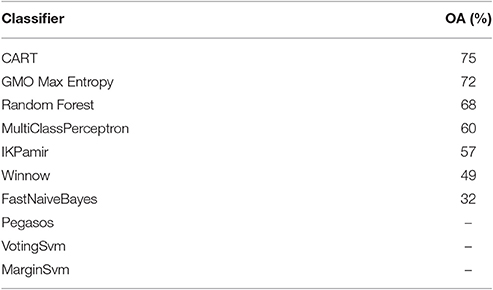
Table 4. Overall classification accuracy achieved by GEE classifiers for TOA 8-day composites as an input.
One of the best GEE classifiers (CART and RF) on atmospherically corrected Landsat-8 imagery were compared to the committee of NN that was implemented outside GEE, in the Matlab environment using a Netlab toolbox (http://www.aston.ac.uk/eas/research/groups/ncrg/resources/netlab). Table 5 summarizes classification metrics, in particular OA, PA, and UA for these three classification schemes. Committee of MLPs considerably outperformed DT-based classifiers: by +14.8% RF and by +7.8% DT.
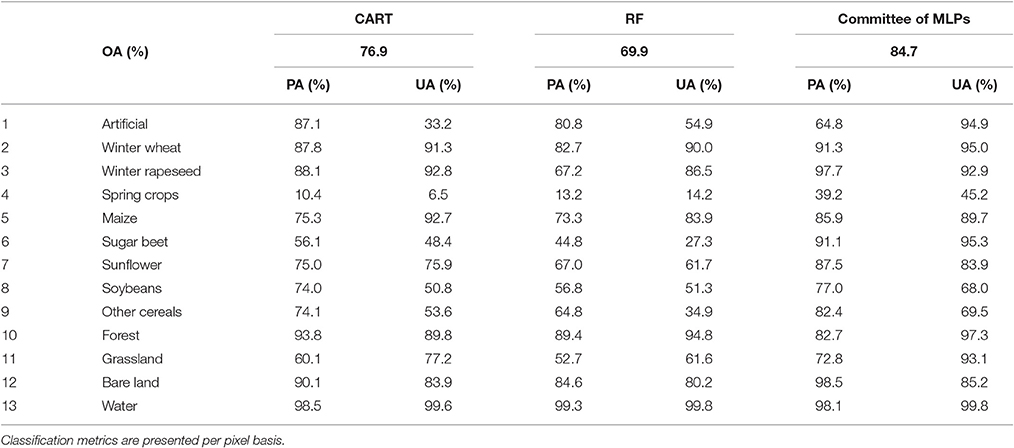
Table 5. Classification results for CART, RF, and committee of NN for atmospherically corrected and restored Landsat-8 imagery.
The GEE platform offers powerful capabilities in handling large volumes of remote sensing imagery that can be used, for example, for classification purposes such as crop mapping for large territories. In order to deal with irregular observation and missing values due to clouds and shadows, a compositing approach was applied. Several compositing products were available. Also, using the rich JavaScript and/or Python APIs, it is possible to filling missing values using MODIS images using, for example, approaches developed by Roy et al. (2008), Hilker et al. (2009), and Gao et al. (2006). But these are not trivial procedures, are not available at hand and require a lot of efforts from the end-user to be implemented. It substantially reduced the quality of classification. In particular, the best OA achieved on composites from the GEE was 75%, while on atmospherically corrected and restored images the achieved accuracy was almost 77%. Therefore, while GEE offers several built-in composites, substantial efforts (including programming) are required from the end user to generate the required input data sets and to remove clouds/shadow effects.
The GEE platforms provides a set of classification algorithms. The best results in the GEE were obtained for the DT-based classifiers, namely CART and RF. The best accuracy achieved on atmospherically corrected and restored Landsat-8 images was 76.9 and 69.9% for CART and RF, respectively. The classifier GMO Max Entropy shows better result than RF but there is no Python implementation (only Javascript). It is known that CART and RF tend to overfit and require fine-tuning. These accuracies were significantly lower than for the ensemble of MLPs that obtained 84.7% overall accuracy (Figure 5). Also, most SVM-based algorithms were not performing correctly within GEE, and therefore, performance of SVM was not possible to evaluate adequately.
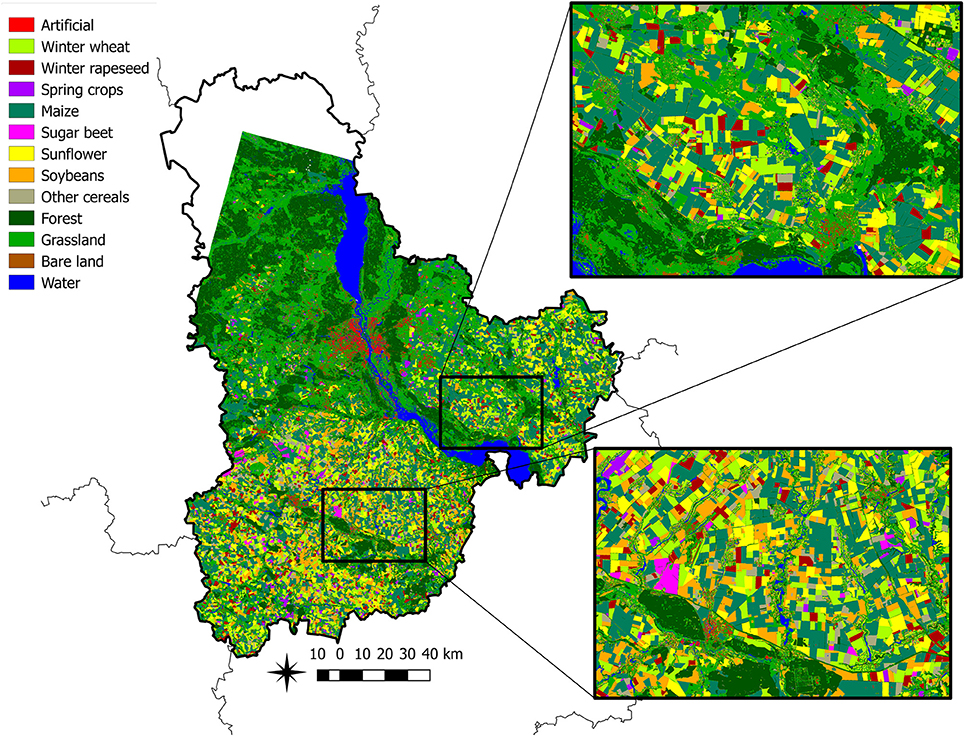
Figure 5. Final map obtained by classifying multi-temporal Landsat-8 imagery using a committee of MLP classifiers.
Accuracy of 85% is usually considered as target accuracy for agriculture applications (McNairn et al., 2009). Among classifiers, considered in this study, the target accuracy was almost achieved only by the MLPs ensemble. As to the specific crops, this accuracy was achieved for the following crops:
• winter wheat (class 2, PA = 91.3%, UA = 95.0%): the major confusion was with other cereals (class 9).
• winter rapeseed (class 3, PA = 97.7%, UA = 92.9%): the major confusion was with other cereals (class 9).
• maize (class 5, PA = 85.9%, UA = 89.7%): the main confusion was with the soybeans (class 8) and partly with sunflower (class 7).
• sugar beet (class 6, PA = 91.1%, UA = 95.3%): the main confusion was with other cereals (class 9).
The crops that did not pass the 85% threshold for PA and UA:
• spring crops (class 4, PA = 39.2%, UA = 45.2%): classification using available set of satellite imagery failed to produce reasonable performance for spring crops. The main confusion of this class is with other cereals (class 9). Confusion with other cereals can be explained by almost identical vegetation cycle of spring barley and other cereals produced in the region, namely with rye and oats.
• sunflower (class 7, PA = 87.5%, UA = 83.9%): main confusion was with soybeans, maize, and other cereals.
• soybeans (class 8, PA = 77.0%, UA = 68.0%): this is the least discriminated summer crop with main confusion with maize.
The activities within this paper were targeted on the comparison of pixel-based approaches to crop mapping in Ukraine, and exploring efficiency of the GEE cloud platform for large scale crop mapping with target to apply the platform for large areas involving multiple sensors and large volumes of data (at the order terabytes). Crop classification was performed by using multi-temporal Landsat-8 imagery over the JECAM tests site in Ukraine. Several inputs (products and composites) were evaluated by means of different classifiers available at GEE and our own approach. The classifiers included state-of-the-art techniques such as SVM, decision tree, random forest, and neural networks. Unlike other applications such as general land cover mapping or forest mapping, crop discrimination requires acquisition of multi-temporal profiles of crop growth dynamics. Therefore, images at multiple dates (or composites at several time intervals) need to be acquired or generated to discriminate particular crops. At the same, it causes the problem of missing data due to clouds and shadows when dealing with large territory, for example Kyiv oblast in the study. Therefore, it is very difficult to find an optimal solution in terms of temporal resolution and cloud-free composites, and missing data still occur. One way to handle this problem was to restore the missing values using self-organizing Kohonen maps. Another approach would be to use ancillary data such as MODIS to predict and fill in missing values in the Landsat time-series. But these are not trivial procedures, are not available at hand in GEE and require a lot of efforts from the end-user to be implemented. Therefore, 8-day TOA reflectance composites were used in GEE.
Better performance in terms of overall accuracy was shown for atmospherically corrected and restored Landsat images over the 8-day TOA reflectance composites from GEE. One of the explanations would that quality of restored data was better than TOA composites from GEE.
As to classification algorithms, ensemble of neural networks outperformed SVM, decision tree, and random forest classifiers. At some extent, it contradicts with recent studies where SMV and RF show better performance than neural networks. In our opinion, these are due: (i) in many cases, out-of-date neural networks techniques are used and not full potential of neural networks is explored in the remote sensing community; (ii) for SVM, DT and RF built in GEE parameters were used.
For the following agriculture classes an 85% threshold of producer's and user's accuracies was achieved: winter wheat, winter rapeseed, maize, and sugar beet. Such crops as sunflower, soybeans, and spring crops showed worse performance (below 85%).
In general, GEE provided very good performance in enabling access to remote sensing products through the cloud platform, and allowing seamless execution of complex workflow for satellite data processing. The user at once gets access to many satellite scenes or composites that are ready for processing. Although our particular study did not directly deal with large volumes of data, we still showed effectiveness of the GEE cloud platform to build large scale applications when accessing and processing satellite data with no reference to the volume. Indeed, the approaches addressed in the study can be applied at country level thanks to the capabilities offered in GEE. Another point addressed in the study was validity—in other words, what kind of accuracy can be expected for crop mapping with GEE when utilizing existing products and processing chains.
However, in our opinion, several improvements should be made to enable large scale crop mapping through GEE, especially within operational context:
• Provide at hand tools to deal with missing data due to clouds and shadows.
• To add neural networks classifiers (e.g., Tensorflow deep learning library) and allow optimization of existing classifiers especially SVM.
Future works should include:
• Large scale crop mapping (potentially at national scale) using optical and SAR imagery taking into account the coverage of Landsat-8, Proba-V, Sentinel-1, and Sentinel-2 imagery for the whole country (such as Ukraine).
• In the future we will implement parcel-based classification approach using GEE connected pixel method and some others, to improve a pixel-based crop classification map.
AS was the project manager. ML provided crop classification maps using ensemble of neural networks and conducted experiments in Google Earth Engine. NK and AN were scientific coordinators of the research and provided results interpretation. SS has prepared training and test sets and preprocessed Landsat-8 data for crop mapping.
The authors declare that the research was conducted in the absence of any commercial or financial relationships that could be construed as a potential conflict of interest.
This research was conducted in the framework of the “Large scale crop mapping in Ukraine using SAR and optical data fusion” Google Earth Engine Research Award funded by the Google Inc.
Boryan, C. G., and Yang, Z. (2013, July). “Deriving crop specific covariate data sets from multi-year NASS geospatial cropland data layers,” in 2013 IEEE International Geoscience Remote Sensing Symposium-IGARSS (Melbourne, VIC), 4225–4228.
Congalton, R. G. (1991). A review of assessing the accuracy of classifications of remotely sensed data. Remote Sens. Environ. 37, 35–46. doi: 10.1016/0034-4257(91)90048-B
Congalton, R. G., and Green, K. (2008). Assessing the Accuracy of Remotely Sensed Data: Principles and Practices. Boca Raton, FL: CRC Press.
Fritz, S., See, L., You, L., Justice, C., Becker-Reshef, I., Bydekerke, L., and Gilliams, S. (2013). The need for improved maps of global cropland. Eos Trans. Am. Geophys. Union 94, 31–32. doi: 10.1002/2013EO030006
Gallego, F. J., Kussul, N., Skakun, S., Kravchenko, O., Shelestov, A., and Kussul, O. (2014). Efficiency assessment of using satellite data for crop area estimation in Ukraine. Int. J. Appl. Earth Observ. Geoinform. 29, 22–30. doi: 10.1016/j.jag.2013.12.013
Gallego, J., Carfagna, E., and Baruth, B. (2010). “Accuracy, objectivity and efficiency of remote sensing for agricultural statistics,” in Agricultural Survey Methods, eds R. Benedetti, M. Bee, G. Espa, and F. Piersimoni (Chichester, UK: John Wiley & Sons, Ltd.). doi: 10.1002/9780470665480.ch12
Gallego, J., Kravchenko, A. N., Kussul, N. N., Skakun, S. V., Shelestov, A. Y., and Grypych, Y. A. (2012). Efficiency assessment of different approaches to crop classification based on satellite and ground observations. J. Autom. Inf. Sci. 44, 67–80. doi: 10.1615/JAutomatInfScien.v44.i5.70
Gao, F., Masek, J., Schwaller, M., and Hall, F. (2006). On the blending of the Landsat and MODIS surface reflectance: predicting daily Landsat surface reflectance. IEEE Trans. Geosci. Remote Sens. 44, 2207–2218. doi: 10.1109/TGRS.2006.872081
Haykin, S. (2008). Neural Networks and Learning Machines, 3rd Edn. Upper Saddle River: NJ: Prentice Hall.
Hilker, T., Wulder, M. A., Coops, N. C., Seitz, N., White, J. C., Gao, F., et al. (2009). Generation of dense time series synthetic Landsat data through data blending with MODIS using a spatial and temporal adaptive reflectance fusion model. Remote Sens. Environ. 113, 1988–1999. doi: 10.1016/j.rse.2009.05.011
Kogan, F., Kussul, N., Adamenko, T., Skakun, S., Kravchenko, O., Kryvobok, O., et al. (2013a). Winter wheat yield forecasting in Ukraine based on Earth observation, meteorological data and biophysical models. Int. J. Appl. Earth Observ. Geoinform. 23, 192–203. doi: 10.1016/j.jag.2013.01.002
Kogan, F., Kussul, N. N., Adamenko, T. I., Skakun, S. V., Kravchenko, A. N., Krivobok, A. A., et al. (2013b). Winter wheat yield forecasting: A comparative analysis of results of regression and biophysical models. J. Autom. Inf. Sci. 45, 68–81. doi: 10.1615/JAutomatInfScien.v45.i6.70
Kolotii, A., Kussul, N., Shelestov, A., Skakun, S., Yailymov, B., Basarab, R., and Ostapenko, V. (2015). Comparison of biophysical and satellite predictors for wheat yield forecasting in Ukraine. Int. Arch. Photogramm. Remote Sens. Spat. Inf. Sci. 40, 39. doi: 10.5194/isprsarchives-XL-7-W3-39-2015
Kussul, N., Lemoine, G., Gallego, F. J., Skakun, S. V., Lavreniuk, M., and Shelestov, A. Y. (2016). Parcel-based crop classification in ukraine using landsat-8 data and sentinel-1A data. IEEE J. Select. Top. Appl. Earth Observ. Rem. Sens. 9, 2500–2508. doi: 10.1109/JSTARS.2016.2560141
Kussul, N. N., Sokolov, B. V., Zyelyk, Y. I., Zelentsov, V. A., Skakun, S. V., and Shelestov, A. Y. (2010). Disaster risk assessment based on heterogeneous geospatial information. J. Autom. Inf. Sci. 42, 32–45. doi: 10.1615/JAutomatInfScien.v42.i12.40
Kussul, N., Shelestov, A., Basarab, R., Skakun, S., Kussul, O., and Lavrenyuk, M. (2015). “Geospatial Intelligence and Data Fusion Techniques for Sustainable Development Problems,” in ICTERI (Lviv), 196–203.
Kussul, N., Shelestov, A., and Skakun, S. (2011). “Grid technologies for satellite data processing and management within international disaster monitoring projects,” in Grid and Cloud Database Management, eds S. Fiore and G. Aloisio (Berlin; Heidelberg: Springer), 279–305.
Lavreniuk, M. S., Skakun, S. V., Shelestov, A. J., Yalimov, B. Y., Yanchevskii, S. L., Yaschuk, D. J., et al. (2016). Large-scale classification of land cover using retrospective satellite data. Cybern. Syst. Anal. 52, 127–138. doi: 10.1007/s10559-016-9807-4
Littlestone, N. (1988). Learning quickly when irrelevant attributes abound: a new linear-threshold algorithm. Mach. Learn. 2, 285–318. doi: 10.1007/BF00116827
Ma, Y., Wang, L., Liu, P., and Ranjan, R. (2015a). Towards building a data-intensive index for big data computing–a case study of Remote Sensing data processing. Inf. Sci. 319, 171–188. doi: 10.1016/j.ins.2014.10.006
Ma, Y., Wu, H., Wang, L., Huang, B., Ranjan, R., Zomaya, A., et al. (2015b). Remote sensing big data computing: challenges and opportunities. Future Generation Comput. Syst. 51, 47–60. doi: 10.1016/j.future.2014.10.029
Maji, S., Berg, A. C., and Malik, J. (2008). “Classification using intersection kernel support vector machines is efficient,” in IEEE Conference on Computer Vision and Pattern Recognition (Anchorage, AK), 1–8.
McNairn, H., Champagne, C., Shang, J., Holmstrom, D. A., and Reichert, G. (2009). Integration of optical and Synthetic Aperture Radar (SAR) imagery for delivering operational annual crop inventories. ISPRS J. Photogramm. Remote Sens. 64, 434–449. doi: 10.1016/j.isprsjprs.2008.07.006
Rahman, H., and Dedieu, G. (1994). SMAC: a simplified method for the atmospheric correction of satellite measurements in the solar spectrum. Remote Sens. 15, 123–143. doi: 10.1080/01431169408954055
Roy, D. P., Ju, J., Lewis, P., Schaaf, C., Gao, F., Hansen, M., et al. (2008). Multi-temporal MODIS–Landsat data fusion for relative radiometric normalization, gap filling, and prediction of Landsat data. Remote Sens. Environ. 112, 3112–3130. doi: 10.1016/j.rse.2008.03.009
Roy, D. P., Wulder, M. A., Loveland, T. R., Woodcock, C. E., Allen, R. G., Anderson, M. C., et al. (2014). Landsat-8: science and product vision for terrestrial global change research. Remote Sens. Environ. 145, 154–172. doi: 10.1016/j.rse.2014.02.001
Shalev-Shwartz, S., Singer, Y., Srebro, N., and Cotter, A. (2011). Pegasos: primal estimated sub-gradient solver for svm. Math. Programming 127, 3–30. doi: 10.1007/s10107-010-0420-4
Skakun, S., Kussul, N., Shelestov, A., and Kussul, O. (2016b). The use of satellite data for agriculture drought risk quantification in Ukraine. Geomatics Nat. Hazards Risk, 7, 901–917. doi: 10.1080/19475705.2015.1016555
Skakun, S., Kussul, N., Shelestov, A. Y., Lavreniuk, M., and Kussul, O. (2016a). Efficiency assessment of multitemporal C-Band Radarsat-2 intensity and Landsat-8 surface reflectance satellite imagery for crop classification in Ukraine. IEEE J. Select. Top. Appl. Earth Observ. Remote Sens. 9, 3712–3719. doi: 10.1109/JSTARS.2015.2454297
Skakun, S. V., and Basarab, R. M. (2014). Reconstruction of missing data in time-series of optical satellite images using self-organizing Kohonen maps. J. Autom. Inf. Sci. 46, 19–26. doi: 10.1615/JAutomatInfScien.v46.i12.30
Skakun, S. V., Nasuro, E. V., Lavrenyuk, A. N., and Kussul, O. M. (2007). Analysis of applicability of neural networks for classification of satellite data. J. Autom. Inf. Sci. 39, 37–50. doi: 10.1615/JAutomatInfScien.v39.i3.40
Waldner, F., De Abelleyra, D., Verón, S. R., Zhang, M., Wu, B., Plotnikov, D., et al. (2016). Towards a set of agrosystem-specific cropland mapping methods to address the global cropland diversity. Int. J. Remote Sens. 37, 3196–3231. doi: 10.1080/01431161.2016.1194545
Yan, L., and Roy, D. P. (2014). Automated crop field extraction from multi-temporal Web Enabled Landsat Data. Remote Sens. Environ. 144, 42–64. doi: 10.1016/j.rse.2014.01.006
Keywords: Google Earth Engine, big data, classification, optical satellite imagery, land cover, land use, image processing
Citation: Shelestov A, Lavreniuk M, Kussul N, Novikov A and Skakun S (2017) Exploring Google Earth Engine Platform for Big Data Processing: Classification of Multi-Temporal Satellite Imagery for Crop Mapping. Front. Earth Sci. 5:17. doi: 10.3389/feart.2017.00017
Received: 26 September 2016; Accepted: 10 February 2017;
Published: 24 February 2017.
Edited by:
Monique Petitdidier, Institut Pierre-Simon Laplace, FranceReviewed by:
Karine Zeitouni, University of Versailles Saint-Quentin, FranceCopyright © 2017 Shelestov, Lavreniuk, Kussul, Novikov and Skakun. This is an open-access article distributed under the terms of the Creative Commons Attribution License (CC BY). The use, distribution or reproduction in other forums is permitted, provided the original author(s) or licensor are credited and that the original publication in this journal is cited, in accordance with accepted academic practice. No use, distribution or reproduction is permitted which does not comply with these terms.
*Correspondence: Mykola Lavreniuk, bmlja185M0B1a3IubmV0
Disclaimer: All claims expressed in this article are solely those of the authors and do not necessarily represent those of their affiliated organizations, or those of the publisher, the editors and the reviewers. Any product that may be evaluated in this article or claim that may be made by its manufacturer is not guaranteed or endorsed by the publisher.
Research integrity at Frontiers

Learn more about the work of our research integrity team to safeguard the quality of each article we publish.