
95% of researchers rate our articles as excellent or good
Learn more about the work of our research integrity team to safeguard the quality of each article we publish.
Find out more
ORIGINAL RESEARCH article
Front. Earth Sci. , 09 May 2016
Sec. Geomagnetism and Paleomagnetism
Volume 4 - 2016 | https://doi.org/10.3389/feart.2016.00055
This article is part of the Research Topic Rock and Environmental Magnetism: New Techniques and Applications View all 11 articles
 Masao Ohno1*
 Tatsuya Hayashi2
 Masahiko Sato1,3
 Yoshihiro Kuwahara1
 Asami Mizuta1
 Itsuro Kita1
 Tokiyuki Sato4
 Akihiro Kano1
Waxing/waning of the ice sheets and the associated change in thermohaline circulation have played an important role in global climate change since major continental ice sheets appeared in the northern hemisphere about 2.75 million years ago. In the earliest glacial stages, however, establishment of the linkage between ice sheet development and ocean circulation remains largely unclear. Here, we show new high-resolution records of marine isotope stage 100 recovered from deep-sea sediments on the Gardar Drift, in the subpolar North Atlantic. Results of a wide range of analyses clearly reveal the influence of millennial-scale variability in iceberg discharge on ocean surface condition and bottom current variability in the subpolar North Atlantic during marine isotope stage 100. We identified eight events of ice-rafted debris, which occurred mostly with decreases in sea surface temperature and in current components indicating North Atlantic Deep Water. These decreases are interpreted by weakened deep water formation linked to iceberg discharge, similarly to observations from the last glacial period. Dolomite fraction of the ice-rafted events in early MIS 100 like the last glacial Heinrich events suggests massive collapse of the Laurentide ice sheet in North America. At the same time, our early glacial data suggest differences from the last glacial period: absence of 1470-year periodicity in the interactions between ice sheets and ocean, and northerly shift of the ice-rafted debris belt. Our high-resolution data largely improve the picture of ice-sheet/ocean interactions on millennial time scales in the early glacial period after major Northern Hemisphere glaciation.
Collapse of continental ice sheets, one of the major threats posed by global warming, made an impact on the global ocean circulation and climate system through the Pleistocene. Lines of evidence have demonstrated that such linkage between the ice sheets and the ocean circulation repeatedly occurred in millennial time scale, as represented by the last glacial Dansgaard-Oeschger (D-O) cycles and Heinrich events (e.g., Hemming, 2004; Clement and Peterson, 2008). It has been argued that the abrupt climate change was caused by collapse of the continental ice sheets and the freshwater discharge into the North Atlantic Ocean, which reduced the North Atlantic Deep Water (NADW) production and weakened the ocean thermohaline circulation (e.g., Broecker, 1991, 1994). Subsequent studies suggested that the millennial-scale changes date back to Marine Isotope Stage (MIS) 100 around the intensification of Northern Hemisphere glaciation (NHG) (Bartoli et al., 2006; Becker et al., 2006; Bolton et al., 2010; Bailey et al., 2012, 2013). For instance at ODP Site 607 on the western flank of the Mid-Atlantic Ridge and Site 981 east of the Rockall Bank (Figure 1), Becker et al. (2006) recognized six ice-rafting events during MIS 100 and suggested millennial-scale changes in their ice-rafted debris (IRD) likely by processes similar to D-O cycles. However, the millennial-scale changes were unclear in the carbon isotope records of benthic foraminifer (δ13Cbenthic) reflecting the bottom water conditions at least partly because of low data resolution. Paleoceanography at the onset of NHG should be improved by multiple data sources with higher time resolution.
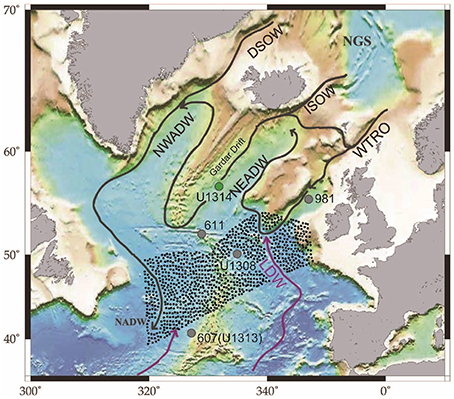
Figure 1. Map of study site. Location of IODP Site U1314 and other sites discussed in the text plotted on bathymetric map of the northern North Atlantic [modified after Raymo et al. (2004)]. Paths of major deep water flows are indicated by arrows. Abbreviations not defined in text are: DSOW, Denmark Strait Overflow Water; NWADW, Northwest Atlantic Deep Water; NEADW, Northeast Atlantic Deep Water; NGS, Norwegian-Greenland Sea. The stippled area represents the Ruddiman IRD belt (Ruddiman, 1977), plotted after (Hemming 2004).
Here, we demonstrate the millennial-scale links between iceberg discharge, surface ocean condition, and bottom current variability in the subpolar North Atlantic during the glacial MIS 100, the first pronounced glacial period in the northern hemisphere. Study material was collected at Integrated Ocean Drilling Program (IODP) Site U1314 in the Gardar Drift surrounded by different ice-covered continents. We show new high-resolution data from a wide range of analyses including IRD counts, mineral composition, and abundance of coccoliths. In addition, we focused on rock magnetic properties of sediments as a proxy of bottom current conditions. Rock magnetic properties are a most potential proxy of bottom current conditions for the sediments poorly containing foraminifera. In the vicinity of the study site, the terrigenous material was largely transported by the northerly bottom current (NADW) in the interglacial periods and by the southerly bottom current (Lower Deep Water: LDW) in the glacial periods (e.g., Oppo and Lehman, 1993; Raymo et al., 2004; Curry and Oppo, 2005; Lynch-Stieglitz et al., 2007; Kissel et al., 2009; Grützner and Higgins, 2010; Alonso-Garcia et al., 2011). Sediments from the north transport have relatively higher magnetic coercivity reflecting the fine grained magnetite of Icelandic sources compared to sediments from the south. The north-south contrast in magnetic property was obviously demonstrated by the ratio of anhysteretic remanent magnetization to initial susceptibility for the last glacial sediments (Kissel, 2005). In our previous study of the IODP Site U1314, Sato et al. (2015) associated magnetic properties of sediments with the NADW production that appeared orbital-scale variability during 2.2–2.9 Ma and abrupt intensification after ~2.68 Ma.
We analyzed sediment cores at IODP Site U1314 (56°21.9′N, 27°53.3′W in a water depth of 2820 m) in the Gardar Drift, which is surrounded by four different IRD sources; Laurentide, Greenland, Iceland, and European continent (Figure 1). A complete spliced section entirely consisting of clay-rich sediments was obtained down to 280 m composite depth (mcd) from the cores of three holes drilled with the advanced piston corer (Expedition 306 Scientists, 2006). Hayashi et al. (2010) constructed an orbital resolution age model for the period of 2.1–2.75 Ma tuned by a hybrid environmental proxy record to the global-standard oxygen isotope curve (Lisiecki and Raymo, 2005); Sato et al. (2015) modified the age model partly by constructing a longer age model to 2.9 Ma. In this study, we have analyzed IRD, X-ray diffraction (XRD), calcareous nannoplankton, and rock magnetic properties of the sediments between 229.5 and 234.5 mcd at a 2-cm interval (250 samples), which correspond to the age between 2.503 and 2.543 Ma with 100~200 years resolution.
In the analysis of IRD, weighed dry sediments (0.5 g) were sieved and the lithic grains (>150 μm) were counted. We excluded authigenic framboidal pyrite in counting.
For XRD measurements, each bulk material was ground and homogenized with an agate mortar. In order to convert X-ray peak intensities to weight percentage data on quartz and calcite and to determine normalized peak intensities on the other minerals, a powdered zincite standard (ZnO) was added in a fixed percentage (5 wt%) to the sample. Relative amounts (wt%) of quartz and calcite were determined by calibration curves measuring artificial standards comprising 5 wt% zincite standard plus matrix consisting of specified weight percentages of quartz and calcite. The XRD data were collected on a Rigaku X-ray Diffractometer RINT 2100 V, using CuKα radiation monochromatized by a curved graphite crystal in a step of 0.02° with a step-counting time of 2 sec. Intensity (area) of each elementary peak was calculated following the decomposition (profile fitting) procedure.
The absolute abundance of coccoliths (calcareous nannoplankton), calcareous plates formed by coccolithophores, was measured following the method of Chiyonobu et al. (2006). A powdered sample of 0.02 g was dispersed in 50 ml of water. A portion (0.5 ml) of the solution was then dried and hardened on the cover glass using ultraviolet light. The number of nannoplankton in an 18 mm × 20 μm area was counted through a 1500 × microscope and converted into an amount contained in g−1 (specimens/g).
Magnetic properties of freeze-dried bulk sediments were measured with an alternating gradient force magnetometer [Princeton Measurements Corporation (Princeton, NY) Micromag 2900]. Hysteresis loops were measured with a maximum field of 1 T to determine the saturation remanence (Mr). We calculated S-ratios as the ratios of isothermal remanent magnetizations (IRMs) acquired in a DC back-field of 0.1 T divided by an initial IRMs acquired in a DC forward-field of 1 T. In addition, IRM acquisition curves were obtained at 29 magnetizing field steps from 1 mT to 1 T after demagnetized in decreasing AF field with the peak field of 1 T. The IRM gradient curves, which are a first derivative of IRM acquisition curve, represent the distribution of magnetic coercivity of each sample. The observed IRM gradient curves were decomposed into two components with high magnetic and low magnetic coercivity, respectively, using the method in Sato et al. (2015). Rock magnetic experiments of the Site U1314 sediments indicated magnetite as the dominant magnetic mineral on the basis of IRM acquisition curves and S-ratios (Kanamatsu et al., 2009) and low-temperature and high-temperature magnetometry (Zhao et al., 2011).
Development of continental ice sheets in the circum-North Atlantic region was inferred by IRD records. In the IODP U1314 site, eight ice-rafting events were recognized by the presence of IRD during MIS 100 (labeled as “a” to “h” in order of depth). All the ice-rafting events were accompanied by the deposition of volcanic glasses, which were especially abundant in event (e) at 2523 and event (a) at 2513 ka (Figure 2B). Since the volcanic glasses were absent in periods without IRD, the volcanic glass can be regarded as a component of IRD. They deposited largely onto growing ice sheets and/or drifting icebergs, however could have been transported directly by eruption. In this sense, we show the IRD in two different ways, including (Figure 2A) and excluding the volcanic glass (Figure 2C). We found that the IRD excluding the volcanic glass yields better correspondence with the IRD index proposed by Hayashi et al. (2010) for 2.1–2.75 Ma at the same site, which composites natural gamma radiation and initial magnetic susceptibility (Figure 2D). As Hayashi et al. (2010) recognized, IRD was conspicuous only when δ18O values of benthic foraminiferal tests surpassed 3.5o. This rule is kept in latter glacial stages during the Pleistocene (McManus et al., 1999; Mc Intyre et al., 2001).
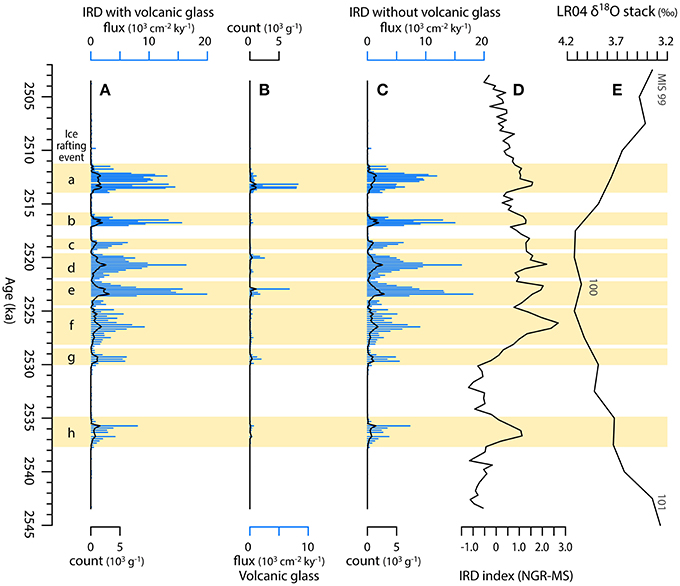
Figure 2. Records of IRD during the MIS 100 glacial period from IODP Site U1314. (A) IRD with volcanic glass (coarse fraction: >150 μm); (B) Volcanic glass (coarse fraction: >150 μm); (C) IRD without volcanic glass (coarse fraction: >150 μm); (D) IRD index by Hayashi et al. (2010) with the age model by Sato et al. (2015); (E) The LR04 stack (Lisiecki and Raymo, 2005). In (A), (B), and (C), black curves and blue bars indicate counts and fluxes of IRD, respectively. Eight ice-rafting events (a, b, c, d, e, f, g, and h) recognized by IRD are shown on the left.
Another important aspect is that the IRD record can be divided into three phases (Figure 2). The first phase is represented by the single isolated ice-rafting event (h), which occurred during the transitional stage from the MIS 101 interglacial period to the MIS 100 glacial period. Considering volume of ice sheets inferred from δ18O value 3.7–3.8o, this phase may be comparable to earlier glacial periods at MIS G4, G2, and 104, each of which is similarly characterized by a single prominent ice-rafting event (Hayashi et al., 2010). The second phase includes six ice-rafting events (g, f, e, d, c, and b) recurred at every two to three thousand years, which started after about 5 kyr from the event (h) in the first phase. Such clear multiple ice-rafting events first appeared in MIS 100 but not prominent in earlier glacial periods. The prolonged event (f) in earlier MIS 100 that has relatively low IRD flux (Figures 2A,D) is correlated with a prominent peak the IRD index (Hayashi et al., 2010). In subsequent events IRD increased and showed a saw-tooth oscillation accompanied by long-term decrease in IRD index. The maximum flux of IRD at events e, d, and b was as much as ca. 15,000–18,000 grains/cm2ky, comparable with the IRD flux during the mid-Pleistocene at the same site (Alonso-Garcia et al., 2011). The final phase includes the single ice-rafting event (a) that is separated from the event (b) by about 2-kyr period without IRD, and corresponds to the deglaciation stage between the MIS 100 glacial period and the MIS 99 interglacial period.
The most abundant lithic grains counted as IRD were composed of quartz. In addition, feldspars, amphibole, and mica were commonly observed. The observed IRD composition was consistent with XRD measurements (Figure 3), in which quartz shows the strongest correlation with IRD counts (Figures 3A,B); mica (Figure 3C), and feldspars (Figures 3D,E) also increased during ice-rafting events. We did not detect any signal of olivine that indicates contribution of IRD from Icelandic basalt. Signals of a small amount of dolomite were detected associated with the earlier four ice-rafting events (h, g, f, and e; Figure 3F). Pyrite was detected in a thin interval between events d and c (Figure 3G). As for minerals that are not related to IRD, calcite showed the predominance during interglacial periods and remarkable decline in the first and last ice-rafting events (Figure 3H). Total amount of the minerals determined in XRD measurements is estimated to cover up to 50 wt% of the sediments, and the undetermined fraction is likely to be clay minerals.
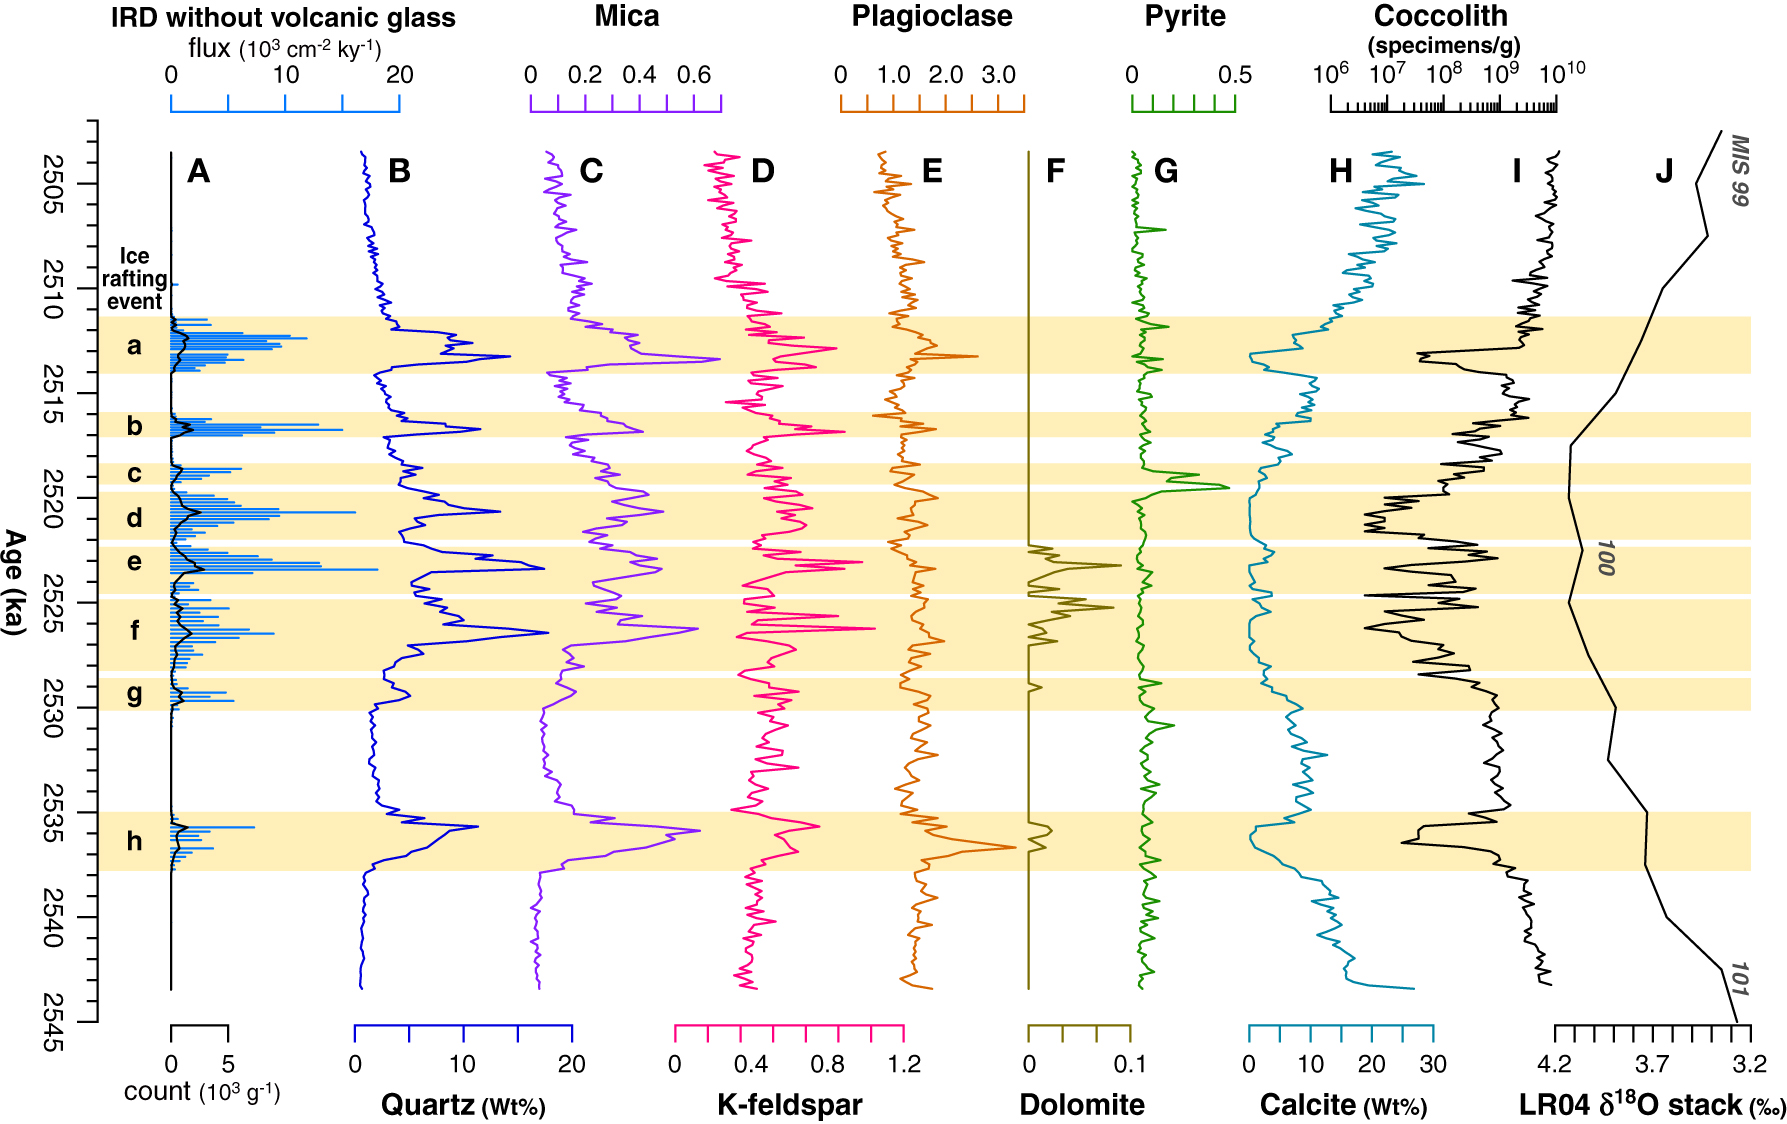
Figure 3. Multi-proxy records of ice-rafting events and ocean surface condition during the MIS 100 glacial period from IODP Site U1314. (A) Ice-rafting events shown by count (black curve) and flux (blue bars) of IRD without volcanic glass; (B–H) Mineralogical characteristics of IRD (XRD measurements); (I) Ocean surface condition shown by count of coccoliths (logarithmic plot); (J) Global ice volume shown by the LR04 stack (Lisiecki and Raymo, 2005). In (B) and (H), amounts of quartz and calcite were plotted in weight percent. Amounts of the other minerals were not large enough for estimating weight percent, and were represented by the values of the following representative diffraction peaks relative to that of ZnO (2.81Å): K-feldspar (3.24Å and 3.25Å), mica (10Å), plagioclase (3.21Å and 3.19Å), pyrite (2.71Å), and dolomite (2.89Å).
Surface ocean condition inferred from the absolute abundance of coccoliths (calcareous nannoplankton) showed some relation with ice-rafting events (Figure 3I) and also with calcite (Figure 3H). Prominent decline in coccolith abundance was recognized in the events h, f, e, d, and a (Figure 3I). Coccoliths have been used to interpret the paleoclimate (e.g., Haq, 1980; Sato et al., 2004) and their abundance at the subpolar North Atlantic sites largely depends on the temperature of surface water and the light regime (Baumann et al., 2000). The declined abundance in some ice-rafted events indicates ecological collapses of the coccolithophore community by lowered temperature or expanded sea ice coverage, or both. In turn the three short ice-rafted events g, c, and b were not accompanied by significant change in surface water condition. The record of coccolith abundance of the analyzed section depicts the glacial-interglacial trend as well, mostly reflecting orbital-scale variability in sea surface temperature.
The bottom current variability was reconstructed from rock magnetic properties of sediments because north currents transport basaltic sediments of Icelandic sources with relatively higher magnetic coercivity compared to acidic sediments transported by south current. Figure 4 compares typical examples of rock magnetic measurements of sediments with high and low coercivity. The values of coercivity in hysteresis curves ranged from 12 to 19 mT (Figures 4A,B). In Figure 4C, IRM acquisition curves mostly saturated at 1 T, and therefore, IRM gradient curves (Figure 4D), the derivatives of acquisition curves, represent the distribution of coercivity. Using the variability of coercivity distribution, we decomposed the observed IRM gradient curves (Figure 5D) into two bottom current components; the interglacial component with high magnetic coercivity (Figure 5G), and the glacial component with low coercivity (Figure 5F), following the method of Sato et al. (2015). In decomposition, we used the two end-member curves determined by Sato et al. (2015) by averaging the IRM gradient curves of selected samples in 2.2~2.9 Ma: the samples with low S-ratio values (< 0.54) for interglacial component and those with high S-ratio values (>0.87) for glacial component were chosen, respectively. As a result, the fitting of the observed curve by two components was excellent throughout the study interval; fitting error (integral of the residual curve (R) in Sato et al., 2015) was sufficiently small with an average of 5% (Figure 5E). Noise originated from the IRD is negligible because contribution of IRD to the magnetic properties of bulk sediments is small; the geometric mean of the saturation remanence (Mr) of bulk sediments (0.051 Am2/kg) is much higher than Mr of sieved (>150 μm) lithic grains (0.0082 Am2/kg) of 14 representative samples during IRD events. This is confirmed by association between the decreases in Mr and the increases in IRD (Figure 5).
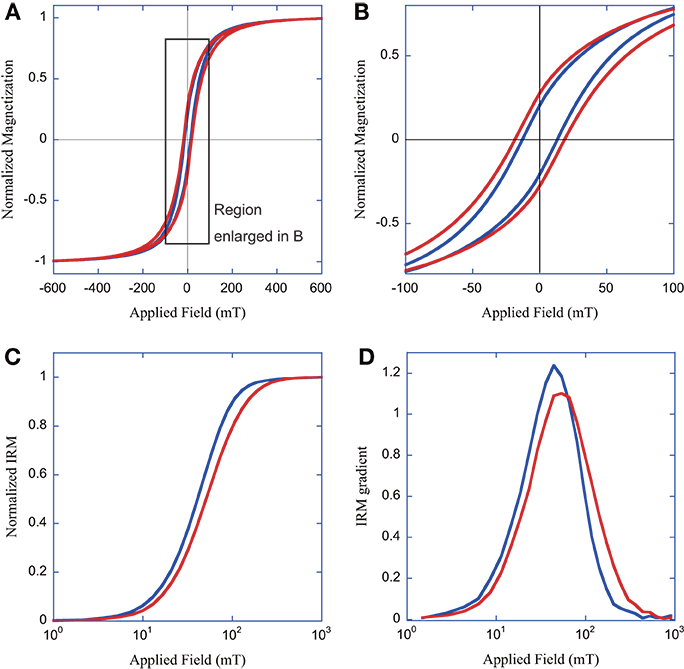
Figure 4. Typical examples of rock magnetic measurements. (A) and (B) Hysteresis curves corrected for paramagnetic slope; (C) IRM acquisition curves; (D) IRM gradient curves (first derivatives of acquisition curves). Red lines are results of sediments at 2540.5 ka representing interglacial component and blue lines are at 2512.5 ka representing glacial component. Diagram B is enlargement of the surrounded region in a box in A.
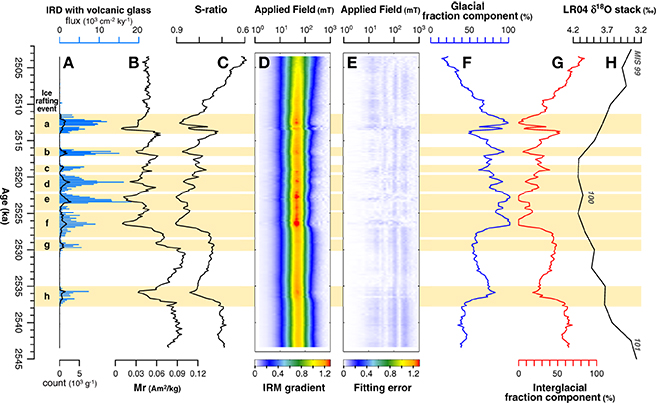
Figure 5. Multi-proxy records of ice-rafting events and bottom current variability during the MIS 100 glacial period from IODP Site U1314. (A) Ice-rafting events shown by count (black curve) and flux (blue bars) of IRD without volcanic glass; (B–G) Bottom current variability shown by magnetic parameters; (H) Global ice volume shown by the LR04 stack (Lisiecki and Raymo, 2005). Magnetic parameters are (B) saturation remanence (Mr), (C) S-ratio, (D) isothermal remanent magnetization (IRM) gradient curves. In addition, (F) glacial component and (G) interglacial components were calculated from IRM acquisition curves, with (E) absolute values of residual curves in fitting by the two endmember components (see text).
The bottom current variability reconstructed from rock magnetic properties indicated close connection with ice-rafting events (Figures 5F,G). The interglacial component with high magnetic coercivity decreases with ice-rafting events (Figure 5G), indicating weakened production of NADW that transports sediments with high magnetic coercivity from the north. Within each ice-rafting event the production of NADW declined rapidly at the commencement of the event, reached a minimum at the peak in the event, and subsequently recovered gradually. Repetition of similar abrupt reduction and gradual recovery of NADW in millennial-scale is reported in the last glacial period by Snowball and Moros (2003). It is noticeable that the gradual recovery of the NADW production continued after the end of the ice-rafting event, which is especially evident in events h, b, and a (Figure 5G); these events occurred separately from the succeeding event by more than 2000 years. After the ends of the other ice-rafting events, the NADW production could presumably recover but the recovery was interrupted by the next ice-rafting event that occurred shortly after.
Our high-resolution records in a wide range of analysis reveal a detailed history of ice-sheet/ocean interactions in the earliest Pleistocene subpolar North Atlantic (main results are summarized in Figure 6). The vigorous NADW production kept from the MIS 101 interglacial period abruptly reduced associated with the ice-rafting event (h) in the first phase. At that time, however, the production of NADW was able to recover gradually over the next several thousand years because the ice rafting was a single isolated event in the immature glacial stage. These are consistent with abrupt destruction and rapid recovery of surface ocean condition, which occurred synchronous with the event (h). In the full glacial stage (second phase), a series of six ice-rafting events (g–b) recurred in a relatively regular interval of ~2600 years. These events almost continuously affected ocean surface condition and eventually gave rise to dramatic changes in NADW production. Although the relatively small event (g) gave little impact on NADW production, the next large events (f and e) induced the most serious reductions of NADW production in the MIS 100 glacial period. Subsequently, individual ice-rafting events (d, c, and b) involved some reductions of NADW production, although the long-term trend reversed to gradual recovery of NADW production. In the beginning of the third phase, NADW recovered production to the levels preceding the second phase, but the recovery was again interrupted by the isolated ice-rafting event (a). The impact of this final event was surprisingly large and involved serious destruction of surface ocean condition and the large reduction of NADW production as comparable to the largest ones in the second phase. After that, NADW recovered production vigorously to enter the MIS 99 interglacial period. A previous study (Becker et al., 2006) recognized isotopic signals (δ13Cbenthic) of weakened NADW production associated with ice-rafting events during the MIS 100 glacial period at ODP Site 607, but they observed no millennial-scale variation, likely because of the low resolution of the carbon isotope record (27 data points during MIS 100). Our new data presented here improve the understanding of millennial-scale activity of the bottom currents in the subpolar North Atlantic that are tightly linked with the development and collapse of circum-North Atlantic ice sheets during MIS 100.
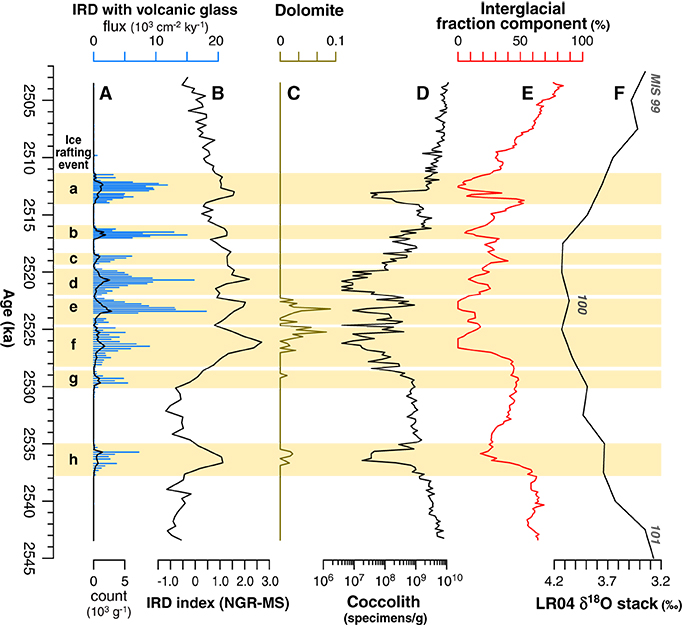
Figure 6. Summary of paleoceanographic records during the MIS 100 glacial period from IODP Site U1314. (A,B), and (C) Ice-rafting events; (D) ocean surface condition; (E) bottom current variability; (F) Global ice volume (LR04 stack: Lisiecki and Raymo, 2005; see text).
As discussed above, our data depicted that millennial-scale abrupt changes in the ice-sheet/ocean system were already established at least in the MIS 100 glacial period. From the viewpoint of the ice-sheet/ocean interaction, they are clearly similar to the last glacial D–O events. On the other hand, with our high-resolution data set, we could not find any evidence supporting that the 1470-year periodicity in the D–O cycles (Schulz, 2002) existed in MIS 100 records at Site U1314. The D–O like periodicity during the MIS G14, G6, and 104 glacial periods was reported from nearby ODP Site 984, but the existence of the last glacial 1470-year periodicity itself has been under debate (e.g., Ditlevsen et al., 2007). Instead, our IRD count data (Figure 6A) show relatively regular spacing between the peaks of the events g–b, which is calculated to be 2600 years.
Among ice-rafting events during MIS 100, the first four (h, g, f, and e) were accompanied by dolomite fractions (Figure 6C), which are suggestive of the contribution of icebergs calved from the Laurentide ice sheet in North America (see e.g., Hemming, 2004). In particular, the events f and e may be similar to the last glacial Heinrich event in terms of their relatively large dolomite fractions likely from the Laurentide ice sheet and significantly reduced NADW production (Figure 6E). Ice rafting from Laurentide was reduced, and instead relative contribution of IRD from Greenland and European continent increased in the later events during MIS 100.
During the MIS 100 glacial period, the southward expansion of iceberg transportation was obviously more limited than that during the last glacial period. The amount and flux of IRD (>150 μm) (maximum: ca. 2900 grains/g; ca. 18,000 grains/cm2ky) at Site U1314 were comparable to or larger than that within the last glacial Ruddiman IRD belt in N50°–40° (Ruddiman, 1977; Hemming, 2004) [e.g., IODP Site U1308 (Bailey et al., 2010); IODP Site U1313 (Bolton et al., 2010)]. The largest flux of IRD (maximum: 38,000 grains/cm2ky) in the MIS 100 glacial period was reported at DSDP Site 611, which is located 500 km north of the center of the Ruddiman IRD belt (Bailey et al., 2012). These suggest that the IRD belt shifted northerly in the earliest Pleistocene, likely due to a shorter range of iceberg transportation or northerly-located southern limit of ice-sheets.
High-resolution data from a wide range of analyses of a sediment core in the subpolar North Atlantic revealed millennial-scale ice-sheet/ocean interactions during MIS 100. Remarkable declines in coccolith abundance and in calcite fraction were observed accompanied by ice-rafting events indicating link between surface ocean condition and ice-rafting events. In addition, link of bottom current variability to ice-rafting events was revealed using rock magnetic properties of sediments. Within each ice-rafting event, the production of NADW declined rapidly at the commencement of the event, reached a minimum at the peak in the event, and subsequently recovered gradually beyond the termination of the event.
The history of ice-sheet/ocean interactions during the MIS 100 glacial period is interpreted as follows. This period is divided into three phases. The first phase (transitional stage from the MIS 101 interglacial period) was characterized by a single isolated ice-rafting event, like earlier ice-rafting events at the MIS G4, G2, and 104 glacial periods. The ice-rafting event involved abrupt destruction of surface ocean condition and rapid reduction of NADW production. After that, the production of NADW recovered gradually over the next several thousand years. In the second phase (full glacial stage), six ice-rafting events recurred at every two to three thousand years with saw-tooth oscillation pattern. The ice-rafting events almost continuously affected ocean surface condition and repeatedly induced serious reductions of the NADW production. In the third phase (transitional stage to the MIS 99 interglacial period), a single isolated ice-rafting event occurred again. The final ice-rafting event involved serious destruction of surface ocean condition and the remarkable reduction of NADW production as comparable to the largest events in the second phase.
Our data indicate that millennial-scale abrupt changes in the ice-sheet/ocean system similar to the last glacial D–O events were already established at least in the MIS 100 glacial period. Among ice-rafting events during MIS 100, two events (f and e) show similarity to the last glacial Heinrich event: massive collapse of the Laurentide ice sheet suggested by relatively large amount of dolomite fractions in addition to serious reduction in NADW production. In contrast, the 1470-year periodicity dominated in last glacial climatic and environmental conditions is absent in our data. In addition, it is likely that the southward expansion of iceberg transportation during the MIS 100 glacial period was more limited than that during the last glacial period.
MO and TH conceived and designed the research. MO and MS performed the rock magnetic experiments and analyses. YK performed the XRD measurements and analyses. TH and MS performed IRD counting. AM performed measurements of calcareous nannoplankton. IK and TS supervised AM. All authors contributed to the interpretation of results. MO and TH prepared the manuscript. All authors commented on and edited the manuscript.
The authors declare that the research was conducted in the absence of any commercial or financial relationships that could be construed as a potential conflict of interest.
This study used samples provided by the Integrated Ocean Drilling Program (IODP). We are indebted to the staff of the RV JOIDES Resolution and the IODP Bremen Core Repository for their support. This study was performed under the cooperative research program of Center for Advanced Marine Core Research (CMCR), Kochi University (11A021 and 11B019). This study was partly supported by JSPS Grant-in-Aid for Scientific Research (22241006 to MO; 24651011 to IK). We acknowledge comments given by anonymous reviewers.
Alonso-Garcia, M., Sierro, F. J., Kucera, M., Flores, J. A., Cacho, I., and Andersen, N. (2011). Ocean circulation, ice sheet growth and interhemispheric coupling of millennial climate variability during the mid-Pleistocene (ca 800-400ka). Q. Sci. Rev. 30, 3234–3247. doi: 10.1016/j.quascirev.2011.08.005
Bailey, I., Bolton, C. T., DeConto, R. M., Pollard, D., Schiebel, R., and Wilson, P. A. (2010). A low threshold for North Atlantic ice rafting from “low-slung slippery” late Pliocene ice sheets. Paleoceanography 25, PA1212. doi: 10.1029/2009pa001736
Bailey, I., Foster, G. L., Wilson, P. A., Jovane, L., Storey, C. D., Trueman, C. N., et al. (2012). Flux and provenance of ice-rafted debris in the earliest Pleistocene sub-polar North Atlantic Ocean comparable to the last glacial maximum. Earth Planet. Sci. Lett. 341–344, 222–233. doi: 10.1016/j.epsl.2012.05.034
Bailey, I., Hole, G. M., Foster, G. L., Wilson, P. A., Storey, C. D., Trueman, C. N., et al. (2013). An alternative suggestion for the Pliocene onset of major northern hemisphere glaciation based on the geochemical provenance of North Atlantic Ocean ice-rafted debris. Quat. Sci. Rev. 75, 181–194. doi: 10.1016/j.quascirev.2013.06.004
Bartoli, G., Sarnthein, M., and Weinelt, M. (2006). Late Pliocene millennial-scale climate variability in the northern North Atlantic prior to and after the onset of Northern Hemisphere glaciation. Paleoceanography 21, 4. doi: 10.1029/2005pa001185
Baumann, K.-H., Andruleit, H., and Samtleben, C. (2000). Coccolithophores in the Nordic Seas: comparison of living communities with surface sediment assemblages. Deep Sea Res. II Top. Stud. Oceanogr. 47, 1743–1772. doi: 10.1016/S0967-0645(00)00005-9
Becker, J., Lourens, L. J., and Raymo, M. E. (2006). High-frequency climate linkages between the North Atlantic and the Mediterranean during marine oxygen isotope stage 100 (MIS100). Paleoceanography 21:PA3002. doi: 10.1029/2005PA 001168
Bolton, C. T., Wilson, P. A., Bailey, I., Friedrich, O., Beer, C. J., Becker, J., et al. (2010). Millennial-scale climate variability in the subpolar North Atlantic Ocean during the late Pliocene. Paleoceanography 25:PA4218. doi: 10.1029/2010PA 001951
Broecker, W. S. (1991). The great ocean conveyor. Oceanography 4, 79–89. doi: 10.5670/oceanog.1991.07
Broecker, W. S. (1994). Massive iceberg discharges as triggers for global climate change. Nature 372, 421–424. doi: 10.1038/372421a0
Chiyonobu, S., Sato, T., Narikiyo, R., and Yamasaki, M. (2006). Floral changes in calcareous nannofossils and their paleoceanographic significance in the equatorial Pacific Ocean during the last 500 000 years. Island Arc 15, 476–482. doi: 10.1111/j.1440-1738.2006.00543.x
Clement, A. C., and Peterson, L. C. (2008). Mechanisms of abrupt climate change of the last glacial period. Rev. Geophys. 46:RG4002. doi: 10.1029/2006RG000204
Curry, W. B., and Oppo, D. W. (2005). Glacial water mass geometry and the distribution of d 13C of SCO2 in the western Atlantic Ocean. Paleoceanography 20, 1–12. doi: 10.1029/2004PA001021
Expedition 306 Scientists (2006). Site U1314, in Proceedings Integrated Ocean Drilling Program, eds J. E. T. Channell, T. Kanamatsu, T. Sato, R. Stein, C. A. Alvarez Zarikian, M. J. Malone, and the Expedition 303/306 Scientists (College Station, TX: Integrated Ocean Drilling Program Management International, Inc.), 1–95.
Ditlevsen, P. D., Andersen, K. K., and Svensson, A. (2007). The DO-climate events are probably noise induced: statistical investigation of the claimed 1470 years cycle. Clim. Past 3, 129–134. doi: 10.5194/cp-3-129-2007
Grützner, J., and Higgins, S. M. (2010). Threshold behavior of millennial scale variability in deep water hydrography inferred from a 1.1 Ma long record of sediment provenance at the southern Gardar Drift. Paleoceanography 25:PA4204. doi: 10.1029/2009PA001873
Haq, B. U. (1980). Biogeographic history of Miocene calcareous nannoplankton and paleoceanography of the Atlantic Ocean. Micropaleontology 26, 414–443. doi: 10.2307/1485353
Hayashi, T., Ohno, M., Acton, G., Guyodo, Y., Evans, H. F., Kanamatsu, T., et al. (2010). Millennialscale iceberg surges after intensification of Northern Hemisphere glaciation. Geochem. Geophys. Geosyst. 11:Q09Z20. doi: 10.1029/2010GC003132
Hemming, S. R. (2004). Heinrich events: massive late Pleistocene detritus layers of the North Atlantic and their global climate imprint. Rev. Geophys. 42, 1–43. doi: 10.1029/2003rg000128
Kanamatsu, T., Ohno, M., Acton, G., Evans, H., and Guyodo, Y. (2009). Rock magnetic properties of the Gardar Drift sedimentary sequence, Site IODP U1314, North Atlantic: implications for bottom current change through the mid-Pleistocene. Mar. Geol. 265, 31–39. doi: 10.1016/j.margeo.2009.06.012
Kissel, C. (2005). Magnetic signature of rapid climatic variations in glacial North Atlantic, a review. Comptes Rendus Geosci. 337, 908–918. doi: 10.1016/j.crte.2005.04.009
Kissel, C., Laj, C., Mulder, T., Wandres, C., and Cremer, M. (2009). The magnetic fraction: a tracer of deep water circulation in the North Atlantic. Earth Planet. Sci. Lett. 288, 444–454. doi: 10.1016/j.epsl.2009.10.005
Lisiecki, L. E., and Raymo, M. E. (2005). A Pliocene-Pleistocene stack of 57 globally distributed benthic d 18O records. Paleoceanography 20, 1–17. doi: 10.1029/2004PA001071
Lynch-Stieglitz, J., Adkins, J. F., Curry, W. B., et al. (2007). Atlantic meridional overturning circulation during the Last Glacial Maximum. Science 316, 66–69. doi: 10.1126/science.1137127
Mc Intyre, K., Delaney, M. L., and Ravelo, A. C. (2001). Millennial-scale climate changes and oceanic processes in the late Pliocene and early Pleistocene. Paleoceanography 16, 535–543. doi: 10.1029/2000PA000526
McManus, J. F., Oppo, D. W., and and, Cullen, J. L. (1999). A 0.5- million-year record of millennial-scale climate variability in the North Atlantic. Science 283, 971–975. doi: 10.1126/science.283.5404.971.
Oppo, D. W., and Lehman, S. J. (1993). Mid-depth circulation of the subpolar North Atlantic during the last glacial maximum. Science 259, 1148–1152. doi: 10.1126/science.259.5098.1148
Raymo, M. E., Oppo, D. W., Flower, B. P., et al. (2004). Stability of North Atlantic water masses in face of pronounced climate variability during the Pleistocene. Paleoceanography 19, 1–13. doi: 10.1029/2003pa000921
Ruddiman, W. F. (1977). North Atlantic ice-rafting: a major change at 75,000 years before the present. Science 196, 1208–1211. doi: 10.1126/science.196.4295.1208
Sato, M., Makio, M., Hayashi, T., and Ohno, M. (2015). Abrupt intensification of North Atlantic Deep Water formation at the Nordic Seas during the late Pliocene climate transition. Geophys. Res. Lett. 42, 4949–4955. doi: 10.1002/2015GL063307
Sato, T., Yuguchi, S., Takayama, T., and Kameo, K. (2004). Drastic change in the geographical distribution of the cold-water nannofossil Coccolithus pelagicus (Wallich) Schiller at 2.74 Ma in the late Pliocene, with special reference to glaciation in the Arctic Ocean. Mar. Micropaleontol. 52, 181–193. doi: 10.1016/j.marmicro.2004.05.003
Schulz, M. (2002). On the 1470-year pacing of Dansgaard-Oeschger warm events. Paleoceanography 17. doi: 10.1029/2000PA000571
Keywords: ice-rafted debris, rock magnetism, North Atlantic deep water, early pleistocene, integrated ocean drilling program
Citation: Ohno M, Hayashi T, Sato M, Kuwahara Y, Mizuta A, Kita I, Sato T and Kano A (2016) Millennial-Scale Interaction between Ice Sheets and Ocean Circulation during Marine Isotope Stage 100. Front. Earth Sci. 4:55. doi: 10.3389/feart.2016.00055
Received: 27 February 2016; Accepted: 19 April 2016;
Published: 09 May 2016.
Edited by:
Qingsong Liu, Chinese Academy of Sciences, ChinaReviewed by:
Hong Ao, Chinese Academy of Sciences, ChinaCopyright © 2016 Ohno, Hayashi, Sato, Kuwahara, Mizuta, Kita, Sato and Kano. This is an open-access article distributed under the terms of the Creative Commons Attribution License (CC BY). The use, distribution or reproduction in other forums is permitted, provided the original author(s) or licensor are credited and that the original publication in this journal is cited, in accordance with accepted academic practice. No use, distribution or reproduction is permitted which does not comply with these terms.
*Correspondence: Masao Ohno, bW9obm9Ac2NzLmt5dXNodS11LmFjLmpw
Disclaimer: All claims expressed in this article are solely those of the authors and do not necessarily represent those of their affiliated organizations, or those of the publisher, the editors and the reviewers. Any product that may be evaluated in this article or claim that may be made by its manufacturer is not guaranteed or endorsed by the publisher.
Research integrity at Frontiers

Learn more about the work of our research integrity team to safeguard the quality of each article we publish.