- 1Dipartimento di Science, Università Roma Tre, Rome, Italy
- 2Laboratori Nazionali di Frascati, Istituto Nazionale di Fisica Nucleare, Rome, Italy
- 3Laboratorio di alte pressioni e temperature, Istituto Nazionale di Geofisica e Vulcanologia, Rome, Italy
- 4Diamond Light Source Ltd, Oxford, UK
- 5Department of Mathematics and Physics, Università Roma Tre, Rome, Italy
- 6Institut für Mineralogie, Leibniz Universität, Hannover, Germany
In this work we investigate the strongly inhomogeneous distribution of CO2 and H2O in a synthetic beryl having a peculiar hourglass zoning of Cr due to the crystal growth. The sample was treated at 800°C, 500 MPa, in a CO2-rich atmosphere. High-resolution FESEM images revealed that the hourglass boundary is not correlated to physical discontinuities, at least at the scale of tens of nanometers. Polarized FPA-FTIR imaging, on the other side, revealed that the chemical zoning acts as a fast pathway for carbon dioxide diffusion, a feature never observed so far in minerals. The hourglass zone boundary may be thus considered as a structural defect possibly due to the mismatch induced by the different growth rates of each sector. High-resolution synchrotron-light FTIR imaging, in addition, also allows enhancement of CO2 diffusion along the hourglass boundary to be distinguished from diffusion along fractures in the grain. Therefore, FTIR imaging provides evidence that different diffusion mechanisms may locally combine, suggesting that the distribution of the target molecules needs to be carefully characterized in experimental studies. This piece of information is mandatory when the study is aimed at extracting diffusion coefficients from analytical profiles. Combination of TOF-SIMS and FPA data shows a significant depletion of type II H2O along the hourglass boundary, indicating that water diffusion could be controlled by the distribution of alkali cations within channels, coupled to a plug effect of CO2.
Introduction
Diffusion of hydrogen-oxygen species in minerals as a function of T and P has been addressed by numerous experimental studies (e.g., Ingrin and Blanchard, 2006; Watson and Baxter, 2007; Farver, 2010 and references therein); these processes have in fact extremely important consequences in Earth Science systems. Diffusion may occur in different ways, including: (i) intra-crystalline (volume), (ii) grain boundary (Fukuda et al., 2009; Demouchy, 2010a,b), (iii) dislocation (Yund et al., 1981), or (iv) planar defects (Zhang et al., 2006) diffusion. Intra-crystalline diffusion is the slower mechanism, whereas grain boundaries and planar defects act as fast pathways for the traveling of ions or molecular species (e.g., Zhang et al., 2006). A particular case is provided by those rock forming minerals that are structurally characterized by cavities or channels which leave free space to the molecular diffusivity: notable examples are the zeolites, several sorts of feldspathoids, and ring silicates such as beryl and cordierite; there is increasing evidence that diffusion along these connected structural cavities is typically faster than the volume diffusion (e.g., Radica, 2015). A major problem in diffusion studies is the lack of reliable microchemical data for the target molecules; this problem is exacerbated when dealing with C-O-H arrangements, due to the well-known difficulty of quantifying light-elements, their speciation and distribution across the sample. For instance, diffusivities determined using bulk analyses may be orders of magnitude greater that those obtained from diffusion profiles (Zhang and Cherniak, 2010); the former may be affected by the presence of cracks (e.g., Radica, 2015), extended defects or additional pathways that may be underestimated. FTIR-FPA imaging offers a very powerful tool to visualize directly the distribution of the target molecule across the sample, however its use in Earth Sciences is still relatively rare (Della Ventura et al., 2010, 2014; Marxer and Novak, 2013). Commercially available FPA arrays are typically composed of 1024 × 1024 FTIR detectors a few tens of microns or less in dimension, and allow the acquisition of thousands of IR spectra simultaneously generating mid-IR (MIR) images with a high resolving power. The optical system of an IR microscope equipped with a FPA is an apertureless imaging system, whose ultimate spatial resolution is comparable (although never better) than that attainable by confocal microscopes. Nevertheless, FPAs enable different imaging modes at the resolution of a few microns and, thanks to their sensitivity and read-out speed, massive and fast data collection within minutes are possible (Della Ventura et al., 2014).
Beryl is a relatively rare rock-forming mineral, and is found as an accessory constituent in pegmatites, in cavities of granitic rocks and occasionally in metamorphic rocks (see Deer et al., 1986). A rare occurrence in a volcanic syenitic ejectum has also been reported (Della Ventura et al., 2000, 2007). It is structurally a ring silicate with ideal formula Be3Al2Si6O18, consisting of six-member hexagonal rings of tetrahedra. The vertical stacking of these rings forms a succession of interconnected cages arranged along the c axis (Figure 1A). The cages have a maximum diameter of about 5.0 Å and a minimum diameter of 2.8 Å (Gibbs et al., 1968); channel height is about 4.7 Å (Fukuda and Shinoda, 2011) and may host different atoms and/or molecular groups. H2O and CO2 are the main constituents in beryl channels (Wood and Nassau, 1968; Aines and Rossman, 1984) and are located in the wider sites of the channels (2a position in Figure 1A). Larger ions like Cs+ and K+ (Hawthorne and Cěrný, 1977) and possibly OH groups (Wickersheim and Buchanan, 1959; Aurisicchio et al., 1994) may also be located in the 2a position, while smaller cations like Na+ (Wood and Nassau, 1968) occur at the narrower 2b site (Figure 1A).
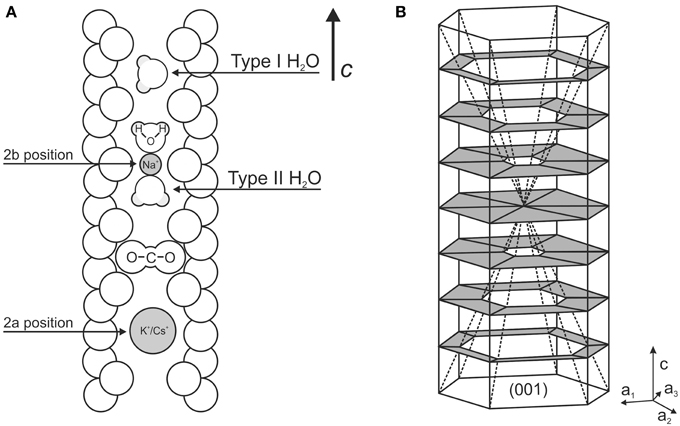
Figure 1. (A) Schematic section of beryl channel parallel to [001], modified after Fukuda and Shinoda (2011). (B) Sketch of the hourglass zoning within beryl (modified after Hollister, 1970).
Polarized FTIR data show that the linear CO2 molecules are oriented orthogonally to the c axis (Wood and Nassau, 1968; Aines and Rossman, 1984). Extra-framework H2O occur in the structural channels with the molecular plane parallel to [001] and may present two different orientations (Figure 1A): in type I H2O (hereafter H2O[I]) the H–H vector is oriented parallel to the c axis and in type II H2O (H2O[II]) the H–H vector is rotated by 90° orthogonally to the c axis (Wood and Nassau, 1968; Bellatreccia et al., 2008). H2O molecules of this latter type are locally bonded to alkali cations sited in the 2b position (Goldman et al., 1977; Hawthorne and Cěrný, 1977).
H2O and CO2 diffusion in beryl has been recently studied by Fukuda et al. (2009) and in Radica (2015); the available data show without any doubt that mobility of molecules across the mineral occurs preferentially, if not exclusively, along the structural channels.
In this work we describe the crystal-chemistry of one beryl grain recovered from one of the CO2 diffusion experiments described in Radica (2015). Preliminary FTIR-FPA data showed a peculiar inhomogeneity of CO2 and H2O across the run product, thus the sample has been characterized in detail using a multidisciplinary approach. The volatile distribution, in particular, has been studied by high-resolution synchrotron-radiation (SR) FTIR-FPA imaging. The use of polarized light on oriented crystal sections was employed to examine the distribution of extraframework molecules with different orientation within the structural channels. The data clearly demonstrate that careful determination of the inhomogeneity of volatile species is mandatory when modeling diffusion processes in experimental studies. The lack of this piece of information may in fact lead to incomplete or, possibly, wrong results in terms of both the diffusion mechanism, and the calculation of diffusion coefficients from analytical profiles.
Materials and Methods
The single-crystal used as starting product for the experiments described here is a synthetic beryl from the very first attempt to produce Li2O and MoO3 flux-grown emeralds; the crystals were obtained after 15 days of annealing at 800°C, whereas higher temperatures lead to formation of phenakite. Experimental methods, used reagents and additional information can be found in Hautefeuille and Perrey (1888, 1890). Batches of these syntheses are currently kept in the mineralogical collection of Muséum National d'Histoire Naturelle in Paris (MNHN), and some grains were kindly donated to us to be used for scientific research. The batch consists of fairly large (up to 1.0 × 0.5 mm) emerald-green prismatic crystals; preliminary SEM-BSE analyses typically showed a particular hourglass zoning of Cr (Figure 1B, see also Liedl et al., 2015), a feature that had already been described by Bellatreccia et al. (2008) for grains coming from a different batch kept at the Museum of Mineralogy of University La Sapienza (Rome).
Some crystals were used for the experiments described below; one of these samples, recovered after the run, has been fully characterized by a combination of methods, and the results will be discussed in this text. One additional, untreated crystal from the same batch, was oriented using its prismatic morphology, embedded and doubly polished for EMPA-WDS chemical mapping and single spot analysis using a JEOL JXA 8200 WD-ED electron micro probe at INGV (Rome). Working conditions were 15 kV accelerating voltage, 40 nA probe current, 1 μm beam diameter, 70 ms counting time. The standards, spectral lines and crystals used were: anorthoclase (Na Kα, TAPH), K-feldspar (Si Kα, PETH), K-feldspar (K Kα, PET), anortoclase (Al Kα, TAP), Mg-chromite (Cr Kα, LIFH). Data reduction was performed using the ZAF method (Pouchou and Pichoir, 1985). BeO was calculated by stoichiometry.
The BSE image (Figure 2, top left) clearly shows the sector zoning mentioned above. The XRF maps reveal that the zoning visible in the BSE image is related to the distribution of Cr; this element is in fact significantly enriched in the outer sector. A slight inhomogeneity is also observed for Si that is enriched in the inner sector, while both Al and K are slightly enriched in the outer sector. The eventual zoning of Na is unclear from these images, due to its low concentration. Selected microchemical data are given in Table 1, for the high Cr and Low Cr sectors, respectively. In line with the data presented by Bellatreccia et al. (2008), the Cr content is close to 2.0 wt% in the high-Cr zones, while being <1.0 wt% in the low-Cr zones. The Na content is too low to allow conclusions on its distribution based on EMP, while the K content, although very low, is clearly slightly higher in the Cr-rich areas, as indicated by the XRF images of Figure 2.
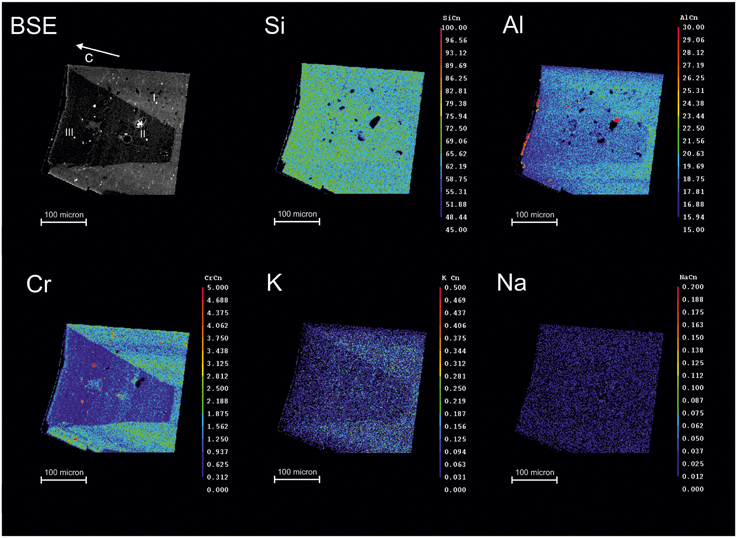
Figure 2. EMPA-WDS maps of selected elements for the untreated beryl sample; the grain was oriented parallel to [001] using its prismatic morphology. The color scale is proportional to element concentration. Analytical spots for Table 1 are reported.
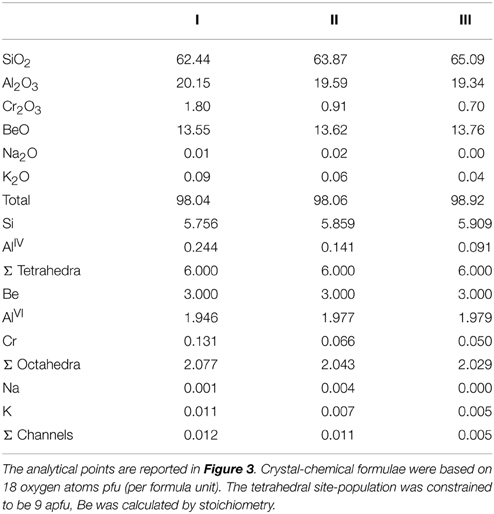
Table 1. Microchemical analyses for the beryl of Figure 2, collected in the high-Cr (I) and low-Cr sectors (II and III), respectively.
Differently from the crystal studied by Bellatreccia et al. (2008), which showed traces (~30 ppm) of H2O, several single-spot spectra collected at random on the sample studied here showed the crystal to be completely anhydrous and, obviously, CO2-free. This point is particularly important for the discussion below.
The experiments were done using 3 (inner diameter 2.6 mm) × 9 mm Au capsules; silver oxalate was used as a CO2 source to saturate the system with carbon dioxide during HT/HP treatment. Ag2C2O4 decomposes into 2Ag + 2CO2 at 140 °C, yielding a theoretical CO2 content ≈29 wt.%. Al2O3 powder (Al2O3 = 99.72 wt.%, SiO2 = 0.07 wt.%, others = 0.21 wt.%) was mixed in 1 to 1 ratio by wt with Ag2C2O4, and added to the charge. The aluminum oxide powder was used to prevent the contact between the crystals and the capsule walls after the silver oxalate disappearance at higher T. Thus, homogeneous distribution of the fluid around the crystal is ensured. All components used to prepare the tubes were dried up in oven at 110°C in order to avoid moisture contamination, however, despite this precaution, FTIR data (see below) revealed significant H2O in the sample after the run.
HT/HP experiments were performed using an externally heated vessel at Institut für Mineralogie, Leibniz Universität Hannover (Germany) using water as the pressure medium. The temperature uncertainty at the sample position is estimated to be ±10°C and pressure was automatically controlled to be within 5 MPa (Behrens, 2010); oxygen fugacity within the vessel was close to NNO (Jakobsson, 2012). The sample was treated at 800°C and 500 MPa for 4 days. The X-ray diffraction pattern of the powder added within the tube revealed the presence of residual alumina (corundum) and metallic silver, together with traces of silver oxide. The beryl sample was separated from the residual powder, oriented using its perfect prismatic morphology, embedded in epoxy resin and doubly polished to 63 μm; sample thickness was determined using an electronic micrometer with ±2 μm uncertainty.
Preliminary FTIR spectra, with aperture 20 × 80 μm were acquired using a Bruker™ Hyperion 3000 microscope equipped with a KBr broadband beamsplitter and a liquid nitrogen-cooled MCT detector at Istituto Nazionale di Fisica Nucleare (LNF-INFN,) Frascati (Rome). High-resolution spectra were acquired at beamline B22, Diamond Light Source Laboratory (Oxford, UK) using a similar set up except the beam was from a synchrotron FTIR source instead a Globar source. The polarized spectra were collected using a gold-wire-grid polarizer on a ZnSe substrate. A 15 × objective in conventional light and 36 × objective in synchrotron light were employed; the nominal resolution was 4 cm−1 and 128 scans were averaged for both spectrum and background. FTIR images were collected with a 64 × 64 pixel focal-plane array (FPA) of liquid nitrogen-cooled MCT detectors. The nominal resolution was set at 4 cm−1 and 64 scans were averaged for each spectrum and background; each image covers an area of 170 × 170 μm with a nominal spatial resolution of ~5 μm (Della Ventura et al., 2010, 2014).
Time of Flight - Secondary Ion Mass Spectrometry (TOF–SIMS) images were collected on a TOF. SIMS 5 (IONTOF, Münster, Germany) reflectron-type TOF mass-spectrometer at Dipartimento di Matematica e Fisica, University of Roma Tre. The primary ion source was a 30 keV bismuth liquid metal ion gun (LMIG). The bismuth ion beam was used also to remove contamination from the sample surface by using the ion beam in DC-mode for 50 scans with a current of 15 nA. TOF-SIMS analyses were performed in high mass resolution mode corresponding to low image resolution. Low image resolution analyses were performed using an area of 350 × 350 μm. All images obtained in positive ion mode were 512 × 512 pixels. An electron gun was used to minimize charging of the surface.
Results and Discussions
TOF-SIMS Imaging
Figure 3 shows the distribution of selected chemical components across the beryl extracted from the vessel after the T/P treatment, obtained by TOF-SIMS imaging. Inspection of Figure 3A shows that the crystal has a well-evident hourglass growth structure, which is visible in optical microscopy under both parallel and crossed polars. Figure 3B indicates that, as already discussed above, the hourglass zoning is essentially visible due to the Cr3+ distribution across the crystal; in particular comparing Figures 3A,B it is possible to observe that the Cr3+ zoning is also mainly responsible for the difference in birefringence in the different sides of the grain: higher birefringence (darker-yellow colors in Figure 3A) is associated with higher Cr content, while a lower Cr content is associated with a lower birefringence (pale yellow/white in Figure 3A). Such a distribution has been recently characterized in 3D by Liedl et al. (2015) on a crystal from the same batch and later used for microchemical analyses (see below) using μ-CT X-ray tomography.
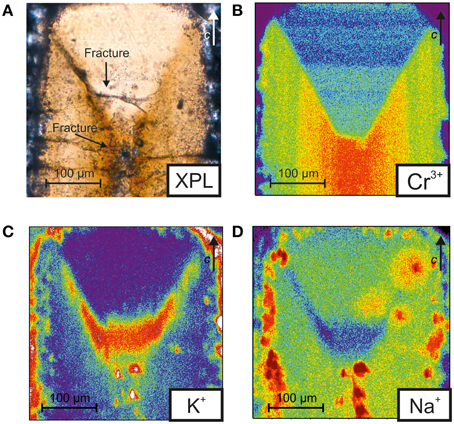
Figure 3. (A) Crossed polars optical image (XPL) and (B–D) TOF-SIMS images of the studied beryl sample after the experimental run. The color scale is proportional to the element contents from red (high) to blue (low).
Figures 3C,D show a peculiar distribution of K+ and Na+ which indicates that, despite the fact that these elements are present as trace elements within structural channels, their content also is inhomogeneously distributed and seem to trace out the hourglass boundary and crystal faces. In agreement with XRF images (Figure 2), TOF-SIMS data show that the K content is slightly higher in the outer sector while Na seems to be inversely correlated to K (compare Figure 3C with Figure 3D).
Polarized-Light FTIR Spectra, Band Assignment, and Volatile Contents
Figure 4 shows selected polarized FTIR spectra collected on the treated single-crystal close to the (001) edge of the grain, were the maximum CO2 (and H2O) content is expected (Fukuda et al., 2009; Radica, 2015). The polarized single-crystal infrared spectrum of beryl has been studied by several authors, after the early work of Wood and Nassau (1967, 1968) and Aines and Rossman (1984) who clearly showed that the beryl channels may host H2O and CO2. In the 4000–3200 cm−1 range, when the electric vector E is parallel to the c axis (E//c), two very sharp and intense peaks occur at 3699 cm−1 and 3602 cm−1. Based on the literature data (Wood and Nassau, 1967; Charoy et al., 1996; Kolesov and Geiger, 2000; Gatta et al., 2006; Della Ventura et al., 2007; Adamo et al., 2008; Bellatreccia et al., 2008) the former peak is assigned to the ν3 mode of H2O[I], while the latter peak is assigned to the ν1 mode of H2O[II]. In the same range, the E⊥c spectrum consists of a very broad multi-component absorption with maxima at 3724, 3675, and 3605, and a shoulder around 3591 cm−1; pertinent to the following discussion is the 3675 cm−1 band (arrowed in Figure 4), assigned to the ν3 mode of H2O[II] (Wood and Nassau, 1967; Charoy et al., 1996).
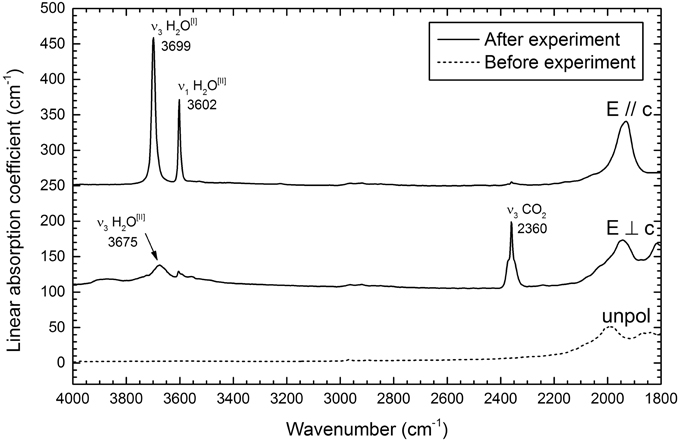
Figure 4. Polarized FTIR spectra of the treated beryl single-crystal (solid lines). Data collected on a 63 μm thick, (hk0) section. The single-crystal unpolarized spectrum (dashed line) of an untreated beryl from the same batch is reported for comparison. Spectra scaled to thickness.
In the 2600–2000 cm−1 range, the very sharp and asymmetric peak centered at 2360 cm−1 for E⊥ c is assigned to the ν3 mode of CO2 (Wood and Nassau, 1967; Charoy et al., 1996); in the same range the E//c spectrum is featureless, in agreement with the fact that the CO2 molecule is aligned normal to the c-axis (Charoy et al., 1996, see also Figure 1).
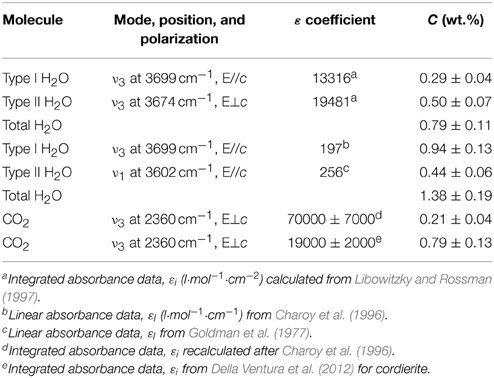
Both the H2O and CO2 contents were quantified from the polarized data collected close to the sample edge. The Lambert-Beer equation: C = (Aitot · k)/(εi · D · t), was used, where C is the concentration in wt%, Aitot is the total integral absorbance in cm−1 (Aitot = Ai//c + 2 · Ai ⊥ c: Libowitzky and Rossman, 1996), D is the sample density in g·cm−3 and t is the sample thickness in cm. kH2O = 1.8 (Beran et al., 1993) and kCO2 = 4.401 (Della Ventura et al., 2009, 2012) were used to convert H2O and CO2, respectively, from mol·l−1 to wt.%. The critical point in the Lambert-Beer equation is the integral molar absorption coefficient, ε, which is matrix-dependent and needs to be calibrated for the mineral under investigation; alternatively it can be derived from empirical curves such as the one proposed by Libowitzky and Rossman (1997). For beryl, εH2O values are available in the literature, however their use is complicated by the fact that H2O occurs in two different molecular configurations, which absorb the IR beam at different wavenumbers. In addition, previous authors have used either integrated or linear absorbance data, thus it is difficult to compare results from different methods. We give in Table 2 the contents derived using both the εH2O coefficients calculated from the curve of Libowitzky and Rossman (1997) for H2O[I] and H2O[II], independently, and the εH2O values given by Charoy et al. (1996) and Goldman et al. (1977), as proposed by Fukuda et al. (2009). Table 2 gives also the CO2 content calculated using the ε value recalculated after Charoy et al. (1996). The error σC associated with C was obtained according to Bellatreccia et al. (2005). For sake of comparison we also list in Table 2 the CO2 content obtained using the εi calibrated by Della Ventura et al. (2012) for the closely (structurally) related cordierite.
As a general comment, it is evident from Table 2 that the choice of the absorption coefficient is crucial when quantifying the amount of H2O and CO2 in beryl: using the curve of Libowitzky and Rossman (1997) the final total H2O content is in fact halved with respect the result obtained when using the coefficients calibrated by other authors. In addition, the relative amount of H2O[I]/H2O[II] is also reversed. Therefore, until reliable molar specific coefficients are calibrated for beryl, the values reported in Table 2 must be considered as just indicative. For CO2, in particular, Della Ventura et al. (2012) provided recently a molar absorption coefficient for cordierite, based on SIMS + FTIR data on a well-characterized set of samples. However, at present, it is unknown whether, despite the close structural similarity, the εCO2 coefficient calibrated for cordierite is also valid for beryl.
A second point to note is that, although we used dry experimental conditions, the maximum amount of water incorporated into the sample is significantly higher than that of CO2. As explained above, the absolute H2O/CO2 amounts can be affected by the use of unsuitable εH2O coefficients, however, it is indisputable that the FTIR spectra of Figure 4 show significant H2O in the examined sample which originates from water adsorbed on silver oxalate and on aluminum oxide powder used for the experiments.
Polarized FPA-FTIR Imaging
The distribution of H2O[I], H2O[II], and CO2 across the treated beryl (Figure 5) was studied by using polarized FTIR FPA imaging; in this work, polarized light was necessary to differentiate the absorptions related to H2O[I] and H2O[II] (e.g., Della Ventura et al., 2010). It must be noted that laser interferometry, done on a set of selected doubly-polished crystals, revealed the lack of significant differences in thickness, at least at the micron scale, across the slabs. Some samples showed occasionally a slightly wedged shape, which cannot affect the peculiar inhomogeneities in the absorbance described below. Contour maps were obtained by integrating the ν3 antisymmetric stretching mode of H2O[I] at 3699 cm−1 (Figure 5B) for E//c, the ν1 symmetric stretching mode of H2O[II] at 3602 cm−1 (Figure 5C) for E//c, and the ν3 antisymmetric stretching mode of CO2 at 2360 cm−1 (Figure 5D) for E⊥c.
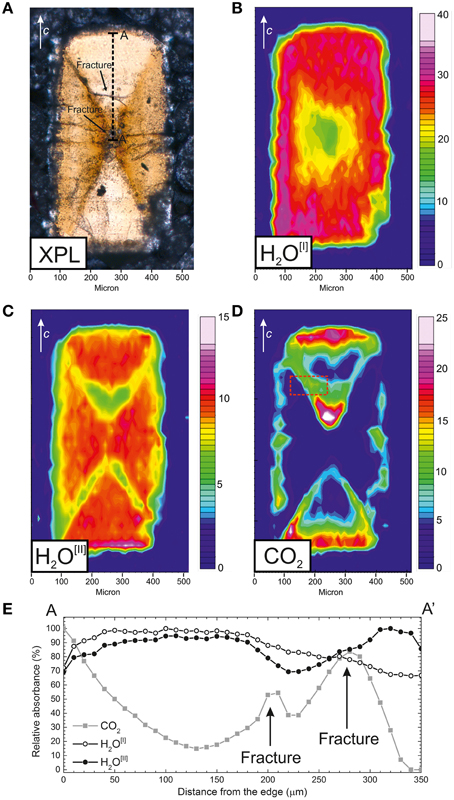
Figure 5. (A) Crossed polars optical image (XPL) of the treated beryl sample. Polarized-light FPA-FTIR images of (B) H2O[I] distribution, E//c, integration range 3740–3655 cm−1, (C) H2O[II] distribution, E//c, integration range 3630–3577 cm−1, and (D) CO2 distribution, E⊥c, integration range 2396–2325 cm−1. Chromatic scale is proportional to H2O and CO2 contents. Data collected under using Globar FTIR light. (E) absorbance profiles along the AA′ trace in (A) for H2O[I] (open circles), H2O[II] (open triangles), and CO2 (solid squares); intensity data are expressed as % of the maximum intensity for each molecule. Fractures are present at about 200 and 280 μm from the grain edge. Spot size 15 × 15 μm, step 10 μm.
Figure 5B shows that H2O[I] is distributed rather homogeneously across the sample, except close to the core of the grain, where the H2O[I] content decreases to almost 70%. H2O[II] is also distributed rather homogeneously (Figure 5C), however along the hourglass boundary its content decreases also to about 70%. CO2 on the opposite is distributed exclusively close to the (001) basal edges of the crystal, as expected (Radica, 2015), and, surprisingly, along the hourglass boundaries.
Figure 5E shows the distribution trend for H2O[I] (open circles), H2O[II] (solid circles) and CO2 (solid squares) along the AA′ trace indicated in Figure 5A. Single-spot SR-FTIR analyses were collected with a beam size of 15 × 15 μm and absorbance data were obtained by integrating the ν3 mode at 3699 cm−1 for H2O[I], the ν1 mode at 3602 cm−1 for H2O[II] and the 2360 cm−1, ν3 mode, for CO2. The intensity data for each band were scaled to the maximum intensity. The diffusion profiles confirms that the H2O[I] content (open circles) is almost constant until ~200 μm from the grain edge, then progressively decrease close to the core of the grain. The H2O[II] content (solid circles), on the other hand, is almost constant from rim to core; it decrease in the vicinity of the hourglass boundary crossed by the profile (Figure 5A) and then increases again. The CO2 absorbance (solid squares) has a trend opposite to H2O[II]: starting from the edge of the grain, it decrease progressively until it reaches a minimum around 130 μm from the edge. The CO2 content, in addition, shows two relative maxima around 200 and 280 μm from the edge, and finally goes to zero at the core of the grain. The relative maxima in CO2 content correspond to fractures present inside the treated grain as also shown by the XPL picture (Figure 5A). As discussed in Della Ventura et al. (2014) the vertical (axial) resolution of modern FTIR imaging is comparable to the lateral resolution when using confocal geometries, thus making 3D imaging technically feasible. However, to the best of our knowledge, 3D FTIR imaging has been never attempted so far in Earth Science materials because of the need to control, with a micrometric resolution, the stage displacement along the vertical direction.
Hourglass Zoning and CO2 Diffusion
The work of Radica (2015), showed that carbon dioxide diffusion in beryl is faster along the structural channels parallel to [001], and eventually along fractures presents in the crystal, compared to any other crystallographic direction. This behavior is in agreement with the diffusion mechanism of H2O in beryl (Fukuda et al., 2009). The spectroscopic image given in Figure 5D clearly demonstrates that the CO2 diffusion proceeds preferentially from the (001) surface into the grain along the [001] direction. Single-spot quantitative data collected on a traverse parallel to [001] (Figure 5E) in addition show that the CO2 concentration profile follows the typical mono-dimensional diffusion trend (see for example Fukuda et al., 2009; Zhang and Cherniak, 2010; Radica, 2015) up to about 130 μm from the crystal edge. However, Figure 5D shows a feature that has never been observed so far, i.e., a clear and significantly increased diffusion of CO2 along the boundaries of the hourglass zoning of chromium. In other words, the FPA images show that the hourglass boundary acts as a preferential, fast pathway, for the CO2 diffusion.
Figure 6A displays a high-resolution FTIR map of the CO2 distribution across the hourglass boundary. This image was collected using a synchrotron source, with a spot size of 10 × 10 μm and a step of 5 μm, i.e., oversampling the data by significant overlapping of the signal; accordingly, these conditions ensure both a very high spatial resolution and an excellent signal-to-noise ratio (Della Ventura et al., 2014). Figure 6B gives also, for comparison, the FTIR map obtained on the same area when using a conventional IR source, with a spot size of 20 × 20 μm and a step of 10 μm; the gain in resolution due to the use of SR radiation is evident. From Figure 6A it is possible to distinguish two main directions of CO2 diffusion: one parallel to the hourglass boundary (solid line) and a second along a fracture inside the grain (dashed line) that is well-visible in the optical image of Figure 5A. To get a better insight into this issue we tried to check whether or not a physical discontinuity, i.e., a crack, was formed during the heat/pressure treatment, thus implying that the hourglass structure simply acted like a fracture in enhancing the CO2 diffusion.
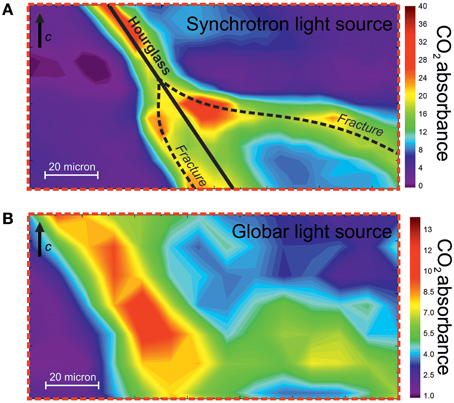
Figure 6. (A) FTIR map of the CO2 distribution in the indicated portion (red broken-line box in Figure 5D) of the beryl sample; spectra collected with synchrotron radiation. The traces of the hourglass growth structure and the fractures are indicated. The same image obtained using a Globar IR radiation is given for comparison in (B). The chromatic scale is proportional to the CO2 content.
Figure 7 shows high-resolution FESEM (Field-Emission SEM) images of selected areas of the studied sample. The areas were chosen across the hourglass boundary, both in a point optically clean and without fractures (I) and in a second, fractured point (II). The BSE (back-scattered electron) pictures displayed in Figures 7A,C show that the higher magnification images given in Figures 7B,E,F were indeed collected across the hourglass boundary, i.e., across the compositional discontinuity due to the different Cr contents, and across a fracture (Figure 7D) running semi-parallel to this boundary. High-resolution SE (secondary electrons) morphological images collected in the area displayed in Figure 7A show a perfectly flat surface suggesting that no cracks are present along the hourglass boundary (Figure 7B, black broken line), while in correspondence of the fracture visible in Figures 7C,D, a defined groove is clearly present (Figures 7E,F). The FESEM images of Figure 7 thus allow concluding that, at least at the scale of tenths of nm, the hourglass structure is exclusively due to a compositional inhomogeneity, and that there is no physical discontinuity along the compositional boundary. This being the case, the diffusion path observed along this structure (Figures 5, 6) cannot be ascribed to a fracture-enhanced diffusion mechanism, therefore the process responsible for the enrichment of CO2 in specific directions of the sample (i.e., along the hourglass boundaries) is probably similar to a defect-enhanced mechanism.
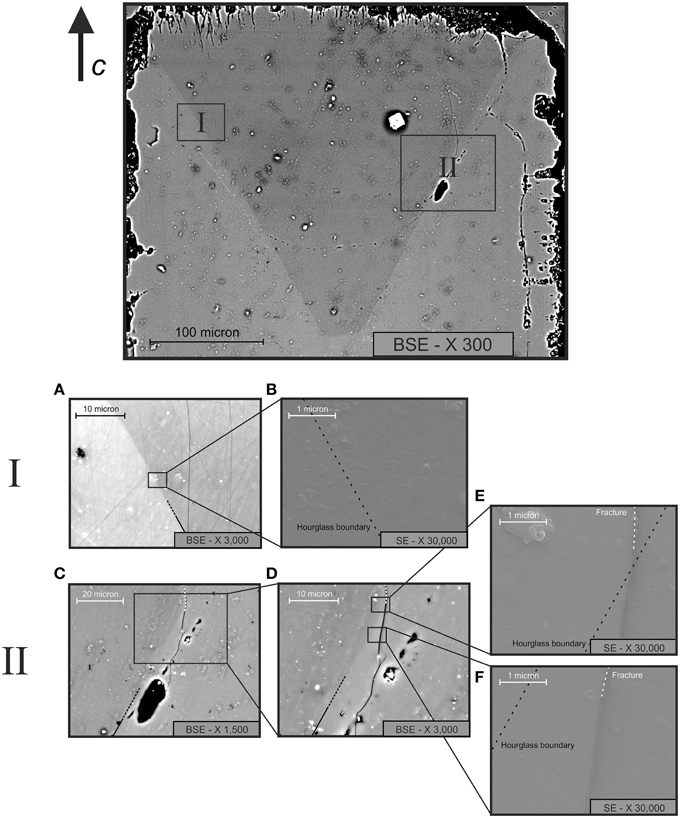
Figure 7. FESEM images of the treated beryl sample across the hourglass boundary, in a fracture-free area (A,B) and in a fractured area (C–F). Note that in (A,C,D) BSE (compositional) images of the investigated areas are shown, while in (B,E) and f morphological SE images are displayed. The black dashed line (B,E,F) indicates the boundary of the hourglass sector zoning, while the white dashed line (E,F) indicates a fracture in the grain.
Hollister (1970) showed that differences in growth rates of different crystal faces may cause a mismatch in the periodical structure, and concluded that this mechanism may be responsible for the formation of sector zoning in minerals. The mismatch is usually characterized by chemical zoning, which is controlled by the presence of particular ions in the supply material, and by differences in local charge-balance and/or atomic geometrical conditions (Hollister, 1970; Bahat, 1974); for instance this process has been shown to be responsible for Pb zoning in synthetic cordierite (Wunder et al., 1991), Cr zoning in Be-indialites (Mikhailov et al., 2007) and can explain the Cr zoning in the crystals studied here (Figure 3).
The images of Figure 6 suggest that the defects arising from the structural mismatch likely speed up the diffusion of CO2, similarly to what observed along a fracture. Zhang et al. (2006) studied the oxygen diffusion in titanite under different experimental conditions and observed that planar defects may act as fast-path for diffusion inside the crystal lattice and that diffusion along these directions may be even 4–5 orders of magnitude faster than the lattice diffusion at the same PTt conditions. A similar mechanism could explain the penetration of CO2 down to the core of the grain along the hourglass discontinuity. A consequence of this discussion is that, in experimentally treated samples, several diffusion mechanisms may locally act, thus affecting the analytical results and hence the diffusivity models established from the punctual analytical data.
The Possible Role of Alkali Ions on the H2O Diffusion
The images displayed in Figures 5B,C suggest that the role of the hourglass zoning on the H2O diffusion is extremely different to that so far discussed for CO2. As a matter of fact, the FTIR-FPA data show that while H2O[I] diffusion (Figure 5B) is no or slightly affected by the chemical zoning, the H2O[II] incorporation is significantly decreased where the CO2 concentration is higher. In Figure 1A we showed that both H2O and CO2 share the same crystallographic position (2a) in the channel, thus we would expect that areas with a higher concentration of CO2 (like the hourglass traces) presented a lower total H2O content. However, the FPA images show that only H2O[II] is depleted along the hourglass traces, while H2O[I] is unaffected. In the introduction paragraph we mentioned that H2O[II] is associated to the monovalent cations inside the channels (Wood and Nassau, 1968; Goldman et al., 1977), and we also mentioned that in beryl K+ and other larger cations are located in the larger 2a site (Hawthorne and Cěrný, 1977), where H2O[II] is also located; in Figure 3 we observe that along the hourglass boundary there is an increase in K+ and a decrease of Na+. Considering that H2O[II] may be associated preferentially, if not exclusively, to Na+, we conclude that the H2O[II] depletion along the hourglass discontinuity could be looked for in the combined result of a paucity of Na (which is preferentially bound to H2O) and an increase K+ content at the 2a site (Figure 1). In other words, the presence of K filling the 2a sites would prevent the occurrence of H2O at the same site (compare Figures 3C,D with Figure 5C). Aines and Rossman (1984) concluded in their high-T study of water and CO2 in cordierite and beryl that CO2 probably acts as a partial plug for the diffusion of H2O along the cordierite channels. The same feature was also observed by Johannes and Schreyer (1981) in their hydrothermal equilibration studies on cordierite. Moreover, CO2 may alter the local thermodynamic equilibrium of H2O, affecting a particular speciation of water, similarly to the problem of diffusion and speciation of OH and H2O in melt/glasses (e.g., Zhang, 1999). These latter considerations suggest that an additional reason for the depletion of H2O[II] along the hourglass boundary could be simply connected with the increased amount of CO2.
Conclusion
The most important conclusion of this work is that experimental studies of the volatile (H, C and their molecular arrangements) diffusion in minerals (and melts) must be coupled to spectroscopic imaging techniques to characterize the actual distribution of the target molecules across the samples. Severe, and often unexpected inhomogeneities can significantly affect the final results and, in case of diffusion studies, the hypothesized model/mechanism. For example, in the case presented here, the spectroscopic data suggest the possible combination of (i) a defect-controlled diffusion, (ii) a fracture-induced diffusion, and (iii) a structural (channel) diffusion (Fukuda et al., 2009). Therefore, a careful characterization of the distribution of the target molecule inside the matrix is mandatory because measurement of diffusion coefficients could be extremely complicated by local effects.
Author Contributions
GDV, FR, and FB are responsible for project design, sample preparation and FTIR analyses. GDV and FR wrote the manuscript. GC contributed with the SR-FTIR analyses and high-resolution FPA imaging. FR and HB did the diffusion experiments. AC carried out the FESEM analyses. LT carried out the TOF-SIMS analyses. All authors contributed to the discussion and final manuscript.
Conflict of Interest Statement
The authors declare that the research was conducted in the absence of any commercial or financial relationships that could be construed as a potential conflict of interest.
Acknowledgments
Thanks are due to G. Iezzi (Università G. D'Annunzio, Chieti), and J. Ingrin (Univerité Lille 1, Lille) for helpful suggestions for an early draft of the paper. We thank Diamond Light Source for access to MIRIAM beamline B22 (proposal number 8963). The research leading to the results presented here has received funding from the European Community's Seventh Framework Programme (FP7/2007–2013) under the grant agreement n° 226716. Special thanks are due to Dr. B. Rondeau (Nantes) and Dr. J.J. Chiappero (Museum National d'Histoire Naturelle, Paris) who gently provided the hystorical emeralds which were used for the experiments and to Mariangela Cestelli Guidi (INFN, Frascati) for helping with FTIR analyses. LT thanks “Fondazione Roma” for financial support to the TOF-SIMS Laboratory. The positive criticism of three anonymous referees helped in clarifying some aspects of the manuscript.
References
Adamo, I., Gatta, G. D., Rotiroti, N., Diella, V., and Pavese, A. (2008). Gemmological investigation of a synthetic blue beryl a multi-methodological study. Miner. Mag. 72, 799–808. doi: 10.1180/minmag.2008.072.3.799
Aines, R. D., and Rossman, G. R. (1984). The high temperature behavior of water and carbon dioxide in cordierite and beryl. Am. Miner. 19, 319–327.
Aurisicchio, C., Grubessi, O., and Zecchini, P. (1994). Infrared spectroscopy and crystal chemistry of the beryl group. Can. Miner. 32, 55–68.
Bahat, D. (1974). Phase transformation and development of hourglass pattern in synthetic barium feldspar. Am. Miner. 59, 139–142.
Behrens, H. (2010). Ar, CO2 and H2O diffusion in silica glasses at 2 kbar pressure. Chem. Geol. 272, 40–48. doi: 10.1016/j.chemgeo.2010.02.001
Bellatreccia, F., Della Ventura, G., Libowitzky, E., and Beran, A. (2005). The quantitative analysis of OH in vesuvianite: a polarized FTIR and SIMS study. Phys. Chem. Miner. 32, 65–76. doi: 10.1007/s00269-004-0437-4
Bellatreccia, F., Della Ventura, G., Piccinini, M., and Grubessi, O. (2008). Single-crystal polarized light IR study of an historical synthetic water poor emerald. Neues Jb. Miner. Abh. 185, 11–16. doi: 10.1127/0077-7757/2008/0115
Beran, A., Langer, K., and Andrut, M. (1993). Single crystal infrared spectra in the OH range fundamentals of paragenetic garnet, omphacite and kyanite in an eclogitic mantle xenolith. Min. Petr. 48, 257–268. doi: 10.1007/BF01163102
Charoy, B., de Donato, P., Barres, O., and Pintho-Choelo, C. (1996). Channel occupancy in an alkali-poor beryl from Serra Blanca (Goias, Brazil): spectroscopic characterization. Am. Miner. 81, 395–403.
Deer, W. A., Howie, R. A., and Zussman, J. (1986). Rock forming Minerals, Volume 1B: Disilicates and Ring Silicates. London: The Geological Society.
Della Ventura, G., Bellatreccia, F., Cesare, B., Harley, S., and Piccinini, M. (2009). FTIR microspectroscopy and SIMS study of water-poor cordierite from El Hoyazo, Spain: application mineral and melt devolatilization. Lithos 113, 498–506. doi: 10.1016/j.lithos.2009.05.031
Della Ventura, G., Bellatreccia, F., Marcelli, A., Cestelli Guidi, M., Piccinini, M., Cavallo, A., et al. (2010). Application of micro-FTIR imaging in the Earth sciences. Anal. Bioanal. Chem. 397, 2039–2049. doi: 10.1007/s00216-010-3811-8
Della Ventura, G., Bellatreccia, F., and Rossi, P. (2007). The single-crystal, polarized-light, FTIR spectrum of stoppaniite, the Fe analogue of beryl. Phys. Chem. Miner. 34, 727–731. doi: 10.1007/s00269-007-0190-6
Della Ventura, G., Marcelli, A., and Bellatreccia, F. (2014). “SR-FTIR Microscopy and FTIR imaging in the Earth Sciences,” in Spectroscopic Methods in Mineralogy and Material Sciences, Vol. 78, eds G. S. Henderson, D. R. Neuville, and R. T. Downs (Chantilly, VA: Reviews in Mineralogy and Geochemistry, Mineralogical Society of America), 447–479.
Della Ventura, G., Radica, F., Bellatreccia, F., Cavallo, A., Capitelli, F., and Harley, S. (2012). Quantitative analysis of H2O and CO2 in cordierite using polarized FTIR spectroscopy. Contrib. Miner. Petrol. 164, 881–894. doi: 10.1007/s00410-012-0779-8
Della Ventura, G., Rossi, P., Parodi, G. C., Mottana, A., Raudsepp, M., and Prencipe, M. (2000). Stoppaniite (Fe,Al,Mg)4(Be6Si12O36)*(H2O)2(Na, □), a new mineral of the beryl group from Latium (Italy). Eur. J. Miner. 12, 121–127. doi: 10.1127/0935-1221/2000/0012-0121
Demouchy, S. (2010a). Diffusion of hydrogen in olivine grain boundaries and implications for the survival of water-rich zones in the Earth's mantle. Earth Plan. Sci. Lett. 295, 305–313. doi: 10.1016/j.epsl.2010.04.019
Demouchy, S. (2010b). Hydrogen diffusion in spinel grain boundaries and consequences for chemical homogenization in hydrous peridotite. Contrib. Miner. Petrol. 160, 887–898. doi: 10.1007/s00410-010-0512-4
Farver, J. R. (2010). “Oxygen and hydrogen diffusion in minerals,” in Diffusion in Minerals and Melts, Vol. 72, eds Y. X. Zhang and J. D. Cheriniak (Chantilly, VA: Reviews in Mineralogy and Geochemistry, Mineralogical Society of America), 447–508.
Fukuda, J., and Shinoda, K. (2011). Water molecules in beryl and cordierite: high-temperature vibrational behavior, dehydration, and coordination to cations. Phys. Chem. Miner. 38, 469–481. doi: 10.1007/s00269-011-0420-9
Fukuda, J., Shinoda, K., Nakashima, S., Miyoshi, N., and Aikawa, N. (2009). Polarized infrared spectroscopic study of diffusion of water molecules along structure channels in beryl. Am. Miner. 94, 981–985. doi: 10.2138/am.2009.3124
Gatta, G. D., Nestola, F., Bromiley, G. D., and Mattauch, S. (2006). The real topological configuration of the extra-framework content in alkali-poor beryl: a multi-methodological study. Am. Miner. 91, 29–34. doi: 10.2138/am.2006.1896
Gibbs, G. V., Breck, D. W., and Meagher, E. P. (1968). Structural refinement of hydrous and anhydrous synthetic beryl, Al2(Be3Si6)O18 and emerald, Al1.9Cr0.1(Be3 Si6)O18. Lithos 1, 275–285. doi: 10.1016/S0024-4937(68)80044-1
Goldman, D. S., Rossman, G. R., and Dollase, W. A. (1977). The channel constituents in cordierite. Am. Miner. 62, 1144–1157.
Hautefeuille, P., and Perrey, A. (1888). Sur la reproduction de la phenacite e de l'emeraude. Cr. Acad. Sci. 106, 1800–1802.
Hautefeuille, P., and Perrey, A. (1890). Sur la combinaisons silicatèes de la glucine. Ann. Chim. Phys. 6, 447–435.
Hawthorne, F. C., and Cěrný, P. (1977). The alkali-metal positions in Cs-Li beryl. Can. Miner. 15, 414–421.
Hollister, L. S. (1970). Origin, mechanism, and consequences of compositional sector zoning in staurolite. Am. Miner. 55, 742–766.
Ingrin, J., and Blanchard, M. (2006). “Diffusion of hydrogen in minerals,” in Water in Nominally Anhydrous Minerals, Vol. 62, eds H. Keppler and J. R. Smyth (Chantilly, VA: Reviews in Mineralogy and Geochemistry, Mineralogical Society of America), 291–320.
Jakobsson, S. (2012). Oxygen fugacity control in piston-cylinder experiments. Contrib. Miner. Petrol. 3, 397–406. doi: 10.1007/s00410-012-0743-7
Johannes, W., and Schreyer, W. (1981). Experimental introduction of CO2 and H2O into Mg-cordierite. Amer. J. Sci. 281, 299–317. doi: 10.2475/ajs.281.3.299
Kolesov, B. A., and Geiger, C. A. (2000). The orientation and vibrational state of H2O in synthetic alkali-free beryl. Phys. Chem. Miner. 27, 557–564. doi: 10.1007/s002690000102
Libowitzky, E., and Rossman, G. R. (1996). Principles of quantitative absorbance measurements in anisotropic crystals. Phys. Chem. Miner. 23, 319–327. doi: 10.1007/BF00199497
Libowitzky, E., and Rossman, G. R. (1997). An IR absorption calibration for water in minerals. Am. Miner. 82, 1111–1115.
Liedl, A., Polese, C., Hampai, D., Della Ventura, G., Dabagov, S. B., Marcelli, A., et al. (2015). X-Ray micro-computed tomography and micro X-ray fluorescence mapping of synthetic emerald by using a laboratory polycapillary optics X-ray tube layout. X-ray Spectrometry. doi: 10.1002/xrs.2600
Marxer, H., and Novak, M. (2013). Micro-FTIR imaging: an advanced method for the determination of CO2 and H2O concentration gradients in silicate glasses. Eur. J. Miner. 25, 307–316. doi: 10.1127/0935-1221/2013/0025-2299
Mikhailov, M. A., Demina, T. V., and Belozerova, O. Y. (2007). Partitioning of species-forming and impurity cations among growth pyramids of pinacoid and prism faces in crystals of beryl, cordierite, and beryllian Indialite. Russ. Geol. Geophys. 48, 923–932. doi: 10.1016/j.rgg.2007.02.013
Pouchou, J. L., and Pichoir, F. (1985). A new model for quantitative X-ray microanalysis. Rech. Aerosp. 3, 13–38.
Radica, F. (2015). A Crystal-Chemical Study of Cordierite, Synthesis and Stability at Variable H2O and CO2 Concentration: Geological and Technological Applications. Ph.D. dissertation, University Roma Tre, Rome.
Watson, E. B., and Baxter, E. F. (2007). Frontiers: diffusion in solid-Earth systems. Earth Plan. Sci. Lett. 61, 346–358. doi: 10.1016/0012-821X(82)90065-6
Wickersheim, K. A., and Buchanan, R. A. (1959). The near infrared spectrum of beryl. Am. Miner. 44, 440–445.
Wood, D. L., and Nassau, K. (1967). Infrared spectra of foreign molecules in beryl. J. Chem. Phys. 47, 2220–2228. doi: 10.1063/1.1703295
Wood, D. L., and Nassau, K. (1968). The characterization of beryl and emerald by visible and infrared absorption spectroscopy. Am. Miner. 53, 777–780.
Wunder, B., Sahl, K., and Schreyer, W. (1991). Abrupt high/low-transition in flux-grown Mg-cordierite single crystals with hour-glass structure. Eur. J. Miner. 3, 809–817. doi: 10.1127/ejm/3/5/0809
Yund, R. A., Smith, B. M., and Tullis, J. (1981). Dislocation-assisted diffusion of oxygen in Albite. Phys. Chem. Miner. 7, 185–189. doi: 10.1007/BF00307264
Zhang, X. Y. (1999). H2O in rhyolitic glasses and melts: measurement, speciation, solubility, and diffusion. Rev. Geophys. 37, 493–516. doi: 10.1029/1999RG900012
Zhang, X. Y., and Cherniak, D. J. (2010). “Diffusion in minerals and melts: introduction,” in Diffusion in Minerals and Melts, Vol. 72, eds Y. X. Zhang and J. D. Cheriniak (Chantilly, VA: Reviews in Mineralogy and Geochemistry, Mineralogical Society of America), 1–4.
Keywords: beryl, CO2 diffusion, hourglass zoning, FTIR-FPA imaging, synchrotron radiation, FESEM, EMPA, TOF-SIMS
Citation: Della Ventura G, Radica F, Bellatreccia F, Cavallo A, Cinque G, Tortora L and Behrens H (2015) FTIR imaging in diffusion studies: CO2 and H2O in a synthetic sector-zoned beryl. Front. Earth Sci. 3:33. doi: 10.3389/feart.2015.00033
Received: 03 May 2015; Accepted: 08 June 2015;
Published: 23 June 2015.
Edited by:
Fabrizio Nestola, University of Padova, ItalyReviewed by:
Geoffrey David Bromiley, University of Edinburgh, UKRoland Stalder, University of Innsbruck, Austria
Vladimir Khomenko, Institute of Geochemistry, Mineralogy and Ore Formation, Ukraine
Copyright © 2015 Della Ventura, Radica, Bellatreccia, Cavallo, Cinque, Tortora and Behrens. This is an open-access article distributed under the terms of the Creative Commons Attribution License (CC BY). The use, distribution or reproduction in other forums is permitted, provided the original author(s) or licensor are credited and that the original publication in this journal is cited, in accordance with accepted academic practice. No use, distribution or reproduction is permitted which does not comply with these terms.
*Correspondence: Giancarlo Della Ventura, Dipartimento di Scienze, Università di Roma Tre, Largo San Leonardo Murialdo 1, I-00146 Rome, Italy,Z2lhbmNhcmxvLmRlbGxhdmVudHVyYUB1bmlyb21hMy5pdA==
 Giancarlo Della Ventura
 Francesco Radica
 Fabio Bellatreccia
 Andrea Cavallo
 Gianfelice Cinque4
 Luca Tortora