 Wenyi Lin1F. Isik Karahanoglu1Charmaine Demanuele1
 Sheraz Khan1Xuemei Cai2Mar Santamaria2
 Junrui Di1,†
 Lukas Adamowicz1*†
- 1AI/ML Quantitative and Digital Sciences, Global Biometrics and Data Management, Pfizer Research and Development, Pfizer Inc, Cambridge, MA, United States
- 2Digital Sciences & Translational Imaging, Early Clinical Development, Pfizer Research and Development, Pfizer Inc, Cambridge, MA, United States
Introduction: Accelerometry has become increasingly prevalent to monitor physical activity due to its low participant burden, quantitative metrics, and ease of deployment. Physical activity metrics are ideal for extracting intuitive, continuous measures of participants’ health from multiple days or weeks of high frequency data due to their fairly straightforward computation. Previously, we released an open-source digital health python processing package, SciKit Digital Health (SKDH), with the goal of providing a unifying device-agnostic framework for multiple digital health algorithms, such as activity, gait, and sleep.
Methods: In this paper, we present the open-source SKDH implementation for the derivation of activity endpoints from accelerometer data. In this implementation, we include some non-typical features that have shown promise in providing additional context to activity patterns, and provide comparisons to existing algorithms, namely GGIR and the GENEActiv macros. Following this reference comparison, we investigate the association between age and derived physical activity metrics in a healthy adult cohort collected in the Pfizer Innovation Research Lab, comprising 7–14 days of at-home data collected from younger (18–40 years) and older (65–85 years) healthy volunteers.
Results: Results showed that activity metrics derived with SKDH had moderate to excellent ICC values ( to compared to GGIR, to compared to the GENEActiv macros), with high correlations for almost all compared metrics (>0.733 except vs GGIR sedentary time, ). Several features show age-group differences, with Cohen’s effect sizes >1.0 and < 0.001. These features included non-threshold methods such as intensity gradient, and activity fragmentation features such as between-states transition probabilities.
Discussion: These results demonstrate the validity of the implemented SKDH physical activity algorithm, and the potential of the implemented PA metrics in assessing activity changes in free-living conditions.
1. Introduction
Inertial measurement units (IMUs) have gained popularity and became one of the best solutions for continuous monitoring of populations in free-living environments (1). This has led to various algorithms being developed to extract digital metrics that quantify physical activity (PA) from continuous accelerometer recordings. The simplest of these methods compute general summary metrics of physical activity throughout the day, oftentimes through energy-expenditure based thresholds applied to lightly filtered and transformed data (2). These physical activity metrics provide a high-level summary of how active a user is day-to-day, without requiring more sophisticated processing to estimate metrics from gait, for example. Additionally, the typical wrist-based placement to obtain these measures of physical activity provides an easy, convenient, and relatively comfortable mounting spot for the IMUs which can take the place of or be integrated with watches or other wrist bands (3).
The simplicity and convenience have therefore led to previous work into physical activity metrics, from early work on circadian rhythm (4, 5), to more recent work investigating physical activity trends in large populations (6, 7). In practice, most algorithms that estimate these physical activity metrics are similar; first they compute a summary measure of acceleration magnitude (8, 9), often with light signal filtering, then threshold into multiple different bins (sedentary, light, moderate, and vigorous physical activity) based on metabolic equivalent tasks (METs), and compute the amount of time in each of the bins (10–15). While easy to understand and interpret, these four activity bin thresholds are empirically based, resulting in discrepancies in threshold values, even among the same populations, as well as largely different thresholds for healthy children compared to healthy adults (13, 14). These population threshold differences pose problems when working with non-healthy populations, as the thresholds may not allow for fully sensitive detection of changes in activity level. However, there have been suggested ways to move away from threshold-based digital metrics, such as examining the decreasing amount of time spent in more vigorous activity (16).
Many device companies have their own, often closed-source, activity endpoints computation, such as ActiGraph,1 the Activinsights GENEActiv R markdown scripts,2 Axivity,3 or the Philips Actiwatch software.4 However, using such packages comes with some challenges, notably the lack of generalizability in ingesting data from other devices and the flexibility to incorporate additional configurations. There have been several open-source packages previously released to process accelerometry signals and generate digital metrics, such as GGIR (17) and pyActigraphy (18). pyActigraphy, with the capability to be used for multiple data formats, but they only provide metrics related to circadian and rest-active rhythms, and not general physical activity or measurements of gait. GGIR, as one of the most commonly used R packages to process and analyze accelerometry signals, has its own limitations. Notably, while GGIR provides many options for its processing steps, understanding these options requires a significant time investment, and any significant modifications to the GGIR’s processing would require intermediate or higher knowledge of R software. Finally, any extensions of GGIR’s functionality would be likely be highly complicated and convoluted due to the current nature of the code base. However, it is still important to keep in mind that GGIR has significant popularity and previous use in literature, and would provide a good benchmark for future physical activity computation packages.
In order to overcome these challenges and limitations, Adamowicz et al. recently released SciKit Digital Health (SKDH) (19), a general-purpose, unified, and open source Python package containing various algorithms (e.g. gait, activity, and sleep), pre-processing steps (e.g. wear detection, signal calibration), and data ingestion methods, that aims to be easily accessible by end users with a minimal learning curve.
In this work, we first present a comparison of SKDH physical activity endpoints against corresponding GGIR physical activity metrics and Activinsights GENEActiv R markdown metrics in a healthy adult cohort. This comparison provides the first hand validation evidence to ensure that the SKDH implementation maintains consistency with existing physical activity implementations that have been widely used to generate physical activity metrics in the literature. Second, we demonstrate the scientific applications of SKDH-generated digital metrics of physical activity by evaluating their relationship with age, with attention to non-threshold based metrics.
2. Methods
2.1. Subjects and procedure
Data used for validation and testing of the physical activity algorithms were from the Sensors to Record Your Daily Exercise (STRYDE) study completed at the Pfizer Innovation Research Lab (PfIRe Lab) in Cambridge, Massachusetts. Full details of the study design can be found in previous publications (20). In summary, 66 healthy participants were recruited in the greater Boston area, Massachusetts, USA (older cohort (ages 65–85): , Females (), age , younger cohort (ages 23–39) , Females (), age ). One male participant in the older adults group was excluded as it was determined that he did not meet the inclusion criteria after study completion. The key inclusion criteria included no significant health issues, BMI between 18.5 and 30 kg/m2, or absolute weight <125 kg. The key exclusion criteria included self-reported medical condition, recreational drug use, or medication use preventing study task completion, Vulnerable Elders Survey (21) total score >3 including in all activities of daily living (ADLs)). Participants completed two in-lab visits spaced 7–14 days apart. Between the two lab visits, participants wore accelerometers on their lower back and on their non-dominant wrist while going about their daily lives (all subjects were community-dwelling). Only wrist sensor data are presented in this work. The final protocol and informed consent documentation were reviewed and approved by Advarra Institutional Review Board (study ID: Pro00029419). All participants gave written consent prior to enrollment.
2.2. Instrumentation
During the at-home portion of the STRYDE study, participants wore two devices (GENEActiv, Activinsights, UK): one on their non-dominant wrist and another on the lower back. Devices recorded tri-axial accelerometer data (range: 8 g, sampling rate: Hz) and were attached to the body using straps. Data were stored locally on the device and downloaded for offline processing following the return of the device to the study site. For this work, only data from the wrist worn device were used to generate physical activity metrics.
2.3. Reference processing methods
In this work, two different software packages were used as reference benchmarks to process raw accelerometry signals and generate daily physical activity metrics, namely GGIR and the GENEActiv macros.
2.3.1. GENEActiv macros
As the GENEActiv devices were deployed in the study, the accompanying GENEActiv Microsoft Excel Macros (Activinsights now provides these as R markdown scripts) were used as one benchmark processing method to derive physical activity metrics from the at-home monitoring period.
The macros utilize both accelerometry signals and near-body temperature signals and proceed with the following components:
1. Segment the data into 24-hour periods
2. Classify each 24-hour period into periods of non-wear, sleep, sedentary, light, moderate, and vigorous
3. Generate the relevant activity and sleep metrics.
4. Generate reports with tables and visualizations.
2.3.2. GGIR
GGIR was used to compute physical activity metrics due to its wide acceptance and usage in the research community. It has been evaluated in over 90 peer-reviewed journal publications (17). GGIR is a collection of algorithms for activity and sleep research driven by the research community, written in R, and includes code to ingest, calibrate, and detect sleep, and activity levels from raw acceleration data. GGIR’s functionalities consist of the following five groups in logic processing order:
1. Calibrate the raw acceleration, derive the acceleration summary metrics, and detect nonwear time,
2. Generate basic statistical summaries of the acceleration while incorporating the non-wear time,
3. Detect the inactive period based on arm angle variability
4. Detect the sleep period based on the inactive period
5. Derive summaries of sleep and activity metrics and generate the final report.
2.4. Proposed method for activity metrics computation in SKDH
There were several key processing steps that happened before the activity metric estimation could occur, notably accelerometer calibration, wear detection, and sleep period detection. While none of these steps are technically necessary to compute activity metrics, they aid in providing more informed values that should better reflect how a person is going about their daily life.
Calibration has been shown to be an important step, especially when computing the activity metrics (22). The goal of the calibration step is to ensure that when a sensor is at rest, it would measure 1 g instead of 1.05 g for example. This was accomplished by mapping all data points reasonably assumed to be at rest to a sphere and then scaling these points to get the least sum of distances from the radius one sphere (22).
The next pre-processing step for the activity metric pipeline was to compute wear time. Using a previously published algorithm (23) called DETACH, acceleration, temperature, and rate of change in temperature were used to determine if a device was being worn. The DETACH algorithm computes wear status with resolutions down to single-digit seconds. The following parameters were used: acceleration standard deviation of 0.008 g, low-temperature threshold of 26.0°C, high-temperature threshold of 30.0°C, temperature rate of decrease threshold of −0.2°C/min, and temperature rate of increase threshold of 0.1°C/min. A window size of s was used, based on the previous work (23). For use cases lacking temperature data, SKDH provides alternative methods of calculating wear time using only the accelerometer data (24–28).
Finally, sleep periods were computed using a modified version of SleepPy (29, 30). This algorithm is very similar to the one used by GGIR (31) and also uses acceleration from the wrist as the basis for estimating sleep periods. In the case where temperature is available (as it is in this work), temperature is also accounted for in determining this sleep window, by excluding periods where the temperature would be uncharacteristically low for worn sleeping periods.
The proposed method for computing physical activity metrics is very similar to that in GGIR and is based on previous work (24, 26, 32) that GGIR uses and cites as well. The algorithm is intuitive and is shown as pseudo-code in Algorithm 1.
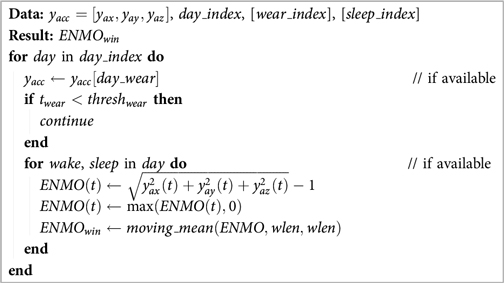
Algorithm 1. Computation of Euclidean Norm Minus One (ENMO) which is then used to compute the rest of the activity metrics.
In Algorithm 1, is the measured acceleration in units of gravitational acceleration (), is the Euclidean Norm Minus One, and is the windowed average over a sub-minute window length designated . For this work, was set to 5 s. Additionally, was set to 10 h.
First, iterating over each day (as activity metrics are computed on a per-day basis), the non-wear time was removed. If the remaining acceleration wear time () was less than the then no metrics were computed for that day. Next, if sleep periods were provided, the day was split into waking and non-waking (i.e. sleep) periods, and activity metrics were computed separately for each period. Next, was computed by taking the square root of the sum of the acceleration components squared (Euclidean norm or vector magnitude) and subtracting one for each time point. was trimmed at 0. Finally, a moving mean with non-overlapping windows was computed to obtain , which was used as the basis for computing the final activity metrics.
A series of metrics was then produced based on . The most basic is the accumulation of time in different brackets of activity level. For this work, the following cut-points were used: for sedentary, for light, for moderate, and for vigorous activity levels (15). From these definitions, moderate and vigorous physical activity (MVPA) was anything above 0.110 g, and sedentary and light physical activity (SLPA) was anything below 0.110 g. Additionally, time in bouts (26, 32) were computed for various bout lengths.
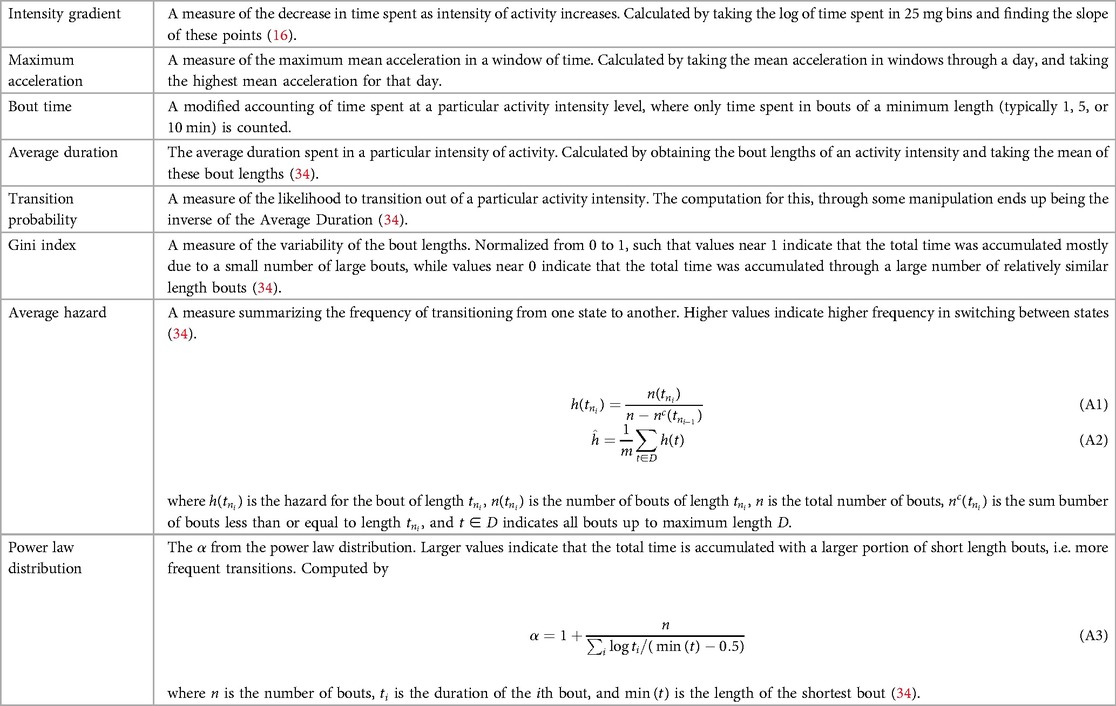
While there is much research surrounding the appropriate cut-points to use to segment activity levels (33, 11, 10, 12–15), there has also been some research on moving away from cut-points and time spent in various activity levels. One such method is intensity gradient (16), which instead creates much smaller evenly spaced bins (0.025 g), and summarizes the time in each bin. Taking the natural log of both the mid-point of the bins and the time in each bin allows a linear relationship to be estimated, which gives the intensity gradient (IG), as well as the intercept and -value for the linear estimation.
Additionally, a series of fragmentation metrics - transition probability, average duration, Gini index, average hazard, and the power law distribution, were computed. While conventional metrics such as sedentary or MVPA times focused on evaluating the total volume of different activity types, these fragmentation metrics, as a general explanation, attempt to evaluate the time accumulation strategy by showing how likely it is for a participant to remain in a particular activity state. Previous work has shown that these metrics were associated with lower mortality risk (34). Definitions for all metrics are included in Activity Endpoint Definitions (Appendix 1).
All processing for this method was performed using Scikit Digital Health (19), a Python package for wearable inertial sensor data processing, version 0.11.2.
2.5. Statistical methods
Physical activity metrics generated by SKDH were compared to reference metrics generated by GGIR and GENEActiv macros. Specifically, the analyses focus on metrics that are shared across the platforms. For such comparisons, both mean metrics across days and the repeated days of measurements were considered. To compare the mean across days, pairwise -tests, intra-class correlation coefficients (ICC), and Pearson correlation coefficients were calculated. Furthermore, to incorporate day-to-day variability in daily physical activity, repeated measures correlation was also computed, which accounts for non-independence among observations using analysis of covariance to statistically adjust for inter-individual variability (35, 36). The difference between each pair across repeated days was fitted into a mixed effects model as response and subject as the random effect. The estimated mean differences were reported for each pair.
The relationship between age and SKDH-generated physical activity metrics was explored from two aspects. Activity metrics were averaged across days for each participant. First, to investigate the overall between-group difference in each of the activity metrics, two group -tests were performed. The standardized effect size (Cohen’s ) was computed to quantify the difference between the two age groups. As a convention, Cohen’s can be used to classify effect sizes as small (), medium (), and large () (37).
In gerontology, trajectories of measurements of interests are typically fitted as a function of age to study the measurements across the lifespan (38). Therefore, for each activity metric, we fitted two separate linear regressions with age as the fixed effect, one for each age group. The estimated age effects (i.e. the estimated slope coefficient for age) between the two groups were then compared based on calculated -statistics.
All statistical analysis was performed in R version 4.2.1 with the following packages: “nlme” for mixed model with repeated measures (MMRM), “rmcorr” for repeated measure correlation, and “psych” for ICC. The group analysis p-values were corrected for multiple comparisons using false discovery rate correction.
3. Results
3.1. Comparison between SKDH and GGIR/GENEActiv macros
We assessed the reliability of activity metrics derived using SKDH algorithm, by comparing them with activity metrics provided by GGIR and GeneActiv macros. Table 1 displays the comparison of averaged activity metrics across days derived from SKDH, with respect to the GGIR and GeneActiv Macro through ICC, mean difference and correlation. The ICC and correlation between SKDH and GGIR showed great agreement for most activity metrics (), except for sedentary time, possibly due to slightly different definitions of sleep in these two algorithms. On the contrary, metrics generated from GeneActiv macros algorithm were classified based on different threshold definitions for varying activities, thus presented high correlation with SKDH algorithm but with large discrepancy in ICC values.
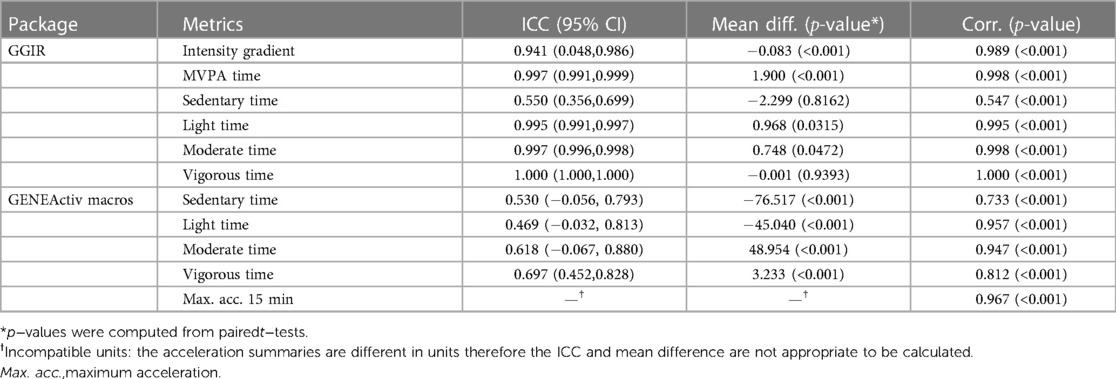
Table 1. Comparisons of mean activity metrics across days between SKDH and references (GGIR/GENEActiv Macros) for selected activity metrics.
The results of comparisons based on repeated measurements were presented in the Supplemental Data, which are consistent with the results Table 1 based average metrics.
3.2. The relationship between age and SKDH-generated activity metrics
Table 2 shows relationship between selected physical activity metrics and age, ordered by the absolute values Cohen’s , which measures the effect size of the difference between two means. The results for all derived metrics can be found in Supplemental Data. Statistically significant differences between younger and older age groups were observed for multiple physical activity metrics. In particular, large effect sizes (Cohen’s ) were observed for SLPA transition probability, intensity gradient, MVPA, moderate activity time, IG intercept, and maximum 15-min window accelerations.
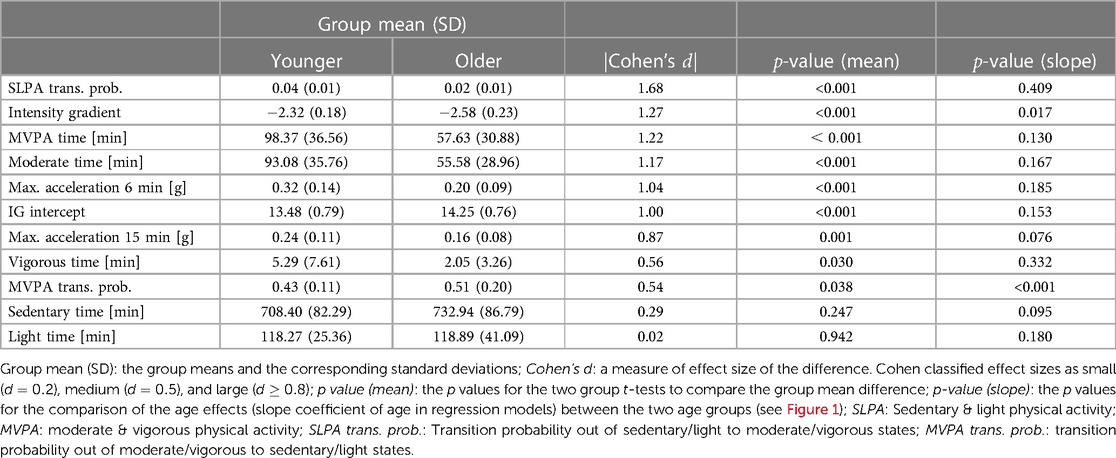
Table 2. The association between age and selected SKDH-derived physical activity metrics.
Notably, the fragmentation metrics SLPA transition probability (interpreted as the transition probability out of sedentary/light states to moderate/vigorous states) shows the largest between-group difference. Time spent in moderate activity and MVPA showed strong evidence of a group difference (Cohen’s ), while vigorous time alone along with sedentary and light activity showed no significant differences between younger and older age groups (Cohen’s ).
Regarding the difference in the age effects (i.e. slope estimation) between the two groups, among the metrics listed in Table 2, it was observed that the age effects for intensity gradient (-value ) and MVPA transition probability () are different. The effects can be observed in Figure 1. A clear “hockey stick” shape can be observed where the younger age shows a stable pattern but the older age shows an accelerated change. In contrast, even though there is significant difference in SLPA transition probability between the two age groups, the age slopes between the two groups show difference, and thus we observe a rather “linear” decline instead of a “hockey stick” shape. Among all the metrics generated by SKDH (Supplemental Data), additional metrics showing evidence of age slope differences between groups include MVPA accumulated in 10min bout time (-value ), SLPA average duration (-value ), and SLPA average hazard and power law distribution.
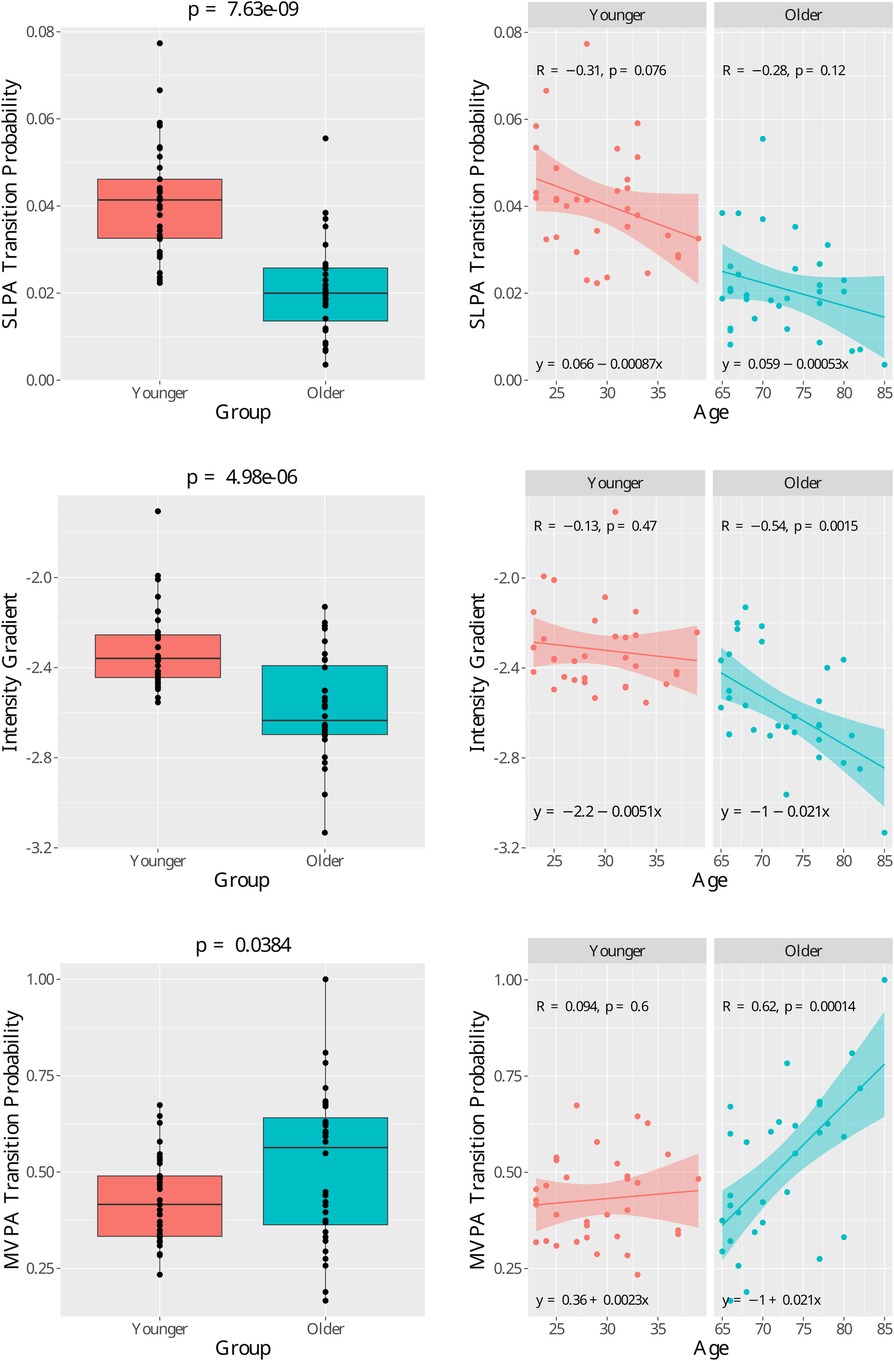
Figure 1. Age group comparison for three features with high Cohen’s effect size. (Top left) Boxplot of the sedendary/light to moderate/vigorous physical activity (SLPA) transition probability. Group mean -test p-value = 7.36×10⁻⁹. (Top right) Scatter plots for SLPA transition probability for each age group with regression lines. (Mid left) Boxplot of the intensity gradient. Group mean t-test p-value = 4.98×10⁻⁶.(Mid right) Scatter plots for intensity gradient for each age group with regression lines.(Bottom left) Boxplot of the moderate∕vigorous to sedendary∕light physical activity (MVPA) transition probability. Group mean − test .(Bottom right)Scatter plots for MVPA transition probability for each age group with regression lines. In the right graphs, is the Pearson correlation coefficient and is the− value for regression slope coefficient.
4. Discussion
We introduced the open-source Python package, Scikit Digital Health (SKDH) (19), and how it can be used to generate physical activity metrics. We provided a comparison between the SKDH-generated metrics against existing methods, i.e. GGIR and GENEActiv Macros using data collected from a study in healthy adults. We further examined the association between the generated activity metrics with age, which is crucially related to epidemiological and health-related research (39).
When comparing SKDH-generated metrics with the references, correlations were generally strong. For both reference algorithms, relatively larger bias and lower correlation were observed for sedentary activity time. One possible explanation for this discrepancy is due to the use of slightly different sleep algorithms, which potentially cause over- or under-estimation of sedentary time since they share similar patterns, impacting these comparisons. Specifically, there is excellent agreement between SKDH and GGIR. This is primarily because that the SKDH and GGIR shared the same list of algorithms to generate the metrics, namely using ENMO as an acceleration aggregation metric, and the use of the same thresholds for the defined activity levels. Between SKDH and the GENEActiv Macros, we observed moderate ICC values and larger biases, which presumably is driven by a different acceleration accumulation algorithm, and different thresholds for the sedentary, light, moderate, and vigorous activity levels used. It is worth mentioning that, neither of GGIR and GENEActiv macros should be considered as “ground truth”. Therefore, our comparison is technically not a “analytical validation” according to the V3 framework (40). However, what is shown in this paper is still extremely valuable as they demonstrate that SKDH’s results agree with other widely accepted tools. It deserves to be highlighted that in this work, as opposed to most of other validation works which typically average the repeated measurements across days, we incorporated the day-to-day variation using repeated measure regression models. Even though the results are consistent in this population who are healthy, it is still highly recommended to consider the repeated measure design for future analyses.
Significant differences between the younger and older age groups were found for several metrics including sedentary to active transition probability, intensity gradient, moderate and vigorous physical activity time, and maximum 6-min acceleration, which all showed Cohen’s over . Since age is a key risk factor for a wide variety of diseases and health conditions (39), there is potential to deploy these digitally measured physical activity metrics as novel digital endpoints in clinical trials as they may be able to provide large effect sizes with smaller sample sizes than typical for these clinical trials. While metrics such as MVPA, sedentary, and light physical activity time are threshold based, with thresholds changing from study to study (10–15), and changing between children and adults (14, 11, 10), the intensity gradient (16) method does not rely on these thresholds. The observed between-group differences for intensity gradient, therefore, provides evidence that non-threshold activity metrics can be utilized in future studies with fewer challenges to interpreting results based on a common set of thresholds for potentially diverse participant groups. Future work could focus on exploring additional non-threshold-based methods for calculating activity endpoints.
Even though there are significant between group differences for metrics such as the transition probability from sedentary/light to moderate/vigorous states, over the life span, those metrics are monotonically increasing or declining. On the contrary, we identified the difference in the age effects (i.e. slope estimation) between the two age groups for a variety of activity metrics such as intensity gradient and MVPA transition probability. We observed a “hockey stick” shape over a lifespan—the trajectories tend to be stable and flat in younger ages and suddenly come with steeper and accelerated change in older ages. Take MVPA transition probability, which indicates the likelihood to transition from MVPA to light activity or sedentary behaviors (i.e. to break up high-intensity activity), as an example. We observed that, between the ages of 23 to 39, participants’ likelihood to break up high-intensity activity tends to stay stable, while between the ages of 65 to 85, the likelihood drastically increases, which indicates a serious decline in the ability to sustain high-intensity activity. The “hockey stick” trajectories we identified are consistent with previous publication on the age-caused decline in mobility and cognitive function and is a key concept in gerontology to study the biology of aging and the determination of biomarkers to track these effects (41–43). Notably, the difference in the age effects (i.e. slope estimation) between the two age groups was majorly identified for metrics that quantify activity fragmentation, which is a relatively new concept since most research is still focused on the use of metrics to quantify total activity volumes such as MVPA and total sedentary time. Such findings are consistent with growing literature demonstrating the value of using fragmentation metrics that explore the pattern to accumulate active and sedentary time. These metrics have been shown to be associated with functional measurements of mobility, all-cause mortality, and hearing loss (44, 34, 45–49).
There are a few limitations with this work, namely that the sample size was relatively small compared to large cohort studies that quantify physical activity measurements. It is aligned with our goal to eventually apply SKDH to large cohort studies in the future. Additionally, even slightly different sleep algorithms potentially resulted in a biased estimation of sedentary and light PA due to the misclassification of sedentary activity. Future work may be needed to increase the specificity of the sleep detection algorithm. The analyses were conducted only in healthy adults, and future work should focus on incorporating pathological participants who may have different patterns of physical activity. While this work focused on the wrist location, which is commonly used for physical activity estimation due to ease and comfort of wearing (50), exploring the lumbar sensor available in this study is a potential avenue for future work as well. Finally, while we present two different reference methods, there are other commonly used algorithms to assess physical activity, such as algorithms based on ActiGraph’s activity counts, the algorithms for Axivity, and the Philips Actiwatch. Actigraph’s recent move to publicize its proprietary activity counts algorithm (51) increases the possibility of applying their algorithms and analytic platforms for other devices, which remains an avenue of exploration for future work.
Data availability statement
The original contributions presented in the study are included in the article/Supplementary Materials, further inquiries can be directed to the corresponding author.
Ethics statement
The studies involving humans were approved by Advarra Institutional Review Board. The studies were conducted in accordance with the local legislation and institutional requirements. The participants provided their written informed consent to participate in this study.
Author contributions
LA: Conceptualization, Investigation, Methodology, Supervision, Writing – original draft, Writing – review & editing; WL: Formal Analysis, Investigation, Methodology, Visualization, Writing – original draft, Writing – review & editing; FIK: Conceptualization, Writing – review & editing; CD: Conceptualization, Writing – review & editing; SK: Conceptualization, Writing – review & editing; XC: Data curation, Investigation, Writing – review & editing; MS: Data curation, Investigation, Writing – review & editing; JD: Investigation, Methodology, Supervision, Validation, Visualization, Writing – original draft, Writing – review & editing.
Funding
The author(s) declare that no financial support was received for the research, authorship, and/or publication of this article.
Acknowledgments
The authors would like to thank the STRYDE study participants and the Pfizer Innovation Research Lab members who ran the study: Hao Zhang, Andrew Messere, Stephanie An-Stoddard, Rachel Chasse, Vesper Ramos, Tomas Adamusiak, Greg Versmee, Laura Versmee, Monica Calicchio, Dimitrios Psaltos, Koene Van Dijk, Amey Kelekar, and Matthew Czech.
Conflict of interest
All authors are employees of Pfizer, Inc, and own stock.
Publisher's note
All claims expressed in this article are solely those of the authors and do not necessarily represent those of their affiliated organizations, or those of the publisher, the editors and the reviewers. Any product that may be evaluated in this article, or claim that may be made by its manufacturer, is not guaranteed or endorsed by the publisher.
Supplementary material
The Supplementary Material for this article can be found online at: https://www.frontiersin.org/articles/10.3389/fdgth.2023.1321086/full#supplementary-material.
Footnotes
1https://theactigraph.com/centrepoint
2https://activinsights.com/support/geneactiv-support/
4http://www.actigraphy.respironics.com/solutions/actigraphy.aspx
References
1. Mathie MJ, Coster AC, Lovell NH, Celler BG. Accelerometry: providing an integrated, practical method for long-term, ambulatory monitoring of human movement. Physiol Meas. (2004) 25:R1. doi: 10.1088/0967-3334/25/2/R01
2. Di J, Spira A, Bai J, Urbanek J, Leroux A, Wu M, et al. Joint, individual representation of domains of physical activity, sleep„ circadian rhythmicity. Stat Biosci. (2019) 11:371–402. doi: 10.1007/s12561-019-09236-4
3. Karas M, Bai J, Strączkiewicz M, Harezlak J, Glynn NW, Harris T, et al. Accelerometry data in health research: challenges and opportunities: review and examples. Stat Biosci. (2019) 11:210–37. doi: 10.1007/s12561-018-9227-2
4. Witting W, Kwa IH, Eikelenboom P, Mirmiran M, Swaab DF. Alterations in the circadian rest-activity rhythm in aging and Alzheimer’s disease. Biol Psychiatry. (1990) 27:563–72. doi: 10.1016/0006-3223(90)90523-5
5. Van Someren EJW, Lijzenga C, Mirmiran M, Swaab DF. Long-term fitness training improves the circadian rest-activity rhythm in healthy elderly males. J Biol Rhythms. (1997) 12:146–56. doi: 10.1177/074873049701200206
6. Doherty A, Jackson D, Hammerla N, Plötz T, Olivier P, Granat MH, et al. Large scale population assessment of physical activity using wrist worn accelerometers: the UK Biobank Study. PLoS One. (2017) 12:e0169649. doi: 10.1371/journal.pone.0169649
7. Cassidy S, Fuller H, Chau J, Catt M, Bauman A, Trenell MI. Accelerometer-derived physical activity in those with cardio-metabolic disease compared to healthy adults: a UK Biobank study of 52,556 participants. Acta Diabetol. (2018) 55:975–9. doi: 10.1007/s00592-018-1161-8
8. Van Hees VT, Gorzelniak L, Dean León EC, Eder M, Pias M, Taherian S, et al. Separating movement and gravity components in an acceleration signal and implications for the assessment of human daily physical activity. PLoS One. (2013) 8:e61691. doi: 10.1371/journal.pone.0061691
9. Bai J, Di C, Xiao L, Evenson KR, LaCroix AZ, Crainiceanu CM, et al. An activity index for raw accelerometry data and its comparison with other activity metrics. PLoS One. (2016) 11:e0160644. doi: 10.1371/journal.pone.0160644
10. Phillips LRS, Parfitt G, Rowlands AV. Calibration of the GENEA accelerometer for assessment of physical activity intensity in children. J Sci Med Sport. (2013) 16:124–8. doi: 10.1016/j.jsams.2012.05.013
11. Schaefer CA, Nigg CR, Hill JO, Brink LA, Browning RC. Establishing and evaluating wrist cutpoints for the GENEActiv accelerometer in youth. Med Sci Sports Exerc. (2014) 46:826–33. doi: 10.1249/MSS.0000000000000150
12. Vähä-Ypyä H, Vasankari T, Husu P, Mänttäri A, Vuorimaa T, Suni J, et al. Validation of cut-points for evaluating the intensity of physical activity with accelerometry-based mean amplitude deviation (MAD). PLoS One. (2015) 10:e0134813. doi: 10.1371/journal.pone.0134813
13. Hildebrand M, Van Hees VT, Hansen BH, Ekelund U. Age group comparability of raw accelerometer output from wrist- and hip-worn monitors. Med Sci Sports Exerc. (2014) 46:1816–24. doi: 10.1249/MSS.0000000000000289
14. Hildebrand M, Hansen BH, van Hees VT, Ekelund U. Evaluation of raw acceleration sedentary thresholds in children and adults. Scand J Med Sci Sports. (2017) 27:1814–23. doi: 10.1111/sms.12795
15. Migueles JH, Cadenas-Sanchez C, Rowlands AV, Henriksson P, Shiroma EJ, Acosta FM, et al. Comparability of accelerometer signal aggregation metrics across placements and dominant wrist cut points for the assessment of physical activity in adults. Sci Rep. (2019) 9:18235. doi: 10.1038/s41598-019-54267-y
16. Rowlands AV, Edwardson CL, Davies MJ, Khunti K, Harrington DM, Yates T. Beyond cut points: accelerometer metrics that capture the physical activity profile. Med Sci Sports Exerc. (2018) 50:1323–32. doi: 10.1249/MSS.0000000000001561
17. Migueles JH, Rowlands AV, Huber F, Sabia S, van Hees VT. GGIR: a research community–driven open source R package for generating physical activity and sleep outcomes from multi-day raw accelerometer data. J Meas Phys Behav. (2019) 2:188–96. doi: 10.1123/jmpb.2018-0063
18. Hammad G, Reyt M, Beliy N, Baillet M, Deantoni M, Lesoinne A, et al. pyActigraphy: open-source python package for actigraphy data visualization and analysis. PLoS Comput Biol. (2021) 17:e1009514. doi: 10.1371/journal.pcbi.1009514
19. Adamowicz L, Christakis Y, Czech MD, Adamusiak T. SciKit digital health: python package for streamlined wearable inertial sensor data processing. JMIR Mhealth Uhealth. (2022) 10:e36762. doi: 10.2196/36762
20. Czech MD, Psaltos D, Zhang H, Adamusiak T, Calicchio M, Kelekar A, et al. Age and environment-related differences in gait in healthy adults using wearables. npj Digit Med. (2020) 3:1–9. doi: 10.1038/s41746-020-00334-y
21. Saliba D, Elliott M, Rubenstein LZ, Solomon DH, Young RT, Kamberg CJ, et al. The vulnerable elders survey: a tool for identifying vulnerable older people in the community. J Am Geriatr Soc. (2001) 49:1691–9. doi: 10.1046/j.1532-5415.2001.49281.x
22. van Hees VT, Fang Z, Langford J, Assah F, Mohammad A, da Silva ICM, et al. Autocalibration of accelerometer data for free-living physical activity assessment using local gravity and temperature: an evaluation on four continents. J Appl Physiol. (2014) 117:738–44. doi: 10.1152/japplphysiol.00421.2014
23. Vert A, Weber KS, Thai V, Turner E, Beyer KB, Cornish BF, et al. Detecting accelerometer non-wear periods using change in acceleration combined with rate-of-change in temperature. BMC Med Res Methodol. (2022) 22:147. doi: 10.1186/s12874-022-01633-6
24. van Hees VT, Gorzelniak L, León ECD, Eder M, Pias M, Taherian S, et al. Separating movement and gravity components in an acceleration signal and implications for the assessment of human daily physical activity. PLoS One. (2013) 8:e61691. doi: 10.1371/journal.pone.0061691
25. van Hees VT, Renström F, Wright A, Gradmark A, Catt M, Chen KY, et al. Estimation of daily energy expenditure in pregnant and non-pregnant women using a wrist-worn tri-axial accelerometer. PLoS One. (2011) 6:e22922. doi: 10.1371/journal.pone.0022922
26. da Silva IC, van Hees VT, Ramires VV, Knuth AG, Bielemann RM, Ekelund U, et al. Physical activity levels in three Brazilian birth cohorts as assessed with raw triaxial wrist accelerometry. Int J Epidemiol. (2014) 43:1959–68. doi: 10.1093/ije/dyu203
27. Matthews CE, Chen KY, Freedson PS, Buchowski MS, Beech BM, Pate RR, et al. Amount of time spent in sedentary behaviors in the United States, 2003–2004. Am J Epidemiol. (2008) 167:875–81. doi: 10.1093/aje/kwm390
28. Choi L, Liu Z, Matthews CE, Buchowski MS. Validation of accelerometer wear and nonwear time classification algorithm. Med Sci Sports Exerc. (2011) 43:357–64. doi: 10.1249/MSS.0b013e3181ed61a3
29. Christakis Y, Mahadevan N, Patel S. SleepPy: a python package for sleep analysis from accelerometer data. J Open Source Softw. (2019) 4:1663. doi: 10.21105/joss.01663
30. Mahadevan N, Christakis Y, Di J, Bruno J, Zhang Y, Dorsey ER, et al. Development of digital measures for nighttime scratch and sleep using wrist-worn wearable devices. npj Digit Med. (2021) 4:1–10. doi: 10.1038/s41746-021-00402-x
31. van Hees VT, Sabia S, Anderson KN, Denton SJ, Oliver J, Catt M, et al. A novel, open access method to assess sleep duration using a wrist-worn accelerometer. PLoS One. (2015) 10:e0142533. doi: 10.1371/journal.pone.0142533
32. Sabia S, van Hees VT, Shipley MJ, Trenell MI, Hagger-Johnson G, Elbaz A, et al. Association between questionnaire- and accelerometer-assessed physical activity: the role of sociodemographic factors. Am J Epidemiol. (2014) 179:781–90. doi: 10.1093/aje/kwt330
33. Esliger DW, Rowlands AV, Hurst TL, Catt M, Murray P, Eston RG. Validation of the GENEA accelerometer. Med Sci Sports Exerc. (2011) 43:1085–93. doi: 10.1249/MSS.0b013e31820513be
34. Di J, Leroux A, Urbanek J, Varadhan R, Spira AP, Schrack J, et al. Patterns of sedentary, active time accumulation are associated with mortality in US adults: the NHANES study. bioRxiv (2017) 182337. Available from: https://doi.org/1101/182337
35. Bakdash JZ, Marusich LR. Repeated measures correlation. Front Psychol. (2017) 8:456. doi: 10.3389/fpsyg.2017.00456
36. Bland JM, Altman DG. Calculating correlation coefficients with repeated observations: Part 2—correlation between subjects. BMJ. (1995) 310:633. doi: 10.1136/bmj.310.6980.633
37. Sullivan GM, Feinn R. Using effect size—or why the value is not enough. J Grad Med Educ. (2012) 4:279–82. doi: 10.4300/JGME-D-12-00156.1
38. Varma VR, Dey D, Leroux A, Di J, Urbanek J, Xiao L, et al. Re-evaluating the effect of age on physical activity over the lifespan. Prev Med. (2017) 101:102–8. doi: 10.1016/j.ypmed.2017.05.030
39. Bengtson VL, Rice CJ, Johnson ML. Are theories of aging important? Models and explanations in gerontology at the turn of the century. Social and Economic Dimensions of an Aging Population Research Papers 11. McMaster University (2000).
40. Goldsack JC, Coravos A, Bakker JP, Bent B, Dowling AV, Fitzer-Attas C, et al. Verification, analytical validation, and clinical validation (V3): the foundation of determining fit-for-purpose for biometric monitoring technologies (biomets). npj Digit Med. (2020) 3:55. doi: 10.1038/s41746-020-0260-4
41. Ferrucci L, Cooper R, Shardell M, Simonsick EM, Schrack JA, Kuh D. Age-related change in mobility: perspectives from life course epidemiology and geroscience. J Gerontol A Biol Sci Med Sci. (2016) 71:1184–94. doi: 10.1093/gerona/glw043
42. Kuo PL, Schrack JA, Shardell MD, Levine M, Moore AZ, An Y, et al. A roadmap to build a phenotypic metric of ageing: insights from the baltimore longitudinal study of aging. J Intern Med. (2020) 287:373–94. doi: 10.1111/joim.13024
43. Van den Hout A, Muniz-Terrera G, Matthews FE. Smooth random change point models. Stat Med. (2011) 30:599–610. doi: 10.1002/sim.4127
44. Wanigatunga AA, Di J, Zipunnikov V, Urbanek JK, Kuo PL, Simonsick EM, et al. Association of total daily physical activity and fragmented physical activity with mortality in older adults. JAMA Netw Open. (2019) 2:e1912352. doi: 10.1001/jamanetworkopen.2019.12352
45. Schrack JA, Kuo PL, Wanigatunga AA, Di J, Simonsick EM, Spira AP, et al. Active-to-sedentary behavior transitions, fatigability, and physical functioning in older adults. J Gerontol A. (2019) 74:560–7. doi: 10.1093/gerona/gly243
46. Wilson JJ, McMullan I, Blackburn NE, Klempel N, Jerez-Roig J, Oviedo GR, et al. The association of physical activity fragmentation with physical function in older adults: analysis from the SITLESS study. J Ageing Longev. (2022) 2:63–73. doi: 10.3390/jal2010006
47. Leroux A, Di J, Smirnova E, Mcguffey EJ, Cao Q, Bayatmokhtari E, et al. Organizing and analyzing the activity data in NHANES. Stat Biosci. (2019) 11:262–87. doi: 10.1007/s12561-018-09229-9
48. Kuo PL, Di J, Ferrucci L, Lin FR. Analysis of hearing loss and physical activity among us adults aged 60-69 years. JAMA Netw Open. (2021) 4:e215484. doi: 10.1001/jamanetworkopen.2021.5484
49. Palmberg L, Rantalainen T, Rantakokko M, Karavirta L, Siltanen S, Skantz H, et al. The associations of activity fragmentation with physical and mental fatigability among community-dwelling 75-, 80-, and 85-year-old people. J Gerontol A. (2020) 75:e103–10. doi: 10.1093/gerona/glaa166
50. Duncan S, Stewart T, Mackay L, Neville J, Narayanan A, Walker C, et al. Wear-time compliance with a dual-accelerometer system for capturing 24-h behavioural profiles in children and adults. Int J Environ Res Public Health. (2018) 15(7):1296. doi: 10.3390/ijerph15071296
51. Neishabouri A, Nguyen J, Samuelsson J, Guthrie T, Biggs M, Wyatt J, et al. Quantification of acceleration as activity counts in ActiGraph wearable. Sci Rep. (2022) 12:11958. doi: 10.1038/s41598-022-16003-x
Appendix 1. Activity endpoint definitions
Keywords: physical activity, accelerometer, continuous monitoring, remote monitoring, age effects
Citation: Lin W, Karahanoglu FI, Demanuele C, Khan S, Cai X, Santamaria M, Di J and Adamowicz L (2023) SciKit digital health package for accelerometry-measured physical activity: comparisons to existing solutions and investigations of age effects in healthy adults. Front. Digit. Health 5:1321086. doi: 10.3389/fdgth.2023.1321086
Received: 13 October 2023; Accepted: 7 November 2023;
Published: 27 November 2023.
Edited by:
Shuhan He, Harvard Medical School, United StatesReviewed by:
Abdel Badih Ariss Harvard University, United StatesLouise Corscadden Independent Researcher, Illinois, United States
© 2023 Lin, Karahanoglu, Demanuele, Khan, Cai, Santamaria, Di and Adamowicz. This is an open-access article distributed under the terms of the Creative Commons Attribution License (CC BY). The use, distribution or reproduction in other forums is permitted, provided the original author(s) and the copyright owner(s) are credited and that the original publication in this journal is cited, in accordance with accepted academic practice. No use, distribution or reproduction is permitted which does not comply with these terms.
*Correspondence: Lukas Adamowicz bHVrYXMuYWRhbW93aWN6QHBmaXplci5jb20=
†These authors have contributed equally to this work and share senior authorship