 Anne A. H. de Hond
 Ben van Calster
 Ewout W. Steyerberg1,3
94% of researchers rate our articles as excellent or good
Learn more about the work of our research integrity team to safeguard the quality of each article we publish.
Find out more
GENERAL COMMENTARY article
Front. Digit. Health, 20 May 2022
Sec. Health Informatics
Volume 4 - 2022 | https://doi.org/10.3389/fdgth.2022.923944
A Commentary on
Artificial Intelligence and Statistics: Just the Old Wine in New Wineskins?
by Faes, L., Sim, D. A., van Smeden, M., Held, U., Bossuyt, P. M., and Bachmann, L. M. (2022). Front. Digit. Health 4:833912. doi: 10.3389/fdgth.2022.833912
We write to expand on Faes's et al. recent publication “Artificial intelligence and statistics: Just the old wine in new wineskins?” (1). The authors rightly address a lack of consensus regarding terminology between the statistics and machine learning fields. Guidance is needed to provide a more unified way of reporting and comparing study results between the different fields, as far as these can be separated.
Prediction models can be based on traditional statistical learning methods, such as regression, and modern machine learning approaches, such as tree-based methods (random forests, XGBoost) and neural networks. These models can be evaluated along several evaluation axes. Measures for discrimination typically quantify the separation between low vs. high-risk subjects, independent of the event rate (2). Classification is often grouped under discrimination, but classification measures are dependent on the decision threshold used to define subjects as high-risk vs. low risk. Moreover, classification performance is affected by calibration, which relates to the reliability of the estimated risks (3). Overall performance measures are also available, including Brier score and measures for explained variability (R2), which reflect both discrimination and calibration performance. Lastly, measures for clinical utility have been proposed, which consider the clinical context with respect to the event rate and the decision threshold to define high vs. low risk (4, 5). Major differences can be observed in the measures commonly used across these axes to evaluate predictive performance in the statistics and machine learning fields.
We here highlight key measures focusing on discriminative ability and clinical utility [or effectiveness (6)]. Table 1 provides a non-exhaustive overview. All measures relate to the evaluation of probability predictions for binary outcomes. They are derived from the 2 × 2 confusion matrix for specific or consecutive decision thresholds. We reflect on these measures below:
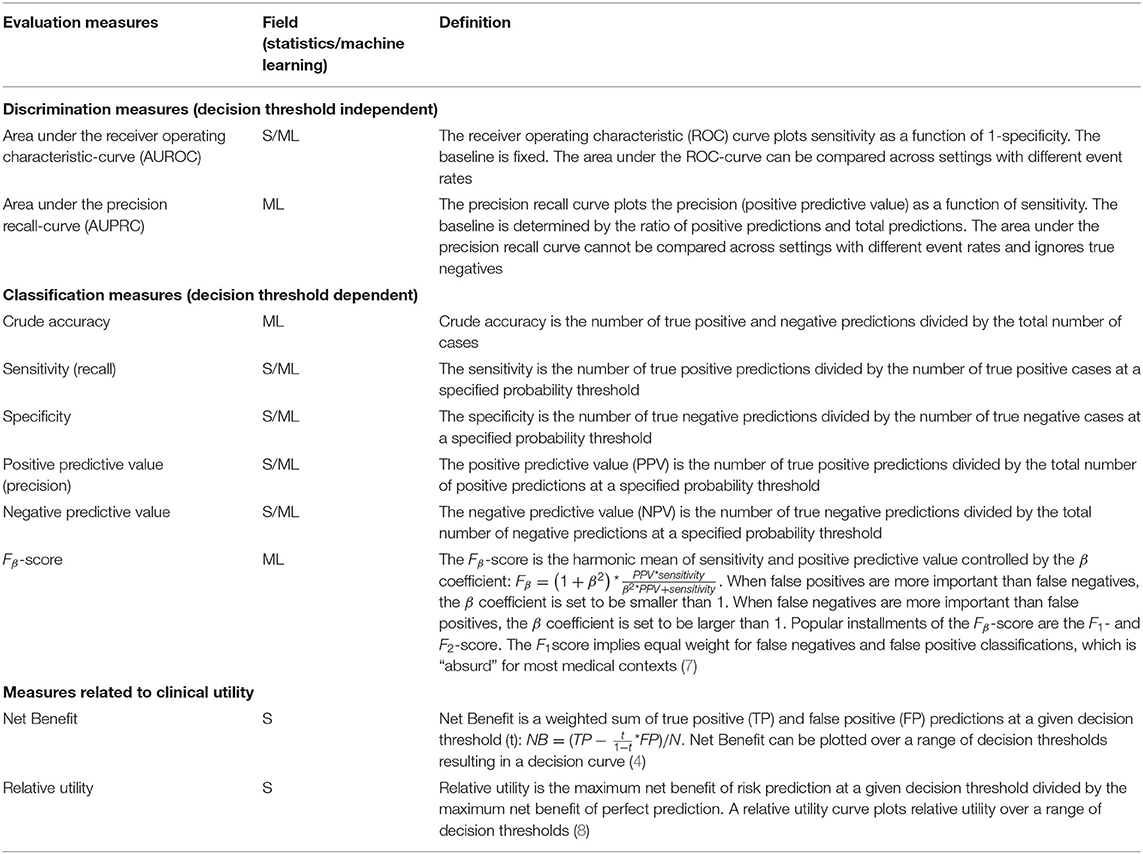
Table 1. Evaluation measures from statistics and machine learning fields.
The precision recall-curve and F1-score are often described in the machine learning field as “superior for imbalanced data” (9, 10). Indeed, recall (sensitivity) and precision (positive predictive value) are evenly weighted in the computation of the area under the precision recall-curve (AUPRC) and the F1-score. However, imbalanced data is usually not considered problematic for classic statistical learning (such as logistic regression), except for edge cases where the event rate is exceptionally low. Because the precision recall-curve and F1-score are event rate dependent, we cannot directly compare model performance for settings with a different event rate. Also, the precision recall-curve ignores true negatives and therefore is not a measure of discrimination according to the above definition. In contrast, the classic area under the receiver operating characteristic curve (AUROC) is event rate independent, which is a hall mark of a discrimination measure (2). Similarly, sensitivity (fraction true positive) and specificity (fraction true negative) can, at least in theory, be considered as independent of event rate.
Some measures are considered outdated in the classic statistical learning field, while still popular in the machine learning field. Such a measure is the crude accuracy (the fraction of correct classifications). Crude accuracy is event rate dependent, e.g., a 99% accuracy is the minimum for a setting with 1% event rate and classifying all subjects as “low risk.”
Decision analytical approaches move away from pure discrimination and toward clinical utility. Net benefit is the most popular among some recently proposed measures for clinical utility (4, 5). It is derived from a decision analytical framework and weighs sensitivity and specificity by clinical consequences. Net benefit has a clear interpretation when compared to treat-all and treat-none strategies (4, 5).
In conclusion, measures that are affected by the event rate are common in the machine learning field, such as the AUPRC, F1-score, and crude accuracy. They impede the comparison of model performance across different settings. The medical decision-making context is better captured in modern measures such as Net Benefit, which not only consider the event rate but also the clinical consequences of false-positive vs. true-positive decisions (harm vs. benefit), rather than arbitrary weighting these costs (7). We recommend that the aim of the evaluation of a model should determine our focus at clinical performance (discrimination, calibration), or clinical utility, with quantification by appropriate measures.
AH, BC, and ES conceived the idea, wrote the initial draft, edited, and approved the final manuscript. All authors contributed to the article and approved the submitted version.
The authors declare that the research was conducted in the absence of any commercial or financial relationships that could be construed as a potential conflict of interest.
All claims expressed in this article are solely those of the authors and do not necessarily represent those of their affiliated organizations, or those of the publisher, the editors and the reviewers. Any product that may be evaluated in this article, or claim that may be made by its manufacturer, is not guaranteed or endorsed by the publisher.
1. Faes L, Sim DA, Van Smeden M, Held U, Bossuyt PM, Bachmann LM. Artificial intelligence and statistics: just the old wine in new wineskins? Front Dig Health. (2022) 4:833912. doi: 10.3389/fdgth.2022.833912
2. Gu W, Pepe M. Measures to summarize and compare the predictive capacity of markers. Int J Biostat. (2009) 5:27. doi: 10.2202/1557-4679.1188
3. Van Calster B, McLernon DJ, Van Smeden M, Wynants L, Steyerberg EW. Calibration: the achilles heel of predictive analytics. BMC Med. (2019) 17:230. doi: 10.1186/s12916-019-1466-7
4. Vickers AJ, Elkin EB. Decision curve analysis: a novel method for evaluating prediction models. Med Decis Mak. (2006) 26:565–74. doi: 10.1177/0272989X06295361
5. Vickers AJ, Van Calster B, Steyerberg EW. Net benefit approaches to the evaluation of prediction models, molecular markers, and diagnostic tests. BMJ. (2016) 352:i6. doi: 10.1136/bmj.i6
6. Horvath AR, Lord SJ, StJohn A, Sandberg S, Cobbaert CM, Lorenz S, et al. From biomarkers to medical tests: the changing landscape of test evaluation. Clin Chim Acta. (2014) 427:49–57. doi: 10.1016/j.cca.2013.09.018
7. Greenland S. The need for reorientation toward cost-effective prediction: comments on 'Evaluating the added predictive ability of a new marker: from area under the ROC curve to reclassification and beyond' by M. J. Pencina et al., statistics in medicine. Stat Med. (2008) 27:199–206. doi: 10.1002/sim.2995
8. Baker SG, Cook NR, Vickers A, Kramer BS. Using relative utility curves to evaluate risk prediction. J R Stat Soc Ser A. (2009) 172:729–48. doi: 10.1111/j.1467-985X.2009.00592.x
9. Saito T, Rehmsmeier M. The precision-recall plot is more informative than the ROC plot when evaluating binary classifiers on imbalanced datasets. PLoS ONE. (2015) 10:e0118432. doi: 10.1371/journal.pone.0118432
Keywords: artificial intelligence, machine learning, statistics, methodology, discrimination
Citation: de Hond AAH, van Calster B and Steyerberg EW (2022) Commentary: Artificial Intelligence and Statistics: Just the Old Wine in New Wineskins? Front. Digit. Health 4:923944. doi: 10.3389/fdgth.2022.923944
Received: 19 April 2022; Accepted: 03 May 2022;
Published: 20 May 2022.
Edited by:
Daniel B. Hier, Missouri University of Science and Technology, United StatesReviewed by:
Karthik Seetharam, West Virginia State University, United StatesCopyright © 2022 de Hond, van Calster and Steyerberg. This is an open-access article distributed under the terms of the Creative Commons Attribution License (CC BY). The use, distribution or reproduction in other forums is permitted, provided the original author(s) and the copyright owner(s) are credited and that the original publication in this journal is cited, in accordance with accepted academic practice. No use, distribution or reproduction is permitted which does not comply with these terms.
*Correspondence: Anne A. H. de Hond, YS5hLmguZGVfaG9uZEBsdW1jLm5s
Disclaimer: All claims expressed in this article are solely those of the authors and do not necessarily represent those of their affiliated organizations, or those of the publisher, the editors and the reviewers. Any product that may be evaluated in this article or claim that may be made by its manufacturer is not guaranteed or endorsed by the publisher.
Research integrity at Frontiers
Learn more about the work of our research integrity team to safeguard the quality of each article we publish.