 Wei-Chen Hsiao
 Yung-Ching Chen
 Yi-Wen Liu
94% of researchers rate our articles as excellent or good
Learn more about the work of our research integrity team to safeguard the quality of each article we publish.
Find out more
ORIGINAL RESEARCH article
Front. Digit. Health, 01 September 2021
Sec. Connected Health
Volume 3 - 2021 | https://doi.org/10.3389/fdgth.2021.724539
This article is part of the Research TopicDigital Hearing HealthcareView all 31 articles
The distortion-product otoacoustic emission (DPOAE) is a backward propagating wave generated inside the cochlea during the wave amplification process. The DPOAE signal can be detected rapidly under relatively noisy conditions. In recent years, the earphone industry demonstrated interest in adopting DPOAE as an add-on feature to make their product “intelligent” of inner-ear status. However, a technical challenge remains to be tackled—the loudspeaker in an earphone generates its own cubic distortion at the same frequency as DPOAE. Unfortunately, the intensity of loudspeaker distortion is typically comparable to that of the DPOAE, if not higher. In this research, we propose two strategies, namely compensation and cancellation, to enable DPOAE measurement with a single loudspeaker. The compensation strategy exploits the part of the growth function of the loudspeaker distortion which is almost linear, and thus suppresses the distortion it generates while retaining a larger portion of DPOAE in the residual signal. The cancellation strategy utilizes a one-dimensional Volterra filter to remove the cubic distortion from the loudspeaker. Testing on normal-hearing ears shows that the compensation strategy improved the DPOAE-to-interference ratio by approximately 7 dB, resulting in a cross-correlation of 0.62 between the residual DPOAE level and the true DPOAE level. Meanwhile, the cancellation strategy directly recovered both the magnitude and the phase of DPOAE, reducing the magnitude estimation error from 15.5 dB to 3.9 dB in the mean-square sense. These pilot results suggest that the cancellation strategy may be suitable for further testing with more subjects.
Otoacoustic emissions (OAEs) are sounds generated in the cochlea that propagate backward to emit from the ear (1). OAEs can be classified into two types (2)—spontaneous OAEs (SOAEs) and evoked OAEs. SOAEs occur in the absense of external stimulus, and evoked OAEs can be regarded as acoustic responses to external stimulus. Within the family of evoked OAEs, the distortion-product OAE (DPOAE) is widely used as an objective tool for detecting hearing impairment associated with outer hair cell (OHC) dysfunctions (3, 4). To measure DPOAE, a pair of primary tones at frequencies f1 < f2 are delivered to an earphone inserted to the ear canal. With appropriately chosen intensities and frequencies of the primary tones [e.g., f2/f1 = 1.22, (5)], the most prominent distortion product would occur at 2f1 − f2 and it can be recorded from a microphone in the ear canal. Because the primary tones' excitation patterns mainly overlap near the f2 characteristic place in the cochlea (6), the sound-pressure level (SPL) of DPOAE at fDP = 2f1 − f2 represents the cochlea's ability to process signals normally at frequency f2. Thus, DPOAE serves as a robust and non-invasive tool for assessing cochlear functions in a frequency-specific manner (4). It has been applied clinically for hearing screening (7, 8), and diagnosis of acute hearing loss (9) and other kinds of hearing impairment (10, 11).
Typically, a clinical DPOAE probe consists of two loudspeakers and one microphone; for each ear, the primary tones at f1 and f2 are separately delivered to the two speakers to avoid generating intermodulation distortion (IMD) electrically (12). As a rare exception, a single-speaker configuration was adopted for measuring vibration caused by DPOAE on insect tympanal organs (13); however, it was emphasized that one should avoid over-driving the speaker and thus producing IMD artifacts (14). In the field of cochlear neurophysiology, nonetheless, a combination of 5–7 tones with carefully arranged frequencies could be delivered simultaneously to a single speaker to elicit auditory-nerve responses (15); in their study, loudspeaker IMD was not a concern because the neural response by nature contains strong quadratic-distortion components which actually facilitate efficient estimation of the cochlear tuning curve at the auditory-nerve level.
Recently, the two-loudspeaker hardware design has been adopted by a commercial headphone that promotes at-home DPOAE measurement as a means of providing personalized frequency response adjustment (16). The two-speaker design seems necessary because, even with a high-quality headphone or earphone, the total harmonic distortion (THD) can reach 3% when driven to its full dynamic range (17). This THD level is acceptable for listening to music; however, when delivering two pure tones simultaneously, we found that the distortion generated by such speakers would significantly interfere with the DPOAE from the ear since the cubic distortion of the speaker also occurs at fDP.
Nevertheless, human DPOAE and loudspeaker IMD have different generation mechanisms even though they may occur at the same frequency. For example, the DPOAE signal is comprised of a direct component plus a reflective component (18, 19); the direct component travels back from the f2 characteristic place in the cochlea, while the reflective component travels further to the fDP place and changes direction due to coherent reflection (20). The two components thus have different latency in the range of 5–20 ms, which allows them to be separated via envelope-tracking techniques (21). Also, they may superpose constructively or destructively depending on their relative phase. In comparison, the loudspeaker IMD is perhaps elicited nearly instantaneously, so we expect that its latency and rate of growth with respect to the primary tone levels L1 and L2 might differ from that of DPOAE. In this research, we seek to exploit these differences and develop methods for estimation of DPOAE levels using a single speaker, despite of interference from loudspeaker IMD.
In particular, we propose stimulus design and signal processing strategies that handle the interference issues due to loudspeaker IMD. The first strategy is called compensation and it involves finding a combination of L1 and L2 such that the IMD level grows almost linearly with respect to simultaneous increment in (L1, L2). The second strategy is called cancellation and it utilizes 3rd-order one-dimensional Volterra filter (22) to subtract the loudspeaker IMD from the signal. The organization of the remaining part of this paper follows the standard order of Methods, Results, Discussion, and Conclusion.
In this section, we first review the mathematics of IMD generated by two tones. Typical spectrums of DPOAE and loudspeaker IMD will be shown so we can examine the similarities and differences. Then, the compensation strategy and the cancellation strategy will be described. This section ends with brief descriptions of the recording equipment and the human subjects who participated in the testing.
Assuming that an acoustic or electrical stimulus, called the input signal, contains two frequency components f1 and f2, so the signal can be expressed as follows,
where A1, A2 and ϕ1, ϕ2 denote the amplitude and phase for two components, respectively. Assume that the stimulus is delivered to a nonlinear system G so that the response y(t) can be denoted as y(t) = G(x(t)). When G is instantaneous, it can be expanded by Taylor's series near the origin; that is,
By setting η = x(t) and through simple trigonometry, one can show that
where Bm,n are complex-valued coefficients, and m and n sum over all integers such that mf1 + nf2 > 0. The components Bm, 0 or B0,n are referred to as harmonics; the additional components Bm,n when m and n are both nonzero are called the intermodulation products and they can be classified by their order |m| + |n|. In the context of DPOAE measurement with a single loudspeaker, y(t) thus contains not only the primary frequencies f1 and f2 but also higher-order components at mf1 + nf2. Empirically, the 3rd-order intermodulation products B2,−1 and B−1,2 are most prominent from a loudspeaker (see Figure 1A), and a few other components such as B3,−2, B−2,3 can also be identified above the noise floor. In comparison, from the DPOAE spectrum (measured by the conventional two-speaker approach), the B−1, 2 component corresponding to frequency 2f2 − f1 usually cannot be detected (see Figure 1B). The reason is because, even though the intermodulation product at 2f2 − f1 is generated due to OHC nonlinearity near the f2 place, it is prohibited from backward propagation along the basilar membrane (23).
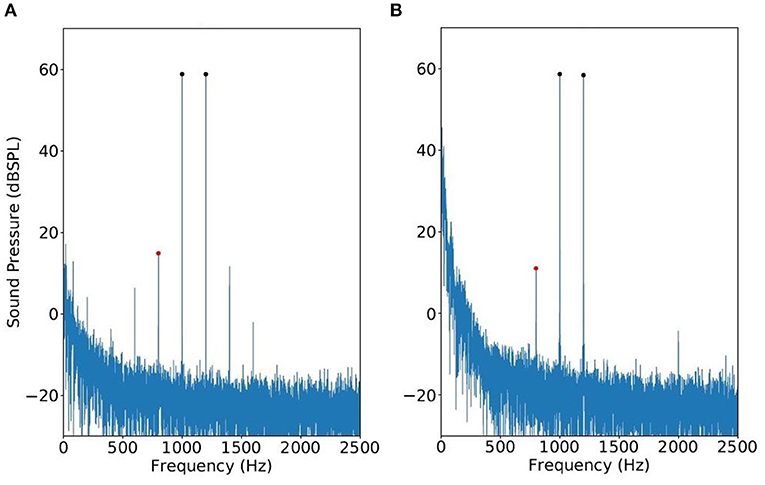
Figure 1. Spectrums of modulation distortion produced by a single speaker (A) vs. true DPOAE obtained with a two-speaker probe (B). The primary frequencies are f1 = 1, 000 Hz and f2 = 1, 200 Hz.
By inspecting Figure 1, note that the loudspeaker components occurring at 2f1 − f2 has the same frequency as DPOAE. This 3rd-order component from the loudspeaker is referred to as IMD3 hereafter, and we shall investigate how to estimate DPOAE regardless of the presence of IMD3.
The DPOAE level, denoted as LDP, depends systematically on parameters (L1, L2, f1, f2). The relation LDP = LDP(L1, L2, f1, f2) was comprehensively measured from a cohort of 20 normal-hearing human subjects (24) with a purpose to recommend the optimal choice of that maximizes LDP given L2. When L1 increases beyond , LDP starts to decrease due to two-tone suppression (25). The same phenomenon has also been reproduced in silico by simulation of cochlear mechanics (23). In this section, we report on how differently the IMD3 level depends on the parameters, and hence devise a way to suppress IMD3 by considering two sets of primary-tone level (L1, L2) jointly.
In contrast to cochlear mechanics, the loudspeaker nonlinearity does not demonstrate two-tone suppression; for instance, Figure 2 shows IMD3 level as a function of (L1, L2) with f1 = 1, 000 Hz and several different ratios f2/f1. The results were obtained by delivering the primary tones to one of the two loudspeakers of a DPOAE probe (see section 2.4 for details) and measuring the response inside a syringe of approximately 2.0 cc. For any fixed L2, as L1 increases, we do not find a clear beyond which LIMD3 starts to decrease, and this is quite unlike what was observed in human subjects with the most commonly used frequency ratio f2/f1 ≈ 1.2 (24, Figure 1).
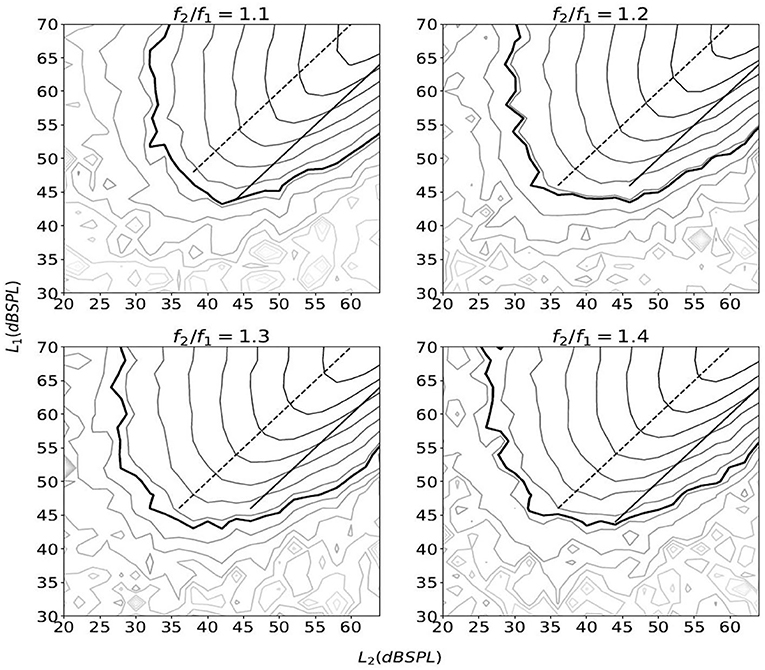
Figure 2. The equal-level contour plots of IMD3 as a function of (L1, L2). The thick line marks LIMD3=0 dB SPL, and other lines are in 4-dB steps. The IMD3 level were obtained by varying L1 from 30 to 70 dB SPL and L2 from 20 to 64 dB SPL in 2 dB steps. For each combination of (L1, L2), the stimulus lasted for 1.0 s with a 2.5-ms raised cosine ramp for the rising and falling edges. The stimulation was repeated five times and the average IMD3 level is shown. The solid line and the dashed line represent L1 = L2 and L1 = L2 + 10 (dB), respectively.
The contour plot of IMD3 also differs from that of human DPOAE in the rate of growth with respect to L1 and L2. In particular, when L1 and L2 increases proportionately as they move toward the top-right corner of the plot along the straight lines L1 = L2 + 10 or L1 = L2, the rate of growth of LIMD3 with respect to L2 seems to be close to 1.0 dB/dB for a wide range of L2 and across different f2/f1 ratio (see the “growth functions” in Figure 3). The slope of these growth functions are shown in Figure 4, and the path L1 = L2 happens to have the slope that is closest to 1.0 dB/dB across different primary-frequency ratios. In comparison, the average human DPOAE growth rate when L1 = L2 falls in the range of 0.3 − 0.5 if f2/f1 ≈ 1.2 (24, Figure 1). By exploiting this difference between the growth function of loudspeaker IMD3 and human DPOAE, we present a method that suppresses the IMD3 level while partially retaining the DPOAE.
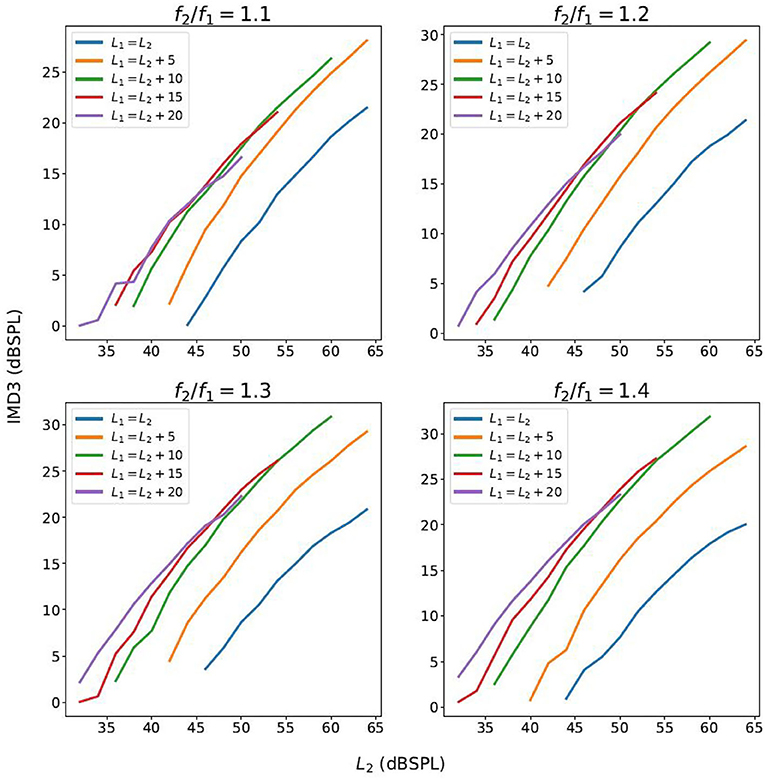
Figure 3. The growth function of the IMD3 level with respect to L2, as L1 and L2 increase proportionately.
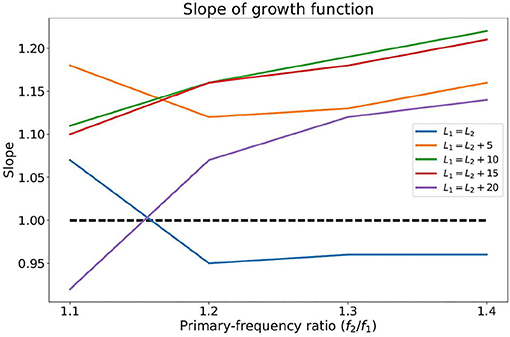
Figure 4. The slope of the growth functions of the IMD3 shown in Figure 3 with various primary-frequency ratios and primary-level differences.
To leverage the part of IMD3 growth function that is almost linear (i.e., 1 dB/dB slope), we can devise the following performance metric,
where (P1, P2) denotes primary-tone sound pressure in Pa, β > 1 denotes a scaling factor, and GIMD3 and GDP denote the sound pressure of IMD3 and DPOAE in Pa, respectively. Conceptually, the goal of the compensation strategy is to choose (P1, P2) and β such that J is maximized. However, since the numerator (referred to as DPOAE residual) would vary among individuals, we seek to minimize the denominator in J, referred to as the IMD3 residual. Based on the results shown in Figure 4, we selected L1 = L2 (i.e., P1 = P2) for the remaining parts of this paper. As implied by Figure 3, choosing L1 anywhere between 45 dB to 65 dB SPL should work well in reducing the IMD3 residual since GIMD3(βP1, βP2) ≈ βGIMD3(P1, P2). In contrast, we expect a larger proportion of DPOAE would remain in the DPOAE residual because the rate of growth against (P1, P2) is sub-linear (i.e., <1 dB/dB).
Based on the above-mentioned concept, we propose the following signal acquisition protocol.
• Step 1: Calibrate the stimulus levels A1 and A2 in Equation (1) such that P1 = P2 in the ear canal.
• Step 2: Transform the recorded signal to the frequency domain, and calculate the magnitude at 2f1 − f2, which is the vector sum of IMD3 and DPOAE. Denote the result as Y(P1, P2).
• Step 3: Repeat Step 2 with increased primary-tone levels βP1 and βP2. Denote the result as Y(βP1, βP2).
• Step 4: Calculate the magnitude of residual at 2f1 − f2, defined as |βY(P1, P2) − Y(βP1, βP2)|.
To summarize, the goal of the signal acquisition protocol is to keep a large portion of DPOAE in the residual while maximally suppressing IMD3 at the same time.
To describe the cancellation strategy, since digital adaptive filtering techniques are involved, we change the time variable from t to the integer index n (not to be confused with the index n in Equation 3). We follow a standard digital signal processing notation in defining y[n] = y(nT) (26), where y(t) is a continuous-time signal, T denotes the sampling period, and y[n] denotes the result after sampling in time.
The idea behind this strategy is to cancel IMD3 instantaneously. To achieve this goal, we utilize two techniques, namely a phase-controlled exponential swept-sine chirp and the one-dimensional Volterra filters (ODVFs), to adjust the input signal before sending it to the speaker. The workflow is shown in Figure 5 where H(ω) denotes a frequency response measured by the phase-controlled exponential swept-sine chirp (to be described in section 2.3.1), and the normalization factor ensures that the input to ODVF is limited to the range [−1, 1]. The input signal which contains two pure tones for DPOAE measurement is first transformed from time domain to frequency domain through DFT, then transformed back to time domain after multiplying with the frequency response of the single speaker H(ω). The filter coefficients of ODVF are meant to be obtained offline by adaptive LMS algorithm (to be described in section 2.3.2); when applied online, the ODVF filter coefficients are fixed. Subsequently, the multiplication by H−1(ω) is to compensate the gain and phase change due to multiplication by H(ω). This workflow produces an adjusted input signal to be delivered to the single speaker for the purpose of measuring DPOAE.
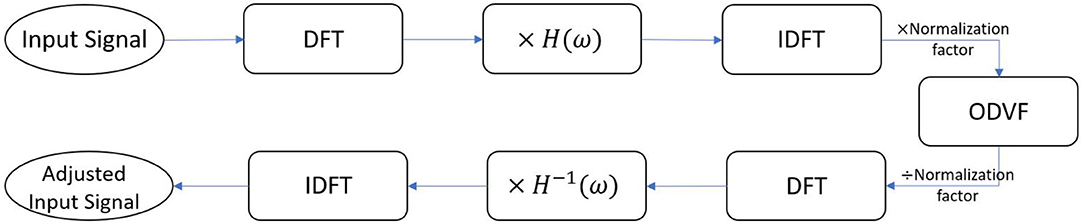
Figure 5. Block diagram of the IMD3 cancellation method. DFT, discrete Fourier transform; IDFT, inverse DFT; ODVF, one-dimensional Volterra filter. H(ω) represents the linear coupling from the speaker to the microphone, which was measured offline by a sweep-sine chirp method described in section 2.3.1.
The rationale of this design is to artificially generate intermodulation distortions by the ODVF filter but with an inverted polarity, so they can cancel the real intermodulation distortion generated by the loudspeaker. We shall see in section 2.3.2 that the ODVF is trained off-line to emulate the situation of using two separate loudspeakers.
A phase-controlled exponential swept-sine chirp (27) is used to obtain the linear coupling response from the loudspeaker to the microphone. This chirp exhibits an instantaneous frequency that increases exponentially with time as follows,
where A is the amplitude of the sine wave, Q is an integer number of octaves, L is the ideal chirp length, and N is the real chirp length which is L rounded to the nearest integer. We also need an inverse chirp to convolve with, which can be expressed as
The result of convolving s[n] and s−1[n] is approximately a Dirac delta impulse, and the gain is 0 dB for all frequencies.
We set the chirp's frequency to glide from 47 to 24, 000 Hz and the chirp length was 10.5 s. Then, we delivered the chirp to drive the single speaker and recorded the sound simultaneously. Subsequently, the recorded signal was convolved with the inverse chirp (Equation 6) to obtain the impulse response h[n] that characterizes the linear coupling from the speaker to the microphone. The Fourier transform of h[n] is denoted as H(ω) in Figure 5.
Since the intermodulation is due to loudspeaker nonlinearity, the behavior of its inverse system can ideally be characterized by Volterra series expansion (28). However, the full-scale Volterra series expansion requires estimate of multi-variate kernel functions which may be computationally impractical to implement and its estimation might be slow in convergence. In this research, we adopted a simplified version called one-dimensional Volterra filters (ODVF) (22) — assume that the inverse system can be modeled as follows,
where x[n] and y[n] denote the input and output of the inverse system, respectively, hp[i] denotes the pth-order kernel of ODVF, and Mp is the length of the pth-order kernel. Since this research focuses on canceling a cubic distortion, a partial ODVF retaining only the 1st-order and 3rd-order kernels was used; that is,
The filter coefficients could be obtained by the adaptive least mean square (LMS) method (29). The LMS method involves updating the filter coefficients constantly as the time index n proceeds. First, denote the filter coefficients in the following vector form,
and similarly,
Note that the subscript n indicates that both vectors are updated as n increases. Then, an approximation error signal can be defined as follows,
where d[n] is a desired signal to be defined shortly, and vectors x[n] and x3[n] are defined as follows,
and
Finally, the update equations are given as follows,
and similarly,
where α = 6 × 10⁻³ denotes a stepsize that was chosen empirically.
Figure 6 shows how the ODVF coefficients were obtained in this research. The stimulus s[n] contained two primary tones, and we set d[n], the desired signal, to be the signal recorded by sending the two tones to separate speakers of a reliable reference probe, so d[n] was free of IMD. Meanwhile, the input x[n] to the ODVF was the signal recorded by using one single speaker while y[n] denotes the output of the ODVF. Here, we emphasize that the adaptive procedure was performed offline just for one time, and it was not necessary to repeat the procedure when measuring DPOAE from individual ears. In practice, we first recorded x[n] and d[n] separately in the same 2-cc syringe with the same stimulus s[n]. Then, the filter coefficients h1,0 were initialized at 1 and h3,0 were initialized at 0, and we computed the updates iteratively according to Equations (9–11). After the filter coefficients converged, we could expect that the variance of e[n] would be minimized and y[n] should approximate d[n], which is a cubic distortion-free signal, in a stochastic sense.
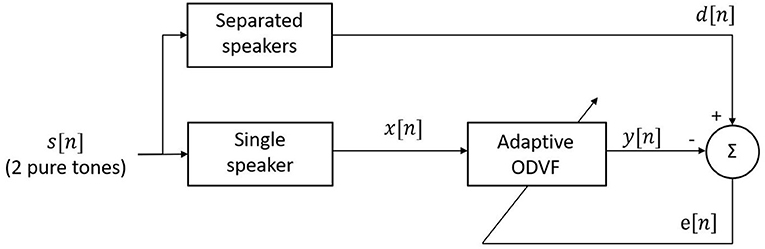
Figure 6. Block diagram for computing the ODVF coefficients.
In practice, we found that the 1st-order kernel h1[n] tended to converge to a band-pass filter around the primary-tone frequencies which simply rejected all the intermodulation components linearly. This caused the “training” of h3,n to fail. Therefore, we set the 1st-order kernel length M1 to 1 to ensure that h3[n] learns to cancel the cubic distortion.
All recordings were collected using a Python script that controls the ER-10C DPOAE probe-microphone (Etymotic Research) system via a 24-bit soundcard (Fireface UFX II, RME). The sampling frequency was set to 48 kHz. All recordings were done in a sound-proof room with the noise floor of approximately 19-21 dB SPL (30).
Twelve subjects between age 22 and 32 participated in the research, including 8 males and 4 females. The compensation strategy was tested on the data from 5 of the subjects, while the cancellation strategy was tested on the data from 7 subjects. All the subjects did not have ear infection or report any hearing problems at the time of experiment. The recruitment of human subjects was approved by the IRB of National Tsing Hua University (No. 10912HE101).
Here we report the efficacy of applying the compensation and cancellation strategies.
We first tested the signal acquisition protocol in a 2-cc syringe. The parameters being tested were β = 1.5, 2.0 or 3.0, and P1 = P2 = 6.3, 11.3, and 20.0 mPa, which correspond to 50, 55, and 60 dB SPL, respectively. The primary frequencies were f1 = 1, 000 and f2 = 1, 200 Hz. We quantify the performance of IMD3 suppression by the following index,
Here, K is just the IMD3 to IMD3 residual ratio in dB scale.
The values K for different combinations of β and L1 are listed in Table 1. Note that K is quite insensitive to change in L1, while β = 1.5 gives the highest K. Therefore, β = 1.5 was chosen for testing in the ear. Also, L1 = L2 = 60 dB SPL was selected in order to maximize DPOAE and its residual.
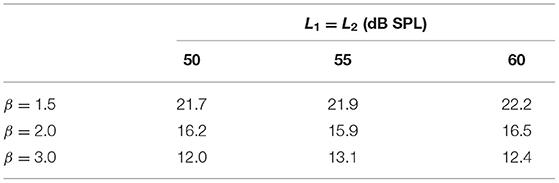
Table 1. The suppression index K for different combination of parameters.
DPOAEs residuals were recorded from five subjects for their left and right ears using the compensation strategy. Two protocols were considered. The first one is called the “stereo” protocol which uses separate speakers to obtain the ground truth of DPOAE and the residual thereof after applying the compensation strategy. The second is called “mono” protocol and it uses a single speaker mentioned in section 2.2.2 to obtain the DPOAE residual subject to the IMD3 interference. The residual obtained with the stereo protocol should be regarded as a performance upper-bound for the compensation strategy since the IMD3 component is negligible when both speakers are used. We then study the correlation between the residual level obtained by both protocols and the true DPOAE level to evaluate the effectiveness of the compensation strategy.
The results of mono vs. stereo protocols are plotted in Figure 7. The x-axis is the true DPOAE level obtained with two speakers, and the y-axis represents the DPOAE residual levels obtained with the two protocols. The dashed lines show the results of linear regression. For the stereo protocol, the regression line is y = 0.77x − 12.46, and for the mono protocol, the regression line is y = 0.38x − 7.76. By using the stereo protocol, the correlation between DPOAE residual and true DPOAE level, both in dB SPL, equals to 0.86 with a high significance (p < 0.001). However, the DPOAE residual levels were 15 dB lower than the real DPOAE levels in average. This indicates that the DPOAE was suppressed by about 80% after applying the compensation strategy. Note that, nevertheless, the IMD3 component was suppressed by 22 dB under the same settings (see Table 1). Thus, we can say that the compensation strategy improved the DPOAE to IMD3 ratio by 7 dB in average. By using the mono protocol, the correlation between the residual and the true DPOAE level is lowered to 0.62. Nevertheless, with a p < 0.01, the correlation is deemed significant for this particular set of data, in the sense that the null hypothesis (no correlation) is rejected.
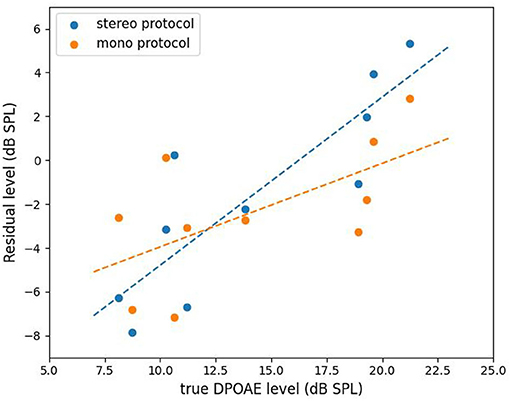
Figure 7. The residual level vs. the true DPOAE level with stereo and mono protocols, respectively. The dashed lines are least-square fits to the data.
We obtained different sets of ODVF coefficients at f1= 1,000, 1,200, 1,500, and 2,000 Hz, respectively, while f2/f1 = 1.2 was fixed. The amplitude of both tones was set to 20 mPa (60 dBSPL), and the recordings ran for 10.5 s with 2.5 ms raised cosine ramp for the rising and falling edges of the stimulation. Empirically, the recording time was sufficiently long to ensure convergence of the filter coefficients. Figure 8 shows the resulting 3rd-order filter coefficients h3[n] for f1= 1,000 and 2,000 Hz, respectively. These h3[n] coefficients were subsequently used for validating the proposed cancellation strategy depicted in Figure 5.
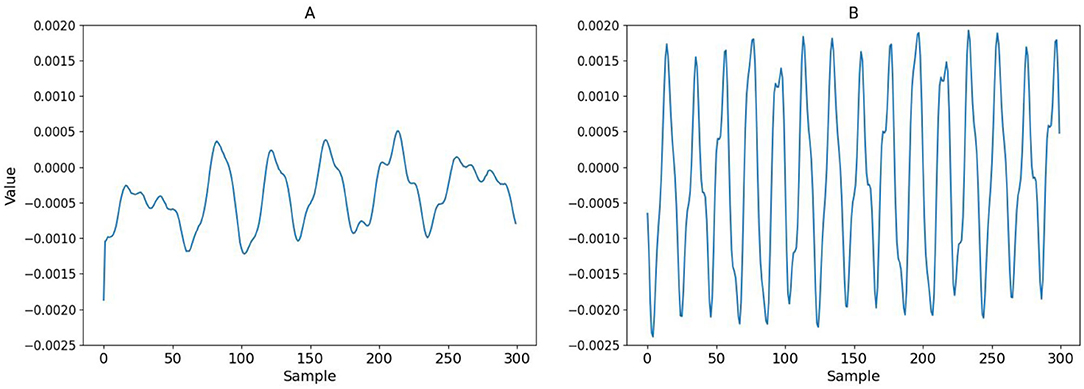
Figure 8. The 3rd-order filter coefficients h3[n] under (A) f1 = 1, 000 Hz and (B) f1 = 2, 000 Hz. The length of the filter was set to 300, which corresponds to 6.25 ms at 48 kHz sampling rate.
Following the workflow described in Figure 5, we first tested the adjusted input signal in the 2-cc syringe. The results are shown in Figure 9. Figure 9A is the signal recorded by using a single speaker to play two primary tones. Therefore, the spectrum contains intermodulation distortion. Figure 9B is the signal recorded by using separated speakers and it therefore does not contain intermodulation distortion, and Figure 9C is the signal by using the adjusted input signal produced by the workflow of Figure 5. The black dots represent the magnitude of primary tones f1 and f2, the red dot represents the magnitude of the IMD3. All the three recordings ran for 2.5 s with 2.5 ms raised cosine ramp for the rising as well as falling edges of the stimulation. The result shows that IMD3 is largely reduced to submerge below the noise floor. Note that the 2f2 − f1 component at 1400 Hz is also suppressed, though not as perfectly as at 2f1 − f2. The fifth-order distortions at 600 and 1600 Hz remain unchanged.
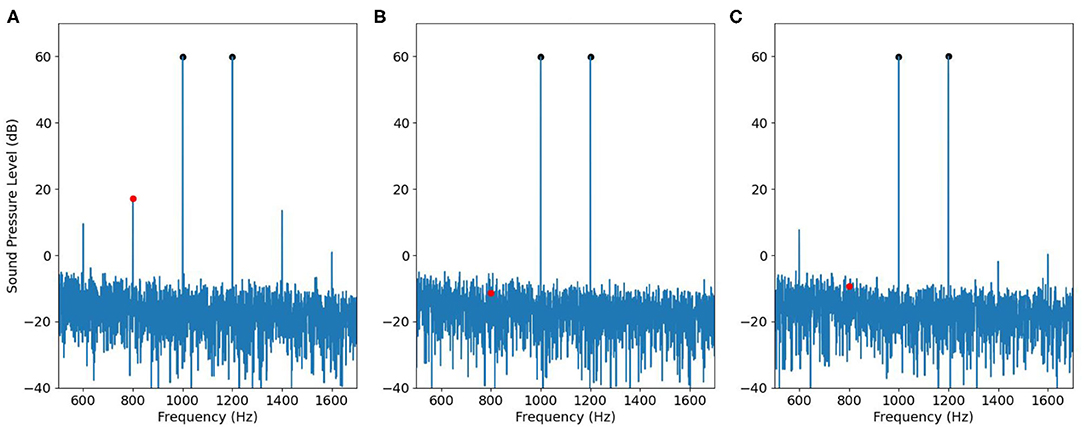
Figure 9. Effectiveness of ODVF in canceling IMD3 in a syringe, visualized in the frequency domain. (A) The signal recorded by using a single speaker. (B) The signal recorded by using two speakers. (C) The signal recorded by using the adjusted input signal in Figure 5.
Then we applied the same recording procedure in human ears. Figures 10, 11 show some typical results. Figure 10A contains DPOAE interfered with the original IMD3, Figure 10B shows the ideal signal recorded by using separate speakers for the primary tones, and the results are regarded as the true DPOAE signal to compare against. Figure 10C is the signal recorded by using the adjusted input signal described in Figure 5; the signal contains DPOAE interfered with the remaining IMD3.
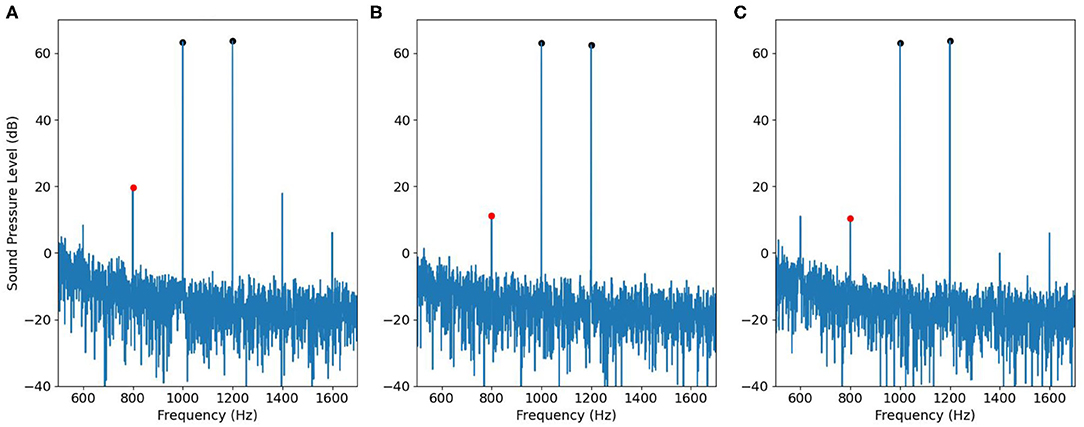
Figure 10. An example of DPOAE estimation by the cancellation strategy when f1 is 1,000 Hz, viewed in the frequency domain. (A) The signal recorded by using a single speaker. (B) The desired signal recorded by using two speakers. (C) The signal recorded by using adjusted input signal in Figure 5.
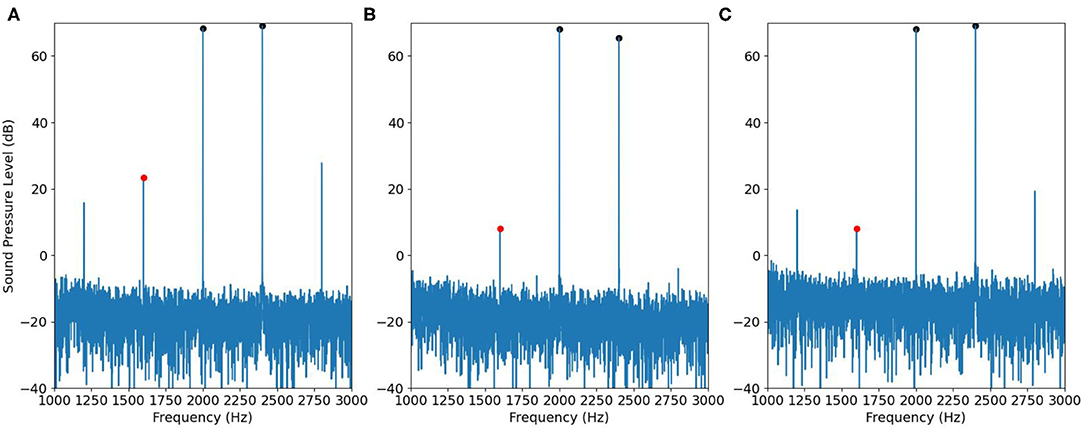
Figure 11. Similar to Figure 10, but with f1= 2,000 Hz.
We also extended the experiments to f1 = 1, 200, 1, 500, and 2, 000 Hz while f2/f1 = 1.2. The results without (Figures 12A,C) and with (Figures 12B,D) the IMD3 cancellation strategy are shown in Figure 12. In Figures 12A,B, the horizontal axis is the true DPOAE level, and the vertical axis is the magnitude at fDP. In Figures 12C,D, the horizontal axis is the true DPOAE phase, and the vertical axis is the phase measured at fDP. The linear regression lines are also shown for visualization.
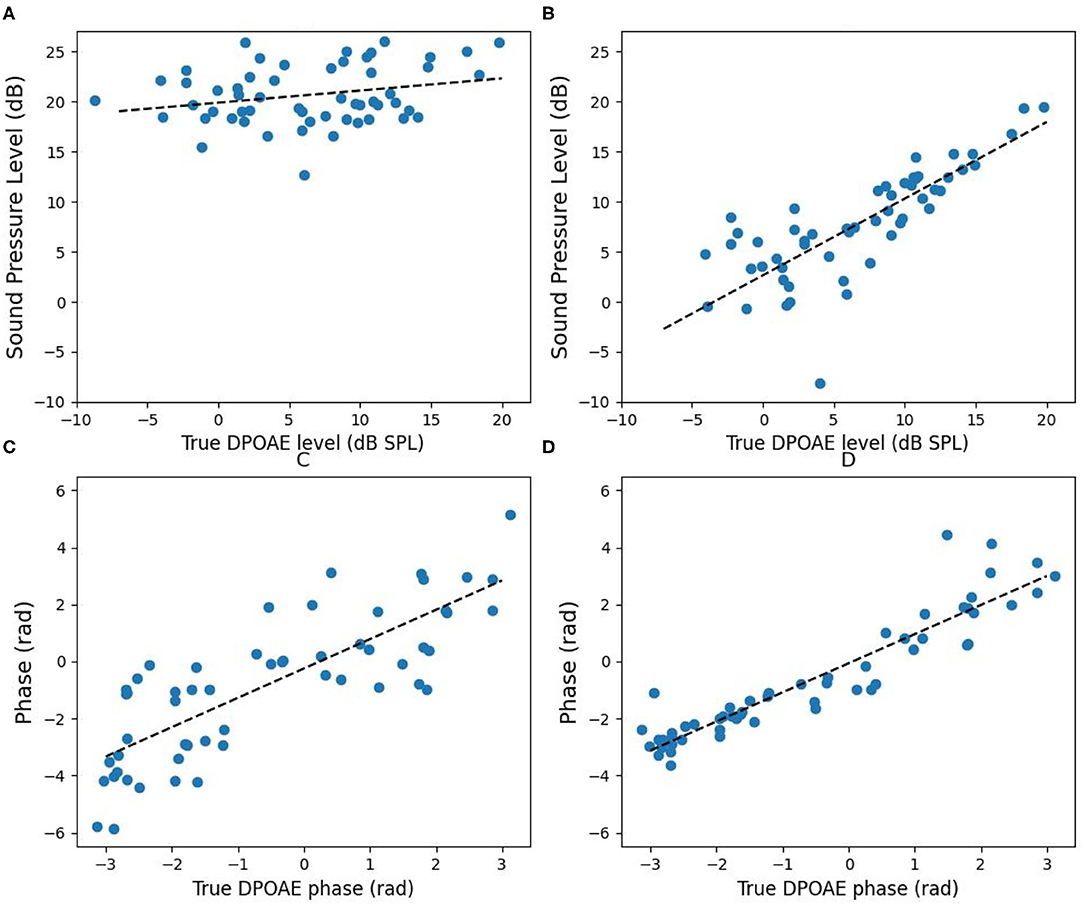
Figure 12. Comparison of DPOAE data without and with the IMD3 cancellation strategy. (A) The sound pressure level without applying the IMD3 cancellation strategy; (B) the sound pressure level after applying the IMD3 cancellation strategy; (C) the phase without, and (D) the phase with the IMD3 cancellation strategy. In each plot, the dashed line shows the result of linear regression.
Without applying IMD3 cancellation strategy, the regression lines of the magnitude and the phase are y = 0.12x + 19.87 and y = 1.03x − 0.25, respectively, and the root mean square errors (RMSE) are 15.52 dB and 1.50 rad, respectively. After applying IMD3 cancellation strategy, the regression lines of the magnitude and the phase become y = 0.76x + 2.64 and y = 1.02x − 0.06, respectively, and the RMSE are reduced to 3.88 dB and 0.76 rad, respectively.
After applying the IMD3 cancellation strategy, we calculated the correlation between the estimated and the true DPOAE sound pressure levels, and the correlation between the estimated and the true DPOAE phase, respectively. Subsequently, we ran the Wald test with t-distribution to evaluate the significance of correlation. The correlation between the estimated and true DPOAE levels equals to 0.81 with a high significance (p < 0.001); also, the correlation between the estimated and the true DPOAE phase equals to 0.93 with a high significance (p < 0.001).
In contrast, without applying the IMD3 cancellation strategy, the correlation between the measured DPOAE and the true DPOAE sound pressure levels equals to 0.25 with a low significance (p = 0.057). Although the phase estimation error is higher without applying the cancellation strategy, the cross-correlation between the measured and the true DPOAE phase was still high (0.80) and significant (p < 0.001).
The number of data points turns out to be 55. We recruited 7 subjects, test both ears at 4 frequencies, resulting in 56 DPOAE magnitudes and phases. However, the DPOAE level of one of the ears was below the noise floor when f1 = 1, 000 Hz. So that single point of data was abandoned.
As true wireless, noise-cancellation earphones are gaining popularity in recent years, the ear canal also becomes an over-booked space for various body sensors to enter and make the earphone intelligent (31, 32). Since active noise-cancellation earphones are indeed equipped an internal microphone1, there is no reason why the microphone cannot measure DPOAE. The main factor that hinders such application might be the interference due to loudspeaker IMD. As much as we are aware of, consumer earphones are not typically designed to have two speakers in one ear2, so sending the primary tones to separate speakers would not be a choice. In this research, we demonstrated that “wrongly” using one single loudspeaker to play the f1 and f2 tones may still work as long as we can cancel the IMD3 it generates. Hence, we hope that this research can serve as a feasibility study for the earphone industry to promote DPOAE as a service to consumers of active noise cancellation earphones. We envision that making DPOAE available at home could also enrich any remote hearing care program in the future.
Among the two proposed strategies, cancellation outperforms compensation in producing a more accurate prediction of the true DPOAE level. On one hand, the cancellation strategy achieves a higher cross-correlation to the true DPOAE level (0.81) than the compensation strategy (0.62); one the other hand, it also provides a direct estimate of the DPOAE magnitude and phase, instead of just a residual. It remains to be seen in the future whether similar results would be obtained with a larger sample size.
The usage of Volterra filters also brings up many research questions. For instance, Figure 8 shows that the 3rd-order function h3[n] are different for different choices of (f1, f2). Presently, we are uncertain whether (a) this is a limitation due to omitting all the off-diagonal elements of the Volterra filter to make it one-dimensional, or (b) is it possible to apply certain transformation akin to pre-whitening so the adaptive system eventually “learns” a universal ODVF for canceling all the cubic distortions given any input signal. Apparently, there is still much room to explore on this topic.
Meanwhile, as much as the compensation strategy is concerned, it is surprising that we found a large region on the (L1, L2) plane where the IMD3 level grows quasi-linearly when L1 and L2 increase proportionately. In practice, it may be interesting to see if a similar property can be observed in other DPOAE probes or consumer earphones. We speculate that the quasi-linear growth is an epiphenomenon because cubic distortion is by nature a third-order component. Under the light of Taylor expansion in Equation (2), we can expect IMD3 to demonstrate a 3 dB/dB growth when the stimulus is at low intensity—and so does DPOAE (23). As the intensity of η increases, higher order terms G(k)(0)ηk/k! begin affecting the growth function. In particular, all the odd-order terms should jointly reduce the slope of growth of B2,−1 and account for its saturation (it is straightforward to show that the even-order terms do not contribute to B2,−1). So the fact that we observe nearly 1 dB/dB growth at the working range of (L1, L2) may just be a coincidence.
Some other techniques might be worth consideration for estimating the DPOAE level under IMD3 interference. As mentioned in section 1, DPOAE itself has two components — the direct one and the reflection. Based on the difference in latency, Vetesník et al. (21) designed short pips to elicit DPOAE and applied envelope tracking techniques to separate the two components. If the loudspeaker distortion is generated within a shorter time before DPOAE emerges, one might be able to identify an early peak by tracking the instantaneous amplitude at the 2f1 − f2 frequency. Thus, the loudspeaker IMD3 and DPOAE might be separated in the time domain. This may require careful re-thinking of the stimulus design and is left for future exploration.
We proposed two strategies to estimate the DPOAE level subject to interference from the loudspeaker IMD3. The compensation strategy was designed to suppress IMD3 based on its quasi-linear growth with respect to primary-tone levels, in contrast to DPOAE's sub-linear growth. Results show that, although the DPOAE level was also suppressed by 80%, the residual level correlates to the true DPOAE level. The cancellation strategy adjusted the input signal nonlinearly to emulate distortion-free stimulation. It thus recovered both the DPOAE magnitude and phase directly. Overall, this research suggests that it might be feasible to use a single-loudspeaker probe to measure DPOAE. Testing with a larger sample of human subjects as well as various types of earphones shall ensue to evaluate whether commercial noise-cancellation earphones could be utilized to allow sufficiently accurate DPOAE measurement at home.
The raw data supporting the conclusions of this article will be made available by the authors, without undue reservation.
The studies involving human participants were reviewed and approved by Research Ethic Committee, National Tsing Hua University. The patients/participants provided their written informed consent to participate in this study.
YCC discovered the almost linear growth in IMD3, and came up with the compensation strategy. WCH tested the compensation strategy, and conceived the cancellation strategy using ODVF and then implemented and tested the cancellation strategy. YWL supervised the research and is responsible for the manuscript preparation process. All authors contributed to the article and approved the submitted version.
This research was supported by the Ministry of Science and Technology of Taiwan (grant no. 107-2221-E-007-093-MY2).
The authors declare that the research was conducted in the absence of any commercial or financial relationships that could be construed as a potential conflict of interest.
All claims expressed in this article are solely those of the authors and do not necessarily represent those of their affiliated organizations, or those of the publisher, the editors and the reviewers. Any product that may be evaluated in this article, or claim that may be made by its manufacturer, is not guaranteed or endorsed by the publisher.
We thank Drs. Yu-Ting Lin and Tang-Chuan Wang for regular exchange of research ideas and offering critiques.
1. ^For example AirPods Pro and AirPods Max Active Noise Cancellation and Transparency mode, https://support.apple.com/en-us/HT210643.
2. ^For example “Qualcomm QCC3056 is an ultra-low power, single-chip solution, optimized for use in truly wireless earbuds and hearables.” The chip features mono audio playback. https://www.qualcomm.com/products/qcc3056.
1. Kemp DT. Stimulated acoustic emissions from within the human auditory system. J Acoust Soc Am. (1978) 64:1386–91. doi: 10.1121/1.382104
2. Shera CA, Guinan JJ Jr. Evoked otoacoustic emissions arise by two fundamentally different mechanisms: a taxonomy for mammalian OAEs. J Acoust Soc Am. (1999). 105:782–98. doi: 10.1121/1.426948
3. Zurek PM, Clark WW, Kim DO. The behavior of acoustic distortion products in the ear canals of chinchillas with normal or damaged ears. J Acoust Soc Am. (1982) 72:774–80. doi: 10.1121/1.388258
4. Lonsbury-Martin B, Martin G. The clinical utility of distortion-product otoacoustic emissions. Ear Hear. (1990) 11:144–54. doi: 10.1097/00003446-199004000-00009
5. Harris F, Lonsbury-Martin B, Stagner B, Coats A, Martin G. Acoustic distortion products in humans: systematic changes in amplitude as a function of f2/f1 ratio. J Acoust Soc Am. (1989) 85:220–9. doi: 10.1121/1.397728
6. Kanis LJ, de Boer E. Two-tone suppression in a locally active nonlinear model of the cochlea. J Acoust Soc Am. (1994) 96:2156–65. doi: 10.1121/1.410157
7. Barker SE, Lesperance MM, Kileny PR. Outcome of newborn hearing screening by ABR compared with four different DPOAE pass criteria. Amer J Audiol. (2000) 9:142–8. doi: 10.1044/1059-0889(2000/017)
8. Sanford CA, Keefe DH, Liu YW, Fitzpatrick D, McCreery RW, Lewis DE, et al. Sound-conduction effects on DPOAE screening outcomes in newborn infants: test performance of wideband acoustic transfer functions and 1-kHz tympanometry. Ear Hear. (2009) 30:635–52. doi: 10.1097/AUD.0b013e3181b61cdc
9. Brown DJ, Gibson WP. On the differential diagnosis of Ménière's disease using low-frequency acoustic biasing of the 2f1-f2 DPOAE. Hear Res. (2011) 282:119–27. doi: 10.1016/j.heares.2011.09.002
10. Shiomi Y, Tsuji J, Naito Y, Fujiki N, Yamamoto N. Characteristics of DPOAE audiogram in tinnitus patients. Hear Res. (1997) 108:83–8. doi: 10.1016/S0378-5955(97)00043-9
11. Job A, Nottet JB. DPOAEs in young normal-hearing subjects with histories of otitis media: evidence of sub-clinical impairments. Hear Res. (2002) 167:28–32. doi: 10.1016/S0378-5955(02)00330-1
12. Whitehead ML, Stagner BB, Lonsbury-Martin BL, Martin GK. Measurement of otoacoustic emissions for hearing assessment. IEEE Eng Med Biol Mag. (1994) 13:210–26. doi: 10.1109/51.281681
13. Moir HM, Jackson JC, Windmill JFC. No evidence for DPOAEs in the mechanical motion of the locust tympanum. J Exp Biol. (2011) 214:3165–72. doi: 10.1242/jeb.056465
14. Moir HM, Jackson JC, Windmill JFC. Response to “Measurement of sensitive distortion-product otoacoustic emissions in insect tympanal organs.” J Exp Biol. (2012) 215:567. doi: 10.1242/jeb.068098
15. van der Heijden M, Joris PX. Cochlear phase and amplitude retrieved from the auditory nerve at arbitrary frequencies. J Neurosci. (2003) 23:9194–8. doi: 10.1523/JNEUROSCI.23-27-09194.2003
17. der Aerschot MV, Swanepoel DW, Mahomed-Asmail F, Myburgh HC, Eikelboom RH. Affordable headphones for accessible screening audiometry: an evaluation of the sennheiser HD202 II supra-aural headphone. Int J Audiol. (2016) 55:616–22. doi: 10.1080/14992027.2016.1214756
18. Kalluri R, Shera CA. Distortion-product source unmixing: a test of the two-mechanism model for DPOAE generation. J Acoust Soc Am. (2001) 109:622–37. doi: 10.1121/1.1334597
19. Shaffer LA, Withnell RH, Dhar S, Lilly DJ, Goodman SS, Harmon KM. Sources and mechanisms of DPOAE generation: implications for the prediction of auditory sensitivity. Ear Hear. (2003) 24:367–79. doi: 10.1097/01.AUD.0000090439.16438.9F
20. Zweig G, Shera CA. The origin of periodicity in the spectrum of evoked otoacoustic emissions. J Acoust Soc Am. (1995) 98:2018–47. doi: 10.1121/1.413320
21. Vetesník A, Turcanu D, Dalhoff E, Gummer AW. Extraction of sources of distortion product otoacoustic emissions by onset-decomposition. Hear Res. (2009) 256:21–38. doi: 10.1016/j.heares.2009.06.002
22. Mu Y, Ji P, Ji W, Wu M, Yang J. Modeling and compensation for the distortion of parametric loudspeakers using a one-dimension volterra filter. IEEE/ACM Trans Audio Speech Lang Proc. (2014) 22:2169–81. doi: 10.1109/TASLP.2014.2363414
23. Liu YW, Neely ST. distortion-product emissions from a cochlear model with nonlinear mechanoelectrical transduction in outer hair cells. J Acoust Soc Am. (2010) 127:2420–32. doi: 10.1121/1.3337233
24. Johnson TA, Neely ST, Garner CA, Gorga MP. Influence of primary-level and primary-frequency ratios on human distortion product otoacoustic emissions. J Acoust Soc Am. (2006) 119:418–28. doi: 10.1121/1.2133714
25. Hall JL. Two-tone distortion products in a nonlinear model of the basilar membrane. J Acoust Soc Am. (1974) 56:1818–28. doi: 10.1121/1.1903519
26. Oppenheim AV, Schafer RW. Discrete-time Signal Processing, 3rd Edn. Upper Saddle River, NJ: Pearson (2010).
27. Vetter K, di Rosario S. ExpoChirpToolbox: a pure data implementation of ESS impulse response measurement. In: Proceeding Pure Data Convention. Weimar (2011). Available online at: https://www.uni-weimar.de/kunst-und-gestaltung/wiki/images/ExpoChirpToolbox-_a_Pd_implementation_of_ESS_impulse_response_measurement.pdf
28. Lesiak C, Krener A. The existence and uniqueness of Volterra series for nonlinear systems. IEEE Trans Autom Control. (1978) 23:1090–5. doi: 10.1109/TAC.1978.1101898
30. Liu TC, Liu YW, Wu HT. Denoising click-evoked otoacoustic emission signals by optimal shrinkage. J Acoust Soc Am. (2021) 149:2659–70. doi: 10.1121/10.0004264
31. Venema B, Blanik N, Blazek V, Gehring H, Opp A, Leonhardt S. Advances in reflective oxygen saturation monitoring with a novel in-ear sensor system: results of a human hypoxia study. IEEE Trans Biomed Eng. (2012) 59:2003–10. doi: 10.1109/TBME.2012.2196276
Keywords: hearing, otoacoustic emissions, intermodulation distortion, nonlinear signal processing, Volterra filtering
Citation: Hsiao WC, Chen YC and Liu YW (2021) Measuring Distortion-Product Otoacoustic Emission With a Single Loudspeaker in the Ear: Stimulus Design and Signal Processing Techniques. Front. Digit. Health 3:724539. doi: 10.3389/fdgth.2021.724539
Received: 13 June 2021; Accepted: 09 August 2021;
Published: 01 September 2021.
Edited by:
Qinglin Meng, South China University of Technology, ChinaReviewed by:
Ivan Miguel Pires, Universidade da Beira Interior, PortugalCopyright © 2021 Hsiao, Chen and Liu. This is an open-access article distributed under the terms of the Creative Commons Attribution License (CC BY). The use, distribution or reproduction in other forums is permitted, provided the original author(s) and the copyright owner(s) are credited and that the original publication in this journal is cited, in accordance with accepted academic practice. No use, distribution or reproduction is permitted which does not comply with these terms.
*Correspondence: Yi-Wen Liu, eXdsaXVAZWUubnRodS5lZHUudHc=
Disclaimer: All claims expressed in this article are solely those of the authors and do not necessarily represent those of their affiliated organizations, or those of the publisher, the editors and the reviewers. Any product that may be evaluated in this article or claim that may be made by its manufacturer is not guaranteed or endorsed by the publisher.
Research integrity at Frontiers
Learn more about the work of our research integrity team to safeguard the quality of each article we publish.