- MicroMatrices Associates Ltd, Dundee, United Kingdom
In vivo treatment of rats with phenobarbital (PB) induces liver enzyme induction associated with hepatocyte hypertrophy. In the present study we used a novel microTMA technology coupled with artificial intelligence (AI) driven image analysis and proteomics analysis to test the hypothesis that PB treatment of rat and human liver microtissues could recapitulate hepatocyte hypertrophy in vitro. Human and rat liver microtissues were treated with PB over a range of concentrations (500 uM - 2000 uM). Fixed liver microtissues were embedded in paraffin in a microTMA mold, sectioned and stained on parallel microTMA sections with H&E and cell type specific markers, respectively. An AI algorithm was trained to identify and measure changes in hepatocyte cytoplasmic area on images of H&E stained microtissue sections. Image analysis with this algorithm showed that treatment of human and rat liver microtissues with PB (500 uM) for 96 h caused significant increases (p ≤ 0.08- p < 0.01) in hepatocyte cytoplasmic area, a hallmark of hypertrophy. Proteomics analysis of control and PB treated liver microtissue samples confirmed this treatment also caused phase1 and phase 2 enzyme induction in both human and rat samples. In conclusion AI driven image analysis of H&E stained liver microtissue FFPE sections shows that this model can recapitulate a PB-induced hypertrophy response.
Introduction
3D liver microtissues made from hepatocytes and non-parenchymal cells retain phenotypic characteristics of liver tissue such as RNA and protein expression (Messner et al., 2017; Järvinen et al., 2023). In addition, cellular interactions within 3D liver microtissues better recapitulate liver ADME functions than 2D in vitro models (Bell et al., 2018). When composed of human cells, these models provide a more human-relevant testing system than animal models and have the potential to advance drug development/safety assessment (Ramaiahgari et al., 2017).
In previous studies with human and rat liver microtissues, we identified species differences in uridine diphosphate glucuronosyl transferase (UGT) enzyme induction in response to phenobarbital (PB) treatment (Plummer et al., 2021). In the present study we tested the hypothesis that 3D liver microtissues made from human and rat primary cells could recapitulate the phenobarbital-induced hepatocyte hypertrophy response in vitro. We explored this hypothesis by using AI driven segmentation of H&E stained liver microtissue microTMA sections, guided by cell type specific immunostaining in parallel sections, to measure hepatocyte hypertrophy.
3D microtissues in whole mount pose a challenge for high throughput histological analysis due to issues such as lack of antibody penetration, fluorescent light scatter and fluorescence quenching (Kunz-Schughart et al., 2004; Reid et al., 2014). As the majority of microtissues do not possess a vascular system (Kelm et al., 2007), the standard size for microtissues is between 150-300 um in diameter to allow oxygen diffusion into cells (Glicklis et al., 2004). As their small size makes it challenging to make histological comparisons of multiple microtissues from one experiment, we developed a novel microTMA technology which facilitates analysis of all microtissues from a 96 well plate experiment simultaneously on one microscope slide thus avoiding intra-slide staining variability and batch effects. This microTMA technology organises microtissues from a 96 well plate experiment in a grid in the same plane, replicating the plate layout.This allows for the physical sectioning of all the microtissues simultaneously, producing parallel sections (Plummer et al., 2019a). Following H&E, IHC, or IF immunostaining, an image file is generated by a scanning microscope with a grid overlay. Automated image acquisition, annotation and processing of the microtissues can be performed on this file and incorporated into an image analysis algorithm.
Previous toxicity studies have revealed that drugs, including phenobarbital, result in increased liver weight, liver hypertrophy and increased cell proliferation in rodents reflecting hepatic enzyme induction, seen as smooth endoplasmic reticulum (SER) proliferation at the electron microscope level (Elcombe et al., 2014). This response may be adaptive or an indicator of carcinogenic potential (Elcombe et al., 2014; Hall et al., 2012; Amacher, 2010; Maronpot et al., 2010). As we had previously observed that hepatocyte enzyme induction occurs in both rat and human liver microtissues and this is a precursor for hepatocyte hypertrophy this supports the contention that these models are capable of mounting a response at this level. Certain drugs and xenobiotic agents induce cytochrome P450 enzymes (CYP) by the activation of nuclear receptors such as CAR, AhR, PXR, and PPARα (Mackowiak et al., 2018; Tolson and Wang, 2012). Activation of CAR and PXR has been linked to the induction of CYP2B and CYP3A enzymes (Elcombe et al., 2014). Phenobarbital (PB) has been found to be a CAR and PXR activator, and studies have shown that PB causes CAR activation in rodents that may lead to liver tumour formation (Elcombe et al., 2014; Maronpot et al., 2010). Cellular hypertrophy in the liver has been associated with PB-mediated enzyme induction and hepatocellular hypertrophy and enzyme induction is considered a key event in the mode of action (MOA) for CAR activated tumour formation in rodent livers (Boobis et al., 2006; Peffer et al., 2018).
In the present study we developed an artificial intelligence (AI) driven image analysis assay to identify hypertrophy associated with PB-mediated enzyme induction in liver microtissues. We tested an AI based algorithm on H&E stained sections of rat and human liver microtissues in which the algorithm differentiates hepatocytes and non-parenchymal cells based on morphological variations. AI algorithms have been shown to detect and characterise various cell types and quantify morphological and phenotypic features within microtissues (Kostadinova et al., 2024; Li et al., 2024). AI based approaches were previously developed to assess xenobiotic-induced hepatocellular hypertrophy in centrilobular regions of whole slide images of rat livers from in vivo studies (Pischon et al., 2021). These studies identified histological features of hypertrophy in liver tissue samples benchmarked by pathology review. As PB induced hepatocyte hypertrophy in vivo is localised in centrolubular hepatocytes (Pischon et al., 2021) and liver microtissues do not possess lobular structures we decided to use cell type specific markers rather than pathology review to underpin the identification of liver parenchymal (hepatocytes) and non-parenchymal (Kupffer, endothelial) cells by image analysis.
AI-based image analysis involves training an algorithm to identify histopathological features and requires the use of multiple images that encompass the range of morphological changes associated with a particular pathology (McGenity et al., 2024; Shafi and Parwani, 2023). As tissue microarrays (TMAs) provide an efficient way of collecting a large number of histology images, this approach adapted to microtissues is well-suited to AI-based approaches for histopathological analysis (Shamai et al., 2019).
We found that human and rat liver microtissues recapitulated a phenobarbital induced hepatocyte hypertrophy response in vitro and that this response was corroborated at the level of phase 1 and phase 2 enzyme induction. As liver enzyme induction and hepatocyte hypertrophy are key events in mode of action (MOA)-based risk assessment of liver carcinogenic potential caused by nuclear hormone receptor agonists (Meek et al., 2003) our findings offer a new approach to assess cross-species risk assessment to test for compounds demonstrating this activity.
Materials and methods
Liver microtissues
Human and rat liver microtissues each containing approximately 1,000 cells (manufactured by InSphero using a patented 3D select™ technology) consisted of species specific primary hepatocytes mixed with Kupffer cells and liver endothelial cells (InSphero white papers: https://insphero.com/science/publications/white-papers/). We chose to perform the study with rat and human liver 3D microtissues in order to utilise a model that had been shown previously to respond to nuclear hormone activators at the level of phase 1 and phase 2 enzyme induction in a manner more representative of the in vivo situation, when compared to 2D cultures of primary hepatocytes (Järvinen et al., 2023). Human primary hepatocytes in the liver 3D microtissues were derived from pooling primary hepatocytes from five male and five female donors. Rat liver 3D microtissues were made with primary hepatocytes, Kupffer cells and endothelial cells from Sprague Dawley rats. As the same cell types were included in the rat liver microtissues as in the human liver microtissues the models were comparable at the cellular level.
Liver microtissue treatments
InSphero rat liver 3D microtissues (primary hepatocytes, co-cultured with NPCs (InSphero #MT-02-00,104) and human liver microtissues (multi-donor primary hepatocytes, co-cultured with NPCs (InSphero #MT-02-302-04) were treated with a stock solution of 200 mM PB in fresh 3D Insight rat liver maintenance medium (InSphero #CS-07-002-01) and 3D Insight human liver maintenance medium-AF (InSphero #CS-07001a-01), respectively, to give final concentrations of 500 uM, 750 uM, 1,000 uM and 2000 uM according to previously published methods (Plummer et al., 2019a). The concentrations of PB were chosen based on previous studies examining phase 1 enzyme induction and proliferation in rat and human primary hepatocytes (Plant et al., 1998; Yamada et al., 2015). The choice of this liver 3D microtissue model was based on our previous investigations (Plummer et al., 2019a) which showed that the effects of PB on hepatocyte proliferation were consistent with published results from rat and human hepatocytes (Plant et al., 1998; Yamada et al., 2015); specifically, phase 1 and phase 2 enzyme induction was observed in both rat and human liver 3D microtissue hepatocytes, consistent with CAR activation, whilst in the rat liver 3D microtissue hepatocytes, there was also a significant dose-dependent increase in hepatocyte proliferation. This indicated that the liver 3D microtissue model responds to PB in a way that is consistent with the known species differences between rat and human, supporting the hypothesis that this model can be used to investigate species differences in CAR-mediated responses. Rat and human liver 3D microtissues,one spheroid per well in a 96 well gravity trap™ plate, were exposed to PB dissolved in rat or human liver maintenance medium, respectively, for 96 h and a total 4 x 96 well plates per species were used for the experiments. After treatment the liver microtissues were fixed in 4% paraformaldehyde [Pierce 16% paraformaldehyde (Thermo Fisher Scientific #28908) for 30 min at room temperature and then rinsed in PBS and either wax embedded in a microTMA mold prior to sectioning/H&E/histopathology analysis, or harvested for proteomics analysis using previously published methods (Kunz-Schughart et al., 2004). Experiments were performed at least twice on different batches of spheroids.
Liver microtissue cell viability
Cell viability was assessed by measuring cellular ATP levels that were measured in lysates of liver microtissues according to a previously published method (Plummer et al., 2019a).
Microtissue microarray (microTMA) fabrication, sectioning and H&E staining
A microTMA was constructed using a previously published method (Plummer et al., 2019b). Briefly, fixed spheroids (four to eight microtissues per treatment) were loaded into the wells of a 2% agarose mold containing 96 wells, maintaining the same orientation as used in the 96 well culture plate, and sealed using molten 0.7% agarose. The microTMA mold was dehydrated for a minimum of 12 h in 70% ethanol and the microTMA mold was processed to paraffin wax in a tissue processor (Thermo Citadel 1,000). Following wax embedding the microTMA block was sectioned (6 uM) using a microtome (Reichert Jung) onto glass microscope slides. Parallel sections of the liver 3D microtissue microTMAs were stained with H&E or immunohistochemistry (IHC), see below, to facilitate histopathological examination. H&E slides were imaged on a Zeiss Axioscan seven scanning microscope.
Immunochemical staining of liver 3D microtissues
In order to distinguish parenchymal (hepatocyte) and non-parenchymal endothelial cells and Kupffer cell types, in the liver microtissues we immunostained on parallel microTMA sections with cell type specific markers, HepPar1 or albumin, CD31 and CD68, respectively. HepPar1 is a marker for hepatocytes in normal rat liver (Youssef, 2018). MicroTMA slides were dewaxed in Histoclear, rehydrated through graded ethanols and then incubated in hydrogen peroxide block (ab64218) for 10 min at room temperature. Heat induced epitope retrieval (HIER) was performed using citrate buffer solution pH6 (Vector labs). Anti-HepPar1/albumin//CD31/CD68 single immunohistochemical (IHC) and CD68/CD31 dual IHC staining was performed as follows: After HIER, the slides were washed in phosphate buffered saline and for the single IHC stains the slides were incubated with opal antibody diluent block (ARD1001EA) for 10 min at room temperature. For the dual IHC the slides were incubated with Avidin blocking solution (2B Scientific, SP-2001) for 15 min at RT, rinsed with PBS, and then Biotin blocking solution (2BScientific, SP-2001) was added to the slides and incubated for 15 min at RT. The dual IHC slides were then rinsed twice in PBS for 2 min per wash and blocked with 5% normal horse serum (part of VECTASTAIN elite ABC HRP kit, 2B Scientific, PK-6200) for 20 min at RT. HepPar1 (BSB 5627), albumin (PA5-85166), CD31 (Aab32457), CD68 (ab31630) primary antibody at dilutions of 1:100, 1:100, 1:500 and 1:200 (diluted in normal horse serum and PBS), respectively, were added to the single/dual IHC slides and incubated at RT for 1 h. We also included a primary antibody negative control (Normal horse serum and PBS alone). After primary antibody incubations slides were washed in PBS for 5 min. For the HepPar1 single IHC stain an anti-mouse conjugated HRP secondary antibody (ab6823) at 1:500 dilution was added to the slide and incubated for 30 min at room temperature. For the albumin, CD31 and CD68 single IHC stains anti-rabbit (ab7171) or anti-mouse (ab6823) HRP secondary antibodies at 1:500 dilution were added to the slide and incubated for 30 min at room temperature. For the dual IHC (CD31/CD68) a biotinylated secondary antibody (mouse and rabbit) (part of VECTASTAIN elite ABC HRP kit 2B Scientific, PK-6200) diluted in normal horse serum, was added to the slides and incubated for 30 min at RT. The slides were then washed in PBS for 5 min. For the single IHC stains Vector DAB (sk-4105) was added to the slides. For the dual IHC VECTASTAIN ABC reagent (avidin and biotinylated horseradish peroxidase macromolecular complex) (part of VECTASTAIN elite ABC HRP kit 2B Scientific, PK-6200) was added to the slides and incubated for 30 min at RT. The single/dual IHC slides were washed in PBS twice for 3 min. The enzyme substrates Vector DAB (2B Scientific SK-4105) (HepPar 1, albumin, CD68) or Vector SG substrate (2B Scientific, SK-4700) (CD31) were added to the slides and incubated for times sufficient for stain development. The slides were rinsed in PBS for 5 min. The stained slides were counterstained with either haematoxylin (HepPar1, albumin) or Vector fast red solution (CD68, CD31) for 10 min at RT. The slides were rinsed in tap water for 10 s and then dehydrated through graded ethanol (95%–100%). The slides were cleared with Histoclear twice and then cover slipped with DPX mounting medium (Sigma, D6522). The IHC-stained slides were imaged using a Zeiss Axiovert 200M microscope.
AI driven image analysis of liver 3D microtissue histopathology
Hypertrophy in the liver 3D microtissues was assessed by training an AI algorithm to identify hepatocytes on images of H&E stained sections of the liver microtissues. This process was guided by cell type specific marker immunostaining of parallel sections. Individual H&E images of the liver microtissues from microTMA sections were uploaded to Zeiss Arivis Cloud image analysis software as single datasets per species. An instance (object-based) segmentation was performed on these images that enabled individual objects to be detected and segmented as separate instances of a class (e.g., nuclei, cytoplasm or background). This type of segmentation made it possible to define objects, which could also be touching or even overlapping. The training process involved annotating the uploaded H&E images by marking hepatocyte nuclei and secondly marking the boundaries of hepatocyte cell membranes in order to define the cytoplasm and calculate a cytoplasmic area. Lastly the operator marked areas of background. For each species the training process was conducted on a minimum of three H&E liver microtissue images containing approximately 100–150 human or rat hepatocytes, respectivley, from both the control and phenobarbital treated samples. Once the training and segmentation had completed the Arivis Cloud software outputted the results for each segmented cell which included the cytoplasmic areas. For validation of the AI image analysis, five rat and five human H&E stained liver microtissue images (150–200 hepatocytes) that had not been incorporated in the dataset for the AI training/segmentation were used. Guided by the IHC staining, we visually identified the hepatocytes and non-parenchymal cells and manually marked and counted the hepatocytes within these images. To calculate the sensitivity (recall), specificity and precision of the AI image analysis, the five rat and five human liver microtissue images were then uploaded to Arivis Cloud and processed with the AI algorithm and the segmentation results were compared to the marked images in which the hepatocytes were visually identified. When comparing these AI segmentation results to the manually marked images a true positive result was scored where the AI algorithm had correctly identified a cell as a hepatocyte and a false positive result was scored where the AI algorithm incorrectly identified a non-parenchymal cell as a hepatocyte. A true negative result was scored where the AI algorithm did not identify a non-parenchymal cell as a hepatocyte and a false negative result where the AI algorithm failed to identify a hepatocyte. Sensitivity (recall), specificity and precision were calculated by the following equations:
Sensitivity (recall) % = (true positives/true positives + false negatives) x 100.
Specificity % = (true negatives/true negatives + false positives) x 100.
Precision % = (true positives/true positives + false positives) x 100.
Statistical analysis of image analysis data
Statistical analysis of the image analysis data of hepatocyte cytoplasmic areas was performed with a Student’s t-test using Microsoft Excel software.
Proteomics analysis
Proteins from human and rat liver microtissues (23–30 spheroids/sample, four replicates per treatment) were extracted using the Qproteome FFPE Tissue kit (QIAGEN), TMT labelled, and analysed on a Fusion Orbitrap LC MS/MS mass spectrometer to generate raw data according to previously published methods (Plummer et al 2019a). We used 4 × 96 well plates of human and 4 × 96 well plates of rat liver microtissues for the proteomics analysis, of which 2 plates per species were controls and two were PB treated. Protein abundances were measured from the normalised TMT reporter ion intensities. Peptide mapping was performed using Thermo Proteome Discoverer software against global databases of human and rat proteins. The mass spectrometry proteomics data have been deposited to the ProteomeXchange Consortium via the PRIDE partner repository with the dataset accession number PXD056101.
Results
Liver microtissue cell viability
Cellular ATP content, an indicator of cell viability, showed that phenobarbital (PB) treatment of human liver microtissues did not cause a change in cellular ATP relative to vehicle control, Table 1, indicating that there was no acute toxicity caused by the PB treatments. In rat liver microtissues PB treatments appeared to cause a slight increase in cellular ATP content, Table 1. The reason for the increase is not known.

Table 1. ATP levels in the rat and human liver microtissues after phenobarbital (PB) 96 h treatments (500 uM, 750 uM, 1,000 uM and 2000 uM). Results are means ± standard deviation (SD), n = 2-4. N/D = not determined.
Immunostaining of liver microtissue non-parenchymal cells (NPCs)
Hepatocytes and non-parenchymal (endothelial and Kupffer) cells in the human and rat liver microtissues were identified on parallel microTMA sections by immunostaining with cell type specific markers, albumin/HepPar1, CD31 and CD68. The majority of the cells staining with albumin or HepPar1 (hepatocytes) were in the interior of the human and rat liver microtissues, respectively, Figures 1, 2. Endothelial cells were located mainly around the border of both human and rat microtissues and Kupffer cells were located mainly within the interior of the microtissues, Figures 1, 2.
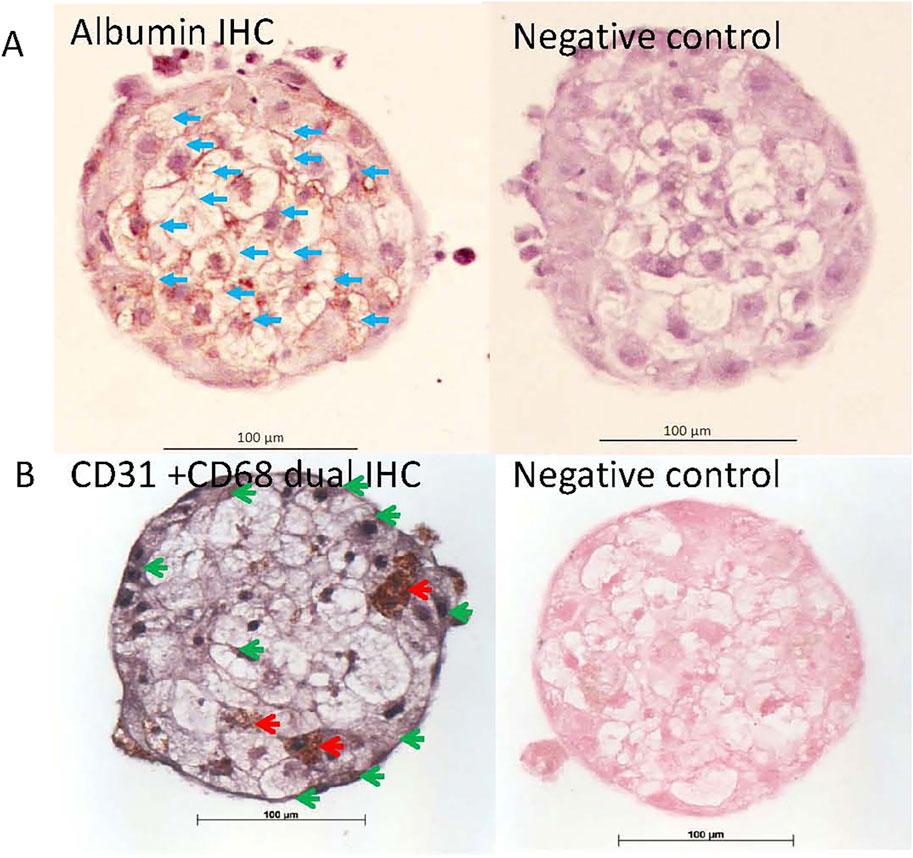
Figure 1. Albumin, CD31 and CD68 immunohistochemistry (IHC) staining of human liver microtissues. Parallel microTMA sections of human LiMTs were single IHC stained with albumin (DAB brown) or dual IHC stained for CD31(SG substrate - grey) and CD68 (DAB - brown) antibodies and counterstained with haematoxylin or fast red, respectively. (A) Top left panel shows albumin staining of hepatocytes a human liver microtissue section, blue arrows; (B) bottom left panel shows CD68 positive cells (Kupffer cells) and CD31 positive cells (endothelial cells) in a human liver microtissue section indicated with red and green arrows (respectively). Top and bottom right panels show the primary antibody negative controls.
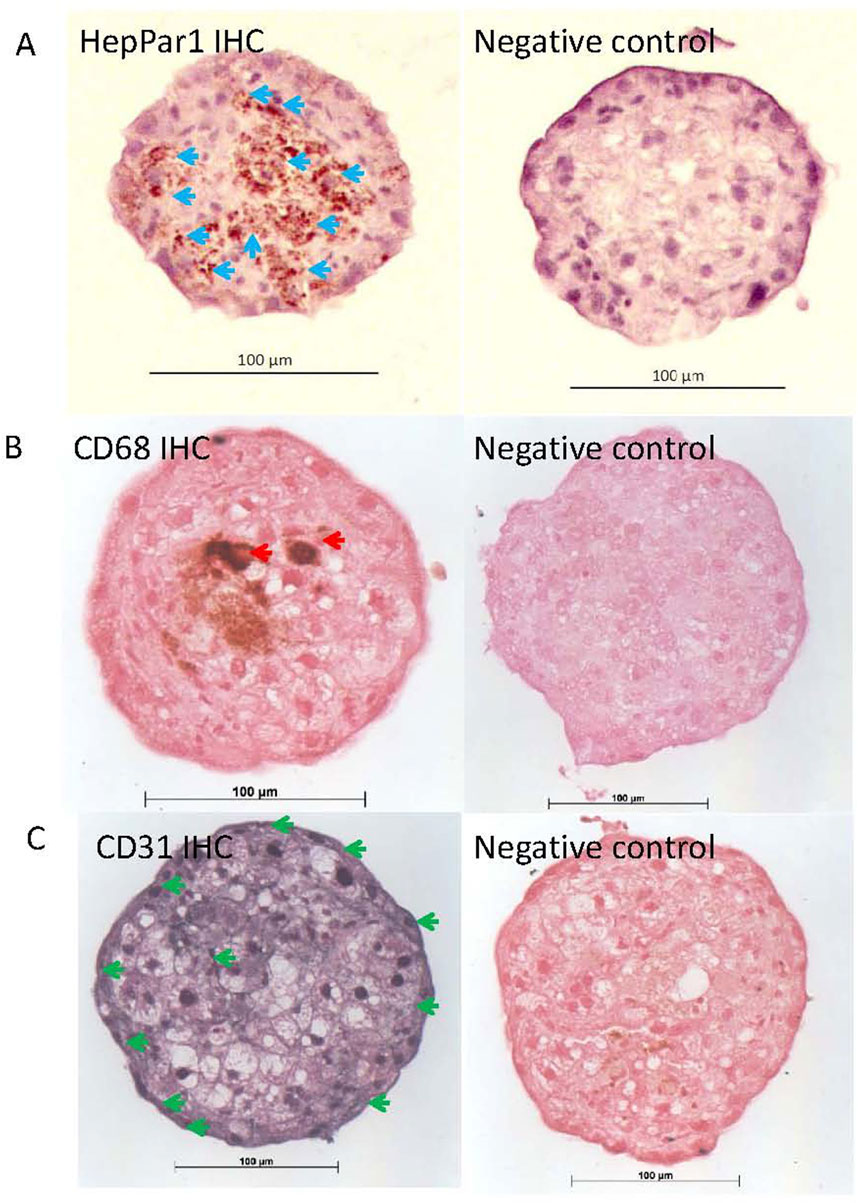
Figure 2. HepPar1, CD31 and CD68 immunohistochemistry (IHC) staining of rat liver microtissues. Parallel microTMA sections of rat LiMTs were single IHC stained with HepPar1 (DAB brown), CD68 (DAB - brown) or CD31(SG substrate - grey) antibodies and counterstained with either haematoxylin or fast red. (A) Top left panel shows HepPar1 staining of hepatocytes in rat liver microtissue section, blue arrows; (B) Middle left panel shows CD68 positive cells (Kupffer cells) indicated by red arrows; (C) bottom left panel shows CD31 positive cells (endothelial cells) in a rat liver microtissue section indicated with green arrows (respectively). Top, middle and bottom right panels show rat LiMT primary antibody negative controls.
AI driven image analysis
Validation of the AI image analysis showed that the sensitivity (recall), specificity and precision for identification of hepatocytes in the human liver microtissues were 81%, 95% and 99%, respectively, Table 2.

Table 2. Validation of AI Image Analysis. The table shows the sensitivity (recall), specificity and precision (%) of the AI image analysis of the rat and human liver microtissues.
Image analysis segmentation of H&E stained microTMA images from control and PB (500 - 2000 uM PB) treated human liver microtissues showed a significant (p ≤ 0.004) increase in the cytoplasm area (hypertrophy) of hepatocytes at the 500 uM PB treatment, Table 3 and Figure 3.
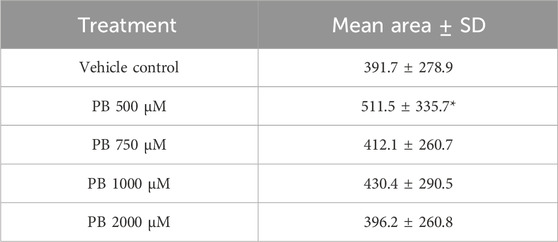
Table 3. Hepatocyte cytoplasm areas of control and phenobarbital (PB) treated human liver microtissues. Table shows mean cytoplasm areas of human liver microtissue hepatocytes ±standard deviation (SD) (n = 4 spheroids; 100 -130 cells per treatment); *significantly higher than control, p ≤ 0.004. Microtissues were treated with PB (500–2000 µM) for 96 h.
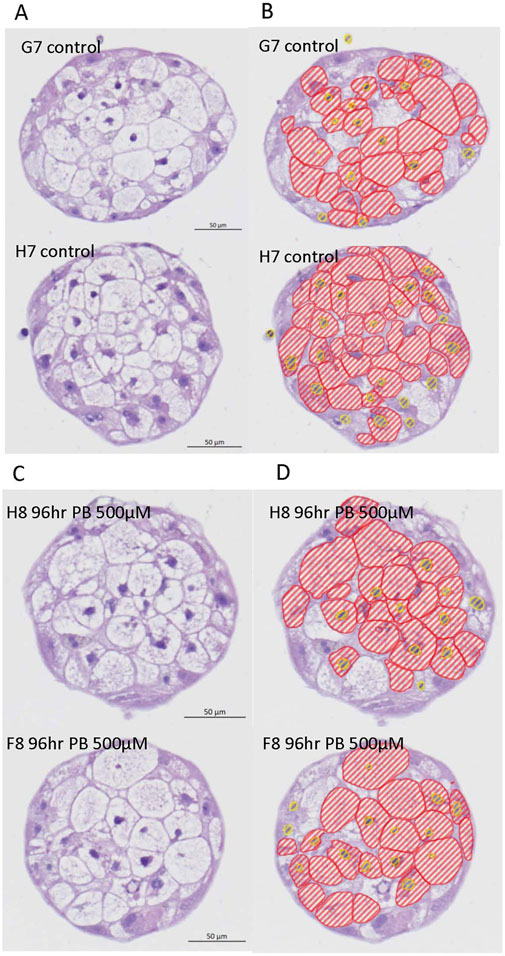
Figure 3. Representative H&E images and AI driven segmentation of control and phenobarbital treated human liver microtissues. (A) Top left panel: H&E images of control (vehicle) treated human liver microtissues; (B) Top right panel: AI segmentation of control human liver microtissue H&E images; (C) Bottom left panel: H&E images of phenobarbital (500 µM) treated human liver microtissues; (D) Bottom right panel: AI segmentation of phenobarbital (500 µM) treated human liver microtissues H&E images. Red lines show hepatocyte cytoplasm areas and yellow lines show hepatocyte nuclei.
Validation of the AI image analysis showed that the sensitivity (recall), specificity and precision for identification of hepatocytes in the rat liver microtissues were 90%, 72% and 92% respectively, Table 2.
Image analysis segmentation of H&E stained microTMA images from control and PB (500 - 2000 uM PB) treated rat liver microtissues showed an increase (approaching significance p ≤ 0.08) in the cytoplasm area (hypertrophy) of hepatocytes at the 500 uM PB treatment, Table 4 and Figure 4.
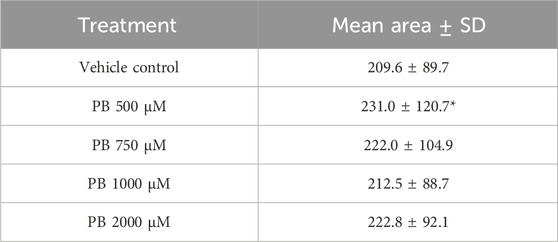
Table 4. Hepatocyte cytoplasm areas of control and phenobarbital (PB) treated rat liver microtissues. Table shows mean cytoplasm areas of rat liver microtissue hepatocytes ±standard deviation (SD) (n = 4 spheroids; spheroids per treatment); *approaching significance, p ≤ 0.08. Microtissues were treated with PB (500–2000 µM) for 96 h.
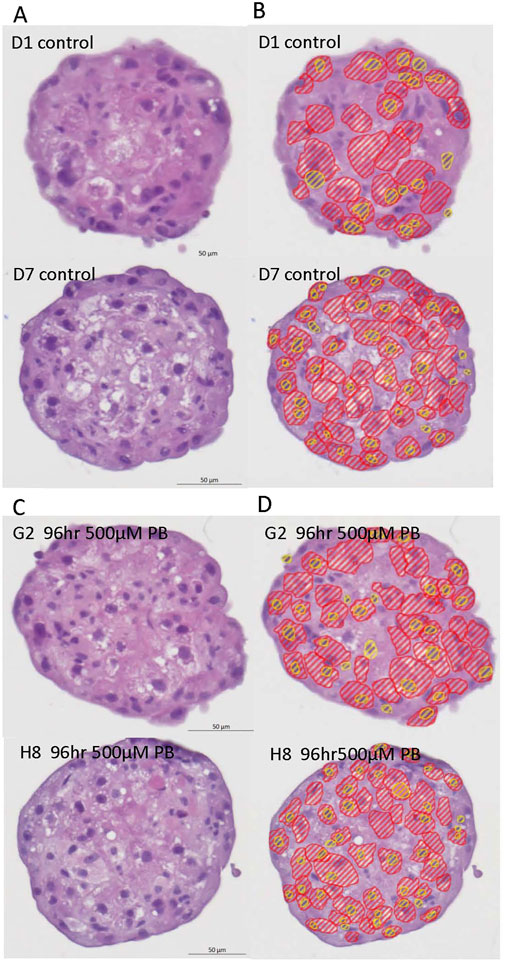
Figure 4. Representative H&E images and AI driven segmentation of control and phenobarbital treated rat liver microtissues. (A) Top left panel: H&E images of control (vehicle) rat liver microtissues; (B) Top right panel: AI segmentation of control rat liver microtissues H&E images; (C) Bottom left panel: H&E images of phenobarbital (500 µM) treated rat liver microtissues; (D) Bottom right panel: AI segmentation of phenobarbital (500 µM) treated rat liver microtissue H&E images. Red lines show hepatocyte cytoplasm areas, yellow lines show hepatocyte nuclei.
Proteomic analysis of enzyme induction in liver microtissues
As PB-induced hepatocyte hypertrophy is associated with enzyme induction and endoplasmic reticulum proliferation, we investigated whether hepatic phase 1 and phase 2 enzymes were induced by proteomic analysis of control and PB treated human and rat liver microtissues. Several phase 1 and phase 2 metabolic enzymes including cytochrome P450 2B6/2b2 were induced by PB treatment in human and rat liver microtissues, respectively, Table 5.
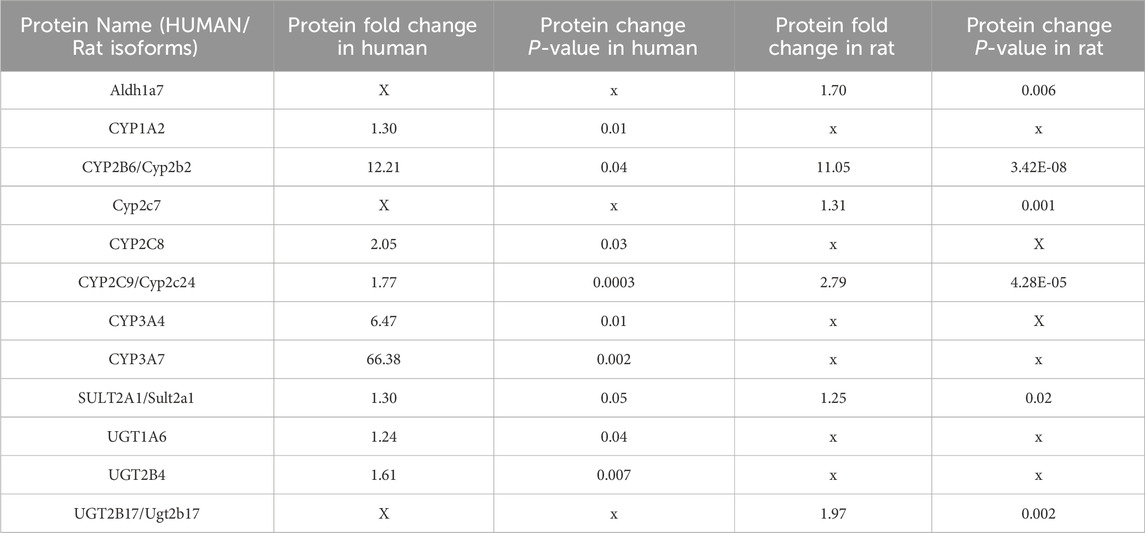
Table 5. Changes to protein levels relative to control caused by 96 h phenobarbital (PB) treatment of human and rat liver microtissues. The table shows proteomics data including fold change and corresponding P values for proteins that were significantly altered relative to control in the human and rat liver microtissues in response to PB treatment.
There were species differences in the induction of certain metabolic enzymes, for example, CYP3A7 was markedly induced by PB treatment in human liver microtissue but not in rat liver microtissues, and Ugt2b17 was induced in rat liver microtissues but not in human liver microtissues, Table 5.
Discussion
The present study of hepatocyte hypertrophy in phenobarbital treated (96 h) human and rat liver microtissues has shown that this response occurs at the 500 uM concentration.
The induction of hypertrophy in liver microtissues at 96 h is concurrent with induction of hepatic phase 1 and phase 2 enzymes measured by proteomics analysis which supports the hypothesis that hypertrophy is a consequence of ER proliferation. We have also previously examined fold changes to these genes in response to PB treatment at the RNA level (Plummer et al., 2019a) and the majority of these changes were not dose-dependent.
We also previously showed that a phenobarbital-induced hepatocyte proliferation response in rat, but not human, liver microtissues begins at 48 h (Plummer et al., 2019a). The induction of hypertrophy at a later time (96 h) than the proliferation response is consistent with in vivo studies which show that a phenobarbital induced hypertrophy response occurs after a transient hepatocyte proliferation response (Maronpot et al., 2010; Pischon et al., 2021).
The reason for the lack of dose-dependency of the hypertrophy response in both human and rat liver microtissues in the present study is not known. It is not possible to assess whether or not this lack of dose-dependency is also consistent with an in vivo response as the previous quantitative image analysis studies of phenobarbital-induced hypertrophy of rat liver were performed only at one dose level (Pischon et al., 2021).
Hepatocyte hypertrophy and hepatic enzyme induction are key events in Bradford-Hill-based mode of action (MOA) safety studies used for performing mechanistic risk assessment of liver carcinogenesis (Boobis et al., 2006; Peffer et al., 2018). We have demonstrated that these key events can be recapitulated in human and rat liver microtissues suggesting a key role for liver microtissue models in human risk assessment in rat/non human safety studies.
A challenge to performing MOA-based risk assessment is the ability to directly incorporate human relevance assessment in the studies.The use of liver microtissues that incorporate primary human and rat species specific parenchymal and non-parenchymal cells in a physiologically relevant model enables in vitro translation of these mechanistic end points across species. This facilitates a more human relevant risk assessment and can also add weight of evidence for non-human relevance arguments.
The broader value of our study is the development of an efficient AI-based method for measuring a key event in the MOA scheme to define nuclear receptor hormone activation across species which could be applied prospectively using human-relevant microtissue models for enabling early compound development pipeline choices to be made. Our results suggest that this approach could be used to detect a hypertrophy response in liver microtissues exposed to other compounds that possess a CAR-mediated phase1/2 enzyme induction activity.
This approach also aligns with the principles of NAMS (New Approach Methodologies) by addressing human relevance through the use of non-animal models.
In conclusion, we have developed an AI-based assay for measurement of hepatocyte hypertrophy in liver microtissues which could be used to assess this end point across species by recapitulating this key event for the purposes of risk assessment.
Data availability statement
The mass spectrometry proteomics data have been deposited to the ProteomeXchange Consortium via the PRIDE partner repository, accession number PXD056101. Available at: https://proteomecentral.proteomexchange.org/cgi/GetDataset?ID=PXD056101.
Ethics statement
Ethical approval was not required for the studies on humans in accordance with the local legislation and institutional requirements because only commercially available established cell lines were used.
Author contributions
ME: Data curation, Formal Analysis, Investigation, Methodology, Writing–original draft. AM: Data curation, Formal Analysis, Investigation, Methodology, Writing–original draft. SW: Formal Analysis, Investigation, Methodology, Writing–review and editing. JW: Investigation, Methodology, Validation, Writing–review and editing. SP: Conceptualization, Data curation, Formal Analysis, Funding acquisition, Investigation, Methodology, Project administration, Resources, Supervision, Validation, Writing–original draft, Writing–review and editing.
Funding
The author(s) declare that no financial support was received for the research, authorship, and/or publication of this article.
Acknowledgments
We are very grateful to Zeiss United Kingdom for providing training and access to Zeiss arivis cloud software and Graeme Ball (Dundee University Microscopy Facility) for help and advice on technical aspects of the image analysis. We are also very grateful to Ruth Plummer for editorial assistance on the manuscript.
Conflict of interest
Authors ME, AM, SW, JW, and SP were employed by MicroMatrices Associates Ltd.
Publisher’s note
All claims expressed in this article are solely those of the authors and do not necessarily represent those of their affiliated organizations, or those of the publisher, the editors and the reviewers. Any product that may be evaluated in this article, or claim that may be made by its manufacturer, is not guaranteed or endorsed by the publisher.
References
Amacher, D. E. (2010). The effects of cytochrome P450 induction by xenobiotics on endobiotic metabolism in pre-clinical safety studies. Toxicol. Mech. Methods 20 (4), 159–166. doi:10.3109/15376511003690307
Bell, C. C., Dankers, A. C. A., Lauschke, V. M., Sison-Young, R., Jenkins, R., Rowe, C., et al. (2018). Comparison of hepatic 2D sandwich cultures and 3D spheroids for long-term toxicity applications: a multicenter study. Toxicol. Sci. official J. Soc. Toxicol. 162 (2), 655–666. doi:10.1093/toxsci/kfx289
Boobis, A. R., Cohen, S.-D. V., Dellarco, V.-M. G. D., McGregor, D.-M. M. E. B., Meek, M.-V. C., Vickers, C.-W. D., et al. (2006). IPCS framework for analyzing the relevance of a cancer mode of action for humans, 1040–8444.
Elcombe, C. R., Peffer, R., Wolf, D. C., Wolf, D.-B. J., Bailey, J., Bars, R., et al. (2014). Mode of action and human relevance analysis for nuclear receptor-mediated liver toxicity: a case study with phenobarbital as a model constitutive androstane receptor (CAR) activator, 1547–6898.
Glicklis, R., Merchuk, J., Cohen, S., and Cohen, S. (2004). “Modeling mass transfer in hepatocyte spheroids via cell viability,” in Spheroid size, and hepatocellular functions.
Hall, A. P., Elcombe, C.-F. J. R., Foster, J.-H. T., Harada, T.-K. W., Kaufmann, W.-K. A., Knippel, A.-K. K., et al. (2012). Liver hypertrophy: a review of adaptive (adverse and non-adverse) changes--conclusions from the 3rd International ESTP Expert Workshop, 1533–1601.
Järvinen, E., Hammer, H. S., Pötz, O., Ingelman-Sundberg, M., and Stage, T. B. (2023). 3D spheroid primary human hepatocytes for prediction of cytochrome P450 and drug transporter induction. Clin. Pharmacol. Ther. 113 (6), 1284–1294. doi:10.1002/cpt.2887
Kelm, J. M., Moritz, W., Schmidt, D., Schmidt, D.-H. S. P., Hoerstrup, S., Fussenegger, M., et al. (2007). In vitro vascularization of human connective microtissues, 1543–1894.
Kostadinova, R., Ströbel, S., Chen, L., Fiaschetti-Egli, K., Gadient, J., Pawlowska, A., et al. (2024). Digital pathology with artificial intelligence analysis provides insight to the efficacy of anti-fibrotic compounds in human 3D MASH model. Sci. Rep. 14 (1), 5885. doi:10.1038/s41598-024-55438-2
Kunz-Schughart, L. A., Freyer, J.-H. F., Hofstaedter, F.-E. R., and Ebner, R. (2004). The use of 3-D cultures for high-throughput screening: the multicellular spheroid model, 1087–0571.
Li, H., Seada, H., Madnick, S., Zhao, H., Chen, Z., Li, F., et al. (2024). Machine learning-assisted high-content imaging analysis of 3D MCF7 microtissues for estrogenic effect prediction. Sci. Rep. 14 (1), 2999. doi:10.1038/s41598-024-53323-6
Mackowiak, B., Hodge, J., Stern, S., and Wang, H. (2018). The roles of xenobiotic receptors: beyond chemical disposition, 1521–009X.
Maronpot, R. R., Yoshizawa, K.-N. A., Nyska, A., Harada, T., Harada, T.-F. G., Flake, G.-M. G., et al. (2010). Hepatic enzyme induction. histopathology, 1533–1601. doi:10.1177/0192623310373778
McGenity, C., Clarke, E. L., Jennings, C., Matthews, G., Cartlidge, C., Freduah-Agyemang, H., et al. (2024). Artificial intelligence in digital pathology: a systematic review and meta-analysis of diagnostic test accuracy. npj Digit. Med. 7 (1), 114. doi:10.1038/s41746-024-01106-8
Meek, M. E.-B. J.-C. S.-D. V., Longfellow, D.-P. T., and Seed, J.-P. D. E. (2003). A framework for human relevance analysis of information on carcinogenic modes of action, 1040–8444.
Messner, S., Fredriksson, L., Lauschke, V. M., Roessger, K., Escher, C., Bober, M., et al. (2017). Transcriptomic, proteomic, and functional long-term characterization of multicellular three-dimensional human liver microtissues. Appl. Vitro Toxicol. 4 (1), 1–12. doi:10.1089/aivt.2017.0022
Peffer, R. C., Moggs, J.-P., T - Currie, R.-W., and F - Rusyn, I. (2018). Mouse liver effects of cyproconazole, a triazole fungicide: role of the constitutive androstane receptor, 1096–6080.
Pischon, H., Mason, D., Lawrenz, B., Blanck, O., Frisk, A. L., Schorsch, F., et al. (2021). Artificial intelligence in toxicologic pathology: quantitative evaluation of compound-induced hepatocellular hypertrophy in rats, 1533–1601.
Plant, N. J., Horley, N. J., Dickins, M., Hasmall, S., Elcombe, C. R., and Bell, D. R. (1998). The coordinate regulation of DNA synthesis and suppression of apoptosis is differentially regulated by the liver growth agents, phenobarbital and methylclofenapate. Carcinogenesis 19 (9), 1521–1527. doi:10.1093/carcin/19.9.1521
Plummer, S., Beaumont, B., Elcombe, M., Wallace, S., Wright, J., McInnes, E. F., et al. (2021). Species differences in phenobarbital-mediated UGT gene induction in rat and human liver microtissues, 2214–7500.
Plummer, S., Beaumont, B., Wallace, S., Ball, G., Wright, J., McInnes, L., et al. (2019a). Cross-species comparison of CAR-mediated procarcinogenic key events in a 3D liver microtissue model, 2214–7500.
Plummer, S., Wallace, S., Ball, G., Lloyd, R., Schiapparelli, P., Quiñones-Hinojosa, A., et al. (2019b). A Human iPSC-derived 3D platform using primary brain cancer cells to study drug development and personalized medicine. Sci. Rep. 9 (1), 1407. doi:10.1038/s41598-018-38130-0
Ramaiahgari, S. C., Waidyanatha, S., Dixon, D., DeVito, M. J., Paules, R. S., and Ferguson, S. S. (2017). From the cover: three-dimensional (3D) HepaRG spheroid model with physiologically relevant xenobiotic metabolism competence and hepatocyte functionality for liver toxicity screening. Toxicol. Sci. official J. Soc. Toxicol. 159 (1), 124–136. doi:10.1093/toxsci/kfx122
Reid, B. G., Jerjian, T., Patel, P., Zhou, Q., Yoo, B. H., Kabos, P., et al. (2014). Live multicellular tumor spheroid models for high-content imaging and screening in cancer drug discovery, 2213–9885.
Shamai, G., Binenbaum, Y., Slossberg, R., Duek, I., Gil, Z., and Kimmel, R. (2019). Artificial intelligence algorithms to assess hormonal status from tissue microarrays in patients with breast cancer, 2574–3805.
Tolson, A. H., and Wang, H. (2012). Regulation of drug-metabolizing enzymes by xenobiotic receptors: PXR and CAR, 1872–8294.
Yamada, T., Kikumoto, H., Lake, B. G., and Kawamura, S. (2015). Lack of effect of metofluthrin and sodium phenobarbital on replicative DNA synthesis and Ki-67 mRNA expression in cultured human hepatocytes. Toxicol. Res. 4 (4), 901–913. doi:10.1039/c4tx00217b
Keywords: artificial intelligence, image analysis, hypertrophy, liver microtissue, hepatocyte
Citation: Elcombe M, Mathur A, Wallace S, Wright J and Plummer S (2024) Artificial intelligence driven image analysis identifies phenobarbital induced hepatocyte hypertrophy in liver microtissues across species. Front. Drug Discov. 4:1472522. doi: 10.3389/fddsv.2024.1472522
Received: 29 July 2024; Accepted: 16 September 2024;
Published: 02 October 2024.
Edited by:
Ali Kermanizadeh, University of Derby, United KingdomReviewed by:
Stephen Ferguson, National Institute of Environmental Health Sciences (NIH), United StatesRodolpho C. Braga, InsilicAll, Brazil
Copyright © 2024 Elcombe, Mathur, Wallace, Wright and Plummer. This is an open-access article distributed under the terms of the Creative Commons Attribution License (CC BY). The use, distribution or reproduction in other forums is permitted, provided the original author(s) and the copyright owner(s) are credited and that the original publication in this journal is cited, in accordance with accepted academic practice. No use, distribution or reproduction is permitted which does not comply with these terms.
*Correspondence: Simon Plummer, c2ltb25wbHVtbWVyQG1pY3JvbWF0cmljZXMuY29t
†These authors have contributed equally to this work
 Matthew Elcombe
 Ayesha Mathur
 Stephanie Wallace
 Jayne Wright
 Simon Plummer